Potassium-mediated bacterial chemotactic response
Curation statements for this article:-
Curated by eLife

eLife assessment
In this important study, the authors report a novel measurement of the Escherichia coli chemotactic response and demonstrate that these bacteria display an attractant response to potassium, which is connected to intracellular pH level. The experimental evidence provided is convincing and the work will be of interest to microbiologists studying chemotaxis.
This article has been Reviewed by the following groups
Discuss this preprint
Start a discussion What are Sciety discussions?Listed in
- Evaluated articles (eLife)
Abstract
Bacteria in biofilms secrete potassium ions to attract free swimming cells. However, the basis of chemotaxis to potassium remains poorly understood. Here, using a microfluidic device, we found that Escherichia coli can rapidly accumulate in regions of high potassium concentration on the order of millimoles. Using a bead assay, we measured the dynamic response of individual flagellar motors to stepwise changes in potassium concentration, finding that the response resulted from the chemotaxis signaling pathway. To characterize the chemotactic response to potassium, we measured the dose–response curve and adaptation kinetics via an Förster resonance energy transfer (FRET) assay, finding that the chemotaxis pathway exhibited a sensitive response and fast adaptation to potassium. We further found that the two major chemoreceptors Tar and Tsr respond differently to potassium. Tar receptors exhibit a biphasic response, whereas Tsr receptors respond to potassium as an attractant. These different responses were consistent with the responses of the two receptors to intracellular pH changes. The sensitive response and fast adaptation allow bacteria to sense and localize small changes in potassium concentration. The differential responses of Tar and Tsr receptors to potassium suggest that cells at different growth stages respond differently to potassium and may have different requirements for potassium.
Article activity feed
-

-
-
-

Author response:
The following is the authors’ response to the previous reviews.
eLife assessment
In this important study, the authors report a novel measurement of the Escherichia coli chemotactic response and demonstrate that these bacteria display an attractant response to potassium, which is connected to intracellular pH level. Whilst the experiments are mostly convincing, there are some confounders regards pH changes and fluorescent proteins that remain to be addressed.
Public Reviews:
Reviewer #1 (Public Review):
Summary:
This paper shows that E. coli exhibits a chemotactic response to potassium by measuring both the motor response (using a bead assay) and the intracellular signaling response (CheY phosporylation level via FRET) to step changes in potassium concentration. They find increase in potassium concentration …
Author response:
The following is the authors’ response to the previous reviews.
eLife assessment
In this important study, the authors report a novel measurement of the Escherichia coli chemotactic response and demonstrate that these bacteria display an attractant response to potassium, which is connected to intracellular pH level. Whilst the experiments are mostly convincing, there are some confounders regards pH changes and fluorescent proteins that remain to be addressed.
Public Reviews:
Reviewer #1 (Public Review):
Summary:
This paper shows that E. coli exhibits a chemotactic response to potassium by measuring both the motor response (using a bead assay) and the intracellular signaling response (CheY phosporylation level via FRET) to step changes in potassium concentration. They find increase in potassium concentration induces a considerable attractant response, with amplitude comparable to aspartate, and cells can quickly adapt (and generally over-adapt). The authors propose that the mechanism for potassium response is through modifying intracellular pH; they find both that potassium modifies pH and other pH modifiers induce similar attractant responses. It is also shown, using Tar- and Tsr-only mutants, that these two chemoreceptors respond to potassium differently. Tsr has a standard attractant response, while Tar has a biphasic response (repellent-like then attractant-like). Finally, the authors use computer simulations to study the swimming response of cells to a periodic potassium signal secreted from a biofilm and find a phase delay that depends on the period of oscillation.
Strengths:
The finding that E. coli can sense and adapt to potassium signals and the connection to intracellular pH is quite interesting and this work should stimulate future experimental and theoretical studies regarding the microscopic mechanisms governing this response. The evidence (from both the bead assay and FRET) that potassium induces an attractant response is convincing, as is the proposed mechanism involving modification of intracellular pH. The updated manuscript controls for the impact of pH on the fluorescent protein brightness that can bias the measured FRET signal. After correction the response amplitude and sharpness (hill coefficient) are comparable to conventional chemoattractants (e.g. aspartate), indicating the general mechanisms underlying the response may be similar. The authors suggest that the biphasic response of Tar mutants may be due to pH influencing the activity of other enzymes (CheA, CheR or CheB), which will be an interesting direction for future study.
Weaknesses:
The measured response may be biased by adaptation, especially for weak potassium signals. For other attractant stimuli, the response typically shows a low plateau before it recovers (adapts). In the case of potassium, the FRET signal does not have an obvious plateau following the stimuli of small potassium concentrations, perhaps due to the faster adaptation compared to other chemoattractants. It is possible cells have already partially adapted when the response reaches its minimum, so the measured response may be a slight underestimate of the true response. Mutants without adaptation enzymes appear to be sensitive to potassium only at much larger concentrations, where the pH significantly disrupts the FRET signal; more accurate measurements would require development of new mutants and/or measurement techniques.
We acknowledge and appreciate the reviewer's concerns regarding the potential impact of adaptation on the measured response magnitude. We have estimated the effect of adaptation on the measured response magnitude. The half-time of adaptation at 30 mM KCl was measured to be approximately 80 s, corresponding to a time constant of t = 80/ln(2) = 115.4 s, which is significantly longer than the time required for medium exchange in the flow chamber (less than 10 s). Consequently, the relative effect of adaptation on the measured response magnitude should be less than 1-exp(-10/t) = 8.3%. Even for the fastest adaptation (at the lowest KCl concentration) we measured, the effect should be less than 20%, which is within experimental uncertainties. Nevertheless, we agree that developing new techniques to measure the dose-response curve more precisely would be beneficial.
Reviewer #2 (Public Review):
Zhang et al investigated the biophysical mechanism of potassium-mediated chemotactic behavior in E coli. Previously, it was reported by Humphries et al that the potassium waves from oscillating B subtilis biofilm attract P aeruginosa through chemotactic behavior of motile P aeruginosa cells. It was proposed that K+ waves alter PMF of P aeruginosa. However, the mechanism was this behaviour was not elusive. In this study, Zhang et al demonstrated that motile E coli cells accumulate in regions of high potassium levels. They found that this behavior is likely resulting from the chemotaxis signalling pathway, mediated by an elevation of intracellular pH. Overall, a solid body of evidence is provided to support the claims. However, the impacts of pH on the fluorescence proteins need to be better evaluated. In its current form, the evidence is insufficient to say that the fluoresce intensity ratio results from FRET. It may well be an artefact of pH change.
The authors now carefully evaluated the impact of pH on their FRET sensor by examining the YFP and CFP fluorescence with no-receptor mutant. The authors used this data to correct the impact of pH on their FRET sensor. This is an improvement, but the mathematical operation of this correction needs clarification. This is particularly important because, looking at the data, it is not fully convincing if the correction was done properly. For instance, 3mM KCl gives 0.98 FRET signal both in Fig3 and FigS4, but there is almost no difference between blue and red lines in Fig 3. FigS4 is very informative, but it does not address the concern raised by both reviewers that FRET reporter may not be a reliable tool here due to pH change.
We apologize for not making the correction process clear. We corrected the impact of pH on the original signals for both CFP and YFP channels by

where
 and
and  represent the pH-corrected and original PMT signal (CFP or YFP channel) from the moment of addition of L mM KCl to the moment of its removal, respectively, and is the correction factor, which is the ratio of PMT signal post- to pre-KCl addition for the no-receptor mutant at L mM KCl, for CFP or YFP channel as shown Fig. S5. The pH-corrected FRET response is then calculated as the ratio of the pH-corrected YFP to the pH-corrected CFP signals, normalized by the pre-stimulus ratio.
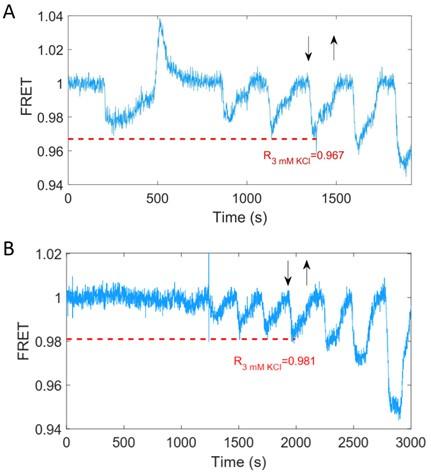
As shown in Author response image1, which represents the same data as Fig. 3A and Fig. S5A, the original normalized FRET responses to 3 mM KCl are 0.967 for the wild-type strain (Fig. 3) and 0.981 for the no-receptor strain (Fig. S5). The standard deviation of the FRET values under steady-state conditions is 0.003. Thus, the difference in responses between the wild-type and no-receptor strains is significant and clearly exceeds the standard deviation. The pH correction factors CpH at 3 mM KCl are 1.004 for the YFP signal and 1.016 for the CFP signal. Consequently, the pH-corrected FRET responses are 0.967´1.016/1.004=0.979 for the wild-type and 0.981´1.016/1.004=0.993 for the no-receptor strain. The reason the pH-corrected FRET response for the no-receptor strain is 0.993 instead of the expected 1.000 is that this value represents the lowest observed response rather than the average value for the FRET response.
The detailed mathematical operation for correcting the pH impact has now been included in the “FRET assay” section of Materials and Methods.
Author response image 1.
Chemotactic response of the wild-type strain (A, HCB1288-pVS88) and the no-receptor strain (B, HCB1414-pVS88) to stepwise addition and removal of KCl. The blue solid line denotes the original normalized signal. Downward and upward arrows indicate the time points of addition and removal of 3 mM KCl, respectively. The horizontal red dashed line denotes the original normalized FRET response value to 3 mM KCl.
The authors show the FRET data with both KCl and K2SO4, concluding that the chemotactic response mainly resulted from potassium ions. However, this was only measured by FRET. It would be more convincing if the motility assay in Fig1 is also performed with K2SO4. The authors did not address this point. In light of complications associated with the use of the FRET sensor, this experiment is more important.
We thank the reviewer for the suggestion. We agree that additional confirmation with a motility assay is important. To address this, we have now measured the response of the motor rotational signal to 15 mM K2SO4 using the bead assay and compared it with the response to 30 mM KCl. The results are shown in Fig. S2. The response of motor CW bias to 15 mM K2SO4 exhibited an attractant response, characterized by a decreased CW bias upon the addition of K2SO4, followed by an over-adaptation that is qualitatively similar to the response to 30 mM KCl. However, there were notable differences in the adaptation time and the presence of an overshoot. Specifically, the adaptation time to K2SO4 was shorter compared to that for KCl, and there was a notable overshoot in the CW bias during the adaptation phase. These differences may have resulted from the weaker response to K2SO4 (Fig. S1B) and additional modifications due to CysZ-mediated cellular uptake of sulfate (Zhang et al., Biochimica et Biophysica Acta 1838,1809–1816 (2014)). The faster adaptation and overshoot complicated the chemotactic drift in the microfluidic assay as in Fig. 1, such that we were unable to observe a noticeable drift in a K2SO4 gradient under the same experimental conditions used for the KCl gradient.
The response of motor rotational signal to 15 mM K2SO4 has been added to Fig. S2.
Recommendations for the authors:
Reviewer #1 (Recommendations For The Authors):
(1) The response curve and adaptation level/time in the main text (Fig. 4) should be replaced by the corrected counterparts (currently in Fig. S5). The current version is especially confusing because Fig. 6 shows the corrected response, but the difference from Fig. 4 is not mentioned.
We thank the reviewer for the suggestion. We have now merged the results of the original Fig. S5 into Fig. 4.
a. The discussion of the uncorrected response with small hill coefficient and potentially negative cooperativity was left in the text (lines 223-234), but the new measurements show this is not true for the actual response. This should be removed or significantly rephrased.
We thank the reviewer for the suggestion. We have now removed the statement about potentially negative cooperativity and added the corrected results for the actual response.
(2) It may be helpful to restate the definition of f_m in the methods (near Eq. 3-4).
Thank you for the suggestion. We have now restated the definition of fm and fL below Eq. 3-4: “In the denominator on the right-hand side of Eq. 3, the two terms within the parentheses of exponential expression represent the methylation-dependent (fm) and ligand-dependent (fL) free energy, respectively.”
-
eLife assessment
In this important study, the authors report a novel measurement of the Escherichia coli chemotactic response and demonstrate that these bacteria display an attractant response to potassium, which is connected to intracellular pH level. The experimental evidence provided is convincing and the work will be of interest to microbiologists studying chemotaxis.
-
Reviewer #1 (Public Review):
Summary:
This paper shows that E. coli exhibits a chemotactic response to potassium by measuring both the motor response (using a bead assay) and the intracellular signaling response (CheY phosporylation level via FRET) to step changes in potassium concentration. They find increase in potassium concentration induces a considerable attractant response, with amplitude comparable to aspartate, and cells can quickly adapt (and generally over-adapt). The authors propose that the mechanism for potassium response is through modifying intracellular pH; they find both that potassium modifies pH and other pH modifiers induce similar attractant responses. It is also shown, using Tar- and Tsr-only mutants, that these two chemoreceptors respond to potassium differently. Tsr has a standard attractant response, while Tar …
Reviewer #1 (Public Review):
Summary:
This paper shows that E. coli exhibits a chemotactic response to potassium by measuring both the motor response (using a bead assay) and the intracellular signaling response (CheY phosporylation level via FRET) to step changes in potassium concentration. They find increase in potassium concentration induces a considerable attractant response, with amplitude comparable to aspartate, and cells can quickly adapt (and generally over-adapt). The authors propose that the mechanism for potassium response is through modifying intracellular pH; they find both that potassium modifies pH and other pH modifiers induce similar attractant responses. It is also shown, using Tar- and Tsr-only mutants, that these two chemoreceptors respond to potassium differently. Tsr has a standard attractant response, while Tar has a biphasic response (repellent-like then attractant-like). Finally, the authors use computer simulations to study the swimming response of cells to a periodic potassium signal secreted from a biofilm and find a phase delay that depends on the period of oscillation.
Strengths:
The finding that E. coli can sense and adapt to potassium signals and the connection to intracellular pH is quite interesting and this work should stimulate future experimental and theoretical studies regarding the microscopic mechanisms governing this response. The evidence (from both the bead assay and FRET) that potassium induces an attractant response is convincing, as is the proposed mechanism involving modification of intracellular pH. The updated manuscript controls for the impact of pH on the fluorescent protein brightness that can bias the measured FRET signal. After correction the response amplitude and sharpness (hill coefficient) are comparable to conventional chemoattractants (e.g. aspartate), indicating the general mechanisms underlying the response may be similar. The authors suggest that the biphasic response of Tar mutants may be due to pH influencing the activity of other enzymes (CheA, CheR or CheB), which will be an interesting direction for future study.
Weaknesses:
The measured response may be biased by adaptation, especially for weak potassium signals. For other attractant stimuli, the response typically shows a low plateau before it recovers (adapts). In the case of potassium, the FRET signal does not have an obvious plateau following the stimuli of small potassium concentrations, perhaps due to the faster adaptation compared to other chemoattractants. It is possible cells have already partially adapted when the response reaches its minimum, so the measured response may be a slight underestimate of the true response. Mutants without adaptation enzymes appear to be sensitive to potassium only at much larger concentrations, where the pH significantly disrupts the FRET signal; more accurate measurements would require the development of new mutants and/or measurement techniques.
Note added after the second revision: The authors made a reasonable argument regarding the effects of adaptation, which were estimated to be small.
-
-
Author Response
The following is the authors’ response to the original reviews.
eLife assessment
This important study reports a novel measurement for the chemotactic response to potassium by Escherichia coli. The authors convincingly demonstrate that these bacteria exhibit an attractant response to potassium and connect this to changes in intracellular pH level. However, some experimental results are incomplete, with additional controls/alternate measurements required to support the conclusions. The work will be of interest to those studying bacterial signalling and response to environmental cues.
Public Reviews:
Reviewer #1 (Public Review):
Summary:
This paper shows that E. coli exhibits a chemotactic response to potassium by measuring both the motor response (using a bead assay) and the intracellular signaling response …
Author Response
The following is the authors’ response to the original reviews.
eLife assessment
This important study reports a novel measurement for the chemotactic response to potassium by Escherichia coli. The authors convincingly demonstrate that these bacteria exhibit an attractant response to potassium and connect this to changes in intracellular pH level. However, some experimental results are incomplete, with additional controls/alternate measurements required to support the conclusions. The work will be of interest to those studying bacterial signalling and response to environmental cues.
Public Reviews:
Reviewer #1 (Public Review):
Summary:
This paper shows that E. coli exhibits a chemotactic response to potassium by measuring both the motor response (using a bead assay) and the intracellular signaling response (CheY phosporylation level via FRET) to step changes in potassium concentration. They find increase in potassium concentration induces a considerable attractant response, with an amplitude larger than aspartate, and cells can quickly adapt (but possibly imperfectly). The authors propose that the mechanism for potassium response is through modifying intracellular pH; they find both that potassium modifies pH and other pH modifiers induce similar attractant responses. It is also shown, using Tar- and Tsr-only mutants, that these two chemoreceptors respond to potassium differently. Tsr has a standard attractant response, while Tar has a biphasic response (repellent-like then attractant-like). Finally, the authors use computer simulations to study the swimming response of cells to a periodic potassium signal secreted from a biofilm and find a phase delay that depends on the period of oscillation.
Strengths:
The finding that E. coli can sense and adapt to potassium signals and the connection to intracellular pH is quite interesting and this work should stimulate future experimental and theoretical studies regarding the microscopic mechanisms governing this response. The evidence (from both the bead assay and FRET) that potassium induces an attractant response is convincing, as is the proposed mechanism involving modification of intracellular pH.
Weaknesses:
The authors show that changes in pH impact fluorescent protein brightness and modify the FRET signal; this measurement explains the apparent imprecise adaptation they measured. However, this effect reduces confidence in the quantitative accuracy of the FRET measurements. For example, part of the potassium response curve (Fig. 4B) can be attributed to chemotactic response and part comes from the pH modifying the FRET signal. Measuring the full potassium response curve of the no-receptor mutants as a control would help quantify the true magnitude of the chemotactic response and the adaptation precision to potassium.
Response: We thank the reviewer for the suggestion. We have now measured the full potassium response curve for the no-receptor mutant (HCB1414-pVS88), as shown in Fig. S4. We characterized the pH effects on CFP and YFP channels at different concentrations of KCl, and the relationship between the ratio of the signal post- to pre-KCl addition and the KCl concentration was established for both channels, as shown in Fig. S4C. The pH-corrected signal after KCl addition for strains with receptors was obtained by dividing the original signal after KCl addition by this ratio at the specific KCl concentration. This was done for both CFP and YFP channels. The pH-corrected responses for the Tar-only and Tsr-only strains are represented by red dots in Fig. 5BC. The recalculated response curve and adaptation curve for the wild-type strain are shown in Fig. S5. The same correction was applied to Fig. 3 as well. We also re-performed the simulations using the corrected dose-response curve and replotted Fig. 6, though the simulation results did not change much.
We have now added a subsection “Revised FRET responses by correcting the pH effects on the brightness of eCFP and eYFP” at line 296 in “Results” to describe this.
The measured response may also be impacted by adaptation. For other strong attractant stimuli, the response typically shows a low plateau before it recovers (adapts). However, in the case of Potassium, the FRET signal does not have an obvious plateau following the stimuli. Do the authors have an explanation for that? One possibility is that the cells may have already partially adapted when the response reaches its minimum, which could indicate a different response and/or adaptation dynamics from that of a regular chemo-attractant? In any case, directly measuring the response to potassium in mutants without adaptation enzymes (CheR, CheB) and with the receptors in different methylation levels would shed more light on the problem.
Response: We appreciate the reviewer’s insightful questions. To observe the low plateau before adaptation, a saturating amount of attractant should be added in a stepwise manner. According to the dose-response curve we measured for potassium, a saturating amount of potassium would be close to 100 mM. In fact, there is a small segment of the low plateau in the step response to 30 mM KCl (Fig. 4C or Fig. S5A). To observe more of this low plateau, we could have used a higher concentration of KCl. However, a stimulation higher than 30 mM KCl will induce substantial physiological changes in the cell, resulting in a significant decrease in fluorescence for both channels (Fig. S7). Therefore, the range of KCl concentration that can be reliably applied in FRET measurements is limited.
The half-time of adaptation at 30 mM KCl was measured to be approximately 80 s, demonstrating a faster adaptation than 0.1 mM MeAsp, which induced a similar magnitude of response. Nevertheless, this is still significantly slower than the time required for medium exchange in the flow chamber, which takes less than 10 s to replace 99% of the medium. Thus, the effect on the measured response magnitude due to adaptation should be small (less than 10%).
We thank the reviewer for the suggestion of measuring the response to potassium in mutants without adaptation enzymes (CheR, CheB) and with the receptors in different methylation levels. However, these mutants are typically less sensitive than the wild-type, exhibiting higher values of K0.5 (Sourjik & Berg, PNAS 99:123, 2002), and thus require an even higher KCl concentration to see the low plateau. Consistent with this, we attempted to measure the response to potassium in a cheRcheB mutant (HCB1382-pVS88). As shown in Fig. R1 below, there is no response to up to 30 mM KCl, suggesting that the sensitive region of the mutant is beyond 30 mM KCl.
The relevant text was added at line 413-424.
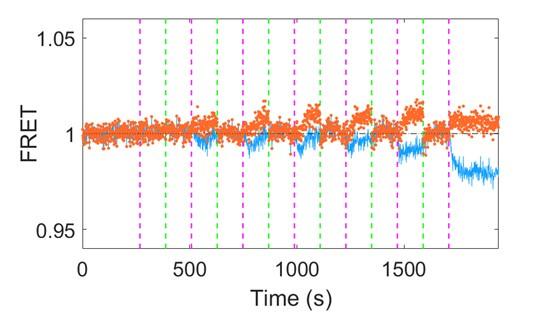
Author response image 1.
The response of the cheRcheB mutant (HCB1382-pVS88) to different concentrations of KCl. The blue solid line denotes the original signal, while the red dots represent the pH-corrected signal. The vertical purple (green) dashed lines indicate the moment of adding (removing) 0.01 mM, 0.1 mM, 0.3 mM, 1 mM, 3 mM, 10 mM and 30 mM KCl, in chronological order.
There seems to be an inconsistency between the FRET and bead assay measurements, the CW bias shows over-adaptation, while the FRET measurement does not.
Response: We thank the reviewer for pointing this out. We have now demonstrated that the imprecise adaptation shown in the FRET assay primarily resulted from the pH-induced intensity change of the fluorescent proteins. As shown in Fig. S5A&C, the FRET signal also shows over-adaptation, similar to the bead assay, when we recalculated the response by correcting the CFP and YFP channels.
Now we clarified it at line 315.
The small hill coefficient of the potassium response curve and the biphasic response of the Tar-only strain, while both very interesting, require further explanation since these are quite different than responses to more conventional chemoattractants.
Response: We thank the reviewer for pointing this out. We have now recalculated the pH-corrected results for the dose-response curve (Fig. S5) and the biphasic response of the Tar-only strain (Fig. 5C). The new Hill coefficient is 0.880.14 (meanSD), which is close to the response to MeAsp (1.2) (ref. 46). We suspected that this Hill coefficient of slightly less than 1 resulted from the different responses of Tar and Tsr receptors to potassium.
The Tar-only strain exhibits a repellent response to stepwise addition of low concentrations of potassium less than 10 mM, and a biphasic response above (Fig. 5C). This biphasic response might result from additional pH-effects on the activity of intracellular enzymes such as CheRB and CheA, which may have a different timescale and response from the Tar receptor. We have now added the penultimate paragraph in “Discussion” to talk about the response of the Tar-only strain.
Reviewer #2 (Public Review):
Summary:
Zhang et al investigated the biophysical mechanism of potassium-mediated chemotactic behavior in E coli. Previously, it was reported by Humphries et al that the potassium waves from oscillating B subtilis biofilm attract P aeruginosa through chemotactic behavior of motile P aeruginosa cells. It was proposed that K+ waves alter PMF of P aeruginosa. However, the mechanism was this behaviour was not elusive. In this study, Zhang et al demonstrated that motile E coli cells accumulate in regions of high potassium levels. They found that this behavior is likely resulting from the chemotaxis signalling pathway, mediated by an elevation of intracellular pH. Overall, a solid body of evidence is provided to support the claims. However, the impacts of pH on the fluorescence proteins need to be better evaluated. In its current form, the evidence is insufficient to say that the fluoresce intensity ratio results from FRET. It may well be an artefact of pH change. Nevertheless, this is an important piece of work. The text is well written, with a good balance of background information to help the reader follow the questions investigated in this research work.
In my view, the effect of pH on the FRET between CheY-eYFP and CheZ-eCFP is not fully examined. The authors demonstrated in Fig. S3 that CFP intensity itself changes by KCl, likely due to pH. They showed that CFP itself is affected by pH. This result raises a question of whether the FRET data in Fig3-5 could result from the intensity changes of FPs, but not FRET. The measured dynamics may have nothing to do with the interaction between CheY and CheZ. It should be noted that CFP and YFP have different sensitivities to pH. So, the measurement is likely confounded by the change in intracellular pH. Without further experiments to evaluate the effect of pH on CFP and YFP, the data using this FRET pair is inconclusive.
Response: We thank the reviewer for pointing this out. We have now measured the full potassium response curve for the no-receptor mutant (HCB1414-pVS88), as shown in Fig. S4. We characterized the pH effects on CFP and YFP channels at different concentrations of KCl, and the relationship between the ratio of the signal post- to pre-KCl addition and the KCl concentration was established for both channels, as shown in Fig. S4C. The pH-corrected signal after KCl addition for strains with receptors was obtained by dividing the original signal after KCl addition by this ratio at the specific KCl concentration. This was done for both CFP and YFP channels. The pH-corrected responses for the Tar-only and Tsr-only strains are represented by red dots in Fig. 5BC. The recalculated response curve and adaptation curve for the wild-type strain are shown in Fig. S5. The same correction was applied to Fig. 3 as well. We also re-performed the simulations using the corrected dose-response curve and replotted Fig. 6, though the simulation results did not change much.
We have now added a subsection “Revised FRET responses by correcting the pH effects on the brightness of eCFP and eYFP” at line 296 in “Results” to describe this.
The data in Figure 1 is convincing. It would be helpful to include example videos. There is also ambiguity in the method section for this experiment. It states 100mM KCl was flown to the source channel. However, it is not clear if 100 mM KCl was prepared in water or in the potassium-depleted motility buffer. If KCl was prepared with water, there would be a gradient of other chemicals in the buffer, which confound the data.
Response: We apologize for the ambiguity. The KCl solution used in this work was prepared in the potassium-depleted motility buffer. We have now clarified this at both lines 116 and 497. We now provided an example video, Movie S1, with the relevant text added at line 123.
The authors show that the FRET data with both KCl and K2SO4, and concluded that the chemotactic response mainly resulted from potassium ions. However, this was only measured by FRET. It would be more convincing if the motility assay in Fig1 is also performed with K2SO4.
Response: We thank the reviewer for the suggestion. The aim of comparing the responses to KCl and K2SO4 was to determine the role of chloride ions in the response and to prove that the chemotactic response of E. coli to KCl comes primarily from its response to potassium ions. It is more sensitive to compare the responses to KCl and K2SO4 by using the FRET assay. In contrast, the microfluidic motility assay is less sensitive in revealing the difference in the chemotactic responses, making it difficult to determine the potential role of chloride ions.
Methods:
- Please clarify the promotes used for the constitutive expression of FliCsticky and LacI.
Response: The promoters used for the constitutive expression of LacIq and FliCsticky were the Iq promoter and the native promoter of fliC, respectively (ref. 57).
Now these have been clarified at line 471.
- Fluorescence filters and imaging conditions (exposure time, light intensity) are missing.
Response: Thank you for the suggestion. We have now added more descriptions at lines 535-546: The FRET setup was based on a Nikon Ti-E microscope equipped with a 40× 0.60 NA objective. The illumination light was provided by a 130-W mercury lamp, attenuated by a factor of 1024 with neutral density filters, and passed through an excitation bandpass filter (FF02-438/24-25, Semrock) and a dichroic mirror (FF458-Di02-25x36, Semrock). The epifluorescent emission was split into cyan and yellow channels by a second dichroic mirror (FF509-FDi01-25x36, Semrock). The signals in the two channels were then filtered by two emission bandpass filters (FF01-483/32-25 and FF01-542/32-25, Semrock) and collected by two photon-counting photomultipliers (H7421-40, Hamamatsu, Hamamatsu City, Japan), respectively. Signals from the two photomultipliers were recorded at a sampling rate of 1 Hz using a data-acquisition card installed in a computer (USB-1901(G)-1020, ADlink, New Taipei, Taiwan).
- Please clarify if the temperature was controlled in motility assays.
Response: All measurements in our work were performed at 23 ℃. It was clarified at line 496.
- L513. It is not clear how theta was selected. Was theta set to be between 0 and pi? If not, P(theta) can be negative?
Response: The θ was set to be between 0 and π. This has now been added at line 581.
- Typo in L442 (and) and L519 (Koff)
Response: Thank you. Corrected.
Recommendations for the authors:
Reviewer #1 (Recommendations For The Authors):
(1) From the motor measurements the authors find that the CW bias over-adapts to a level larger than prestimulus, but this is not seen in the FRET measurements. What causes this inconsistency? Fig. 2D seems to rule out any change in CheY binding to the motor.
Response: We thank the reviewer for pointing this out. We have now demonstrated that the imprecise adaptation shown in the FRET assay primarily resulted from the pH-induced intensity change of the fluorescent proteins. As shown in Fig. S5A&C, the FRET signal also shows over-adaptation, similar to the bead assay, when we recalculated the response by correcting the CFP and YFP channels.
We now clarified it at line 315.
(2) It would be useful to compare the response amplitude for potassium (Fig. 3C) to a large concentration of both MeAsp and serine. This is a fairer comparison since your work shows potassium acts on both Tar and Tsr. Alternatively, testing a much larger concentration (~10^6 micromolar) at which MeAsp also binds to Tsr would also be useful.
Response: We thank the reviewer for pointing this out. We have now recalculated the response to potassium by correcting the pH-induced effects on fluorescence intensity of CFP and YFP. The response to 30 mM KCl was 1.060.10 times as large as that to 100 μM MeAsp. The aim of the comparison between the responses to potassium and MeAsp was to provide an idea of the magnitude of the chemotactic response to potassium. The stimulus of 100 μM MeAsp is already a saturating amount of attractant and induces zero-kinase activity, thus using a higher stimulus (adding serine or a larger concentration of MeAsp) is probably not needed. Moreover, a larger concentration (~10^6 micromolar) of MeAsp would also induce an osmotactic response.
(3) The fitted Hill coefficient (~0.5) to the FRET response curve is quite small and the authors suggest this indicates negative cooperativity. Do they have a proposed mechanism for negative cooperativity? Have similar coefficients been measured for other responses?
Response: We thank the reviewer for pointing this out. We have now recalculated the pH-corrected results for the dose-response curve (Fig. S5). The new Hill coefficient is 0.880.14 (meanSD), which is close to the response to MeAsp (1.2) (ref. 46). We suspect that this Hill coefficient of slightly less than 1 results from the differing responses of Tar and Tsr receptors to potassium.
(3a) The authors state a few times that the response to potassium is "very sensitive", but the low Hill coefficient indicates that the response is not very sensitive (at least compared to aspartate and serine responses).
Response: We apologize for the confusion. We described the response to potassium as “very sensitive” due to the small value of K0.5. This has now been clarified at line 236.
(3b) Since the measurements are performed in wild-type cells the response amplitude following the addition of potassium may be biased if the cell has already partially adapted. This seems to be the case since the FRET time series does not plateau after the addition of the stimulus. The accuracy of the response curve and hill coefficient would be more convincing if the experiment was repeated with a cheR cheB deficient mutant.
Response: We thank the reviewer for raising these questions. To observe the low plateau before adaptation, a saturating amount of attractant should be added in a stepwise manner. According to the dose-response curve we measured for potassium, a saturating amount of potassium would be close to 100 mM. In fact, there is a small segment of the low plateau in the step response to 30 mM KCl (Fig. 4C or Fig. S5A). To observe more of this low plateau, we could have used a higher concentration of KCl. However, a stimulation higher than 30 mM KCl will induce substantial physiological changes in the cell, resulting in a significant decrease in fluorescence for both channels (Fig. S7). Therefore, the range of KCl concentration that can be reliably applied in FRET measurements is limited.
The half-time of adaptation at 30 mM KCl was measured to be approximately 80 s, demonstrating a faster adaptation than 0.1 mM MeAsp, which induced a similar magnitude of response. Nevertheless, this is still significantly slower than the time required for medium exchange in the flow chamber, which takes less than 10 s to replace 99% of the medium. Thus, the effect on the measured response magnitude due to adaptation should be small (less than 10%).
We thank the reviewer for the suggestion of measuring the response to potassium in mutants without adaptation enzymes (CheR, CheB) and with the receptors in different methylation levels. However, these mutants are typically less sensitive than the wild-type, exhibiting higher values of K0.5 (ref. 46), and thus require an even higher KCl concentration to see the low plateau. Consistent with this, we attempted to measure the response to potassium in a cheRcheB mutant (HCB1382-pVS88). As shown in Fig. R1, there is no response to up to 30 mM KCl, suggesting that the sensitive region of the mutant is beyond 30 mM KCl.
The relevant text was added at line 413-424.
(4) The authors show that the measured imprecise adaptation can be (at least partially) attributed to pH impacting the FRET signal by changing eCFP and eYFP brightness.
(4a) Comparing Fig. 5C and D, the chemosensing and pH response time scales look similar. Therefore, does the pH effect bias the measured response amplitude (just as it biases the adapted FRET level)?
Response: We agree with the reviewer that the pH effect on CFP and YFP biases the measured response amplitude. We have now performed the measurement of dose-response curve to potassium for the no-receptor mutant (HCB1414-pVS88), as shown in Fig. S4. The pH effects on CFP and YFP were corrected. The dose-response curve and adaptation curve were recalculated and plotted in Fig. S5.
(4b) It would help to measure a full response curve (at many concentrations) for the no-receptor strain as a control. This would help distinguish, as a function of concentration, how much response can be attributed to pH impacting the FRET signal versus the true chemotactic response.
Response: We thank the reviewer for the suggestion. We have now performed the measurements for the no-receptor strain. The impact of pH on CFP and YFP has been corrected. The pH-corrected results, previously in Fig.3-5, are now presented in Fig. 3, Fig. S5 and Fig. 5, respectively.
(5) The biphasic response of Tar is strange and warrants further discussion. Do the authors have any proposed mechanisms that lead to this behavior? For the 10mM and 30mM KCl measurements there is a repellent response followed by an attractant response for both adding and removing the stimuli, why is this?
Response: We thank the reviewer for pointing this out. The Tar-only strain exhibits a repellent response to stepwise addition of low concentrations of potassium less than 10 mM, and a biphasic response above (Fig. 5C). This biphasic response might result from additional pH-effects on the activity of intracellular enzymes such as CheRB and CheA, which may have a different timescale and response from the Tar receptor. We have now added the penultimate paragraph in “Discussion” to talk about the response of the Tar-only strain.
(5a) The fact that Tar and Tsr are both attractant (after the initial repellant response in Tar) appears to be inconsistent with previous work on pH response (Ref 52, Yang and Sourjik Molecular Microbiology (2012) 86(6), 1482-1489). This study also didn't see any biphasic response.
Response: We thank the reviewer for pointing this out. The Tar-only strain shows a repellent response to stepwise addition of low concentrations of potassium, specifically less than 10 mM. This is consistent with previous observations of the response of Tar to changes in intracellular pH (refs. 44,45) and also with the work of Yang and Sourjik (new ref. 53), although the work in ref. 53 dealt with the response to external pH change, and bacteria were known to maintain a relatively stable intracellular pH when external pH changes (Chen & Berg, Biophysical Journal (2000) 78:2280-2284). Interestingly, the Tar-only strain exhibits a biphasic response to high potassium concentrations of 10 mM and above. This biphasic response might result from additional pH-effects on the activity of intracellular enzymes such as CheRB and CheA (ref. 56), which may have a different timescale and response from the Tar receptor. We have now added the penultimate paragraph in “Discussion” to talk about the response of the Tar-only strain.
(5b) The response of Tar to the removal of sodium benzoate (Fig. S2) seems to be triphasic, is there any explanation for this?
Response: We thank the reviewer for pointing this out. We have now acknowledged in the legend of Fig. S2 that this response is interesting and warrants further exploration: “The response to the removal of sodium benzoate seems to be a superposition of an attractant and a repellent response, the reason for which deserves to be further explored.”
(6) Fitting the MWC model leads to N=0.35<1. It is fine to use this as a phenomenological parameter, but can the authors comment on what might be causing such a small effective cluster size for potassium response?
Response: We thank the reviewer for pointing this out. We have now recalculated the pH-corrected results for the dose-response curve (Fig. S5). The new Hill coefficient is 0.880.14 (meanSD), which is close to the response to MeAsp (1.2) (ref. 46). We now refit the MWC model to the pH-corrected dose-response curve, obtaining N of 0.85. We think the small N is due partly to the fact that we are fitting the curve with four parameters: N, Kon, Koff, and fm, while only three features of the sigmoid does-response curve are relevant (the vertical scale, the midpoint concentration, and the slope of the sigmoid). Future experiments may determine these parameters more accurately, but they should not significantly affect the simulation results as long as the wild-type dose-response curve is accurate.
(7) The results of the modeling are closely related to Zhu et. al. Phys. Rev. Lett. 108, 128101. Is the lag time for large T related to the adaptation time?
Response: We thank the reviewer for pointing this out. We used a similar framework of modeling as Zhu et. al. The potassium response was also analogous to the chemotactic response to MeAsp. Thus, the results are closely related to Zhu et al. We have now cited Zhu et al. (Ref. 52) and noted this at line 366.
The lag time for large T is related to the adaptation time. We have now simulated the chemotaxis to potassium for large T with different adaptation time by varying the methylation rate kR. The results are shown in Fig. S8. The simulated lag time decreases with the methylation rate kR, but levels off at high values of kR. Now this has been added at line 603.
Minor issues:
- Fig. 1C: should the axis label be y?
Response: Yes, thank you. Now corrected.
- Line 519: Koff given twice, the second should be Kon.
Response: Thank you. Corrected.
- When fitting the MWC model (Eq. 3 and Fig. 6B) did you fix a particular value for m?
Response: m was treated as a fitting parameter, grouped in the parameter fm.
Reviewer #2 (Recommendations For The Authors):
Minor points:
- I suggest explaining the acronyms when they first appear in the text (eg CMC, CW, CCW).
Response: Thank you. Now they have been added.
- L144. L242. "decrease" is ambiguous since membrane potential is negative. I understand the authors meant less negative (which is an increase). I suggest to avoid this expression.
Response: Thank you for the suggestion. Now they have been replaced by “The absolute value of the transmembrane electrical potential will decrease”.
- For Fig 1b - it says the shaded area is SEM in the text, but SD in the legend. Please clarify.
Response: Thank you. The annotation in the legend has now been revised as SEM.
- Fig 1C label of x axis should be "y" instead of "x" to be consistent with Fig 1A.
Response: Thank you. It has now been revised.
- In Figure 2, the number of independent experiments as well as the number of samples should be included.
Response: Thank you. The response in Fig. 2C is the average of 83 motors from 5 samples for wild-type strain (JY26-pKAF131). The response in Fig. 2D is the average of 22 motors from 4 samples for the chemotaxis-defective strain (HCB901-pBES38). They have now been added to the legend.
- Regarding the attractant or repelling action of potassium and sucrose, it would be important to have a move showing the cells' behaviours.
Response: We thank the reviewer for the suggestion. We have now provided Movie S1 to show the cells’ behavior to potassium. As shown in Fig. 3B, the chemotactic response to 60 mM sucrose is very small compared to the response to 30 mM KCl. This implies that a noticeable response to sucrose necessitates higher concentrations of stimulation. However, Jerko et al. [Rosko, J., Martinez, V. A., Poon, W. C. K. & Pilizota, T. Proc. Natl Acad. Sci. USA 114, E7969-E7976 (2017).] have shown that high concentrations of sucrose lead to a significant reduction in the speed of the flagella motor. Thus, in a motility assay for sucrose, the osmolarity-induced motility effect may overwhelm the minor repellent-like response.
-
eLife assessment
In this important study, the authors report a novel measurement of the Escherichia coli chemotactic response and demonstrate that these bacteria display an attractant response to potassium, which is connected to intracellular pH level. Whilst the experiments are mostly convincing, there are some confounders regards pH changes and fluorescent proteins that remain to be addressed.
-
Reviewer #1 (Public Review):
Summary:
This paper shows that E. coli exhibits a chemotactic response to potassium by measuring both the motor response (using a bead assay) and the intracellular signaling response (CheY phosporylation level via FRET) to step changes in potassium concentration. They find increase in potassium concentration induces a considerable attractant response, with amplitude comparable to aspartate, and cells can quickly adapt (and generally over-adapt). The authors propose that the mechanism for potassium response is through modifying intracellular pH; they find both that potassium modifies pH and other pH modifiers induce similar attractant responses. It is also shown, using Tar- and Tsr-only mutants, that these two chemoreceptors respond to potassium differently. Tsr has a standard attractant response, while Tar …
Reviewer #1 (Public Review):
Summary:
This paper shows that E. coli exhibits a chemotactic response to potassium by measuring both the motor response (using a bead assay) and the intracellular signaling response (CheY phosporylation level via FRET) to step changes in potassium concentration. They find increase in potassium concentration induces a considerable attractant response, with amplitude comparable to aspartate, and cells can quickly adapt (and generally over-adapt). The authors propose that the mechanism for potassium response is through modifying intracellular pH; they find both that potassium modifies pH and other pH modifiers induce similar attractant responses. It is also shown, using Tar- and Tsr-only mutants, that these two chemoreceptors respond to potassium differently. Tsr has a standard attractant response, while Tar has a biphasic response (repellent-like then attractant-like). Finally, the authors use computer simulations to study the swimming response of cells to a periodic potassium signal secreted from a biofilm and find a phase delay that depends on the period of oscillation.
Strengths:
The finding that E. coli can sense and adapt to potassium signals and the connection to intracellular pH is quite interesting and this work should stimulate future experimental and theoretical studies regarding the microscopic mechanisms governing this response. The evidence (from both the bead assay and FRET) that potassium induces an attractant response is convincing, as is the proposed mechanism involving modification of intracellular pH. The updated manuscript controls for the impact of pH on the fluorescent protein brightness that can bias the measured FRET signal. After correction the response amplitude and sharpness (hill coefficient) are comparable to conventional chemoattractants (e.g. aspartate), indicating the general mechanisms underlying the response may be similar. The authors suggest that the biphasic response of Tar mutants may be due to pH influencing the activity of other enzymes (CheA, CheR or CheB), which will be an interesting direction for future study.
Weaknesses:
The measured response may be biased by adaptation, especially for weak potassium signals. For other attractant stimuli, the response typically shows a low plateau before it recovers (adapts). In the case of potassium, the FRET signal does not have an obvious plateau following the stimuli of small potassium concentrations, perhaps due to the faster adaptation compared to other chemoattractants. It is possible cells have already partially adapted when the response reaches its minimum, so the measured response may be a slight underestimate of the true response. Mutants without adaptation enzymes appear to be sensitive to potassium only at much larger concentrations, where the pH significantly disrupts the FRET signal; more accurate measurements would require development of new mutants and/or measurement techniques.
-
Reviewer #2 (Public Review):
Zhang et al investigated the biophysical mechanism of potassium-mediated chemotactic behavior in E coli. Previously, it was reported by Humphries et al that the potassium waves from oscillating B subtilis biofilm attract P aeruginosa through chemotactic behavior of motile P aeruginosa cells. It was proposed that K+ waves alter PMF of P aeruginosa. However, the mechanism was this behaviour was not elusive. In this study, Zhang et al demonstrated that motile E coli cells accumulate in regions of high potassium levels. They found that this behavior is likely resulting from the chemotaxis signalling pathway, mediated by an elevation of intracellular pH. Overall, a solid body of evidence is provided to support the claims. However, the impacts of pH on the fluorescence proteins need to be better evaluated. In its …
Reviewer #2 (Public Review):
Zhang et al investigated the biophysical mechanism of potassium-mediated chemotactic behavior in E coli. Previously, it was reported by Humphries et al that the potassium waves from oscillating B subtilis biofilm attract P aeruginosa through chemotactic behavior of motile P aeruginosa cells. It was proposed that K+ waves alter PMF of P aeruginosa. However, the mechanism was this behaviour was not elusive. In this study, Zhang et al demonstrated that motile E coli cells accumulate in regions of high potassium levels. They found that this behavior is likely resulting from the chemotaxis signalling pathway, mediated by an elevation of intracellular pH. Overall, a solid body of evidence is provided to support the claims. However, the impacts of pH on the fluorescence proteins need to be better evaluated. In its current form, the evidence is insufficient to say that the fluoresce intensity ratio results from FRET. It may well be an artefact of pH change.
The authors now carefully evaluated the impact of pH on their FRET sensor by examining the YFP and CFP fluorescence with no-receptor mutant. The authors used this data to correct the impact of pH on their FRET sensor. This is an improvement, but the mathematical operation of this correction needs clarification. This is particularly important because, looking at the data, it is not fully convincing if the correction was done properly. For instance, 3mM KCl gives 0.98 FRET signal both in Fig3 and FigS4, but there is almost no difference between blue and red lines in Fig 3. FigS4 is very informative, but it does not address the concern raised by both reviewers that FRET reporter may not be a reliable tool here due to pH change.
The authors show the FRET data with both KCl and K2SO4, concluding that the chemotactic response mainly resulted from potassium ions. However, this was only measured by FRET. It would be more convincing if the motility assay in Fig1 is also performed with K2SO4. The authors did not address this point. In light of complications associated with the use of the FRET sensor, this experiment is more important.
-
-
eLife assessment
This important study reports a novel measurement for the chemotactic response to potassium by Escherichia coli. The authors convincingly demonstrate that these bacteria exhibit an attractant response to potassium and connect this to changes in intracellular pH level. However, some experimental results are incomplete, with additional controls/alternate measurements required to support the conclusions. The work will be of interest to those studying bacterial signalling and response to environmental cues.
-
Reviewer #1 (Public Review):
Summary:
This paper shows that E. coli exhibits a chemotactic response to potassium by measuring both the motor response (using a bead assay) and the intracellular signaling response (CheY phosporylation level via FRET) to step changes in potassium concentration. They find increase in potassium concentration induces a considerable attractant response, with an amplitude larger than aspartate, and cells can quickly adapt (but possibly imperfectly). The authors propose that the mechanism for potassium response is through modifying intracellular pH; they find both that potassium modifies pH and other pH modifiers induce similar attractant responses. It is also shown, using Tar- and Tsr-only mutants, that these two chemoreceptors respond to potassium differently. Tsr has a standard attractant response, while Tar …
Reviewer #1 (Public Review):
Summary:
This paper shows that E. coli exhibits a chemotactic response to potassium by measuring both the motor response (using a bead assay) and the intracellular signaling response (CheY phosporylation level via FRET) to step changes in potassium concentration. They find increase in potassium concentration induces a considerable attractant response, with an amplitude larger than aspartate, and cells can quickly adapt (but possibly imperfectly). The authors propose that the mechanism for potassium response is through modifying intracellular pH; they find both that potassium modifies pH and other pH modifiers induce similar attractant responses. It is also shown, using Tar- and Tsr-only mutants, that these two chemoreceptors respond to potassium differently. Tsr has a standard attractant response, while Tar has a biphasic response (repellent-like then attractant-like). Finally, the authors use computer simulations to study the swimming response of cells to a periodic potassium signal secreted from a biofilm and find a phase delay that depends on the period of oscillation.
Strengths:
The finding that E. coli can sense and adapt to potassium signals and the connection to intracellular pH is quite interesting and this work should stimulate future experimental and theoretical studies regarding the microscopic mechanisms governing this response. The evidence (from both the bead assay and FRET) that potassium induces an attractant response is convincing, as is the proposed mechanism involving modification of intracellular pH.
Weaknesses:
The authors show that changes in pH impact fluorescent protein brightness and modify the FRET signal; this measurement explains the apparent imprecise adaptation they measured. However, this effect reduces confidence in the quantitative accuracy of the FRET measurements. For example, part of the potassium response curve (Fig. 4B) can be attributed to chemotactic response and part comes from the pH modifying the FRET signal. Measuring the full potassium response curve of the no-receptor mutants as a control would help quantify the true magnitude of the chemotactic response and the adaptation precision to potassium.
The measured response may also be impacted by adaptation. For other strong attractant stimuli, the response typically shows a low plateau before it recovers (adapts). However, in the case of Potassium, the FRET signal does not have an obvious plateau following the stimuli. Do the authors have an explanation for that? One possibility is that the cells may have already partially adapted when the response reaches its minimum, which could indicate a different response and/or adaptation dynamics from that of a regular chemo-attractant? In any case, directly measuring the response to potassium in mutants without adaptation enzymes (CheR, CheB) and with the receptors in different methylation levels would shed more light on the problem.
There seems to be an inconsistency between the FRET and bead assay measurements, the CW bias shows over-adaptation, while the FRET measurement does not. The small hill coefficient of the potassium response curve and the biphasic response of the Tar-only strain, while both very interesting, require further explanation since these are quite different than responses to more conventional chemoattractants.
-
Reviewer #2 (Public Review):
Summary:
Zhang et al investigated the biophysical mechanism of potassium-mediated chemotactic behavior in E coli. Previously, it was reported by Humphries et al that the potassium waves from oscillating B subtilis biofilm attract P aeruginosa through chemotactic behavior of motile P aeruginosa cells. It was proposed that K+ waves alter PMF of P aeruginosa. However, the mechanism was this behaviour was not elusive. In this study, Zhang et al demonstrated that motile E coli cells accumulate in regions of high potassium levels. They found that this behavior is likely resulting from the chemotaxis signalling pathway, mediated by an elevation of intracellular pH. Overall, a solid body of evidence is provided to support the claims. However, the impacts of pH on the fluorescence proteins need to be better …
Reviewer #2 (Public Review):
Summary:
Zhang et al investigated the biophysical mechanism of potassium-mediated chemotactic behavior in E coli. Previously, it was reported by Humphries et al that the potassium waves from oscillating B subtilis biofilm attract P aeruginosa through chemotactic behavior of motile P aeruginosa cells. It was proposed that K+ waves alter PMF of P aeruginosa. However, the mechanism was this behaviour was not elusive. In this study, Zhang et al demonstrated that motile E coli cells accumulate in regions of high potassium levels. They found that this behavior is likely resulting from the chemotaxis signalling pathway, mediated by an elevation of intracellular pH. Overall, a solid body of evidence is provided to support the claims. However, the impacts of pH on the fluorescence proteins need to be better evaluated. In its current form, the evidence is insufficient to say that the fluoresce intensity ratio results from FRET. It may well be an artefact of pH change. Nevertheless, this is an important piece of work. The text is well written, with a good balance of background information to help the reader follow the questions investigated in this research work.
In my view, the effect of pH on the FRET between CheY-eYFP and CheZ-eCFP is not fully examined. The authors demonstrated in Fig. S3 that CFP intensity itself changes by KCl, likely due to pH. They showed that CFP itself is affected by pH. This result raises a question of whether the FRET data in Fig3-5 could result from the intensity changes of FPs, but not FRET. The measured dynamics may have nothing to do with the interaction between CheY and CheZ. It should be noted that CFP and YFP have different sensitivities to pH. So, the measurement is likely confounded by the change in intracellular pH. Without further experiments to evaluate the effect of pH on CFP and YFP, the data using this FRET pair is inconclusive.
The data in Figure 1 is convincing. It would be helpful to include example videos. There is also ambiguity in the method section for this experiment. It states 100mM KCl was flown to the source channel. However, it is not clear if 100 mM KCl was prepared in water or in the potassium-depleted motility buffer. If KCl was prepared with water, there would be a gradient of other chemicals in the buffer, which confound the data.
The authors show that the FRET data with both KCl and K2SO4, and concluded that the chemotactic response mainly resulted from potassium ions. However, this was only measured by FRET. It would be more convincing if the motility assay in Fig1 is also performed with K2SO4.
Methods:
- Please clarify the promotes used for the constitutive expression of FliCsticky and LacI.
- Fluorescence filters and imaging conditions (exposure time, light intensity) are missing.
- Please clarify if the temperature was controlled in motility assays.
- L513. It is not clear how theta was selected. Was theta set to be between 0 and pi? If not, P(theta) can be negative?
- Typo in L442 (and) and L519 (Koff) -
