Eye-specific differences in active zone addition during synaptic competition in the developing visual system
Curation statements for this article:-
Curated by eLife

eLife Assessment
This is a valuable analysis of STORM data that characterizes the clustering of active zones in retinogeniculate terminals across ages and in the absence of retinal waves. The design makes it possible to relate fixed time point structural data to a known outcome of activity-dependent remodeling. The latest revision has tempered the causal claims made in previous versions. The result provides solid structural support for the hypotheses regarding how activity influences the clustering of these synapses.
This article has been Reviewed by the following groups
Discuss this preprint
Start a discussion What are Sciety discussions?Listed in
- Evaluated articles (eLife)
- @jcorquiza's saved articles (jcorquiza)
Abstract
Spatially clustered synaptic inputs enable local dendritic computations important for learning, memory, and sensory processing. In the mammalian visual system, individual retinal ganglion cell axons form clustered terminal boutons containing multiple active zones onto relay cell dendrites in the dorsal lateral geniculate nucleus. This mature architecture arises through the addition of release sites, which strengthens selected afferents while weaker inputs are pruned. Following eye-opening, spontaneous activity and visual experience promote synaptic refinement and bouton clustering after binocular inputs have segregated. However, anatomical changes in release site addition and spatial patterning during earlier stages of eye-specific competition are not well understood. To investigate this, we examined the spatial organization of eye-specific active zones in wild-type mice and a mutant line with disrupted cholinergic retinal waves. Using volumetric super-resolution single-molecule localization microscopy and electron microscopy, we found that individual retinogeniculate boutons begin forming multiple nearby presynaptic active zones during the first postnatal week. Both eyes generate these ‘multi-active-zone’ (mAZ) inputs throughout refinement, but the dominant eye forms more numerous mAZ contacts, each with more active zones and larger vesicle pools. At the height of competition (postnatal day 4), the non-dominant-eye projection adds many single-active-zone synapses. Mutants with abnormal cholinergic retinal waves still form mAZ inputs but develop fewer synapses overall and show reduced synaptic clustering in projections from both eyes. Together, these findings reveal eye-specific differences in release site addition that correlate with axonal segregation outcomes during retinogeniculate refinement.
Article activity feed
-

-
-
-

eLife Assessment
This is a valuable analysis of STORM data that characterizes the clustering of active zones in retinogeniculate terminals across ages and in the absence of retinal waves. The design makes it possible to relate fixed time point structural data to a known outcome of activity-dependent remodeling. The latest revision has tempered the causal claims made in previous versions. The result provides solid structural support for the hypotheses regarding how activity influences the clustering of these synapses.
-
Joint Public Review:
Summary:
The authors previously published a study of RGC boutons in the dLGN in developing wild-type mice and developing mutant mice with disrupted spontaneous activity. In the current manuscript, they have broken down their analysis of RGC boutons according to the number of Homer/Bassoon puncta associated with each vGlut3 cluster.
The authors find that, in the first post-natal week, RGC boutons with multiple active zones (mAZs) are about a third as common as boutons with a single active zone (sAZ). The size of the vGluT2 cluster associated with each bouton was proportional to the number of active zones present in each bouton. Within the author's ability to estimate these values (n=3 per group, 95% of results expected to be within ~2.5 standard deviations), these results are consistent across groups: 1) dominant eye …
Joint Public Review:
Summary:
The authors previously published a study of RGC boutons in the dLGN in developing wild-type mice and developing mutant mice with disrupted spontaneous activity. In the current manuscript, they have broken down their analysis of RGC boutons according to the number of Homer/Bassoon puncta associated with each vGlut3 cluster.
The authors find that, in the first post-natal week, RGC boutons with multiple active zones (mAZs) are about a third as common as boutons with a single active zone (sAZ). The size of the vGluT2 cluster associated with each bouton was proportional to the number of active zones present in each bouton. Within the author's ability to estimate these values (n=3 per group, 95% of results expected to be within ~2.5 standard deviations), these results are consistent across groups: 1) dominant eye vs. non-dominant eye, 2) wild-type mice vs. mice with activity blocked, and at 3) ages P2, P4, and P8. The authors also found that mAZs and sAZs also have roughly the same number (about 1.5) of sAZs clustered around them (within 1.5 um).
There has been much discussion with the reviewers through multiple versions of this paper. of how to interpret these findings. Based on a large number of tests for statistical significance, the authors interpreted the presence of a statistical significance difference as evidence that "Eye-specific active zone clustering underlies synaptic competition in the developing visual system (title of previous version of manuscript)". The reviewers have focused on the small effect size as indicating that the small differences observed are not informative regarding this biological question. The authors have now tempered this interpretation.
Strengths:
The source dataset is high resolution data showing the colocalization of multiple synaptic proteins across development. Added to this data is labeling that distinguishes axons from the right eye from axons from the left eye. The first order analysis of this data showing changes in synapse density and in the occurrence of multi-active zone synapses is useful information about the development of an important model for activity dependent synaptic remodeling.
Reviewing Editor's comment on the latest revision (without sending the paper back to the individual reviewers):
In their latest revision, the authors have moderated earlier causal claims, incorporated additional statistical controls, and largely maintained their original interpretation of the data. While these changes address some prior concerns, the underlying issues remain. The previous review emphasized that the reported effect sizes were small and therefore hard to link to biological relevance. The authors argue that the effect sizes are large. Given the lack of a biological argument for this effect size, this point is really semantic. We would like to point out that the effect size measurement the authors used is likely a standard effect size calculation (the difference between groups is divided by the standard deviation of the groups). With only three experiments and irregular variance, it is likely that their estimates of standard deviation-and therefore effect size-are unreliable. Overall, the revisions improve presentation but do not substantively resolve the difficulty in drawing strong conclusions from the data set raised earlier.
-
Author response:
The following is the authors’ response to the previous reviews
Reviewer #1 (Public review):
Summary
The authors previously published a study of RGC boutons in the dLGN in developing wild-type mice and developing mutant mice with disrupted spontaneous activity. In the current manuscript, they have broken down their analysis of RGC boutons according to the number of Homer/Bassoon puncta associated with each vGlut3 cluster.
The authors find that, in the first post-natal week, RGC boutons with multiple active zones (mAZs) are about a third as common as boutons with a single active zone (sAZ). The size of the vGluT2 cluster associated with each bouton was proportional to the number of active zones present in each bouton. Within the author's ability to estimate these values (n=3 per group, 95% of results expected to be …
Author response:
The following is the authors’ response to the previous reviews
Reviewer #1 (Public review):
Summary
The authors previously published a study of RGC boutons in the dLGN in developing wild-type mice and developing mutant mice with disrupted spontaneous activity. In the current manuscript, they have broken down their analysis of RGC boutons according to the number of Homer/Bassoon puncta associated with each vGlut3 cluster.
The authors find that, in the first post-natal week, RGC boutons with multiple active zones (mAZs) are about a third as common as boutons with a single active zone (sAZ). The size of the vGluT2 cluster associated with each bouton was proportional to the number of active zones present in each bouton. Within the author's ability to estimate these values (n=3 per group, 95% of results expected to be within ~2.5 standard deviations), these results are consistent across groups: 1) dominant eye vs. nondominant eye, 2) wild-type mice vs. mice with activity blocked, and at 3) ages P2, P4, and P8. The authors also found that mAZs and sAZs also have roughly the same number (about 1.5) of sAZs clustered around them (within 1.5 um).
However, the authors do not interpret this consistency between groups as evidence that active zone clustering is not a specific marker or driver of activity dependent synaptic segregation. Rather, the authors perform a large number of tests for statistical significance and cite the presence or absence of statistical significance as evidence that "Eye-specific active zone clustering underlies synaptic competition in the developing visual system (title)". I don't believe this conclusion is supported by the evidence.
We have revised the title to be descriptive: "Eye-specific differences in active zone addition during synaptic competition in the developing visual system." While our correlative approach does not establish direct causality, our findings provide important structural evidence that complements existing functional studies of activity-dependent synaptic refinement. We have carefully revised the text throughout to avoid causal language, focusing instead on the developmental patterns we observe.
Strengths
The source dataset is high resolution data showing the colocalization of multiple synaptic proteins across development. Added to this data is labeling that distinguishes axons from the right eye from axons from the left eye. The first order analysis of this data showing changes in synapse density and in the occurrence of multi-active zone synapses is useful information about the development of an important model for activity dependent synaptic remodeling.
Weaknesses
In my previous review I argued that it was not possible to determine, from their analysis, whether the differences they were reporting between groups was important to the biology of the system. The authors have made some changes to their statistics (paired t-tests) and use some less derived measures of clustering. However, they still fail to present a meaningfully quantitative argument that the observed group differences are important. The authors base most of their claims on small differences between groups. There are two big problems with this practice. First, the differences between groups appear too small to be biologically important. Second, the differences between groups that are used as evidence for how the biology works are generally smaller than the precision of the author's sampling. That is, the differences are as likely to be false positives as true positives.
(1) Effect size. The title claims: "Eye-specific active zone clustering underlies synaptic competition in the developing visual system". Such a claim might be supported if the authors found that mAZs are only found in dominant-eye RGCs and that eye-specific segregation doesn't begin until some threshold of mAZ frequency is reached. Instead, the behavior of mAZs is roughly the same across all conditions. For example, the clear trend in Figure 4C and D is that measures of clustering between mAZ and sAZ are as similar as could reasonably be expected by the experimental design. However, some of the comparisons of very similar values produced p-values < 0.05. The authors use this fact to argue that the negligible differences between mAZ and sAZs explain the development of the dramatic differences in the distribution of ipsilateral and contralateral RGCs.
We have changed the title to avoid implying a causal relationship between clustering and eye-specific segregation. Our key findings in Figures 4C and 4D demonstrate effect sizes >2.0 with high statistical power (Supplemental Table S2). While the absolute magnitude of differences is modest (5-7%), these high effect sizes combined with low inter-animal variability demonstrate consistent, reproducible biological phenomena. During development, small differences during critical periods can have profound downstream consequences for synaptic refinement outcomes.
We acknowledge that significance in Figure 4 arises due to low variance between biological replicates rather than large mean differences. We have revised the text to describe these as "slight" differences and that "WT mice show a tendency toward forming more synapses near mAZ inputs," reflecting appropriate caution in our interpretation while maintaining the statistical robustness of our findings.
(2) Sample size. Performing a large number of significance tests and comparing pvalues is not hypothesis testing and is not descriptive science. At best, with large sample sizes and controls for multiple tests, this approach could be considered exploratory. With n=3 for each group, many comparisons of many derived measures, among many groups, and no control for multiple testing, this approach constitutes a random result generator.
The authors argue that n=3 is a large sample size for the type of high resolution / large volume data being used. It is true that many electron microscopy studies with n=1 are used to reveal the patterns of organization that are possible within an individual. However, such studies cannot control individual variation and are, therefore, not appropriate for identifying subtle differences between groups.
In response to previous critiques along these lines, the authors argue they have dealt with this issue by limiting their analysis to within-individual paired comparisons. There are several problems with their thinking in this approach. The main problem is that they did not change the logic of their arguments, only which direction they pointed the t-tests. Instead of claiming that two groups are different because p < 0.05, they say that two groups are different because one produced p < 0.05 and the other produced p > 0.05. These arguments are not statistically valid or biologically meaningful.
We have implemented rigorous statistical controls, applying false discovery rate (FDR) correction using the Benjamini-Hochberg method (α = 0.05) within each experimental condition (age × genotype combination). This correction strategy treats each condition as addressing a distinct experimental question: “What synaptic properties differ between left eye and right eye inputs in this specific developmental stage and genotype?” The approach appropriately controls for multiple testing while preserving power to detect biologically meaningful differences. We applied FDR correction separately to the ~20-34 measurements (varying by age and genotype) within each of the six experimental conditions, resulting in condition-specific adjusted p-values reported in updated Supplemental Table S2. This correction confirmed the robustness of our key findings. We do not base conclusions solely on comparing p-values across conditions. Our interpretations focus on effect sizes, confidence intervals, and consistent patterns within each condition, with statistical significance providing supporting evidence rather than the primary basis for biological conclusions.
To the best of my understanding, the results are consistent with the following model:
RGCs form mAZs at large boutons (known)
About a quarter of week-one RGC boutons are mAZs (new observation)
Vesicle clustering is proportional to active zone number (~new observation)
RGC synapse density increases during the first post-week (known)
Blocking activity reduces synapse density (known)
Contralateral eye RGCs for more and larger synapses in the lateral dLGN (known)
While mAZ formation is known in adult and juvenile dLGN, the formation of mAZ boutons during eye-specific competition represents new information with important functional implications. Synapses with multiple release sites should be stronger than single-active-zone synapses, suggesting a structural correlate for competitive advantage during refinement.
We demonstrate distinct developmental patterns for sAZ versus mAZ contacts during the first postnatal week. Multi-active zone density favors the dominant eye, while single active-zone synapse density from the competing eye increases from P2-P4 to match dominant-eye levels. This reveals that newly formed synapses from the competing eye predominantly contain single release sites, marking P4-P8 as a critical window for understanding molecular mechanisms driving synaptic elimination.
Our results show that altered retinal activity patterns (β2KO mice) reduce synapse density during eye-specific competition. We relied on β2 knockout mice, which retain retinal waves and spontaneous spike activity but with disrupted patterns and output levels compared to controls. We make no claims about complete activity blockade. Previous studies using different activity manipulations (epibatidine, TTX) have examined terminal morphology, but effects on synapse density during competition remain largely unknown. Achieving complete retinal activity blockade is technically challenging, making it of interest to revisit the role of activity using more precise manipulations to control spike output and relative timing.
With n=3 and effect sizes smaller than 1 standard deviation, a statistically significant result is about as likely to be a false positive as a true positive.
A true-positive statistically significant result does is not evidence of a meaningful deviation from a biological model.
Our conclusions are based on results with effect sizes substantially larger than 1. Key findings demonstrate effect sizes exceeding 2.0. These large effect sizes, combined with rigorous FDR correction and low inter-animal variability, provide evidence against false positive results. During critical developmental periods, consistent structural differences, even those modest in absolute magnitude, can reflect important regulatory mechanisms that influence refinement outcomes. All statistical results, effect sizes, and power analyses are reported in Supplementary Tables S2, with confidence intervals in Supplementary Table S3. We have revised the text in several places where small differences are presented to reflect appropriate caution in our interpretation.
Providing plots that show the number of active zones present in boutons across these various conditions is useful. However, I could find no compelling deviation from the above default predictions that would influence how I see the role of mAZs in activity dependent eye-specific segregation.
Below are critiques of most of the claims of the manuscript.
Claim (abstract): individual retinogeniculate boutons begin forming multiple nearby presynaptic active zones during the first postnatal week.
Confirmed by data.
Claim (abstract): the dominant-eye forms more numerous mAZ contacts,
Misleading: The dominant-eye (by definition) forms more contacts than the nondominant eye. That includes mAZ.
While the dominant eye forms more total contacts, the pattern depends critically on contact type and developmental stage. The dominant eye forms more mAZ contacts across all ages (Figures 2 and S1). However, for sAZ contacts, the two eyes form similar numbers at P4, with the non-dominant eye showing increased sAZ formation during this critical period. This differential pattern by synapse type represents an important aspect of how synaptic competition unfolds structurally.
Claim (abstract): At the height of competition, the non-dominant-eye projection adds many single active zone (sAZ) synapses
Weak: While the individual observation is strong, it is a surprising deviation based on a single n=3 experiment in a study that performed twelve such experiments (six ages, mutant/wildtype, sAZ/mAZ)
The difference in eye-specific sAZ formation at P2 and P8 had effect sizes of ~5.3 and ~2.7 respectively (after FDR correction the difference was still significant at P2 and trending at P8). At P4, no effect was observed by paired T-test and the 5/95% confidence intervals ranged from -0.021-0.008 synapses/m3. The consistency of this pattern across P2 and P8, combined with the large effect sizes, supports the reliability of this developmental finding. We report all effect sizes and power test analyses in Supplemental Table S2, and confidence intervals in Supplemental Table S3.
Claim (abstract): Together, these findings reveal eye-specific differences in release site addition during synaptic competition in circuits essential for visual perception and behavior.
False: This claim is unambiguously false. The above findings, even if true, do not argue for any functional significance to active zone clustering.
Our phrasing “circuits essential for visual perception and behavior” referred to the general importance of binocular organization in the retinogeniculate system for visual processing and we did not intend to claim direct functional significance of our structural data. For clarity we have deleted the latter part of this sentence. In lines 35-37, the abstract now reads “Together, these findings reveal eye-specific differences in release site addition that correlate with axonal refinement outcomes during retinogeniculate refinement.”
Claim (line 84): "At the peak of synaptic competition midway through the first postnatal week, the non-dominant-eye formed numerous sAZ inputs, equalizing the global synapse density between the two eyes"
Weak: At one of twelve measures (age, bouton type, genotype) performed with 3 mice each, one density measure was about twice as high as expected.
The difference in eye-specific sAZ formation at P2 and P8 had effect sizes of ~5.3 and ~2.7 respectively (after FDR correction the difference was still significant at P2 and trending at P8). At P4, no effect was observed by paired T-test and the 5/95% confidence intervals ranged from -0.021-0.008 synapses/m3. The consistency of this pattern across P2 and P8, combined with the large effect sizes, supports the reliability of this developmental finding. We report all effect sizes and power test analyses in Supplemental Table S2, and confidence intervals in Supplemental Table S3.
Claim (line 172): "In WT mice, both mAZ (Fig. 3A, left) and sAZ (Fig. 3B, left) inputs showed significant eye-specific volume differences at each age."
Questionable: There appears to be a trend, but the size and consistency is unclear.
Claim (line 175): "the median VGluT2 cluster volume in dominant-eye mAZ inputs was 3.72 fold larger than that of non-dominant-eye inputs (Fig. 3A, left)."
Cherry picking. Twelve differences were measured with an n of 3, 3 each time. The biggest difference of the group was cited. No analysis is provided for the range of uncertainty about this measure (2.5 standard deviations) as an individual sample or as one of twelve comparisons.
Claim (line 174): "In the middle of eye-specific competition at P4 in WT mice, the median VGluT2 cluster volume in dominant-eye mAZ inputs was 3.72 fold larger than that of non-dominant-eye inputs (Fig. 3A, left). In contrast, β2KO mice showed a smaller 1.1 fold difference at the same age (Fig. 3A, right panel). For sAZ synapses at P4, the magnitudes of eye-specific differences in VGluT2 volume were smaller: 1.35-fold in WT (Fig. 3B, left) and 0.41-fold in β2KO mice (Fig. 3B, right). Thus, both mAZ and sAZ input size favors the dominant eye, with larger eye-specific differences seen in WT mice (see Table S3)."
No way to judge the reliability of the analysis and trivial conclusion: To analyze effect size the authors choose the median value of three measures (whatever the middle value is). They then make four comparisons at the time point where they observed the biggest difference in favor of their hypothesis. There is no way to determine how much we should trust these numbers besides spending time with the mislabeled scatter plots. The authors then claim that this analysis provides evidence that there is a difference in vGluT2 cluster volume between dominant and non-dominant RGCs and that that difference is activity dependent. The conclusion that dominant axons have bigger boutons and that mutants that lack the property that would drive segregation would show less of a difference is very consistent with the literature. Moreover, there is no context provided about what 1.35 or 1.1 fold difference means for the biology of the system.
We focused on P4 for biological reasons rather than post-hoc selection. P4 represents the established peak of synaptic competition when eye-specific synapse densities are globally equivalent. This is a timepoint consistently highlighted throughout our manuscript and supported by previous literature. We have modified our presentation from fold changes to measured eye-specific differences in volume (mean ± standard error) and added confidence intervals in Supplemental Table S3. The effect sizes for eye-specific differences in VGluT2 volume at P4 are robust: ~2.3 and ~1.5 for mAZ and sAZ measurements in WT mice, and ~2.5 and ~1.8 in β2KO mice, with all analyses well-powered (Supplemental Table S2).
We were unable to identify any mislabeled scatter plots and believe all figures are correctly labeled. While dominant-eye advantage in bouton size is consistent with previous literature, our study provides the first detailed analysis of how this develops specifically during the critical period of competition, with distinct patterns for single versus multi-active zone contacts. Our data show that dominant-eye inputs have larger vesicle pools that scale with active zone number. While this suggests enhanced transmission capacity, we make no direct physiological claims based on structural data alone.
Claim (189): "This shows that vesicle docking at release sites favors the dominant-eye as we previously reported but is similar for like eye type inputs regardless of AZ number."
Contradicts core claim of manuscript: Consistent with previous literature, there is an activity dependent relative increase in vGlut2 clustering of dominant eye RGCs. The new information is that that activity dependence is more or less the same in sAZ and mAZ. The only plausible alternative is that vGlut2 scaling only increases in mAZ which would be consistent with the claims of their paper. That is not what they found. To the extent that the analysis presented in this manuscript tests a hypothesis, this is it. The claim of the title has been refuted by figure 3.
We report the volume of docked vesicle signal (VGluT2) nearby each active zone, finding this is greater for dominant-eye synapses. Within each eye-specific synapse population, vesicle signal per active zone is similar regardless of whether these are part of single- or multi-active zone contacts. This is consistent with a modular program of active zone assembly and maintenance: core molecular programs facilitate docking at each AZ similarly regardless of how many AZs are nearby.
This finding does not contradict our main conclusions but rather provides insight into how synaptic advantages are structured. The dominant eye's advantage may arise in part from forming more multi-AZ contacts (which have proportionally more docked vesicles) rather than from enhanced vesicle loading per individual active zone. This organization may reflect how developmental competition operates through contact number and active zone addition rather than fundamental changes to individual release site properties.
We have changed the title to be descriptive rather than mechanistic.
Claim (line 235): "For the non-dominant eye projection, however, clustered mAZ inputs outnumbered clustered sAZ inputs at P4 (Fig. 4C, bottom left panel), the age when this eye adds sAZ synapses (Fig. 2C)."
Misleading: The overwhelming trend across 24 comparisons is that the sAZ clustering looks like mAZ clustering. That is the objective and unambiguous result. Among these 24 underpowered tests (n=3), there were a few p-values < 0.05. The authors base their interpretation of cell behavior on these crossings.
In Figures 4C and 4D we report significant results with high effect sizes (effect sizes all greater than 2; see Supplemental Table S2). The mean differences are modest (5-7%) and significance arises due to low variance between biological replicates. We acknowledge that clustering patterns are generally similar between mAZ and sAZ inputs across most conditions. We have revised the text to describe these as “slight” differences and that “WT mice show a tendency toward forming more synapses near mAZ inputs”, reflecting appropriate caution in our interpretation while noting the statistical consistency of these patterns.
Claim (line 328): "The failure to add synapses reduced synaptic clustering and more inputs formed in isolation in the mutants compared to controls."
Trivially true: Density was lower in mutant.
We have rewritten the sentence for clarity: “The failure to add synapses could explain the observation that synaptic clustering was reduced and more inputs formed in isolation in the mutants compared to controls.”
Claim (line 332): "While our findings support a role for spontaneous retinal activity in presynaptic release site addition and clustering..."
Not meaningfully supported by evidence: I could not find meaningful differences between WT and mutant beside the already known dramatic difference in synapse density.
We have changed the sentence to avoid overinterpreting the results. The new sentence in lines 415-417 reads: “While our results highlight developmental changes in presynaptic release site addition and clustering, activity-dependent postsynaptic mechanisms also influence input refinement at later stages.”
Reviewer #2 (Public review):
Summary:
In this manuscript, Zhang and Speer examine changes in the spatial organization of synaptic proteins during eye specific segregation, a developmental period when axons from the two eyes initially mingle and gradually segregate into eye-specific regions of the dorsal lateral geniculate. The authors use STORM microscopy and immunostain presynaptic (VGluT2, Bassoon) and postsynaptic (Homer) proteins to identify synaptic release sites. Activity-dependent changes of this spatial organization are identified by comparing the β2KO mice to WT mice. They describe two types of synapses based on Bassoon clustering: the multiple active zone (mAZ) synapse and single active zone (sAZ) synapse. In this revision, the authors have added EM data to support the idea that mAZ synapses represent boutons with multiple release sites. They have also reanalyzed their data set with different statistical approaches.
Strengths:
The data presented is of good quality and provides an unprecedented view at high resolution of the presynaptic components of the retinogeniculate synapse during active developmental remodeling. This approach offers an advance to the previous mouse EM studies of this synapse because of the CTB label allows identification of the eye from which the presynaptic terminal arises.
Weaknesses:
While the interpretation of this data set is much more grounded in this second revised submission, some of the authors' conclusions/statements still lack convincing supporting evidence. In particular, the data does not support the title: "Eye-specific active zone clustering underlies synaptic competition in the developing visual system". The data show that there are fewer synapses made for both contra- and ipsi- inputs in the β2KO mice-- this fact alone can account for the differences in clustering. There is no evidence linking clustering to synaptic competition. Moreover, the findings of differences in AZ# or distance between AZs that the authors report are quite small and it is not clear whether they are functionally meaningful.
We thank the reviewer for their helpful suggestions that improved the manuscript in this revision. We have changed the title to remove the reference to “clustering” and to avoid implying any causal relationships. The new title is descriptive: “Eye-specific differences in active zone addition during synaptic competition in the developing visual system”.
To further address the reviewers comments, we have removed the remaining references to activity-dependent effects on synaptic development (line 36, line 96, line 415). We have also modified the text in lines 411-413 to state that “The failure to add synapses could explain the observation that synaptic clustering was reduced and more inputs formed in isolation in the mutants compared to controls.”
We have also updated our presentation of results for Figure 4 to ensure that we do not causally link clustering to synaptic competition. In Figures 4C and 4D we report significant results with high effect sizes (effect sizes all greater than 2; see Supplemental Table S2). The mean differences are modest (5-7%) and significance arises due to low variance between biological replicates. We acknowledge that clustering patterns are generally similar between mAZ and sAZ inputs across most conditions. We have revised the text to describe these as “slight” differences and that “WT mice show a tendency toward forming more synapses near mAZ inputs”, reflecting appropriate caution in our interpretation while noting the statistical consistency of these patterns.
Reviewer #3 (Public review):
This study is a follow-up to a recent study of synaptic development based on a powerful data set that combines anterograde labeling, immunofluorescence labeling of synaptic proteins, and STORM imaging (Cell Reports, 2023). Specifically, they use anti-Vglut2 label to determine the size of the presynaptic structure (which they describe as the vesicle pool size), anti-Bassoon to label active zones with the resolution to count them, and anti-Homer to identify postsynaptic densities. Their previous study compared the detailed synaptic structure across the development of synapses made with contraprojecting vs. ipsi-projecting RGCs and compared this developmental profile with a mouse model with reduced retinal waves. In this study, they produce a new detailed analysis on the same data set in which they classify synapses into "multi-active zone" vs. "single-active zone" synapses and assess the number and spacing of these synapses. The authors use measurements to make conclusions about the role of retinal waves in the generation of same-eye synaptic clusters. The authors interpret these results as providing insight into how neural activity drives synapse maturation, the strength of their conclusions is not directly tested by their analysis.
Strengths:
This is a fantastic data set for describing the structural details of synapse development in a part of the brain undergoing activity-dependent synaptic rearrangements. The fact that they can differentiate the eye of origin is what makes this data set unique over previous structural work. The addition of example images from the EM dataset provides confidence in their categorization scheme.
Weaknesses:
Though the descriptions of single vs multi-active zone synapses are important and represent a significant advance, the authors continue to make unsupported conclusions regarding the biological processes driving these changes. Although this revision includes additional information about the populations tested and the tests conducted, the authors do not address the issue raised by previous reviews. Specifically, they provide no assessment of what effect size represents a biologically meaningful result. For example, a more appropriate title is "The distribution of eye-specific single vs multiactive zone is altered in mice with reduced spontaneous activity" rather than concluding that this difference in clustering is somehow related to synaptic competition. Of course, the authors are free to speculate, but many of the conclusions of the paper are not supported by their results.
We appreciate the reviewer’s helpful critique. We have changed the title to be descriptive and avoid implying causal relationships.
We have applied false discovery rate (FDR) correction using the Benjamini-Hochberg method with α = 0.05 within each experimental condition (age × genotype combination). The FDR correction treats each condition as addressing a distinct experimental question: 'What synaptic properties differ between left eye and right eye inputs in this specific developmental stage and genotype?'
This correction strategy is appropriate because: 1) we focus our statistical comparisons within each age/genotype; 2) each age-genotype combination represents a separate biological context where different synaptic properties between eye-of-origin may be relevant; and 3) this approach controls for multiple testing within each experimental question while maintaining statistical power to detect meaningful biological differences.
We applied FDR correction separately to the ~20-34 measurements (varying with age and genotype) within each of the six experimental conditions (P2-WT, P2-ß2, P4-WT, P4-ß2, P8-WT, P8-ß2), resulting in condition-specific adjusted p-values. These are reported in the updated Supplemental Table S2. Figures have been also been updated to reflect the FDR-adjusted values. Selected between-genotype comparisons are presented descriptively using 5/95% confidence intervals. This correction confirmed the robustness of our key findings.
With regard to the biological significance of effect sizes, our key findings demonstrate effect sizes >2.0, indicating robust effects. During critical developmental periods, consistent structural differences, even those modest in absolute magnitude, can reflect important regulatory mechanisms that influence refinement outcomes. The differences in synaptic organization we observe occur during the first postnatal week when eyespecific competition is active, suggesting these patterns may be relevant to understanding how structural advantages emerge during synaptic refinement.
Reviewer #1 (Recommendations for the authors):
I have tried to understand the analysis and biology of this manuscript as best I can. I believe the analytical approach taken is not reliable and I have explained why in my public comments. I don't believe this manuscript is unique in taking this approach. I have recently published a paper on how common this approach is and why it doesn't work. I don't want to give the impression that the problem with the analysis was that it was not computationally sophisticated enough or that you did not jump through a specific statistical hoop. If I strip out the arguments that depend on misinterpretations of p-values and -instead- look at the scatterplots, I come up with a very different view of the data than what is described in the paper.
The information in the plots could be translated into a rigorous statistical analysis of estimated differences between groups given the uncertainties of the experimental design. I don't really think that analysis would be useful. I think it would have been enough to publish the plots and report your estimates of the number of active zones in RGCs during development. I don't see evidence of an additional effect.
We appreciate the reviewer’s helpful comments throughout the review process. Mean active zone numbers per mAZ contact are presented in Figure S2D/E. We look forward to further technical and computational advances that will help us increase our data acquisition throughput and sample sizes when designing future studies.
Reviewer #2 (Recommendations for the authors):
The authors should modify the title and other text to be more consistent with the data. There is no evidence that active zone clustering has any direct relationship to synaptic competition.
We appreciate the reviewer’s helpful suggestions to ensure appropriate language around causal effects. We have modified the title to accurately reflect the results: "Eyespecific differences in active zone addition during synaptic competition in the developing visual system." We have revised the text in the abstract, introduction, and results section for Figures 4 to be consistent with the data and not imply causality of synapse clustering on segregation phenotypes.
Reviewer #3 (Recommendations for the authors):
Change the title.
We appreciate the reviewer’s feedback throughout the review process. We have modified the title to accurately reflect the results: "Eye-specific differences in active zone addition during synaptic competition in the developing visual system."
-
-
eLife Assessment
This is a useful analysis of STORM data that characterizes the clustering of active zones in retinogeniculate terminals across ages and in the absence of retinal waves. The design makes it possible to relate fixed time point structural data to a known outcome of activity-dependent remodeling. However, the evidence is incomplete, weakening the claims the authors make regarding how activity influences the clustering of these synapses. This basic criticism has not improved with revisions.
-
Reviewer #1 (Public review):
Summary
The authors previously published a study of RGC boutons in the dLGN in developing wild-type mice and developing mutant mice with disrupted spontaneous activity. In the current manuscript, they have broken down their analysis of RGC boutons according to the number of Homer/Bassoon puncta associated with each vGlut3 cluster.
The authors find that, in the first post-natal week, RGC boutons with multiple active zones (mAZs) are about a third as common as boutons with a single active zone (sAZ). The size of the vGluT2 cluster associated with each bouton was proportional to the number of active zones present in each bouton. Within the author's ability to estimate these values (n=3 per group, 95% of results expected to be within ~2.5 standard deviations), these results are consistent across groups: 1) …
Reviewer #1 (Public review):
Summary
The authors previously published a study of RGC boutons in the dLGN in developing wild-type mice and developing mutant mice with disrupted spontaneous activity. In the current manuscript, they have broken down their analysis of RGC boutons according to the number of Homer/Bassoon puncta associated with each vGlut3 cluster.
The authors find that, in the first post-natal week, RGC boutons with multiple active zones (mAZs) are about a third as common as boutons with a single active zone (sAZ). The size of the vGluT2 cluster associated with each bouton was proportional to the number of active zones present in each bouton. Within the author's ability to estimate these values (n=3 per group, 95% of results expected to be within ~2.5 standard deviations), these results are consistent across groups: 1) dominant eye vs. non-dominant eye, 2) wild-type mice vs. mice with activity blocked, and at 3) ages P2, P4, and P8. The authors also found that mAZs and sAZs also have roughly the same number (about 1.5) of sAZs clustered around them (within 1.5 um).
However, the authors do not interpret this consistency between groups as evidence that active zone clustering is not a specific marker or driver of activity dependent synaptic segregation. Rather, the authors perform a large number of tests for statistical significance and cite the presence or absence of statistical significance as evidence that "Eye-specific active zone clustering underlies synaptic competition in the developing visual system (title)". I don't believe this conclusion is supported by the evidence.
Strengths
The source dataset is high resolution data showing the colocalization of multiple synaptic proteins across development. Added to this data is labeling that distinguishes axons from the right eye from axons from the left eye. The first order analysis of this data showing changes in synapse density and in the occurrence of multi-active zone synapses is useful information about the development of an important model for activity dependent synaptic remodeling.
Weaknesses
In my previous review I argued that it was not possible to determine, from their analysis, whether the differences they were reporting between groups was important to the biology of the system. The authors have made some changes to their statistics (paired t-tests) and use some less derived measures of clustering. However, they still fail to present a meaningfully quantitative argument that the observed group differences are important. The authors base most of their claims on small differences between groups. There are two big problems with this practice. First, the differences between groups appear too small to be biologically important. Second, the differences between groups that are used as evidence for how the biology works are generally smaller than the precision of the author's sampling. That is, the differences are as likely to be false positives as true positives.
(1) Effect size. The title claims: "Eye-specific active zone clustering underlies synaptic competition in the developing visual system". Such a claim might be supported if the authors found that mAZs are only found in dominant-eye RGCs and that eye-specific segregation doesn't begin until some threshold of mAZ frequency is reached. Instead, the behavior of mAZs is roughly the same across all conditions. For example, the clear trend in Figure 4C and D is that measures of clustering between mAZ and sAZ are as similar as could reasonably be expected by the experimental design. However, some of the comparisons of very similar values produced p-values < 0.05. The authors use this fact to argue that the negligible differences between mAZ and sAZs explain the development of the dramatic differences in the distribution of ipsilateral and contralateral RGCs.
(2) Sample size. Performing a large number of significance tests and comparing p-values is not hypothesis testing and is not descriptive science. At best, with large sample sizes and controls for multiple tests, this approach could be considered exploratory. With n=3 for each group, many comparisons of many derived measures, among many groups, and no control for multiple testing, this approach constitutes a random result generator.
The authors argue that n=3 is a large sample size for the type of high resolution / large volume data being used. It is true that many electron microscopy studies with n=1 are used to reveal the patterns of organization that are possible within an individual. However, such studies cannot control individual variation and are, therefore, not appropriate for identifying subtle differences between groups.
In response to previous critiques along these lines, the authors argue they have dealt with this issue by limiting their analysis to within-individual paired comparisons. There are several problems with their thinking in this approach. The main problem is that they did not change the logic of their arguments, only which direction they pointed the t-tests. Instead of claiming that two groups are different because p < 0.05, they say that two groups are different because one produced p < 0.05 and the other produced p > 0.05. These arguments are not statistically valid or biologically meaningful.To the best of my understanding, the results are consistent with the following model:
• RGCs form mAZs at large boutons (known)
• About a quarter of week-one RGC boutons are mAZs (new observation)
• Vesicle clustering is proportional to active zone number (~new observation)
• RGC synapse density increases during the first post-week (known)
• Blocking activity reduces synapse density (known)
• Contralateral eye RGCs for more and larger synapses in the lateral dLGN (known)
• With n=3 and effect sizes smaller than 1 standard deviation, a statistically significant result is about as likely to be a false positive as a true positive.
• A true-positive statistically significant result does is not evidence of a meaningful deviation from a biological model.
Providing plots that show the number of active zones present in boutons across these various conditions is useful. However, I could find no compelling deviation from the above default predictions that would influence how I see the role of mAZs in activity dependent eye-specific segregation.
Below are critiques of most of the claims of the manuscript.
Claim (abstract): individual retinogeniculate boutons begin forming multiple nearby presynaptic active zones during the first postnatal week.
Confirmed by data.
Claim (abstract): the dominant-eye forms more numerous mAZ contacts,
Misleading: The dominant-eye (by definition) forms more contacts than the non-dominant eye. That includes mAZ.
Claim (abstract): At the height of competition, the non-dominant-eye projection adds many single active zone (sAZ) synapses
Weak: While the individual observation is strong, it is a surprising deviation based on a single n=3 experiment in a study that performed twelve such experiments (six ages, mutant/wildtype, sAZ/mAZ)
Claim (abstract): Together, these findings reveal eye-specific differences in release site addition during synaptic competition in circuits essential for visual perception and behavior.
False: This claim is unambiguously false. The above findings, even if true, do not argue for any functional significance to active zone clustering.
Claim (line 84): "At the peak of synaptic competition midway through the first postnatal week, the non-dominant-eye formed numerous sAZ inputs, equalizing the global synapse density between the two eyes"
Weak: At one of twelve measures (age, bouton type, genotype) performed with 3 mice each, one density measure was about twice as high as expected.
Claim (line 172): "In WT mice, both mAZ (Fig. 3A, left) and sAZ (Fig. 3B, left) inputs showed significant eye-specific volume differences at each age."
Questionable: There appears to be a trend, but the size and consistency is unclear.
Claim (line 175): "the median VGluT2 cluster volume in dominant-eye mAZ inputs was 3.72 fold larger than that of non-dominant-eye inputs (Fig. 3A, left)."
Cherry picking. Twelve differences were measured with an n of 3, 3 each time. The biggest difference of the group was cited. No analysis is provided for the range of uncertainty about this measure (2.5 standard deviations) as an individual sample or as one of twelve comparisons.
Claim (line 174): "In the middle of eye-specific competition at P4 in WT mice, the median VGluT2 cluster volume in dominant-eye mAZ inputs was 3.72 fold larger than that of non-dominant-eye inputs (Fig. 3A, left). In contrast, β2KO mice showed a smaller 1.1 fold difference at the same age (Fig. 3A, right panel). For sAZ synapses at P4, the magnitudes of eye-specific differences in VGluT2 volume were smaller: 1.35-fold in WT (Fig. 3B, left) and 0.41-fold in β2KO mice (Fig. 3B, right). Thus, both mAZ and sAZ input size favors the dominant eye, with larger eye-specific differences seen in WT mice (see Table S3)."
No way to judge the reliability of the analysis and trivial conclusion: To analyze effect size the authors choose the median value of three measures (whatever the middle value is). They then make four comparisons at the time point where they observed the biggest difference in favor of their hypothesis. There is no way to determine how much we should trust these numbers besides spending time with the mislabeled scatter plots. The authors then claim that this analysis provides evidence that there is a difference in vGluT2 cluster volume between dominant and non-dominant RGCs and that that difference is activity dependent. The conclusion that dominant axons have bigger boutons and that mutants that lack the property that would drive segregation would show less of a difference is very consistent with the literature. Moreover, there is no context provided about what 1.35 or 1.1 fold difference means for the biology of the system.
Claim (189): "This shows that vesicle docking at release sites favors the dominant-eye as we previously reported but is similar for like eye type inputs regardless of AZ number."
Contradicts core claim of manuscript: Consistent with previous literature, there is an activity dependent relative increase in vGlut2 clustering of dominant eye RGCs. The new information is that that activity dependence is more or less the same in sAZ and mAZ. The only plausible alternative is that vGlut2 scaling only increases in mAZ which would be consistent with the claims of their paper. That is not what they found. To the extent that the analysis presented in this manuscript tests a hypothesis, this is it. The claim of the title has been refuted by figure 3.
Claim (line 235): "For the non-dominant eye projection, however, clustered mAZ inputs outnumbered clustered sAZ inputs at P4 (Fig. 4C, bottom left panel), the age when this eye adds sAZ synapses (Fig. 2C)."
Misleading: The overwhelming trend across 24 comparisons is that the sAZ clustering looks like mAZ clustering. That is the objective and unambiguous result. Among these 24 underpowered tests (n=3), there were a few p-values < 0.05. The authors base their interpretation of cell behavior on these crossings.
Claim (line 328): "The failure to add synapses reduced synaptic clustering and more inputs formed in isolation in the mutants compared to controls."
Trivially true: Density was lower in mutant.
Claim (line 332): "While our findings support a role for spontaneous retinal activity in presynaptic release site addition and clustering..."
Not meaningfully supported by evidence: I could not find meaningful differences between WT and mutant beside the already known dramatic difference in synapse density.
-
Reviewer #2 (Public review):
Summary:
In this manuscript, Zhang and Speer examine changes in the spatial organization of synaptic proteins during eye specific segregation, a developmental period when axons from the two eyes initially mingle and gradually segregate into eye-specific regions of the dorsal lateral geniculate. The authors use STORM microscopy and immunostain presynaptic (VGluT2, Bassoon) and postsynaptic (Homer) proteins to identify synaptic release sites. Activity-dependent changes of this spatial organization are identified by comparing the β2KO mice to WT mice. They describe two types of synapses based on Bassoon clustering: the multiple active zone (mAZ) synapse and single active zone (sAZ) synapse. In this revision, the authors have added EM data to support the idea that mAZ synapses represent boutons with multiple …
Reviewer #2 (Public review):
Summary:
In this manuscript, Zhang and Speer examine changes in the spatial organization of synaptic proteins during eye specific segregation, a developmental period when axons from the two eyes initially mingle and gradually segregate into eye-specific regions of the dorsal lateral geniculate. The authors use STORM microscopy and immunostain presynaptic (VGluT2, Bassoon) and postsynaptic (Homer) proteins to identify synaptic release sites. Activity-dependent changes of this spatial organization are identified by comparing the β2KO mice to WT mice. They describe two types of synapses based on Bassoon clustering: the multiple active zone (mAZ) synapse and single active zone (sAZ) synapse. In this revision, the authors have added EM data to support the idea that mAZ synapses represent boutons with multiple release sites. They have also reanalyzed their data set with different statistical approaches.
Strengths:
The data presented is of good quality and provides an unprecedented view at high resolution of the presynaptic components of the retinogeniculate synapse during active developmental remodeling. This approach offers an advance to the previous mouse EM studies of this synapse because of the CTB label allows identification of the eye from which the presynaptic terminal arises.
Weaknesses:
While the interpretation of this data set is much more grounded in this second revised submission, some of the authors' conclusions/statements still lack convincing supporting evidence. In particular, the data does not support the title: "Eye-specific active zone clustering underlies synaptic competition in the developing visual system". The data show that there are fewer synapses made for both contra- and ipsi- inputs in the β2KO mice-- this fact alone can account for the differences in clustering. There is no evidence linking clustering to synaptic competition. Moreover, the findings of differences in AZ# or distance between AZs that the authors report are quite small and it is not clear whether they are functionally meaningful.
-
Reviewer #3 (Public review):
This study is a follow-up to a recent study of synaptic development based on a powerful data set that combines anterograde labeling, immunofluorescence labeling of synaptic proteins, and STORM imaging (Cell Reports, 2023). Specifically, they use anti-Vglut2 label to determine the size of the presynaptic structure (which they describe as the vesicle pool size), anti-Bassoon to label active zones with the resolution to count them, and anti-Homer to identify postsynaptic densities. Their previous study compared the detailed synaptic structure across the development of synapses made with contra-projecting vs. ipsi-projecting RGCs and compared this developmental profile with a mouse model with reduced retinal waves. In this study, they produce a new detailed analysis on the same data set in which they classify …
Reviewer #3 (Public review):
This study is a follow-up to a recent study of synaptic development based on a powerful data set that combines anterograde labeling, immunofluorescence labeling of synaptic proteins, and STORM imaging (Cell Reports, 2023). Specifically, they use anti-Vglut2 label to determine the size of the presynaptic structure (which they describe as the vesicle pool size), anti-Bassoon to label active zones with the resolution to count them, and anti-Homer to identify postsynaptic densities. Their previous study compared the detailed synaptic structure across the development of synapses made with contra-projecting vs. ipsi-projecting RGCs and compared this developmental profile with a mouse model with reduced retinal waves. In this study, they produce a new detailed analysis on the same data set in which they classify synapses into "multi-active zone" vs. "single-active zone" synapses and assess the number and spacing of these synapses. The authors use measurements to make conclusions about the role of retinal waves in the generation of same-eye synaptic clusters. The authors interpret these results as providing insight into how neural activity drives synapse maturation, the strength of their conclusions is not directly tested by their analysis.
Strengths:
This is a fantastic data set for describing the structural details of synapse development in a part of the brain undergoing activity-dependent synaptic rearrangements. The fact that they can differentiate the eye of origin is what makes this data set unique over previous structural work. The addition of example images from the EM dataset provides confidence in their categorization scheme.
Weaknesses:
Though the descriptions of single vs multi-active zone synapses are important and represent a significant advance, the authors continue to make unsupported conclusions regarding the biological processes driving these changes. Although this revision includes additional information about the populations tested and the tests conducted, the authors do not address the issue raised by previous reviews. Specifically, they provide no assessment of what effect size represents a biologically meaningful result. For example, a more appropriate title is "The distribution of eye-specific single vs multi-active zone is altered in mice with reduced spontaneous activity" rather than concluding that this difference in clustering is somehow related to synaptic competition. Of course, the authors are free to speculate, but many of the conclusions of the paper are not supported by their results.
-
Author response:
The following is the authors’ response to the previous reviews
Reviewer #1 (Public review)
Summary:
This manuscript addresses the question of whether spontaneous activity contributes to the clustering of retinogeniculate synapses before eye opening. The authors re-analyze a previously published dataset to answer the question. The authors conclude that synaptic clustering is eye-specific and activity dependent during the first postnatal week. While there is useful information in this manuscript, I don't see how the data meaningfully supports the claims made about clustering.
In adult retinogeniculate connections, functionally specificity is supported by select pairings of retinal ganglion cells and thalamocortical cells forming dozens of synaptic connections in subcellular microcircuits called glomeruli. In this …
Author response:
The following is the authors’ response to the previous reviews
Reviewer #1 (Public review)
Summary:
This manuscript addresses the question of whether spontaneous activity contributes to the clustering of retinogeniculate synapses before eye opening. The authors re-analyze a previously published dataset to answer the question. The authors conclude that synaptic clustering is eye-specific and activity dependent during the first postnatal week. While there is useful information in this manuscript, I don't see how the data meaningfully supports the claims made about clustering.
In adult retinogeniculate connections, functionally specificity is supported by select pairings of retinal ganglion cells and thalamocortical cells forming dozens of synaptic connections in subcellular microcircuits called glomeruli. In this manuscript, the authors measure whether the frequency of nearby synapses is higher in the observed data than in a model where synapses are randomly distributed throughout the volume. Any real anatomical data will deviate from such a model. The interesting biological question is not whether a developmental state deviates from random. The interesting question is how much of the adult clustering occurs before eye opening. In trying to decode the analysis in this manuscript, I can't tell if the answer is 99% or 0.001%.
We thank the reviewer for their helpful critique through both rounds of review. We have refocused the manuscript on paired eye-specific measurements of active zone addition and spatial relationships among active zones at each age. All effect sizes and power values for each comparison are now reported in Table S2. These measures allow readers to gauge biological significance more transparently.
Strengths:
The source dataset is high resolution data showing the colocalization of multiple synaptic proteins across development. Added to this data is labeling that distinguishes axons from the right eye from axons from the left eye. The first order analysis of this data showing changes in synapse density and in the occurrence of multi-active zone synapses is useful information about the development of an important model system.
Weaknesses:
I don't think the analysis of clustering within this dataset improves our understanding of how the system works. It is possible that the result is clear to the authors based on looking at the images. As a reader trying to interpret the analysis, I ran into the following problems:
• It is not possible to estimate biologically meaningful effect sizes from the data provided. Spontaneous activity in the post natal week could be responsible for 99% or 0.001% of RGC synapse clustering.
• The sample size is too small for the kinds of comparisons being made. The authors point out that many STORM studies use an n of 1 while the authors have n = 3 for each of their six experimental groups. However, the critical bit is what kinds of questions you are trying to answer with a given sample size. This study depends on determining whether the differences between groups are due to age, genotype, or individual variation. This study also makes multiple comparisons of many different noisy parameters that test the same or similar hypothesis. In this context, it is unlikely that n = 3 sufficiently controls for individual variation.
We have revised the manuscript to focus on eye-specific differences, which are paired measurements collected at each age. We have measured effect sizes and performed power tests for all comparisons presented in the manuscript. These measurements are shown for every figure in a new supplemental table S2.
• There is no clear biological interpretation of the core measure of the publication, the normalized clustering index. The normalized clustering index starts with counting the fraction of single active zone synapses within various distances to the edge of synapses. This frequency is compared to a randomization model in which the positions of synapses are randomized throughout a volume. The authors found that the biggest deviation between the observed and randomized proximity frequency using a distance threshold of 1.5 um. They consider the deviation from the random model to be a sign of clustering. However, two RGC synapses 1.5 um apart have a good chance of coming from the same RGC axon. At this scale, real observations will, therefore, always look more clustered than a model where synapses are randomly placed in a volume. If you randomly place synapses on an axon, they will be much closer together than if you randomly place synapses within a volume. The authors normalize their clustering measure by dividing by the frequency of clustering in the normalized model. That makes the measure of clustering an ambiguous mix of synapse clustering, axon morphology, and synaptic density.
We have removed the “normalized clustering index”. “Clustered” inputs are now defined strictly as those that have a neighboring single active-zone (sAZ) synapse within 1.5 mm. For each type of input (sAZ and mAZ) we show 1) the ratio of clustered to isolated inputs for both eyes, and 2) the number of neighboring sAZs (Figure 4).
We agree with the reviewer that many synapses are likely made nearby along the same axon from an individual RGC. In this scenario, sAZ synapses that are nearby a neighboring mAZ input may be part of the same nascent bouton. And, sAZ synapses nearby other sAZ neighbors may ultimately mature into a mAZ input. At the same time, inputs from one RGC may form nearby other inputs from neighboring RGCs. We discuss these motifs and potential mechanisms of cell-autonomous and non-autonomous development (Lines 300-308).
• Other measures are also very derived. For instance, one argument is based on determining that the cumulative distribution of the distance of dominant-eye multi-active zone synapses with nearby single-active zone synapses from dominant-eye multi-active zone synapses is statistically different from the cumulative distribution of the distance of dominant-eye multi-active zones without nearby single-active zone synapses from dominant-eye multi-active zones. Multiple permutations of this measure are compared.
We have simplified the presentation to show all measured path lengths for every input. This allows the reader to see each of the inputs and their relative distances. We present these data for like-eye type interactions at P4 and P8 (Figures 5 and S5).
• There are major biological differences between groups that are difficult to control for. Between P2, P4, and P8, there are changes in cell morphology and synaptic density. There are also large differences in synapse density between wild type and KO mice. It is difficult to be confident that these differences are not responsible for the relatively subtle changes in clustering indices.
• Many claims are based on complicated comparisons between groups rather than the predominating effects within the data. It is noted that: "In KO mice, dominant eye projections showed increased clustering around mAZ synapses compared to sAC synapses suggesting partial maintenance of synaptic clustering despite retinal wave defects". In contrast, I did not notice any discussion of the fact that the most striking trend in those measures is that the clustering index decreases from P2 to P8.
Related to the points above, we have revised the manuscript to focus on eye-specific release site addition and spatial relationships. For clarity, we have removed the clustering index and instead present ratios of clustered and isolated inputs, the number of sAZ synapses near each input type, and distance between like-eye mAZ inputs (Figure 4).
• Statistics are improperly applied. In my first review I tried to push the authors to calculate confidence intervals for two reasons. First, I believed the reader should be able to answer questions such as whether 99% or 0.01% of RGC synaptic clustering occurred in the first postnatal week. Second, I wanted the authors to deal with the fact that n=3 is underpowered for many of the questions they were asking. While many confidence intervals can now be found leading up to a claim, it is difficult to find claims that are directly supported by the correct confidence interval. Many claims are still incorrectly based on which combinations of comparisons produced statistically significant differences and which combinations did not.
We have substantially revised the manuscript to focus on within-group paired effects between eye-of-origin. We performed power tests for all statistical presentations and effect sizes and powers are presented for every figure in a new supplemental table S2. To simplify the manuscript and make it easier to read, we report confidence interval measurements in a separate supplemental table S3.
Reviewer #2 (Public review):
Summary:
This study provides a valuable data set showing changes in the spatial organization of synaptic proteins at the retinogeniculate connection during a developmental period of active axonal and synaptic remodeling. The data collected by STORM microscopy is state-of-the-art in terms of the high-resolution view of the presynaptic components of a plastic synapse. The revision has addressed many, but not all, of the initial concerns about the authors interpretation of their data. However, with the revisions, the manuscript has become very dense and difficult to follow.
We greatly appreciate the reviewer’s thoughtful comments through two rounds of review. To improve the clarity of the manuscript, we have substantially revised the work to streamline the narrative, clearly define terminology, and simplify data presentations, allowing readers to more directly interpret results and their implications.
Strengths:
The data presented is of good quality and provides an unprecedented view at high resolution of the presynaptic components of the retinogeniculate synapse during active developmental remodeling. This approach offers an advance to the previous mouse EM studies of this synapse because the CTB label allows identification of the eye from which the presynaptic terminal arises.
Weaknesses:
From these data the authors conclude that eye-specific increase in mAZ synapse density occur over retinogeniculate refinement, that sAZ synapses cluster close to mAZ synapses over age, and that this process depends on spontaneous activity and proximity to eye-specific mAZ synapses. While the interpretation of this data set is much more grounded in this revised submission, some of the authors' conclusions/statements still lack convincing supporting evidence.
This includes:
(1) The conclusion that multi-active zone synapses are loci for synaptic clustering. This statement, or similar ones (e.g., line 407) suggest that mAZ synapses actively or through some indirect way influence the clustering of sAZ synapses. There is no evidence for this. Clustering of retinal synapses are in part due to the fact that retinal inputs synapse on the proximal dendrites. With increased synaptogenesis, there will be increased density of retinal terminals that are closely localized. And with development, perhaps sAZ synapses mature into mAZ synapses. This scenario could also explain a large part of this data set.
We thank the reviewer for their comment. We have removed the ambiguous phrasing and clarified the manuscript to explicitly discuss alternative interpretations consistent with the results (Lines 300-308). This includes a discussion of sAZ synapse maturation into mAZ inputs (Lines 294-296).
(2) The conclusion that, "clustering depends on spontaneous retinal activity" could be misleading to the reader given that the authors acknowledge that their data is most consistent with a failure of synaptogenesis in the mutant mice (in the rebuttal). Additionally clustering does occur in CTB+ projections around mAZ synapses.
We have removed the highlighted phrase and revised the manuscript to focus on differences in release site addition between eye-of-origin. We clarified our discussion of activity-dependent changes to state that synapses fail to form in the mutant and synaptic clustering was reduced (Lines 324-330).
(3) Line 403: "Since mAZ synapses are expected to have a higher release probability, they likely play an important role in driving plasticity mechanisms reliant on neurotransmission.":What evidence do the authors have that mAZ are expected to have higher release probability?
We thank the reviewer for their careful reading. Because they have several active zones, mAZ synapses are expected to have a higher number of release sites (N), which could be independent of release probability at any individual active zone (Pr). We have removed the reference to release probability. Instead, we maintain focus on active zone number.
Reviewer #3 (Public review):
This study is a follow-up to a recent study of synaptic development based on a powerful data set that combines anterograde labeling, immunofluorescence labeling of synaptic proteins, and STORM imaging (Cell Reports, 2023). Specifically, they use anti-Vglut2 label to determine the size of the presynaptic structure (which they describe as the vesicle pool size), anti-Bassoon to label active zones with the resolution to count them, and anti-Homer to identify postsynaptic densities. Their previous study compared the detailed synaptic structure across the development of synapses made with contra-projecting vs. ipsi-projecting RGCs and compared this developmental profile with a mouse model with reduced retinal waves. In this study, they produce a new detailed analysis on the same data set in which they classify synapses into "multi-active zone" vs. "single-active zone" synapses and assess the number and spacing of these synapses. The authors use measurements to make conclusions about the role of retinal waves in the generation of same-eye synaptic clusters, providing key insight into how neural activity drives synapse maturation.
Strengths:
This is a fantastic data set for describing the structural details of synapse development in a part of the brain undergoing activity-dependent synaptic rearrangements. The fact that they can differentiate eye of origin is what makes this data set unique over previous structural work. The addition of example images from EM data set provides confidence in their categorization scheme.
Weaknesses:
Though the descriptions of synaptic clusters are important and represent a significant advance, the authors conclusions regarding the biological processes driving these clusters are not testable by such a small sample. This limitation is expected given the massive effort that goes into generating this data set. Of course the authors are free to speculate, but many of the conclusions of the paper are not statistically supported.
We thank the reviewer for their helpful comments throughout the revision process. We have substantially modified the manuscript to reframe the work around release site addition during eye-specific competition. Power tests and effect size measurements are presented for every figure in a new supplemental table S2.
Reviewer #2 (Recommendations for the authors):
(1) Authors should discuss that it is not clear what the relationship is between sAZ and mAZ, and sAZ could turn into a mAZ. This is not unreasonable that the number of AZ/bouton increases with development given that in the adult rodent retinogeniculate bouton, there is an average of 27 active zones (Budisantoso et al, 2012).
We thank the reviewer for their helpful suggestion. We have added a discussion of the relationship between sAZ and mAZ inputs and the point that sAZ synapses may mature into mAZ synapses (Lines 294-296). We now reference the work of Budisantoso et al., J. Neurosci. 2012.
(2) The authors should clarify how the statistics are calculated for the normalized clustering index (figure 3B, C). For ratios of values each with variance, the variance is summed when calculating SEM.
For clarity, we have removed the normalized clustering index analysis. We have simplified the work to present a clear definition of clustered and unclustered inputs, where clustering is defined by the presence of a nearby neighboring synapse within 1.5mm. We present the ratio of clustered and unclustered inputs for each input type and eye-of-origin. We also show the number of sAZ synapses nearby each clustered input (Figure 4).
(3) The authors have significantly clarified the terminology that they use in the text. This is much appreciated. However, it would be helpful to the naïve reader if they could define their use of the word "synapse" as referring to individual active zones/release sites or to terminals/boutons. For example:
Line 378: "Prior electron microscopy studies in the mouse found limited evidence of convergent synaptic clustering from neighboring RGCs at postnatal day 8 (10, 13), suggesting that the mAZ synapses seen in STORM images are single retinogeniculate terminals. The lack of synaptic convergence in prior EM reconstructions at P8 implies that early clustering around mAZ synapses may result from local output clustering within individual RGC arbors.":
What do the authors mean by "convergent synaptic clustering": do they mean clustering of release sites from different RGC inputs? And what does "local output clustering" mean?
We thank the reviewer for their suggestion to use clear terminology. We have revised the manuscript to define our use of the term “synapse” as a single active zone/release site (Lines 134-136). We refer to mAZ boutons in STORM data as “inputs”. We have revised the discussion of prior EM studies (Lines 130-132) and clarified all discussions of synaptic clustering throughout the work.
(4) While the authors argue that the retina-specific β2-nAChR mice exhibit disrupted retinal waves and defects in eye specific segregation, the authors are studying issues of active zone density which may depend on mechanisms depending on the postsynaptic neuron. This should be acknowledged.
We have updated the text to discuss the fact that postsynaptic mechanisms are also critical for the refinement of eye-specific synapses (Lines 332-340). We have added several additional references to the manuscript accordingly.
Reviewer #3 (Recommendations for the authors):
The authors have addressed many of my original concerns. The additional description of criteria for categorizing synapses, showing all the data points, gives the reader a stronger sense of where the numbers in the quantification come from. Replacing the "complex/simple" distinction with the "multi/single active zone" and the other clarifying text was effective. The addition of the EM data was also a very nice example to help interpret STORM images. It does appear there was no quantification on this EM data set and perhaps just a few example images were taken as "proof of principle". If, by chance, the authors have more EM images to make a data set of them that allows for some quantification, that would be great to add.
We thank the reviewer for their helpful comments on the manuscript through both rounds of review. The EM data we collected were 2D images of a subset of physical sections at postnatal day 8. Most dAPEX2(+) profiles had a single active zone, but a definitive identification would require 3D imaging so that each terminal can be assessed in its entirety for release sites that might be missed in a single cross section. Similarly, multi-active zone boutons are positively identified in 2D images, but definitive measurements of AZ number would require 3D information. We analyzed our 2D EM images and present a plot of dAPEX2(+) profile size versus active zone number below. These measures are positively correlated (r = 0.74), with larger profiles containing more active zones.
Author response image 1.
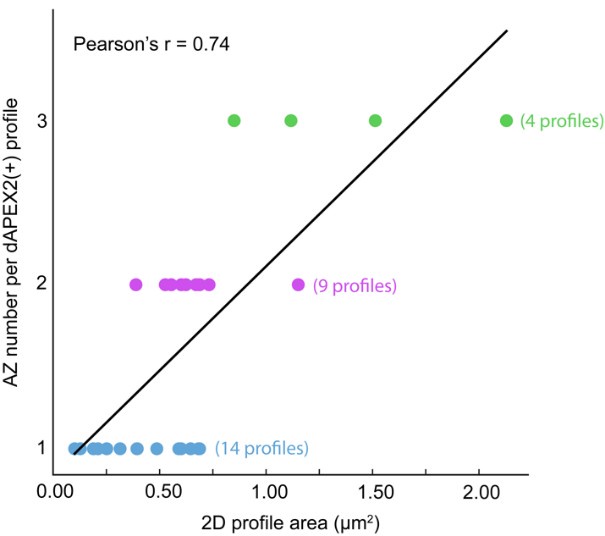
Unfortunately, we are not currently equipped to perform volumetric EM imaging at our home institution and are concerned that analysis of 2D data may be inconclusive. For these reasons, we are opting to maintain a qualitative presentation of our current EM results and we look forward to collaborating with other experts to achieve volumetric EM reconstructions in the future
-
-
eLife Assessment
This is a useful analysis of STORM data that characterizes the clustering of active zones in retinogeniculate terminals across ages and in the absence of retinal waves. The design makes it possible to relate fixed time point structural data to a known outcome of activity-dependent remodeling. However, the evidence is incomplete, weakening the claims the authors make regarding how activity influences the clustering of these synapses.
-
Reviewer #1 (Public review):
Summary:
This manuscript addresses the question of whether spontaneous activity contributes to the clustering of retinogeniculate synapses before eye opening. The authors re-analyze a previously published dataset to answer the question. The authors conclude that synaptic clustering is eye-specific and activity dependent during the first postnatal week. While there is useful information in this manuscript, I don't see how the data meaningfully supports the claims made about clustering.
In adult retinogeniculate connections, functionally specificity is supported by select pairings of retinal ganglion cells and thalamocortical cells forming dozens of synaptic connections in subcellular microcircuits called glomeruli. In this manuscript, the authors measure whether the frequency of nearby synapses is higher in …Reviewer #1 (Public review):
Summary:
This manuscript addresses the question of whether spontaneous activity contributes to the clustering of retinogeniculate synapses before eye opening. The authors re-analyze a previously published dataset to answer the question. The authors conclude that synaptic clustering is eye-specific and activity dependent during the first postnatal week. While there is useful information in this manuscript, I don't see how the data meaningfully supports the claims made about clustering.
In adult retinogeniculate connections, functionally specificity is supported by select pairings of retinal ganglion cells and thalamocortical cells forming dozens of synaptic connections in subcellular microcircuits called glomeruli. In this manuscript, the authors measure whether the frequency of nearby synapses is higher in the observed data than in a model where synapses are randomly distributed throughout the volume. Any real anatomical data will deviate from such a model. The interesting biological question is not whether a developmental state deviates from random. The interesting question is how much of the adult clustering occurs before eye opening. In trying to decode the analysis in this manuscript, I can't tell if the answer is 99% or 0.001%.Strengths:
The source dataset is high resolution data showing the colocalization of multiple synaptic proteins across development. Added to this data is labeling that distinguishes axons from the right eye from axons from the left eye. The first order analysis of this data showing changes in synapse density and in the occurrence of multi-active zone synapses is useful information about the development of an important model system.
Weaknesses:
I don't think the analysis of clustering within this dataset improves our understanding of how the system works. It is possible that the result is clear to the authors based on looking at the images. As a reader trying to interpret the analysis, I ran into the following problems:
• It is not possible to estimate biologically meaningful effect sizes from the data provided. Spontaneous activity in the post natal week could be responsible for 99% or 0.001% of RGC synapse clustering.
• There is no clear biological interpretation of the core measure of the publication, the normalized clustering index. The normalized clustering index starts with counting the fraction of single active zone synapses within various distances to the edge of synapses. This frequency is compared to a randomization model in which the positions of synapses are randomized throughout a volume. The authors found that the biggest deviation between the observed and randomized proximity frequency using a distance threshold of 1.5 um. They consider the deviation from the random model to be a sign of clustering. However, two RGC synapses 1.5 um apart have a good chance of coming from the same RGC axon. At this scale, real observations will, therefore, always look more clustered than a model where synapses are randomly placed in a volume. If you randomly place synapses on an axon, they will be much closer together than if you randomly place synapses within a volume. The authors normalize their clustering measure by dividing by the frequency of clustering in the normalized model. That makes the measure of clustering an ambiguous mix of synapse clustering, axon morphology, and synaptic density.
• Other measures are also very derived. For instance, one argument is based on determining that the cumulative distribution of the distance of dominant-eye multi-active zone synapses with nearby single-active zone synapses from dominant-eye multi-active zone synapses is statistically different from the cumulative distribution of the distance of dominant-eye multi-active zones without nearby single-active zone synapses from dominant-eye multi-active zones. Multiple permutations of this measure are compared.
• The sample size is too small for the kinds of comparisons being made. The authors point out that many STORM studies use an n of 1 while the authors have n = 3 for each of their six experimental groups. However, the critical bit is what kinds of questions you are trying to answer with a given sample size. This study depends on determining whether the differences between groups are due to age, genotype, or individual variation. This study also makes multiple comparisons of many different noisy parameters that test the same or similar hypothesis. In this context, it is unlikely that n = 3 sufficiently controls for individual variation.
• There are major biological differences between groups that are difficult to control for. Between P2, P4, and P8, there are changes in cell morphology and synaptic density. There are also large differences in synapse density between wild type and KO mice. It is difficult to be confident that these differences are not responsible for the relatively subtle changes in clustering indices.
• Many claims are based on complicated comparisons between groups rather than the predominating effects within the data. It is noted that: "In KO mice, dominant eye projections showed increased clustering around mAZ synapses compared to sAC synapses suggesting partial maintenance of synaptic clustering despite retinal wave defects". In contrast, I did not notice any discussion of the fact that the most striking trend in those measures is that the clustering index decreases from P2 to P8.
• Statistics are improperly applied. In my first review I tried to push the authors to calculate confidence intervals for two reasons. First, I believed the reader should be able to answer questions such as whether 99% or 0.01% of RGC synaptic clustering occurred in the first postnatal week. Second, I wanted the authors to deal with the fact that n=3 is underpowered for many of the questions they were asking. While many confidence intervals can now be found leading up to a claim, it is difficult to find claims that are directly supported by the correct confidence interval. Many claims are still incorrectly based on which combinations of comparisons produced statistically significant differences and which combinations did not. -
Reviewer #2 (Public review):
Summary:
This study provides a valuable data set showing changes in the spatial organization of synaptic proteins at the retinogeniculate connection during a developmental period of active axonal and synaptic remodeling. The data collected by STORM microscopy is state-of-the-art in terms of the high-resolution view of the presynaptic components of a plastic synapse. The revision has addressed many, but not all, of the initial concerns about the authors interpretation of their data. However, with the revisions, the manuscript has become very dense and difficult to follow.
Strengths:
The data presented is of good quality and provides an unprecedented view at high resolution of the presynaptic components of the retinogeniculate synapse during active developmental remodeling. This approach offers an advance to …
Reviewer #2 (Public review):
Summary:
This study provides a valuable data set showing changes in the spatial organization of synaptic proteins at the retinogeniculate connection during a developmental period of active axonal and synaptic remodeling. The data collected by STORM microscopy is state-of-the-art in terms of the high-resolution view of the presynaptic components of a plastic synapse. The revision has addressed many, but not all, of the initial concerns about the authors interpretation of their data. However, with the revisions, the manuscript has become very dense and difficult to follow.
Strengths:
The data presented is of good quality and provides an unprecedented view at high resolution of the presynaptic components of the retinogeniculate synapse during active developmental remodeling. This approach offers an advance to the previous mouse EM studies of this synapse because the CTB label allows identification of the eye from which the presynaptic terminal arises.
Weaknesses:
From these data the authors conclude that eye-specific increase in mAZ synapse density occur over retinogeniculate refinement, that sAZ synapses cluster close to mAZ synapses over age, and that this process depends on spontaneous activity and proximity to eye-specific mAZ synapses. While the interpretation of this data set is much more grounded in this revised submission, some of the authors' conclusions/statements still lack convincing supporting evidence.
This includes:(1) The conclusion that multi-active zone synapses are loci for synaptic clustering. This statement, or similar ones (e.g., line 407) suggest that mAZ synapses actively or through some indirect way influence the clustering of sAZ synapses. There is no evidence for this. Clustering of retinal synapses are in part due to the fact that retinal inputs synapse on the proximal dendrites. With increased synaptogenesis, there will be increased density of retinal terminals that are closely localized. And with development, perhaps sAZ synapses mature into mAZ synapses. This scenario could also explain a large part of this data set.
(2) The conclusion that, "clustering depends on spontaneous retinal activity" could be misleading to the reader given that the authors acknowledge that their data is most consistent with a failure of synaptogenesis in the mutant mice (in the rebuttal). Additionally clustering does occur in CTB+ projections around mAZ synapses.
(3). Line 403: "Since mAZ synapses are expected to have a higher release probability, they likely play an important role in driving plasticity mechanisms reliant on neurotransmission.":What evidence do the authors have that mAZ are expected to have higher release probability?
-
Reviewer #3 (Public review):
This study is a follow-up to a recent study of synaptic development based on a powerful data set that combines anterograde labeling, immunofluorescence labeling of synaptic proteins, and STORM imaging (Cell Reports, 2023). Specifically, they use anti-Vglut2 label to determine the size of the presynaptic structure (which they describe as the vesicle pool size), anti-Bassoon to label active zones with the resolution to count them, and anti-Homer to identify postsynaptic densities. Their previous study compared the detailed synaptic structure across the development of synapses made with contra-projecting vs. ipsi-projecting RGCs and compared this developmental profile with a mouse model with reduced retinal waves. In this study, they produce a new detailed analysis on the same data set in which they classify …
Reviewer #3 (Public review):
This study is a follow-up to a recent study of synaptic development based on a powerful data set that combines anterograde labeling, immunofluorescence labeling of synaptic proteins, and STORM imaging (Cell Reports, 2023). Specifically, they use anti-Vglut2 label to determine the size of the presynaptic structure (which they describe as the vesicle pool size), anti-Bassoon to label active zones with the resolution to count them, and anti-Homer to identify postsynaptic densities. Their previous study compared the detailed synaptic structure across the development of synapses made with contra-projecting vs. ipsi-projecting RGCs and compared this developmental profile with a mouse model with reduced retinal waves. In this study, they produce a new detailed analysis on the same data set in which they classify synapses into "multi-active zone" vs. "single-active zone" synapses and assess the number and spacing of these synapses. The authors use measurements to make conclusions about the role of retinal waves in the generation of same-eye synaptic clusters, providing key insight into how neural activity drives synapse maturation.
Strengths:
This is a fantastic data set for describing the structural details of synapse development in a part of the brain undergoing activity-dependent synaptic rearrangements. The fact that they can differentiate eye of origin is what makes this data set unique over previous structural work. The addition of example images from EM data set provides confidence in their categorization scheme.
Weaknesses:
Though the descriptions of synaptic clusters are important and represent a significant advance, the authors conclusions regarding the biological processes driving these clusters are not testable by such a small sample. This limitation is expected given the massive effort that goes into generating this data set. Of course the authors are free to speculate, but many of the conclusions of the paper are not statistically supported.
-
Author response:
The following is the authors’ response to the previous reviews.
Reviewer #1 (Public Review):
This publication applies 3D super-resolution STORM imaging to understanding the role of developmental neural activity in the clustering of retinal inputs to the mouse dorsal lateral geniculate nucleus (dLGN). The authors argue that retinal ganglion cell (RGC) synaptic boutons start forming clusters early in postnatal development (P2). They then argue that these clusters contribute to eye-specific segregation of retinal inputs by activity-dependent stabilization of nearby boutons from the same eye. The data provided is N=3 animals for each condition of P2, P4, and P8 animals in wild-type mice and in mice where early patterns of structured retinal activity are blocked.
Strengths:
The 3D storm imaging of pre and postsynaptic …
Author response:
The following is the authors’ response to the previous reviews.
Reviewer #1 (Public Review):
This publication applies 3D super-resolution STORM imaging to understanding the role of developmental neural activity in the clustering of retinal inputs to the mouse dorsal lateral geniculate nucleus (dLGN). The authors argue that retinal ganglion cell (RGC) synaptic boutons start forming clusters early in postnatal development (P2). They then argue that these clusters contribute to eye-specific segregation of retinal inputs by activity-dependent stabilization of nearby boutons from the same eye. The data provided is N=3 animals for each condition of P2, P4, and P8 animals in wild-type mice and in mice where early patterns of structured retinal activity are blocked.
Strengths:
The 3D storm imaging of pre and postsynaptic elements provides convincing high-resolution localization of synapses.
The experimental design of comparing ipsilateral and contralateral RGC axon boutons in a region of the dLGN that is known to become contralateral is elegant. The design makes it possible to relate fixed time point structural data to a known outcome of activity-dependent remodeling.
Weaknesses:
Based on previous literature, it is known that synapse density, synapse clustering, and synaptic specificity increase during postnatal development. Previous work has also shown that both the changes in synaptic clustering and synaptic specificity are affected by retinal activity. The data and analysis provided by the authors add little unambiguous evidence that advances this understanding.
We agree with the reviewer that previous literature shows that synapse density, synapse clustering, and synaptic specificity increase during postnatal development and that these processes are affected by retinal activity. The majority of studies on synaptic refinement have been performed after eye-opening, when eye-specific segregation is already complete. In contrast, most studies of eye-specific segregation focus on axonal refinement phenotypes. To our knowledge, only a small number of experiments have examined retinogeniculate synaptic properties at the nanoscale during eye-specific segregation (1-4). Our broad goal is to understand the mechanisms of synaptogenesis and competition at the earliest stages of eye-specific refinement, when spontaneous retinal activity is a major driver of activity-dependent remodeling. We hope that readers will appreciate that there is still much to discover in this fascinating model system of synaptic competition.
General problem 1: Most of the statistical analysis is limited to ANOVA comparison of axons from the contralateral and ipsilateral retina in the contralateral dLGN. The hypothesis that ipsilateral and contralateral axons would be statistically identical in the contralateral dLGN is not a plausible hypothesis so rejecting the hypothesis with P < X does not advance the authors' arguments beyond what was already known.
General problem 2: Most of the interpretation of data is qualitative. While error bars are provided, these error bars are not used to draw conclusions. Given the small sample size (N=3), there is a large degree of uncertainty regarding the magnitude of changes (synapse size, number, specificity). The authors base their conclusions on the averages of these values when the likely degree of uncertainty could allow for the opposite interpretation.
We appreciate the reviewer’s concerns regarding the use of ANOVA for statistical testing in the original submission. We have generated new figures that show confidence intervals for each analysis in the manuscript and these are included in the response to reviewers document below. To address the underlying concern that our N=3 sample size limits the interpretation of our results, we have revised the manuscript to be cautious in our interpretations and to discuss additional possibilities that are consistent with the anatomical data.
General problem 3: Two of the four results sections depend on using the frequency of single active zone vGlut2 clusters near multiple active zone vGlut2 as a proxy for synaptic stabilization of the single active zone vGlut2 clusters by the multiple active zone vGlut2 clusters. The authors argue that the increased frequency of same-eye single active zone clusters relative to opposite-eye single active zone clusters means that multiple active zone vGlut2 clusters are selectively stabilizing single active zone clusters. There are other plausible explanations for this observation that are not eliminated. An increased frequency of nearby single active zone clusters would also occur if RGC axons form more than one synapse in the dLGN. Eye-specific segregation is, by definition, a relative increase in the frequency of nearby boutons from the same eye. The authors were, therefore, guaranteed to observe a non-random relationship between boutons from the same eye. The authors do compare their measures to a random model, but I could not find a description of the model. I would expect that the model would need to account for RGC arbor size, arbor structure, bouton number, and segregation independent of multi-active-zone vGlut2 clusters. The most common randomization for the type of analysis described here, a shift in the positions of single-active zone boutons, would not be adequate.
In discussing the claimed cluster-induced stabilization of nearby boutons, the authors state that the specificity increases with age due to activity-dependent refinement. Their quantification does not support an increase in specificity with age. In fact, the high degree of clustering "specificity" they observe at P2 argues for the trivial same axon explanation.We agree with the reviewer that individual RGC axons form multiple synapses and that, over time, eye-specific segregation must increase the frequency of like-eye synapses relative to opposite-eye synapses. Indeed, our previous study of eye-specific refinement showed that at P8, the density of eye-specific inputs had increased for the dominant-eye and decreased for the non-dominant-eye (1). However, at postnatal day 4, contralateral and ipsilateral input densities were the same in the future contralateral-eye territory. One of our goals in this study was to determine if the process of synaptic clustering begins at these earliest stages of synaptic competition and, if so, whether it is influenced by retinal wave activity. It is plausible that the RGC axons from the same eye could initially form synapses randomly and, at some later stage, synapses may be selectively added to produce mature glomeruli. Consistent with this possibility, previous analysis of JAM-B RGC axon refinement showed the progressive clustering of axonal boutons at later stages of development after eye-specific segregation (5).
Regarding the randomization that we employed, we performed a repositioning of synapse centroids within the volume of the neuropil after accounting for neuronal soma volumes and edge effects. We agree that this type of randomization cannot account for the fine scale structure of axons and dendrites, which we did not have access to in this four-color volumetric super-resolution data set. To address this, we have performed additional clustering analyses surrounding both single-active zone and multi-active zone synapses. This new analysis showed that there is a modest clustering effect around single-active zone synapses compared to complete randomization described above. We now present this information using a normalized clustering index for direct comparison of clustering between multi-active zone and single-active zone synapses. We have measured effect sizes and confidence intervals, which we present in point-by-point responses below. We have restructured the manuscript figures and discussion to provide a balanced interpretation of our results and the limitations of our study.
Analysis of specific claims:
Result Section 1
Most of the figures show mean, error bars, and asterisks, but not the three data points from which these statistics are derived. Large changes in variance from condition to condition suggest that displaying the data points would provide more useful information.
We thank the reviewer for their suggestion. We have updated all figures to display the means of all biological replicates as individual data points.
Claim 1: Contralateral density increases more than ipsilateral in the contralateral region over the course of development. This claim is supported by the qualitative comparison of means and error bars in Figure 2D. The argument could be made quantitative by providing a confidence interval for synapse density increase for dominant and non-dominant synapse density. A confidence interval could then be generated for the difference in this change between the two groups. Currently, the most striking effect is a big difference in variance between P4 and P8 for dominant eye complex synapses. Given that N=3, I assume there is one extreme outlier here.
We appreciate the comment and believe the reviewer was referring to the data presented in the original Figure 1D, rather than Figure 2D.
We agree with the reviewer that our comment on the change in synapse density across ages was not quantitatively supported by the figure as we did not perform a proper age-wise statistical comparison. We have removed this claim in the revised manuscript.
We also appreciate the suggestions to clarify the presentation of our statistical analyses and to utilize confidence interval measurements wherever possible. We present Author response image 1 below, showing the density of multi-AZ synapses in the contralateral-eye territory over time (P2-P8), for both CTB(+) contralateral (black) and CTB(-) ipsilateral inputs (red) featuring 5/95% confidence intervals:
Author response image 1.
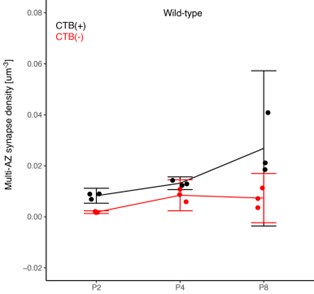
More broadly, the reviewer has raised the concern that the low number of biological replicates (N=3) presents challenges in the use of ANOVA for statistical testing. We agree with the concern and have revised the manuscript to be cautious in our statistical tests and resulting claims. We have chosen to use paired T-tests to compare measurements of eye-specific synapse properties because these measurements were always made within each individual biological replicate (paired measurements). Below, we discuss our logic for this change and the effects on the results we present in the revised manuscript.
Considering the above image:
(1) ANOVA: In our initial submission, we used an ANOVA test which showed P<0.05 for the CTB(+) P4 vs. P8 comparison above, leading to our statement about an age-dependent increase in multi-AZ density. However, the figure above shows that P8 data has higher variance. Thus, the homogeneity of variance assumption of ANOVA may lead to false positives in this comparison.
(2) Confidence interval for N=3: We calculated confidence intervals for P4 and P8 data (5/95% CI shown above). Overlap between the two groups indicates the true mean values of the two groups could be identical. However, the P8 confidence intervals (as well as other confidence intervals across other comparisons in the manuscript) also include the value of 0. This indicates there actually might be no multi-active zone synapses in the mouse dLGN. The failure arises because the low number of biological replicates (N=3 data points) precludes a reliable confidence interval measurement. CI measurements require sufficient sample sizes to determine the true population variance.
(3) Difficulty in achieving sufficient sample sizes for CI analysis in ultrastructural studies of the brain: volumetric STORM experiments are technically complex and make use of sample preparation and analysis methods that are similar to volumetric electron microscopy (physical ultrathin sectioning and computational 3D stack alignment). For these technical reasons, it is difficult to collect imaging data from >10 mice for each group of data (e.g. age and tissue location) in one single project. Because of the technical challenges, most ultrastructural studies published to date present results from single biological replicates. In our STORM dataset, we collected imaging data of N=3 biological replicates for each age and genotype. We agree that in the future the collection of additional replicates will be important for improving the reliability of statistical comparisons in super-resolution and electron-microscopy studies. Continued advances in the throughput of imaging/analysis should help to make this easier over time.
(4) The use of paired T-tests: In this study, we have eye-specific CTB(+) and CTB(-) synapse imaging data from the same STORM fields within single biological replicates. When there is only one measurement from each replicate (e.g. synapse density, ratio of total synapses), using paired tests to compare these groups increases statistical power and does not assume similar variance. However, this limits our analysis to comparisons within each age, and not between ages. Accordingly, we have revised our discussion of the results and interpretations throughout the manuscript. When there are thousands of measurements of synapses from each replicate (e.g. Figure 2A-B on synapse volumes), we use a mixed linear model to analyze the variance. In the revised figures we present the results using standard error of the mean and link measurements from within the same individual replicates to show the paired data structure. In cases where specific comparisons are made across ages, we present 5/95% confidence interval measurements.
Claim 2: The fraction of multiple-active zone vGlut2 clusters increases with age. This claim is weakly supported by a qualitative reading of panel 1E. The error bars overlap so it is difficult to know what the range of possible increases could be. In the text, the authors report mean differences without confidence intervals (or any other statistics). The reported results should, therefore, be interpreted as a description of their three mice and not as evidence about mice in general.
We appreciate the reviewer’s concern that statistical accuracy of our synapse density comparisons over age is limited by the small sample size as discussed above. We have removed all strong claims about age-dependent changes in the density of multi-active zone and single-active zone synapses. Instead, we focus our analyses on comparisons between CTB(+) and CTB(-) synapse measurements, which are paired within each biological replicate. To specifically address the reviewer’s concern about figure panel 1E, we present Author response image 2 with confidence intervals below.
Author response image 2.
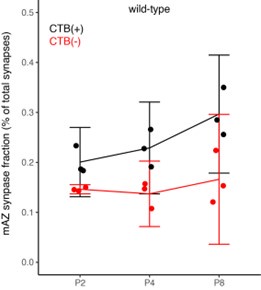
Figure S1. Panel A makes the point that the study could not be done without STORM by comparing the STORM images to "Conventional" images. The images are over-saturated low-resolution images. A reasonable comparison would be to a high-quality quality confocal image acquired with a high NA objective (~1.4) and low laser power (PSF ~ 0.2 x 0.2 x 0.6 um) that was acquired over the same amount of time it takes to acquire a STORM volume.
We agree with the reviewer that the presentation of low-resolution conventional images is not necessary. We have deleted the panel and modified the text accordingly.
Result section 2.
Claim 1: The ipsi/contra (in contra LGN) difference in VGluT2 cluster volume increases with development. While there are many p-values listed, the main point is not directly quantified. A reasonable way to quantify the relative increase in volume could be in the form: the non-dominant volumes were 75%-95%(?) of the dominant volume at P2 and 60%-80% (?) at P8. The difference in change was -5 to 15%(?).
We thank the reviewer for their helpful suggestion to improve the clarity of the results presented in this analysis of eye-specific synapse volumes. In our original report, we found differences in eye-specific VGluT2 volume at each time point (P2/P4/P8) in control mice (1). The original measurements used the entire synapse population. Here, we aimed to determine whether eye-specific differences in VGluT2 volumes were present for both multi-AZ synapses and single-AZ synapses, and whether one population may have a greater contribution to the previous population measurement that we reported. We found that at P4 (a time when the overall eye-specific synapse density is equivalent for both eyes in the dLGN), WT multi-AZ synapses showed a greater difference (372%) in eye-specific VGluT2 volume compared with single-AZ synapses (135%). In β2KO mice multi-AZ synapses showed a greater difference (110%) in eye-specific VGluT2 volume compared with single-AZ synapses (41%). In our initial manuscript submission, we included statistical comparisons of eye-specific volume differences across ages, but we did not highlight these differences in our discussion of the results. For clarity, we have removed all statistical comparisons across ages in the revised manuscript. We have modified the text to focus on eye-specific VGluT2 volume differences at P4 described above. To specifically address the reviewer’s question, we provide the percentage differences between multi- and single-AZ eye-specific synapses for each age/genotype below:
Author response table 1.
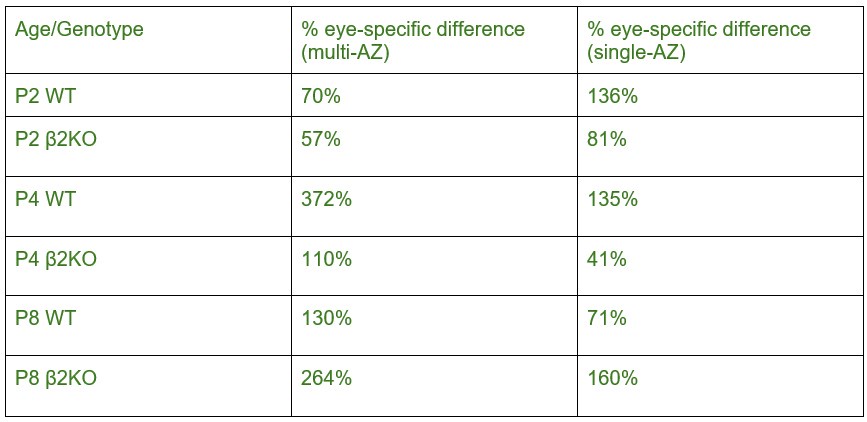
Claim 2: Complex synapses (vGlut2 clusters with multiple active zones) represent clusters of simple synapses and not single large boutons with multiple active zones. The authors argue that because vGlut2 cluster volume scales roughly linearly with active zone number, the vGlut2 clusters are composed of multiple boutons each containing a single active zone. Their analysis does not rule out the (known to be true) possibility that RGC bouton sizes are much larger in boutons with multiple active zones. The correlation of volume and active zone number, by itself, does not resolve the issue. A good argument for multiple boutons might be that the variance is smallest in clusters with 4 active zones (looks like it in the plot) since they would be the average of four active zones to vesicle pool ratios. It is very likely that the multi-active zone vGlut2 clusters represent some clustering and some multi-synaptic boutons. The reference cited by the authors as evidence for the presence of single active zone boutons in young tissue does not rule out the existence of multiple active zone boutons.
We agree with the reviewer’s comments on the challenges of classifying multi-active zone synapses in STORM images as single terminals versus aggregates of terminals. To help address this, we have performed electron microscopy imaging of genetically labeled RGC axons and identified the existence of single retinogeniculate terminals with multiple active zones. Our EM imaging was limited to 2D sections and does not rule out the clustering of small, single- active zone synapses within 3D volumes. Future volumetric EM reconstructions will be informative for this question. We have significantly updated the figures and text to discuss the new results and provide a careful interpretation of the nature of multi-AZ synapses in STORM imaging data.
Several arguments are made that depend on the interpretation of "not statistically significant" (n.s.) meaning that "two groups are the same" instead of "we don't know if they are different". This interpretation is incorrect and materially impacts the conclusions.
Several arguments are made that interpret statistical significance for one group and a lack of statistical significance for another group meaning that the effect was bigger in the first group. This interpretation is incorrect and materially impacts the conclusions.
We thank the reviewer for raising these concerns. We have extensively revised the manuscript text to report the data in a more precise way without overinterpreting the results. All references to “N.S.” and associated conclusions have been either removed or substantiated with 5/95% confidence interval testing.
Result Section 3.
Claim 1: Complex synapses stabilize simple synapses. There are alternative explanations (mentioned above) for the observed clustering that negate the conclusions. 1) Boutons from the same axon tend to be found near one another. 2) Any form of eye-specific segregation would produce non-random associations in the analysis as performed. The authors compare each observation to a random model, but I cannot determine from the text if the model adequately accounts for alternative explanations.
We thank the reviewer for their suggestion to consider alternative explanations for our results. We agree that our study does not provide direct molecular mechanistic data demonstrating synaptic stabilization effects. We have significantly revised the manuscript to be more cautious in our interpretations and specifically address alternative biological mechanisms that are consistent with the non-random arrangement of retinogeniculate synapses in our data.
We agree with the reviewer that individual RGC axons form multiple synapses, however, nascent synapses might not always form close together. If synapses are initially added randomly within RGC axons, eye-specific segregation may conclude with a still-random pattern of dominant-eye inputs. At some later stage, synapses may be selectively refined to produce mature glomeruli. Consistent with this, individual RGCs undergo progressive clustering of axonal boutons at later stages of development after eye-specific segregation (5). One of our goals in this work was to determine if the process of synaptic clustering begins at the earliest stages of synapse formation and, if so, whether it is influenced by retinal wave activity.
To measure synaptic clustering in our STORM data, we used a randomization of single-AZ synapse centroids within the volume of the neuropil after accounting for neuronal soma volumes and edge effects. Multi-AZ centroid positions were held fixed. Comparing the randomized result to the original distribution, we found a higher fraction of single-AZ synapse associated with multi-AZ synapses, arguing for a non-random clustering effect. However, we agree with the reviewer’s concern that this type of randomization cannot account for the fine scale structure of axons, which we did not have access to in this four-color volumetric super-resolution data set. Thus, there could still be errors in a purely volumetric randomization (e.g. the assignment of synapses to regions in the volume that would not be synaptic locations in the original neuropil), which would effectively decrease the measured degree of clustering after the randomization. To address this, we have revised our analysis to measure the degree of synapse clustering nearby both multi-AZ and single-AZ synapses after an equivalent randomization of single-AZ synapse positions in the volume.
We now present the revised results as a “clustering index” for both multi-AZ and single-AZ synapses. This measurement was performed in several steps: 1) randomization of single-AZ position with the imaging volume while holding multi-AZ centroid positions fixed, 2) independent measurements of the fraction of single-AZ synapses within the local shell (1.5 μm search radius) around multi-AZ and single-AZ synapses within the random distribution, 3) comparison of the result from (2) with the actual fractional measurements in the raw STORM data to compute a “clustering index” value. 4) Because the randomization is equivalent for both multi-AZ and single-AZ synapse measurements, any measured differences in the degree of clustering reflect the synapse type.
We have updated Figure 3 in the revised manuscript to present the relative clustering index described above. We have updated the results, discussion, and methods sections accordingly.
The authors claim that specificity increases over time. Figure 3b (middle) shows that the number of synapses near complex synapses might increase with time (needs confidence interval for effect size), but does not show that specificity (original relative to randomized) increases with time. The fact that nearby simple synapse density is always (P2) very different from random suggests a primarily non-activity-dependent explanation. The simplest explanation is that same-side boutons could be from the same axon whereas different-side axons could not be.
We have significantly revised the analysis and presentation of results in Figure 3 to include a comparative measurement of synaptic clustering between multi-AZ and single-AZ synapses (discussed above). The data presented in the original Figure 3B have been moved to Supplemental Figure 4. Statistical comparisons in Figure S4 between the original and randomized synapse distributions are limited to within-age measurements. Cross-age comparisons were not performed or presented. To address the reviewer’s question concerning CI analysis in the original Figure 3B, we provide Author response image 3 below showing 5/95% confidence intervals for WT mice:
Author response image 3.
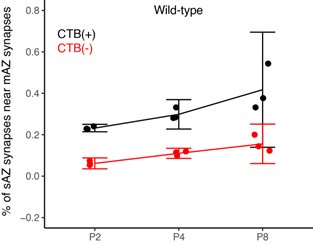
Claim 2: vGlut2 clusters more than 1.5 um away from multi-active zone vGlut2 clusters are not statistically significantly different in size than vGlut2 clusters within 1.5 um of multi-active zone vGlut2 clusters. Therefore "activity-dependent synapse stabilization mechanisms do not impact simple synapse vesicle pool size". The specific measure of 1.5 um from multi-active zone vGlut2 clusters does not represent all possible synapse stabilization mechanisms.
We agree with the reviewer that this specific measure does not capture all possible synapse stabilization mechanisms. We have modified the text in the revised manuscript throughout to be more cautious in our data interpretation and have included additional discussion of alternative mechanisms consistent with our results.
Result Section 4.
Claim: The proximity of complex synapses with nearby simple synapses to other complex synapses with nearby simple synapses from the same eye is used to argue that activity is responsible for all this clustering.
It is difficult to derive anything from the quantification besides 'not-random'. That is a problem because we already know that axons from the left and right eye segregate during the period being studied. All the measures in Section 4 are influenced by eye-specific segregation. Given this known bias, demonstrating a non-random relationship (P<X) doesn't mean anything. The test will reveal any non-random spatial relationship between same-eye and opposite-eye synapses.
The results can be stated as: If you are a contralateral complex synapse, contralateral complex synapses that are also close to contralateral simple synapses will, on average, be slightly closer to you than contralateral complex synapses that are not close to contralateral ipsilateral synapses. That would be true if there is any eye-specific segregation (which there is).
We appreciate the reviewer’s comments that our anatomical data are consistent with several possible mechanisms, suggesting the need for alternative interpretations of the results. In the original writing, we interpreted our results in the context of activity-dependent mechanisms of like-eye stabilization and opposite-eye competition. However, our results are also consistent with other mechanisms, including non-random molecular specification of eye-specific inputs onto subregions of postsynaptic target cells (e.g. distinct relay neuron dendrites). We have rewritten the manuscript to be more cautious in our interpretations and to provide a balanced discussion of alternative possibilities.
Regarding the concern that the data in section four are influenced by eye-specific segregation, we previously found synapse density from both eyes is equivalent in the contralateral region at the P4 time point presented (1), which is consistent with binocular axonal overlap at this age. Within our imaging volumes, ipsilateral and contralateral inputs were broadly intermingled throughout the volume, and we did not find evidence for regional segregation with the imaging fields. By these metrics, retraction of ipsilateral inputs from the contralateral territory has not yet occurred.
It is an overinterpretation of the data to claim that the lack of a clear correlation between vGlut2 cluster volume and distance to vGlut2 clusters with multiple active zones provides support for the claim that "presynaptic protein organization is not influenced by mechanisms governing synaptic clustering".
We agree with the reviewer that our original language was imprecise in referring to presynaptic protein organization broadly. We have revised this text to present a more accurate description of the results.
Reviewer #2 (Public Review):
In this manuscript, Zhang and Speer examine changes in the spatial organization of synaptic proteins during eye-specific segregation, a developmental period when axons from the two eyes initially mingle and gradually segregate into eye-specific regions of the dorsal lateral geniculate. The authors use STORM microscopy and immunostain presynaptic (VGluT2, Bassoon) and postsynaptic (Homer) proteins to identify synaptic release sites. Activity-dependent changes in this spatial organization are identified by comparing the β2KO mice to WT mice. They describe two types of presynaptic organization based on Bassoon clustering, the complex and the simple synapse. By analyzing the relative densities and distances between these proteins over age, the authors conclude that the complex synapses promote the clustering of simple synapses nearby to form the future mature glomerular synaptic structure.
Strengths:
The data presented is of good quality and provides an unprecedented view at high resolution of the presynaptic components of the retinogeniculate synapse during active developmental remodeling. This approach offers an advance to the previous mouse EM studies of this synapse because of the CTB label allows identification of the eye from which the presynaptic terminal arises. Using this approach, the authors find that simple synapses cluster close to complex synapses over age, that complex synapse density increases with age.
Weaknesses:
From these data, the authors conclude that the complex synapse serves to "promote clustering of like-eye synapses and prohibit synapse clustering from the opposite eye". However, the authors show no causal data to support these ideas. There are a number of issues that the authors should consider:
(1) Clustering of retinal synapses is in part due to the fact that retinal inputs synapse on the proximal dendrites. With increased synaptogenesis, there will be increased density of retinal terminals that are closely localized. And with development, perhaps simple synapses mature into complex synapses. Simple synapses may also represent ones that are in the process of being eliminated as previously described by Campbell and Shatz, JNeurosci 1992 (consider citing). Can the authors distinguish these scenarios from the ones that they conclude?
We thank the reviewer for their thoughtful commentary and suggestions to improve our manuscript. We agree with the reviewer that our original interpretation of synaptic clustering by activity-dependent stabilization and punishment mechanisms is not directly supported by causal data. We have extensively revised the manuscript to take a more cautious view of the results and to discuss alternative mechanisms that are consistent with our data.
During eye-specific circuit development, there is indeed increased synaptogenesis and, ultimately, RGC terminals are closely clustered within synaptic glomeruli. This process involves the selective addition and elimination of synapses. Bouton clustering has been shown to occur within individual RGC axons after eye-opening in the mouse (5). The convergence of other RGC types into clustered boutons has been shown at eye-opening by light and electron microscopy (3). There is also qualitative evidence that synaptic clusters may form earlier during eye-specific segregation in the cat (4). Our data provide additional evidence that synaptic clustering begins prior to eye-opening in the mouse (P2-P8). Although synapse numbers also increase during this period, the distribution of synapse addition is non-random.
Single-active zone synapses (we previously called these “simple”) may indeed mature into multi-active zone synapses (we previously called these “complex”). At the same time, single-active zone synapses may be eliminated. We believe that each of these events occurs as part of the synaptic refinement process. Our STORM images are static snapshots of eye-specific refinement, and we cannot infer the dynamic developmental trajectory of an individual synapse in our data. Future live imaging experiments in vivo/in situ will be needed to track the maturation and pruning of individual connections. We have expanded our discussion of these limitations and future directions in the manuscript.
(2) The argument that "complex" synapses are the aggregate of "simple" synapses (Fig 2, S2) is not convincing.
We agree with the reviewer’s concern about the ambiguous identity of complex synapses. To clarify the nature of multi-active zone synapses, we have performed RGC-specific dAPEX2 labeling to visualize retinogeniculate terminals by electron microscopy (EM). These experiments revealed the presence of synaptic terminals with multiple active zones. We have added images and text to the results section describing these findings. Our 2D EM images do not rule out the possibility that some multi-active zone synapses observed in STORM images are in fact clusters of individual RGC terminals. We have revised the text to provide a more accurate discussion of the nature of multi-active zone synapses.
(3) The authors use of the β2KO mice to assess changes in the organization of synaptic proteins in retinal terminals that have disrupted retinal waves. However, β2-nAChRs are also expressed in the dLGN and other areas of the brain and glutamatergic synapse development has been reported in the CNS independent of the disruption in retinal waves. This issue should be considered when interpreting the total reduced retinal synapse density in the dLGN of the mutant.
We thank the reviewer for their suggestion to consider non-retinal effects of the germline deletion of the beta 2 subunit of the nicotinic acetylcholine receptor. Previously, Xu and colleagues reported the development of a conditional transgenic mouse model lacking β2-nAChR expression specifically in the retina (6). These retina-specific β2-nAChR mutant mice (Rx-β2cKO) have disrupted retinal wave properties and defects in eye-specific axonal segregation in binocular anterograde tracing experiments. This work suggests that the defects seen in germline β2-nAChR KO mice arise from defects in retinal wave activity rather than the loss of nicotinic receptors elsewhere in the brain. Additionally, the development of brainstem cholinergic inputs to the dLGN is delayed until the closure of the eye-specific segregation period (7), further suggesting a limited role for cholinergic transmission in the retinogeniculate refinement process.
(4) Outside of a total synapse density difference between WT and β2KO mice, the changes in the spatial organization of synaptic proteins over development do not seem that different. In fact % simple synapses near complex synapses from the non-dominant eye in the mutant is not that different from WT at P8 (Fig 3C), an age when eye-specific segregation is very different between the genotypes. Can the authors explain this discrepancy?
We thank the reviewer for their question concerning differences between synapse organization in WT versus β2KO mice. In the original presentation of Figure 3C at P4, the percentage of non-dominant eye single-AZ synapses near multi-AZ synapses increased at P4 in WT mice, but this did not occur in β2KO mice. This is consistent with our previous results showing that there is an increase in non-dominant eye synaptic density at this age, which does not occur in β2KO mice (1). At P8, this clustering effect is lost in WT as eye-specific segregation has taken place and non-dominant eye inputs have been eliminated. However, in β2KO mice, the overall synapse density is still low at this age. We interpret this result as a failure of synaptogenesis in the β2KO line, which leads to increased growth of individual RGC axons (8) and eye-specific overlap at P8 (9, 10). Evidence in support of this interpretation comes from live dynamic imaging studies of RGC axon branching in Xenopus and Zebrafish, showing that synapse formation stabilizes local axon branching and that disruptions of synapse formation or neurotransmission lead to enlarged axons (11-13).
Our anatomical results do not provide a specific biological mechanism for the remaining clustering observed in the β2KO mice. We have revised our discussion of the fact that individual RGC axons may form multiple synaptic connections leading to clustering, which may be independent of changes in retinal wave properties in the β2KO mouse. We have also extensively revised the analysis and presentation of results in Figure 3 to directly compare synaptic clustering around both multi-AZ synapses and single-AZ synapses within the same imaging volumes.
(5) The authors use nomenclature that has been previously used and associated with other aspects of retinogeniculate properties. For example, the phrases "simple" and "complex" synapses have been used to describe single boutons or aggregates of boutons from numerous retinal axons, whereas in this manuscript the phrases are used to describe vesicle clusters/release sites with no knowledge of whether they are from single or multiple boutons. Likewise, the use of the word "glomerulus" has been used in the context of the retinogeniculate synapse to refer to a specific pattern of bouton aggregates that involves inhibitory and neuromodulatory inputs. It is not clear how the release sites described by the authors fit in this picture. Finally the use of the word "punishment" is associated with a body of literature regarding the immune system and retinogeniculate refinement-which is not addressed in this study. This double use of the phrases can lead to confusion in the field and should be clarified by clear definitions of how they are used in the current study.
We appreciate the reviewer’s concern that the terminology we used in the initial submission may cause confusion. We have revised the text throughout for clarity. “Simple” synapses are now referred to as “single-active zone synapses”. “Complex” synapses are now referred to as “multi-active zone synapses”. We have removed all text that previously referred to synaptic clusters in STORM images as glomeruli. We agree that we have not provided causal evidence for synaptic stabilization and punishment mechanisms, which would require additional molecular genetic studies. We have restructured the manuscript to remove these references and discuss our anatomical results impartially.
Reviewer #3 (Public Review):
This manuscript is a follow-up to a recent study of synaptic development based on a powerful data set that combines anterograde labeling, immunofluorescence labeling of synaptic proteins, and STORM imaging (Cell Reports 2023). Specifically, they use anti-Vglut2 label to determine the size of the presynaptic structure (which they describe as the vesicle pool size), anti-Bassoon to label a number of active zones, and anti-Homer to identify postsynaptic densities. In their previous study, they compared the detailed synaptic structure across the development of synapses made with contra-projecting vs ipsi-projecting RGCs and compared this developmental profile with a mouse model with reduced retinal waves. In this study, they produce a new analysis on the same data set in which they classify synapses into "complex" vs. "simple" and assess the number and spacing of these synapses. From these measurements, they make conclusions regarding the processes that lead to synapse competition/stabilization.
Strengths:
This is a fantastic data set for describing the structural details of synapse development in a part of the brain undergoing activity-dependent synaptic rearrangements. The fact that they can differentiate eye of origin is also a plus.
Weaknesses:
The lack of details provided for the classification scheme as well as the interpretation of small effect sizes limit the interpretations that can be made based on these findings.
We thank the reviewer for their reading of the manuscript and helpful comments to improve the work. We provide details on how single-active zone and multi-active zone synapses are classified in the methods section. We agree with the suggestion to be more careful in interpreting the results. We have extensively revised the manuscript to 1) include additional electron microscopy data demonstrating the presence of multi-active zone retinogeniculate synapses, 2) extend the synaptic clustering analysis to both single-active zone and multi-active zone synapses for comparison, and 3) improve the clarity and accuracy of the discussion throughout the manuscript.
(1) The criteria to classify synapses as simple vs. complex is critical for all of the analysis in this study. Therefore this criteria for classification should be much more explicit and tested for robustness. As stated in the methods, it is based on the number of active zones which are designated by the number of Bassoon clusters associated with a Vglut2 cluster (line 697). A second part of the criteria is the size of the presynaptic terminal as assayed by "greater Vglut2 signal" (line 116). So how are these thresholds determined? For Bassoon clusters, is one voxel sufficient? Two? If it's one, how often do they see a Bassoon positive voxel with no Vglut2 cluster and therefore may represent "noise"? There is no distribution of Bassoon volumes that is provided that might be the basis for selecting this number of sites. Unfortunately, the images are not helpful. For example, does P8 WT in Figure 1B have 7 or 2? According to Figure 2C, it appears the numbers are closer to 2-4.
The Vglut volume measurements also do not seem to provide a clear criterion. Figure 2 shows that the distributions of Vglut2 cluster volumes for complex and for simple synapses are significantly overlapping.
The authors need to clarify the quantitative approach used for this classification strategy and test how sensitive the results of the study are to how robust this strategy is
We thank the reviewer for their question concerning the STORM data analysis. Here we provide a brief overview of the complete analysis details, which are provided in the methods section.
Our raw STORM data sets consisted of spectrally separate volumetric imaging channels of VGluT2, Bassoon, and Homer1 signals. For each of these channels, raw STORM data were processed by 1) application of the corresponding low-resolution conventional image of each physical section to the STORM data to filter artifacts in the STORM image which do not appear in the conventional image, 2) STORM images are then thresholded using a 2-factor Otsu threshold that removes low-intensity background noise while preserving all single-molecule localizations that correspond to genuine antibody labeling as well as non-specific antibody labeling in the tissue, 3) application of the MATLAB function “conncomp” to identify connected component voxel in 3D across the image stack. Clusters are only kept for further analysis steps if they are connected across at least 2 continuous physical sections (140 nm Z depth). 4) for every connected component (clusters corresponding to genuine antibody labeling and background labeling), we measure the volume and signal density (intensity/volume) for every cluster in the dataset, 5) a threshold is applied to retain clusters that have a higher volume and lower signal density. We exclude signals that have low-volume and high-density, which correspond to single antibody labels. This analysis retains larger clusters that correspond to synaptic objects and excludes non-specific antibody background.
The average size of WT synaptic Bassoon clusters ranges from 55 - 3532 voxels (0.00092~0.059 μm3), with a median size of 460 voxels (0.0077 μm3).
The average size of WT synaptic VGluT2 clusters ranges from 50 -73752 voxels (0.00084~1.2 μm3), with a median size of 980 voxels (0.016 μm3).
The average size of WT synaptic Homer1 clusters ranges from 63-7118 (0.0010~0.12 μm3), with a median size of 654 voxels (0.011 μm3).
In practice, any Bassoon/VGluT2/Homer1 clusters with <10 voxels are immediately filtered at the Otsu thresholding step (2) above.
The reviewer is correct that we often see Bassoon(+) clusters that are not associated with VGluT2, and these may reflect synapses of non-retinal origin or retinogeniculate synapses that lack VGluT2 expression. To identify retinogeniculate synapses containing VGluT2, we performed a synapse pairing analysis that measured the association between VGluT2 and Bassoon clusters after the synapse cluster filtering described above. We first measured the centroid-centroid distance from each VGluT2 cluster to the closest cluster in the Bassoon channel. We next quantified the signal intensity of the Bassoon channel within a 140 nm shell surrounding each VGluT2 cluster. A 2D histogram was plotted based on the measured centroid-centroid distances and opposing channel signal densities of each cluster. Paired clusters with closely positioned centroids and high intensities of apposed channel signal were identified using the OPTICS algorithm (14).
In the original Figure 1B, the multi-active zone synapse in WT at P8 had two Bassoon clusters. To clarify this, we have revised the images in Figure 1 to include arrowheads that point to individual active zones. We have also revised Supplemental Figure 1 to show volumetric renderings of individual example synapses that help illustrate the 3D structure of these multi-active zone inputs. All details about synapse analysis and synapse pairing are provided in the methods section.
(2) Effect sizes are quite small and all comparisons are made on medians of distributions. This leads to an n=3 biological replicates for all comparisons. Hence this small n may lead to significant results based on ANOVAS/t-tests, but the statistical power of these effects is quite weak. To accurately represent the variance in their data, the authors should show all three data points for each category (with a SD error bar when possible). They should also include the number of synapses in each category (e.g. the numerators in Figure 1D and the denominators for Figure 1E). For other figures, there are additional statistical questions described below.
We thank the reviewer for their suggestion to improve the presentation of our results. We have added all three data points (individual biological replicates) to each figure plot when applicable. We have also included a supplemental table (Table S1) listing total eye-specific synapse numbers of each type (mAZ and sAZ) and AZ number for each biological replicate in both genotypes.
(3) The authors need to add a caveat regarding their classification of synapses as "complex" vs. "simple" since this is a terminology that already exists in the field and it is not clear that these STORM images are measuring the same thing. For example, in EM studies, "complex" refers to multiple RGCs converging on the same single postsynaptic site. The authors here acknowledge that they cannot assign different AZs to different RGCs so this comparison is an assumption. In Figure 2 they argue this is a good assumption based on the finding that the Vglut column/active zone is constant and therefore each represents a single RGC. However, the authors should acknowledge that they are actually seeing quite different percentages than those in EM studies. For example, in Monavarfeshani et al, eLife 2018, there were no complex synapses found at P8. (Note this study also found many more complex vs. simple synapses in the adult - 70% vs. the 20% found in the current study - but this difference could be a developmental effect). In the future, the authors may want to take another data set in the adult dLGN to make a direct comparison based on numbers and see if their classification method for complex/simple maps onto the one that currently exists in the literature.
We appreciate the reviewer’s comment that the use of the terms “complex” and “simple” may cause confusion. We have significantly revised the manuscript for clarity: 1) we now refer to “complex” synapses as “multi-active zone synapses” and “simple” synapses as “single-active zone synapses. 2) We have performed electron microscopy analysis of dAPEX2-labeled retinogeniculate projections to confirm the existence of large synaptic terminals with multiple active zones. 3) We have expanded our discussion of previous electron microscopy results describing a lack of axonal convergence at P8 (3). 4) We have added a discussion on how individual RGCs may form multiple synapses in close proximity within their axonal arbor, which would create a clustering effect.
We agree that it will be informative to collect a STORM data set in the adult mouse dLGN and we look forward to working on this project to compare with EM results in the future.
(4) Figure 3 assays the relative distribution of simple vs. complex synapses. They found that a larger percentage of simple synapses were within 1.5 microns of complex synapses than you would expect by chance for both ipsi and contra projecting RGCs, and hence conclude that complex synapses are sites of synaptic clustering. In contrast, there was no clustering of ipsi-simple to contra-complex synapses and vice versa. The authors also argue that this clustering decreases between P4 and P8 for ipsi projecting RGCs.
This analysis needs much more rigor before any conclusions can be drawn. First, the authors need to justify the 1.5-micron criteria for clustering and how robust their results are to variations in this distance. Second, these age effects need to be tested for statistical significance with an ANOVA (all the stats presented are pairwise comparisons to means expected by random distributions at each age). Finally, the authors should consider what n's to use here - is it still grouped by biological replicate? Why not use individual synapses across mice? If they do biological replicates, then they should again show error bars for each data point in their biological replicates. And they should include the number of synapses that went into these measurements in the caption.
We appreciate the suggestion to improve the rigor of our analysis of synaptic clustering presented in Figure 3. We have revised our analysis to measure the degree of synapse clustering nearby both multi-AZ and single-AZ synapses after an equivalent randomization of single-AZ synapse positions in the volume.
We now present the revised results as a “clustering index” for both multi-AZ synapses and single-AZ synapses. This measurement was performed in several steps: 1) randomization of single-AZ positions within the imaging volume while holding multi-AZ centroid positions fixed, 2) independent measurements of the fraction of single-AZ synapses within the local shell (1.5 μm search radius) around multi-AZ and single-AZ synapses within the random distribution, 3) comparison of the result from (2) with the actual fractional measurements in the raw STORM data to compute a “clustering index” value. 4) Because the randomization is equivalent for both multi-AZ and single-AZ synapse measurements, the measured differences in the degree of clustering reflect a synapse type-specific effect.
We have also updated Supplemental Figure 3 showing the results of varying the search radius from 1-4 μm for both contralateral- and ipsilateral-eye synapses. The results showed that a search radius of 1.5 μm resulted in the largest difference between the original synapse distribution and a randomized synapse distribution (shuffling of single-active zone synapse position while holding multi-active zone synapse position fixed).
Finally, we have removed all statistical comparisons of single measurements (means or ratios) across ages from the manuscript. We focus our statistical analysis on paired data comparisons within individual biological replicates.
For the analysis of synapse clustering, we grouped the data by biological replicates (N=3) to look for a global effect on synapse clustering. In the revised manuscript, we added data points for each replicate in the figure and included the number of synapses in Supplementary Table 1.
(5) Line 211-212 - the authors conclude that the absence of clustered ipsi-simple synapses indicates a failure to stabilize (Figure 3). Yet, the link between this measurement and synapse stabilization is not clear. In particular, the conclusion that "isolated" synapses are the ones that will be eliminated seems to be countered by their finding in Figure 3D/E which shows that there is no difference in vesicle pool volume between near and far synapses. If isolated synapses are indeed the ones that fail to stabilize by P8, wouldn't you expect them to be weaker/have fewer vesicles? Also, it's hard to tell if there is an age-dependent effect since the data presented in Figures 3D/E are merged across ages.
We thank the reviewer for their suggestion to clarify the results in Figure 3. Based on the measured eye-specific differences in vesicle pool size and organization, we also expected that synapses outside of clusters would show a reduced vesicle population. However, across all ages, we found no differences in the vesicle pool size of single-active zone synapses based on their proximity to multi-active zone synapses. Below, we show cumulative distributions of these results across all ages (P2/P4/P8) for WT mice CTB(+) data. Statistical tests (Kolmogorov-Smirnov tests) show no significant differences. P = 0.880, 0.767, 0.494 respectively. Separate 5/95% confidence interval calculations showed overlap between far and near populations at each age.
Author response image 4.
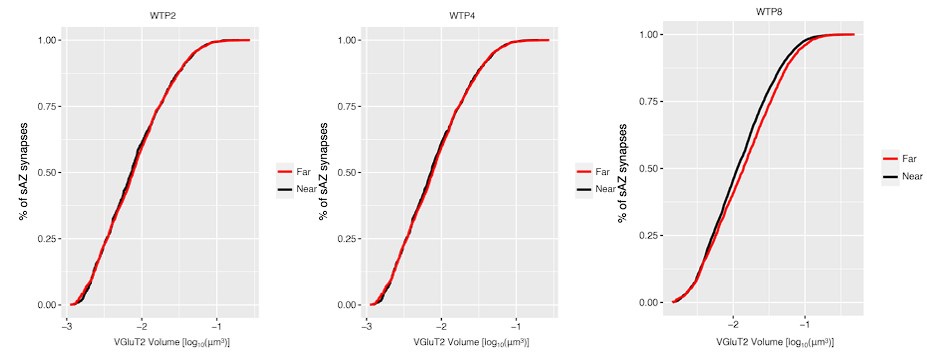
To clarify the presentation of the results, we have changed the text to state that the “vesicle pool size of sAZ synapses is independent of their distance to mAZ synapses”. We have removed references to stabilization and punishment from the results section of the manuscript.
Recommendations for the authors:
Reviewer #1 (Recommendations For The Authors):
Because none of the phenomena being measured can be expected to behave randomly (given what is already known about the system) and the sample size is small, I believe quantification of the data requires confidence intervals for effect sizes. Resolving the multi-bouton vs multi-active zone bouton with EM would also help.
We thank the reviewer for their thorough reading of the manuscript and many helpful suggestions. We provide analysis with confidence intervals in a point-by-point response below. In the manuscript we revised our results and focused our statistical analyses on comparisons within the same biological replicate (paired effects). In addition, we have performed electron microscopy of RGC inputs to the dLGN at postnatal day 8 to demonstrate the presence of retinogeniculate synapses with multiple active zones.
Figure 1:
Please show data points in scatter bar plots and not just error bars.
We have updated all plots to show data points for independent biological replicates.
Please describe the image processing in more detail and provide an image in which the degree of off-target labeling can be evaluated.
We have updated the description of the image processing in the methods sections. We have made all the code used in this analysis freely available on GitHub (https://github.com/SpeerLab). We have uploaded the raw STORM images of the full data set to the open-access Brain Imaging Library (16). These images can be accessed here: https://api.brainimagelibrary.org/web/view?bildid=ace-dud-lid (WTP2A data for example). All 18 datasets are currently searchable on the BIL by keyword “dLGN” or PI last name “Speer” and a DOI for the grouped dataset is pending.
How does panel 1D get very small error bars with N = 3? Please provide scatter plots.
We have updated panel 1D to show the means for each independent biological replicate.
Line 129: over what volume is density measured? What are the n's? What is the magnitude (with confidence intervals) of increase?
The volume we collected from each replicate was ~80μm*80μm*7μm (total volume ~44,800 μm3). N=3 biological replicates for each age, genotype, and tissue location. Because of concerns with the use of ANOVA for low sample numbers, we have removed a majority of the age-wise comparisons from the manuscript and instead focus on within-replicate paired data comparisons. Author response image 5 showa 5/95% confidence intervals for WT data (left panel) and β2KO data (right panel) is shown below:
Author response image 5.
The 5/95% CI range for the increase in synapse density from P2 to P8 for CTB(+) synapses is ~ -0.001 ~ 0.037 synapses / μm3.
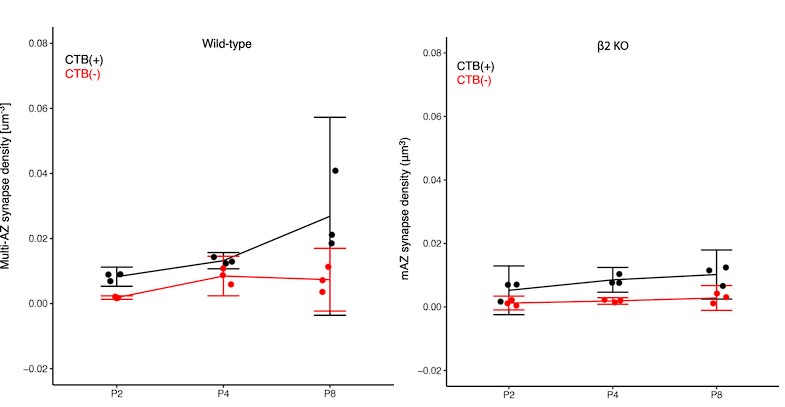
Line 131: You say that non-dominant increases and then decreases. It appears that the error bars argue that you do not have enough information to reliably determine how much or little density changes.
Line 140: No confidence intervals. It appears the error bars allow both for the claimed effect of increased fraction and the opposite effect of decreased density.
Because of concerns with the use of ANOVA for low sample numbers, we have removed age-wise comparisons of single-measurements (means and ratios) from the manuscript and instead focus on within-replicate paired data comparisons.
Line 144: Confidence intervals would be a reasonable way to argue that fraction is not changed in KO: normal fraction XX%-XX%. KO fraction XX%-XX%.
Author response image 6 shows panels for WT (left) and β2KO mice (right) with 5/95% CIs.
Author response image 6.
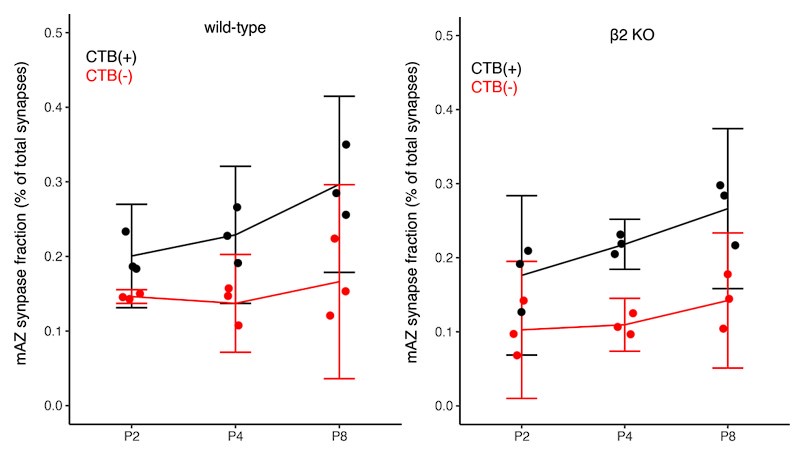
In the revised manuscript, we have updated the text to report the measurements, but we do not draw conclusions about changes over development.
I find it hard to estimate magnitudes on a log scale.
We appreciate the reviewer’s concern with the presentation of results on a log scale. Because the measured synapse properties are distributed logarithmically, we have elected to present the data on a log scale so that the distribution(s) can be seen clearly. Lognormal distributions enable us to use a mixed linear model for statistical analysis.
Line 156: Needs confidence interval for difference.
Line 158: Needs confidence interval for difference of differences.
Line 160: Needs confidence interval for difference of differences.
Why only compare at P4 where there is the biggest difference? The activity hypothesis would predict an even bigger effect at P8.
Below is a table listing the mean volume (log10μm3) and [5/95%] confidence intervals for comparisons of VGluT2 signal between CTB(+) and CTB(-) synapses from Figure 2A and 2B:
Author response table 2.
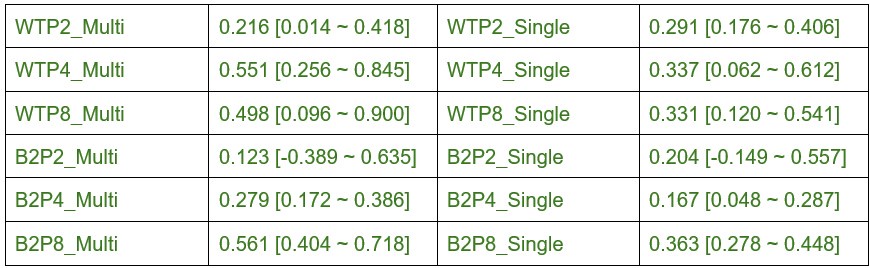
Based on the values given above, the mean difference of differences and [5/95%] confidence intervals are listed below:
Author response table 3.
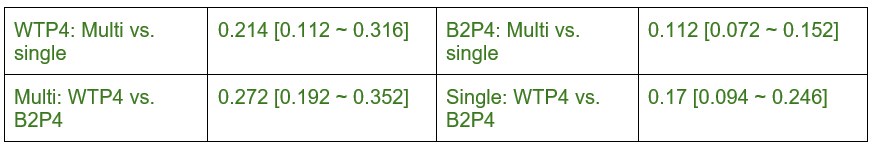
We added these values to the manuscript. We have also reported the difference in median values on a linear scale (as below) so that the readers can have a straightforward understanding of the magnitude.
Author response table 4.
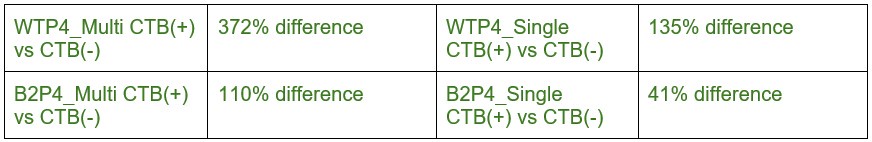
We elected to highlight the results at P4 based on our previous finding that the synapse density from each eye-of-origin is similar at this time point (1).
At P8, there is a decrease in the magnitude of the difference between CTB(+)/CTB(-) synapses compared to P4. This may be due to an increase in VGluT2 volume within non-dominant eye synapses that survive competition between P4-P8.
At P8 in the mutant, there is an increase in the magnitude of the difference between CTB(+)/CTB(-) synapses compared to P4. This may be due to delayed synaptic maturation in β2KO mice.
Line 171: The correct statistical comparison was not performed for the claim. Lack of * at P2 does not mean they are the same. Why do you get the same result for KO?
We have revised the statistical analysis, figure presentation, and text to remove discussion of changes in the number of active zones per synapse over development based on ANOVA. We now report eye-specific differences at each time point using paired T-test analysis, which is mathematically equivalent to comparing the 5/95% confidence interval in the difference.
Line 175: Qualitative claim. Correlation coefficients and magnitudes of correlation coefficients are not reported.
Linear fitting slop and R square values are attached:
Author response table 5.

The values are added to the manuscript to support the conclusions.
Line 177: n.s. does not mean that you have demonstrated the values are the same. An argument for similarity could be made by calculating a confidence interval a for potential range of differences. Example: Complex were 60%-170% of Simple.
Author response image 7 with 5/95% CI is shown below (WT and B2KO):
Author response image 7.
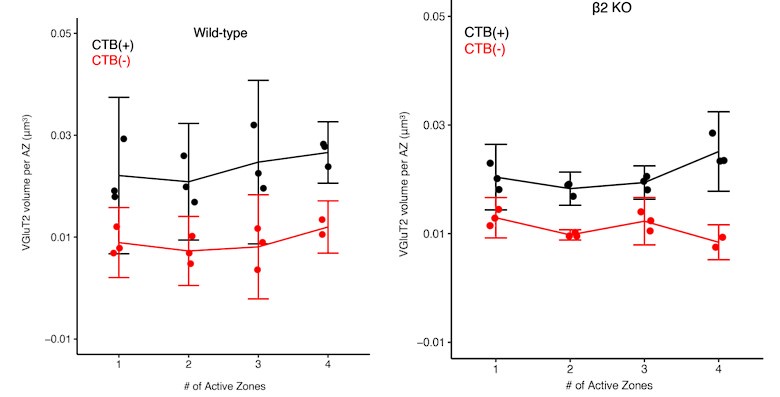
Comparing the difference between multi-AZ synapse and single-AZ synapse revealed that the difference in average VGluT2 cluster volume per AZ is:
Author response table 6.

The values are added to the manuscript for discussion.
Line 178: There is no reason to think that the vesical pool for a single bouton does not scale with active zone number within the range of uncertainty presented here.
We have collected EM images of multi-AZ zone synapses and modified our discussion and conclusions in the revised text.
Line 196: "non-random clustering increased progressively" is misleading. The density of the boutons increases for both the Original and Randomized. Given the increase in variance at P8, it is unlikely that the data supports the claim that the non-randomness increased. Would be easy to quantify with confidence intervals for a measure of specificity (O/R).
We have revised the manuscript to remove analysis and discussion of changes in clustering over development. We have modified this section of the manuscript and figures to present a normalized clustering index that describes the non-random clustering effect present at each time point.
Line 209: Evidence is for correlation, not causation and there is a trivial potential explanation for correlation.
We appreciate the reviewer’s concern with over interpretation of the results. We have changed the text to more accurately reflect the data.
Line 238:239: Authors failed to show effect is activity-dependent. Near/Far distinction is not necessarily a criterion for the effect of activity. The claim is likely false in other systems.
We agree with the reviewer that the original text overinterpreted the results. We have changed the text to more accurately reflect the data.
Line 265-266: Assumes previous result is correct and measure of vGlut2 provides information about all presynaptic protein organization.
We thank the reviewer for pointing out the incorrect reference to all presynaptic protein organization. We have corrected the text to reference only the VGluT2 and Bassoon signals that were measured.
Line 276: There are many other interpretations that include trivial causes. It is unclear what the measure indicates about the biology and there is no interpretable magnitude of effect.
We agree with the reviewer that the original text overinterpreted the results. We have changed the text to remove references to mechanisms of synaptic stabilization.
Line 289: Differences cannot be demonstrated by comparing P-values. Try comparing confidence intervals for effect size or generate a confidence interval for the difference between the two groups.
5/95% confidence intervals are given below for Figure 4C/D:
Author response table 7.
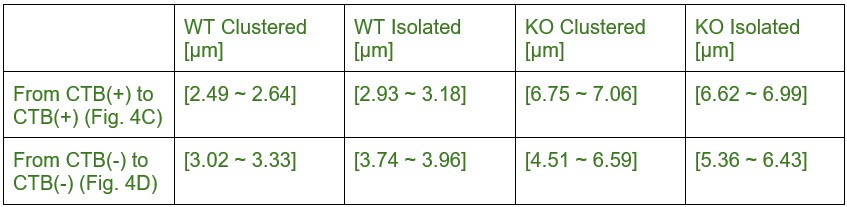
We have added these values to the manuscript to support our conclusion.
Line 305: "This suggests that complex synapses from the non-dominant-eye do not exert a punishment effect on synapses from the dominant-eye" Even if all the other assumptions in this claim were true, "n.s." just means you don't know something. It cannot be compared with an asterisk to claim a lack of effect.
We thank the reviewer for raising this concern. We have modified the text to remove references to synaptic punishment mechanisms in the results section.
Below are the 5/95% confidence intervals for the results in Figure 4F:
Author response table 8.
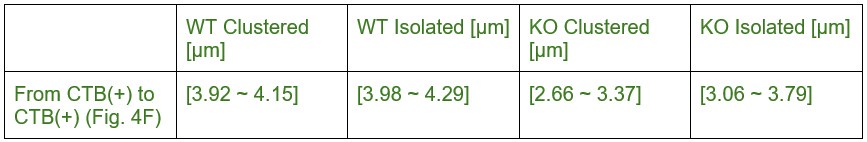
We have added these values to the manuscript to support our conclusion.
Line 308: "mechanisms that act locally". 6 microns is introduced based on differences in curves above(?). I don't see any analysis that would argue that longer-distance effects were not present.
The original reference referred to the differences in the cumulative distribution measurements between multi-active zone synapses versus single-active zone synapses in their distance to the nearest neighboring multi-active zone synapse. For clarity, we have deleted the reference to the 6 micron distance in the revised text.
Reviewer #2 (Recommendations For The Authors):
(1) This data set would be valuable to the community. However, unless the authors can show experiments that manipulate the presence of complex synapses to test their concluding claims, the manuscript should be rewritten with a reassessment of the conclusions that is more grounded in the data.
We thank the reviewer for their careful reading of the manuscript and we agree the original interpretations were not causally supported by the experimental results. We have made substantial changes to the text throughout the introduction, results, and discussion sections so that the conclusions accurately reflect the data.
(2) To convincingly address the claim that "complex synapse" are aggregates of simple synapses, the authors should perform experiments at the EM level showing what the bouton correlates are to these synapses.
We thank the reviewer for their suggestion to perform EM to gain a better understanding of retinogeniculate terminal structure. We generated an RGC-specific transgenic line expressing the EM reporter dAPEX2 localized to mitochondria. We have collected EM images of retinogeniculate terminals that demonstrate the presence of multiple active zones within individual synapses. These results are now presented in Figure 1. The text has been updated to reflect the new results.
(3) Experiments using the conditional β2KO mice would help address questions of the contribution of β2-nAChRs in dLGN to the synaptic phenotype.
We appreciate the reviewer’s concern that the germline β2KO model may show effects that are not retina-specific. To address this, Xu and colleagues generated a retina-specific conditional β2KO transgenic and characterized wave properties and defective eye-specific segregation at the level of bulk axonal tracing (6). The results from the conditional mutant study suggest that the main effects on eye-specific axon refinement in the germline β2KO model are likely of retinal origin through impacts on retinal wave activity. Additionally, anatomical data shows that brainstem cholinergic axons innervate the dLGN toward the second half of eye-specific segregation and are not fully mature at P8 when eye-specific refinement is largely complete (7). We agree with the reviewer that future synaptic studies of previously published wave mutants, including the conditional reporter line, would be needed to conclusively assess a contribution of non-retinal nAChRs. These experiments will take significant time and resources and we respectfully suggest this is beyond the scope of the current manuscript.
Reviewer #3 (Recommendations For The Authors):
(1) The authors need to be more transparent that they are using the same data set from the previous publication (right now it does not appear until line 471) and clarify what was found in that study vs what is being tested here.
We thank the reviewer for their thoughtful reading of the manuscript and helpful recommendations to improve the clarity of the work. We have edited the text to make it clear that this study is a reanalysis of an existing data set. We have revised the text to discuss the results from our previous study and more clearly define how the current analysis builds upon that initial work.
(2) The authors restricted their competition argument in Figure 4 to complex synapses, but why not include the simple ones? This seems like a straightforward analysis to do.
We appreciate the reviewer’s suggestion to measure spatial relationships between “clustered” and “isolated” single-AZ synapses as we have done for multi-AZ synapses in Figure 4. However, we are not able to perform a direct and interpretable comparison with the results shown for multi-AZ synapses. First, we would need to classify “clustered” and “isolated” single-AZ synapses. This classification convolves two effects: 1) a distance threshold to define clustering and 2) subsequent distance measurements between clustered synapses.
If we apply an equivalent 1.5 μm distance threshold (or any other threshold) to define clustered synapses, the distance from each “clustered” single-AZ synapse to the nearest other single-AZ synapse will always be smaller than the defined threshold (1.5 μm). Alternatively, if all of the single-AZ synapses within each local 1.5 μm shell are excluded from the subsequent intersynaptic distance measurements, this will set a hard lower boundary on the distance between synaptic clusters (1.5 μm minimum). The two effects discussed above were separated in our original analysis of multi-AZ synapses defined as “clustered” and “isolated” based on their relationship to single-AZ synapses, but these effects cannot be separated when analyzing single-AZ distributions alone.
(3) The Discussion seems much too long and speculative from the current data that is represented - particularly without verification of complex synapses actually being inputs from different RGCs. Along the same lines, figure captions are misleading. For example, for Figure 4 - the title indicates that the complex synapses are driving the rearrangements. But of course, these are static images. The authors should use titles that are more reflective of their findings rather than this interpretation.
We thank the reviewer for these helpful suggestions. We have changed each of the figure captions to more accurately reflect the results. We have deleted all of the speculative discussion and revised the remaining text to improve the accuracy of the presentation.
(4) In the future, the authors may want to consider an analysis as to whether ipsi and contra projection contribute to the same synapses
We agree with the reviewer that it is of interest to investigate the contribution of binocular inputs to retinogeniculate synaptic clusters during development. At maturity, some weak binocular input remains in the dominant-eye territory (15). To look for evidence of binocular synaptic interactions, we measured the percentage of the total small single-active zone synapses that were within 1.5 micrometers of larger multi-active zone synapses of the opposite eye. On average, ~10% or less of the single-active zone synapses were near multi-active zone synapses of the opposite eye. This analysis is presented in Supplemental Figure S3C/D.
It is possible that some large mAZ synapses might reflect the convergence of two or more smaller inputs from the two eyes. Our current analyses do not rule this out. However, previous EM studies have found limited evidence for convergence of multiple RGCs (3) at P8 and our own EM images show that larger terminals with multiple active zones are formed by a single RGC bouton. Future volumetric EM reconstructions with eye-specific labels will be informative to address this question.
References
(1) Zhang C, Yadav S, Speer CM. The synaptic basis of activity-dependent eye-specific competition. Cell Rep. 2023;42(2):112085.
(2) Bickford ME, Slusarczyk A, Dilger EK, Krahe TE, Kucuk C, Guido W. Synaptic development of the mouse dorsal lateral geniculate nucleus. J Comp Neurol. 2010;518(5):622-35.
(3)Monavarfeshani A, Stanton G, Van Name J, Su K, Mills WA, 3rd, Swilling K, et al. LRRTM1 underlies synaptic convergence in visual thalamus. Elife. 2018;7.
(4) Campbell G, Shatz CJ. Synapses formed by identified retinogeniculate axons during the segregation of eye input. J Neurosci. 1992;12(5):1847-58.
(5) Hong YK, Park S, Litvina EY, Morales J, Sanes JR, Chen C. Refinement of the retinogeniculate synapse by bouton clustering. Neuron. 2014;84(2):332-9.
(6) Xu HP, Burbridge TJ, Chen MG, Ge X, Zhang Y, Zhou ZJ, et al. Spatial pattern of spontaneous retinal waves instructs retinotopic map refinement more than activity frequency. Dev Neurobiol. 2015;75(6):621-40.
(7) Sokhadze G, Seabrook TA, Guido W. The absence of retinal input disrupts the development of cholinergic brainstem projections in the mouse dorsal lateral geniculate nucleus. Neural Dev. 2018;13(1):27.
(8) Dhande OS, Hua EW, Guh E, Yeh J, Bhatt S, Zhang Y, et al. Development of single retinofugal axon arbors in normal and beta2 knock-out mice. J Neurosci. 2011;31(9):3384-99.
(9) Rossi FM, Pizzorusso T, Porciatti V, Marubio LM, Maffei L, Changeux JP. Requirement of the nicotinic acetylcholine receptor beta 2 subunit for the anatomical and functional development of the visual system. Proc Natl Acad Sci U S A. 2001;98(11):6453-8.
(10) Muir-Robinson G, Hwang BJ, Feller MB. Retinogeniculate axons undergo eye-specific segregation in the absence of eye-specific layers. J Neurosci. 2002;22(13):5259-64.
(11) Fredj NB, Hammond S, Otsuna H, Chien C-B, Burrone J, Meyer MP. Synaptic Activity and Activity-Dependent Competition Regulates Axon Arbor Maturation, Growth Arrest, and Territory in the Retinotectal Projection. J Neurosci. 2010;30(32):10939.
(12) Hua JY, Smear MC, Baier H, Smith SJ. Regulation of axon growth in vivo by activity-based competition. Nature. 2005;434(7036):1022-6.
(13) Rahman TN, Munz M, Kutsarova E, Bilash OM, Ruthazer ES. Stentian structural plasticity in the developing visual system. Proc Natl Acad Sci U S A. 2020;117(20):10636-8.
(14) Ankerst M, Breunig MM, Kriegel H-P, Sander J. OPTICS: ordering points to identify the clustering structure. SIGMOD Rec. 1999;28(2):49–60.
(15) Bauer J, Weiler S, Fernholz MHP, Laubender D, Scheuss V, Hübener M, et al. Limited functional convergence of eye-specific inputs in the retinogeniculate pathway of the mouse. Neuron. 2021;109(15):2457-68.e12.
(16) Benninger K, Hood G, Simmel D, Tuite L, Wetzel A, Ropelewski A, et al. Cyberinfrastructure of a Multi-Petabyte Microscopy Resource for Neuroscience Research. Practice and Experience in Advanced Research Computing; Portland, OR, USA: Association for Computing Machinery; 2020. p. 1–7.
-
-
eLife assessment
This study is a useful analysis of the organization of synaptic proteins of a developing synapse in the binocular path visual system and how it is impacted by manipulations in activity. The original images collected by STORM microscopy are state-of-the-art in terms of the high-resolution view of the protein components of a synapse in intact tissue. However, the analysis is incomplete and does not fully support several of the conclusions of the study.
-
Reviewer #1 (Public Review):
Summary:
This publication applies 3D super-resolution STORM imaging to understanding the role of developmental neural activity in the clustering of retinal inputs to the mouse dorsal lateral geniculate nucleus (dLGN). The authors argue that retinal ganglion cell (RGC) synaptic boutons start forming clusters early in postnatal development (P2). They then argue that these clusters contribute to eye-specific segregation of retinal inputs by activity-dependent stabilization of nearby boutons from the same eye. The data provided is N=3 animals for each condition of P2, P4, and P8 animals in wild-type mice and in mice where early patterns of structured retinal activity are blocked.Strengths:
The 3D storm imaging of pre and postsynaptic elements provides convincing high-resolution localization of synapses.The …
Reviewer #1 (Public Review):
Summary:
This publication applies 3D super-resolution STORM imaging to understanding the role of developmental neural activity in the clustering of retinal inputs to the mouse dorsal lateral geniculate nucleus (dLGN). The authors argue that retinal ganglion cell (RGC) synaptic boutons start forming clusters early in postnatal development (P2). They then argue that these clusters contribute to eye-specific segregation of retinal inputs by activity-dependent stabilization of nearby boutons from the same eye. The data provided is N=3 animals for each condition of P2, P4, and P8 animals in wild-type mice and in mice where early patterns of structured retinal activity are blocked.Strengths:
The 3D storm imaging of pre and postsynaptic elements provides convincing high-resolution localization of synapses.The experimental design of comparing ipsilateral and contralateral RGC axon boutons in a region of the dLGN that is known to become contralateral is elegant. The design makes it possible to relate fixed time point structural data to a known outcome of activity-dependent remodeling.
Weaknesses:
Based on previous literature, it is known that synapse density, synapse clustering, and synaptic specificity increase during postnatal development. Previous work has also shown that both the changes in synaptic clustering and synaptic specificity are affected by retinal activity. The data and analysis provided by the authors add little unambiguous evidence that advances this understanding.General problem 1: Most of the statistical analysis is limited to ANOVA comparison of axons from the contralateral and ipsilateral retina in the contralateral dLGN. The hypothesis that ipsilateral and contralateral axons would be statistically identical in the contralateral dLGN is not a plausible hypothesis so rejecting the hypothesis with P < X does not advance the authors' arguments beyond what was already known.
General problem 2: Most of the interpretation of data is qualitative. While error bars are provided, these error bars are not used to draw conclusions. Given the small sample size (N=3), there is a large degree of uncertainty regarding the magnitude of changes (synapse size, number, specificity). The authors base their conclusions on the averages of these values when the likely degree of uncertainty could allow for the opposite interpretation.
General problem 3: Two of the four results sections depend on using the frequency of single active zone vGlut2 clusters near multiple active zone vGlut2 as a proxy for synaptic stabilization of the single active zone vGlut2 clusters by the multiple active zone vGlut2 clusters. The authors argue that the increased frequency of same-eye single active zone clusters relative to opposite-eye single active zone clusters means that multiple active zone vGlut2 clusters are selectively stabilizing single active zone clusters. There are other plausible explanations for this observation that are not eliminated. An increased frequency of nearby single active zone clusters would also occur if RGC axons form more than one synapse in the dLGN. Eye-specific segregation is, by definition, a relative increase in the frequency of nearby boutons from the same eye. The authors were, therefore, guaranteed to observe a non-random relationship between boutons from the same eye. The authors do compare their measures to a random model, but I could not find a description of the model. I would expect that the model would need to account for RGC arbor size, arbor structure, bouton number, and segregation independent of multi-active-zone vGlut2 clusters. The most common randomization for the type of analysis described here, a shift in the positions of single-active zone boutons, would not be adequate.
In discussing the claimed cluster-induced stabilization of nearby boutons, the authors state that the specificity increases with age due to activity-dependent refinement. Their quantification does not support an increase in specificity with age. In fact, the high degree of clustering "specificity" they observe at P2 argues for the trivial same axon explanation.
Analysis of specific claims:
Result Section 1
Most of the figures show mean, error bars, and asterisks, but not the three data points from which these statistics are derived. Large changes in variance from condition to condition suggest that displaying the data points would provide more useful information.
Claim 1: Contralateral density increases more than ipsilateral in the contralateral region over the course of development. This claim is supported by the qualitative comparison of means and error bars in Figure 2D. The argument could be made quantitative by providing a confidence interval for synapse density increase for dominant and non-dominant synapse density. A confidence interval could then be generated for the difference in this change between the two groups. Currently, the most striking effect is a big difference in variance between P4 and P8 for dominant eye complex synapses. Given that N=3, I assume there is one extreme outlier here.
Claim 2: The fraction of multiple-active zone vGlut2 clusters increases with age. This claim is weakly supported by a qualitative reading of panel 1E. The error bars overlap so it is difficult to know what the range of possible increases could be. In the text, the authors report mean differences without confidence intervals (or any other statistics). The reported results should, therefore, be interpreted as a description of their three mice and not as evidence about mice in general.
Figure S1. Panel A makes the point that the study could not be done without STORM by comparing the STORM images to "Conventional" images. The images are over-saturated low-resolution images. A reasonable comparison would be to a high-quality quality confocal image acquired with a high NA objective (~1.4) and low laser power (PSF ~ 0.2 x 0.2 x 0.6 um) that was acquired over the same amount of time it takes to acquire a STORM volume.
Result section 2.
Claim 1: The ipsi/contra (in contra LGN) difference in VGluT2 cluster volume increases with development. While there are many p-values listed, the main point is not directly quantified. A reasonable way to quantify the relative increase in volume could be in the form: the non-dominant volumes were 75%-95%(?) of the dominant volume at P2 and 60%-80% (?) at P8. The difference in change was -5 to 15%(?).
Claim 2: Complex synapses (vGlut2 clusters with multiple active zones) represent clusters of simple synapses and not single large boutons with multiple active zones. The authors argue that because vGlut2 cluster volume scales roughly linearly with active zone number, the vGlut2 clusters are composed of multiple boutons each containing a single active zone. Their analysis does not rule out the (known to be true) possibility that RGC bouton sizes are much larger in boutons with multiple active zones. The correlation of volume and active zone number, by itself, does not resolve the issue. A good argument for multiple boutons might be that the variance is smallest in clusters with 4 active zones (looks like it in the plot) since they would be the average of four active zones to vesicle pool ratios. It is very likely that the multi-active zone vGlut2 clusters represent some clustering and some multi-synaptic boutons. The reference cited by the authors as evidence for the presence of single active zone boutons in young tissue does not rule out the existence of multiple active zone boutons.
Several arguments are made that depend on the interpretation of "not statistically significant" (n.s.) meaning that "two groups are the same" instead of "we don't know if they are different". This interpretation is incorrect and materially impacts the conclusions.
Several arguments are made that interpret statistical significance for one group and a lack of statistical significance for another group meaning that the effect was bigger in the first group. This interpretation is incorrect and materially impacts the conclusions.
Result Section 3.
Claim 1: Complex synapses stabilize simple synapses. There are alternative explanations (mentioned above) for the observed clustering that negate the conclusions. 1) Boutons from the same axon tend to be found near one another. 2) Any form of eye-specific segregation would produce non-random associations in the analysis as performed. The authors compare each observation to a random model, but I cannot determine from the text if the model adequately accounts for alternative explanations.
The authors claim that specificity increases over time. Figure 3b (middle) shows that the number of synapses near complex synapses might increase with time (needs confidence interval for effect size), but does not show that specificity (original relative to randomized) increases with time. The fact that nearby simple synapse density is always (P2) very different from random suggests a primarily non-activity-dependent explanation. The simplest explanation is that same-side boutons could be from the same axon whereas different-side axons could not be.
Claim 2: vGlut2 clusters more than 1.5 um away from multi-active zone vGlut2 clusters are not statistically significantly different in size than vGlut2 clusters within 1.5 um of multi-active zone vGlut2 clusters. Therefore "activity-dependent synapse stabilization mechanisms do not impact simple synapse vesicle pool size". The specific measure of 1.5 um from multi-active zone vGlut2 clusters does not represent all possible synapse stabilization mechanisms.
Result Section 4.
Claim: The proximity of complex synapses with nearby simple synapses to other complex synapses with nearby simple synapses from the same eye is used to argue that activity is responsible for all this clustering.
It is difficult to derive anything from the quantification besides 'not-random'. That is a problem because we already know that axons from the left and right eye segregate during the period being studied. All the measures in Section 4 are influenced by eye-specific segregation. Given this known bias, demonstrating a non-random relationship (P
The results can be stated as: If you are a contralateral complex synapse, contralateral complex synapses that are also close to contralateral simple synapses will, on average, be slightly closer to you than contralateral complex synapses that are not close to contralateral ipsilateral synapses. That would be true if there is any eye-specific segregation (which there is).It is an overinterpretation of the data to claim that the lack of a clear correlation between vGlut2 cluster volume and distance to vGlut2 clusters with multiple active zones provides support for the claim that "presynaptic protein organization is not influenced by mechanisms governing synaptic clustering".
-
Reviewer #2 (Public Review):
Summary:
In this manuscript, Zhang and Speer examine changes in the spatial organization of synaptic proteins during eye-specific segregation, a developmental period when axons from the two eyes initially mingle and gradually segregate into eye-specific regions of the dorsal lateral geniculate. The authors use STORM microscopy and immunostain presynaptic (VGluT2, Bassoon) and postsynaptic (Homer) proteins to identify synaptic release sites. Activity-dependent changes in this spatial organization are identified by comparing the β2KO mice to WT mice. They describe two types of presynaptic organization based on Bassoon clustering, the complex and the simple synapse. By analyzing the relative densities and distances between these proteins over age, the authors conclude that the complex synapses promote the …Reviewer #2 (Public Review):
Summary:
In this manuscript, Zhang and Speer examine changes in the spatial organization of synaptic proteins during eye-specific segregation, a developmental period when axons from the two eyes initially mingle and gradually segregate into eye-specific regions of the dorsal lateral geniculate. The authors use STORM microscopy and immunostain presynaptic (VGluT2, Bassoon) and postsynaptic (Homer) proteins to identify synaptic release sites. Activity-dependent changes in this spatial organization are identified by comparing the β2KO mice to WT mice. They describe two types of presynaptic organization based on Bassoon clustering, the complex and the simple synapse. By analyzing the relative densities and distances between these proteins over age, the authors conclude that the complex synapses promote the clustering of simple synapses nearby to form the future mature glomerular synaptic structure.Strengths:
The data presented is of good quality and provides an unprecedented view at high resolution of the presynaptic components of the retinogeniculate synapse during active developmental remodeling. This approach offers an advance to the previous mouse EM studies of this synapse because of the CTB label allows identification of the eye from which the presynaptic terminal arises. Using this approach, the authors find that simple synapses cluster close to complex synapses over age, that complex synapse density increases with age.Weaknesses:
From these data, the authors conclude that the complex synapse serves to "promote clustering of like-eye synapses and prohibit synapse clustering from the opposite eye". However, the authors show no causal data to support these ideas. There are a number of issues that the authors should consider:1. Clustering of retinal synapses is in part due to the fact that retinal inputs synapse on the proximal dendrites. With increased synaptogenesis, there will be increased density of retinal terminals that are closely localized. And with development, perhaps simple synapses mature into complex synapses. Simple synapses may also represent ones that are in the process of being eliminated as previously described by Campbell and Shatz, JNeurosci 1992 (consider citing). Can the authors distinguish these scenarios from the ones that they conclude?
2. The argument that "complex" synapses are the aggregate of "simple" synapses (Fig 2, S2) is not convincing.
3. The authors use of the β2KO mice to assess changes in the organization of synaptic proteins in retinal terminals that have disrupted retinal waves. However, β2-nAChRs are also expressed in the dLGN and other areas of the brain and glutamatergic synapse development has been reported in the CNS independent of the disruption in retinal waves. This issue should be considered when interpreting the total reduced retinal synapse density in the dLGN of the mutant.
4. Outside of a total synapse density difference between WT and β2KO mice, the changes in the spatial organization of synaptic proteins over development do not seem that different. In fact % simple synapses near complex synapses from the non-dominant eye in the mutant is not that different from WT at P8 (Fig 3C), an age when eye-specific segregation is very different between the genotypes. Can the authors explain this discrepancy?
5. The authors use nomenclature that has been previously used and associated with other aspects of retinogeniculate properties. For example, the phrases "simple" and "complex" synapses have been used to describe single boutons or aggregates of boutons from numerous retinal axons, whereas in this manuscript the phrases are used to describe vesicle clusters/release sites with no knowledge of whether they are from single or multiple boutons. Likewise, the use of the word "glomerulus" has been used in the context of the retinogeniculate synapse to refer to a specific pattern of bouton aggregates that involves inhibitory and neuromodulatory inputs. It is not clear how the release sites described by the authors fit in this picture. Finally the use of the word "punishment" is associated with a body of literature regarding the immune system and retinogeniculate refinement-which is not addressed in this study. This double use of the phrases can lead to confusion in the field and should be clarified by clear definitions of how they are used in the current study.
-
Reviewer #3 (Public Review):
Summary:
This manuscript is a follow-up to a recent study of synaptic development based on a powerful data set that combines anterograde labeling, immunofluorescence labeling of synaptic proteins, and STORM imaging (Cell Reports 2023). Specifically, they use anti-Vglut2 label to determine the size of the presynaptic structure (which they describe as the vesicle pool size), anti-Bassoon to label a number of active zones, and anti-Homer to identify postsynaptic densities. In their previous study, they compared the detailed synaptic structure across the development of synapses made with contra-projecting vs ipsi-projecting RGCs and compared this developmental profile with a mouse model with reduced retinal waves. In this study, they produce a new analysis on the same data set in which they classify synapses …Reviewer #3 (Public Review):
Summary:
This manuscript is a follow-up to a recent study of synaptic development based on a powerful data set that combines anterograde labeling, immunofluorescence labeling of synaptic proteins, and STORM imaging (Cell Reports 2023). Specifically, they use anti-Vglut2 label to determine the size of the presynaptic structure (which they describe as the vesicle pool size), anti-Bassoon to label a number of active zones, and anti-Homer to identify postsynaptic densities. In their previous study, they compared the detailed synaptic structure across the development of synapses made with contra-projecting vs ipsi-projecting RGCs and compared this developmental profile with a mouse model with reduced retinal waves. In this study, they produce a new analysis on the same data set in which they classify synapses into "complex" vs. "simple" and assess the number and spacing of these synapses. From these measurements, they make conclusions regarding the processes that lead to synapse competition/stabilization.Strengths:
This is a fantastic data set for describing the structural details of synapse development in a part of the brain undergoing activity-dependent synaptic rearrangements. The fact that they can differentiate eye of origin is also a plus.Weaknesses:
The lack of details provided for the classification scheme as well as the interpretation of small effect sizes limit the interpretations that can be made based on these findings.1. The criteria to classify synapses as simple vs. complex is critical for all of the analysis in this study. Therefore this criteria for classification should be much more explicit and tested for robustness. As stated in the methods, it is based on the number of active zones which are designated by the number of Bassoon clusters associated with a Vglut2 cluster (line 697). A second part of the criteria is the size of the presynaptic terminal as assayed by "greater Vglut2 signal" (line 116). So how are these thresholds determined? For Bassoon clusters, is one voxel sufficient? Two? If it's one, how often do they see a Bassoon positive voxel with no Vglut2 cluster and therefore may represent "noise"? There is no distribution of Bassoon volumes that is provided that might be the basis for selecting this number of sites. Unfortunately, the images are not helpful. For example, does P8 WT in Figure 1B have 7 or 2? According to Figure 2C, it appears the numbers are closer to 2-4.
The Vglut volume measurements also do not seem to provide a clear criterion. Figure 2 shows that the distributions of Vglut2 cluster volumes for complex and for simple synapses are significantly overlapping.
The authors need to clarify the quantitative approach used for this classification strategy and test how sensitive the results of the study are to how robust this strategy is
2. Effect sizes are quite small and all comparisons are made on medians of distributions. This leads to an n=3 biological replicates for all comparisons. Hence this small n may lead to significant results based on ANOVAS/t-tests, but the statistical power of these effects is quite weak. To accurately represent the variance in their data, the authors should show all three data points for each category (with a SD error bar when possible). They should also include the number of synapses in each category (e.g. the numerators in Figure 1D and the denominators for Figure 1E). For other figures, there are additional statistical questions described below.
3. The authors need to add a caveat regarding their classification of synapses as "complex" vs. "simple" since this is a terminology that already exists in the field and it is not clear that these STORM images are measuring the same thing. For example, in EM studies, "complex" refers to multiple RGCs converging on the same single postsynaptic site. The authors here acknowledge that they cannot assign different AZs to different RGCs so this comparison is an assumption. In Figure 2 they argue this is a good assumption based on the finding that the Vglut column/active zone is constant and therefore each represents a single RGC. However, the authors should acknowledge that they are actually seeing quite different percentages than those in EM studies. For example, in Monavarfeshani et al, eLife 2018, there were no complex synapses found at P8. (Note this study also found many more complex vs. simple synapses in the adult - 70% vs. the 20% found in the current study - but this difference could be a developmental effect). In the future, the authors may want to take another data set in the adult dLGN to make a direct comparison based on numbers and see if their classification method for complex/simple maps onto the one that currently exists in the literature.
4. Figure 3 assays the relative distribution of simple vs. complex synapses. They found that a larger percentage of simple synapses were within 1.5 microns of complex synapses than you would expect by chance for both ipsi and contra projecting RGCs, and hence conclude that complex synapses are sites of synaptic clustering. In contrast, there was no clustering of ipsi-simple to contra-complex synapses and vice versa. The authors also argue that this clustering decreases between P4 and P8 for ipsi projecting RGCs.
This analysis needs much more rigor before any conclusions can be drawn. First, the authors need to justify the 1.5-micron criteria for clustering and how robust their results are to variations in this distance. Second, these age effects need to be tested for statistical significance with an ANOVA (all the stats presented are pairwise comparisons to means expected by random distributions at each age). Finally, the authors should consider what n's to use here - is it still grouped by biological replicate? Why not use individual synapses across mice? If they do biological replicates, then they should again show error bars for each data point in their biological replicates. And they should include the number of synapses that went into these measurements in the caption.
5. Line 211-212 - the authors conclude that the absence of clustered ipsi-simple synapses indicates a failure to stabilize (Figure 3). Yet, the link between this measurement and synapse stabilization is not clear. In particular, the conclusion that "isolated" synapses are the ones that will be eliminated seems to be countered by their finding in Figure 3D/E which shows that there is no difference in vesicle pool volume between near and far synapses. If isolated synapses are indeed the ones that fail to stabilize by P8, wouldn't you expect them to be weaker/have fewer vesicles? Also, it's hard to tell if there is an age-dependent effect since the data presented in Figures 3D/E are merged across ages.
-
