The antigenic landscape of human influenza N2 neuraminidases from 2009 until 2017
Curation statements for this article:-
Curated by eLife

eLife assessment
This study presents valuable data on the antigenic properties of neuraminidase proteins of human A/H3N2 influenza viruses sampled between 2009 and 2017. The antigenic properties are found to be generally concordant with genetic groups. Compared to a previous version, additional analyses have strengthened the work, with solid evidence supporting the claims of the authors.
This article has been Reviewed by the following groups
Discuss this preprint
Start a discussion What are Sciety discussions?Listed in
- Evaluated articles (eLife)
Abstract
Human H3N2 influenza viruses are subject to rapid antigenic evolution which translates into frequent updates of the composition of seasonal influenza vaccines. Despite these updates, the effectiveness of influenza vaccines against H3N2-associated disease is suboptimal. Seasonal influenza vaccines primarily induce hemagglutinin-specific antibody responses. However, antibodies directed against influenza neuraminidase (NA) also contribute to protection. Here, we analysed the antigenic diversity of a panel of N2 NAs derived from human H3N2 viruses that circulated between 2009 and 2017. The antigenic breadth of these NAs was determined based on the NA inhibition (NAI) of a broad panel of ferret and mouse immune sera that were raised by infection and recombinant N2 NA immunisation. This assessment allowed us to distinguish at least four antigenic groups in the N2 NAs derived from human H3N2 viruses that circulated between 2009 and 2017. Computational analysis further revealed that the amino acid residues in N2 NA that have a major impact on susceptibility to NAI by immune sera are in proximity of the catalytic site. Finally, a machine learning method was developed that allowed to accurately predict the impact of mutations that are present in our N2 NA panel on NAI. These findings have important implications for the renewed interest to develop improved influenza vaccines based on the inclusion of a protective NA antigen formulation.
Article activity feed
-

-
-

Author response:
The following is the authors’ response to the previous reviews.
eLife assessment
This study presents valuable data on the antigenic properties of neuraminidase proteins of human A/H3N2 influenza viruses sampled between 2009 and 2017. The antigenic properties are found to be generally concordant with genetic groups. Additional analysis have strengthened the revised manuscript, and the evidence supporting the claims is solid.
Public Reviews:
Reviewer #1 (Public Review):
Summary
The authors investigated the antigenic diversity of recent (2009-2017) A/H3N2 influenza neuraminidases (NAs), the second major antigenic protein after haemagglutinin. They used 27 viruses and 43 ferret sera and performed NA inhibition. This work was supported by a subset of mouse sera. Clustering analysis determined 4 antigenic clusters, …
Author response:
The following is the authors’ response to the previous reviews.
eLife assessment
This study presents valuable data on the antigenic properties of neuraminidase proteins of human A/H3N2 influenza viruses sampled between 2009 and 2017. The antigenic properties are found to be generally concordant with genetic groups. Additional analysis have strengthened the revised manuscript, and the evidence supporting the claims is solid.
Public Reviews:
Reviewer #1 (Public Review):
Summary
The authors investigated the antigenic diversity of recent (2009-2017) A/H3N2 influenza neuraminidases (NAs), the second major antigenic protein after haemagglutinin. They used 27 viruses and 43 ferret sera and performed NA inhibition. This work was supported by a subset of mouse sera. Clustering analysis determined 4 antigenic clusters, mostly in concordance with the genetic groupings. Association analysis was used to estimate important amino acid positions, which were shown to be more likely close to the catalytic site. Antigenic distances were calculated and a random forest model used to determine potential important sites.
This revision has addressed many of my concerns of inconsistencies in the methods, results and presentation. There are still some remaining weaknesses in the computational work.
Strengths
(1) The data cover recent NA evolution and a substantial number (43) of ferret (and mouse) sera were generated and titrated against 27 viruses. This is laborious experimental work and is the largest publicly available neuraminidase inhibition dataset that I am aware of. As such, it will prove a useful resource for the influenza community.
(2) A variety of computational methods were used to analyse the data, which give a rounded picture of the antigenic and genetic relationships and link between sequence, structure and phenotype.
(3) Issues raised in the previous review have been thoroughly addressed.
Weaknesses
(1). Some inconsistencies and missing data in experimental methods Two ferret sera were boosted with H1N2, while recombinant NA protein for the others. This, and the underlying reason, are clearly explained in the manuscript. The authors note that boosting with live virus did not increase titres. Additionally, one homologous serum (A/Kansas/14/2017) was not generated, although this would not necessarily have impacted the results.
We agree with the reviewer and this point was addressed in the previous rebuttal.
(2) Inconsistency in experimental results
Clustering of the NA inhibition results identifies three viruses which do not cluster with their phylogenetic group. Again this is clearly pointed out in the paper and is consistent with the two replicate ferret sera. Additionally, A/Kansas/14/2017 is in a different cluster based on the antigenic cartography vs the clustering of the titres
We agree with the reviewer and this point was addressed in the previous rebuttal.
(3) Antigenic cartography plot would benefit from documentation of the parameters and supporting analyses
a. The number of optimisations used
We used 500 optimizations. This information is now included in the Methods section.
b. The final stress and the difference between the stress of the lowest few (e.g. 5) optimisations, or alternatively a graph of the stress of all the optimisations. Information on the stress per titre and per point, and whether any of these were outliers
The stress was obtained from 1, 5, 500, or even 5000 optimizations (resulting in stress values of respectively, 1366.47, 1366.47, 2908.60, and 3031.41). Besides limited variation or non-conversion of the stress values after optimization, the obtained maps were consistent in multiple runs. The map was obtained keeping the best optimization (stress value 1366.47, selected using the keepBestOptimization() function).
Author response image 1.
The stress per point is presented in the heat map below.
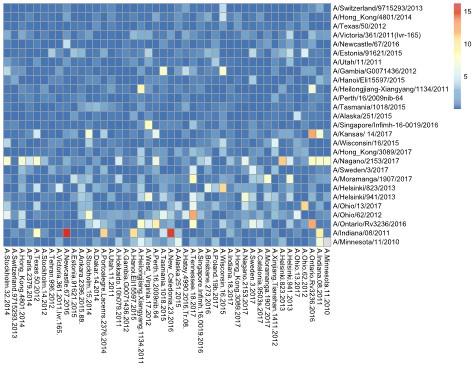
The heat map indicates stress per serum (x-axis) and strain (y-axis) in blue to red scale.
c. A measure of uncertainty in position (e.g. from bootstrapping)
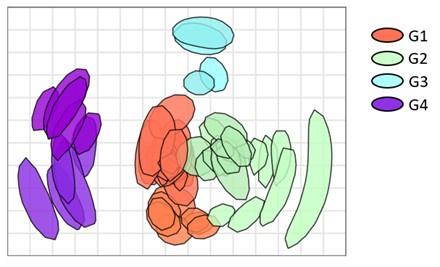
Bootstrap was performed using 1000 repeats and 100 optimizations per repeat. The uncertainty is represented in the blob plot below.
Author response image 2.
(4) Random forest
The full dataset was used for the random forest model, including tuning the hyperparameters. It is more robust to have a training and test set to be able to evaluate overfitting (there are 25 features to classify 43 sera).
Explicit cross validation is not necessary for random forests as the out of bag process with multiple trees implicitly covers cross validation. In the random forest function in R this is done by setting the mtry argument (number of variables randomly sampled as candidates at each split). R samples variables with replacement (the same variable can be sampled multiple times) of the candidates from the training set. RF will then automatically take the data that is not selected as candidates as test set. Overfit may happen when all data is used for training but the RF method implicitly does use a test set and does not use all data for training.
Code:
rf <- randomForest(X,y=Y,ntree=1500,mtry=25,keep.forest=TRUE,importance=TRUE)
Reviewer #2 (Public Review):
Summary:
The authors characterized the antigenicity of N2 protein of 43 selected A(H3N2) influenza A viruses isolated from 2009-2017 using ferret and mice immune sera. Four antigenic groups were identified, which the authors claimed to be correlated with their respective phylogenic/ genetic groups. Among 102 amino acids differed by the 44 selected N2 proteins, the authors identified residues that differentiate the antigenicity of the four groups and constructed a machine-learning model that provides antigenic distance estimation. Three recent A(H3N2) vaccine strains were tested in the model but there was no experimental data to confirm the model prediction results.
Strengths:
This study used N2 protein of 44 selected A(H3N2) influenza A viruses isolated from 2009-2017 and generated corresponding panels of ferret and mouse sera to react with the selected strains. The amount of experimental data for N2 antigenicity characterization is large enough for model building.
Weaknesses:
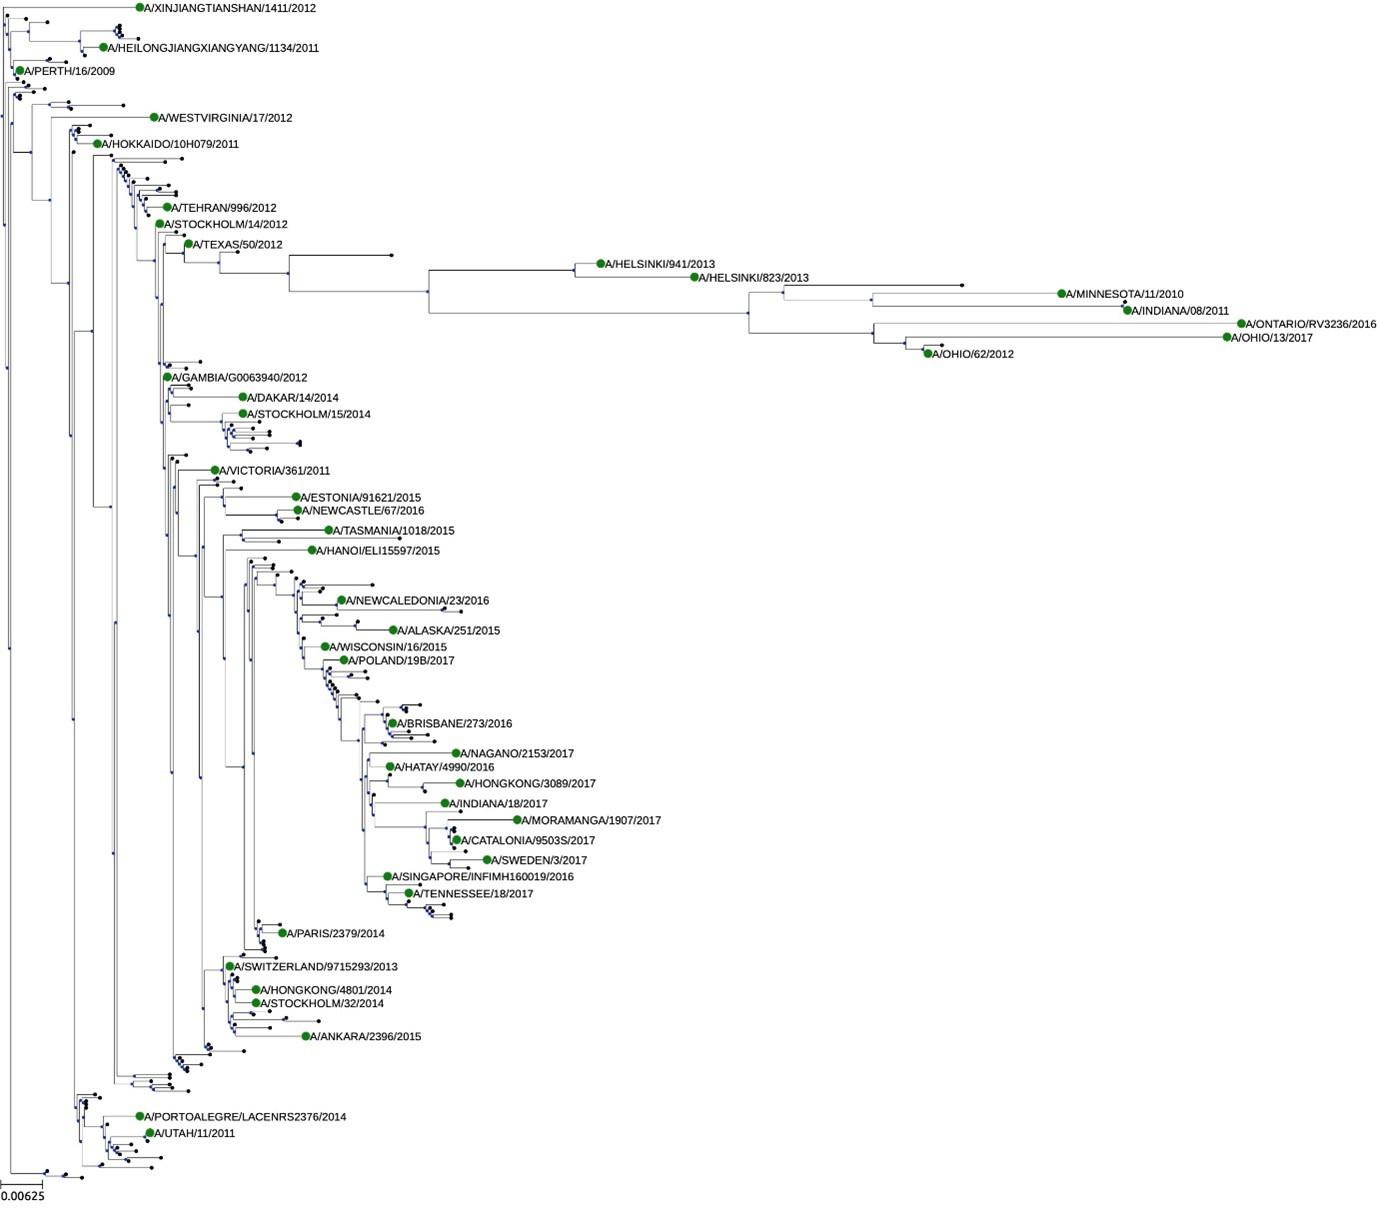
The main weakness is that the strategy of selecting 43 A(H3N2) viruses from 2009-2017 was not explained. It is not clear if they represent the overall genetic diversity of human A(H3N2) viruses circulating during this time. In response to the reviewer's comment, the authors have provided a N2 phylogenetic tree using180 randomly selected N2 sequences from human A(H3N2) viruses from 2009-2017. While the 43 strains seems to scatter across the N2 tree, the four antigenic groups described by the author did not correlated with their respective phylogenic/ genetic groups as shown in Fig. 2. The authors should show the N2 phylogenic tree together with Fig. 2 and discuss the discrepancy observed.
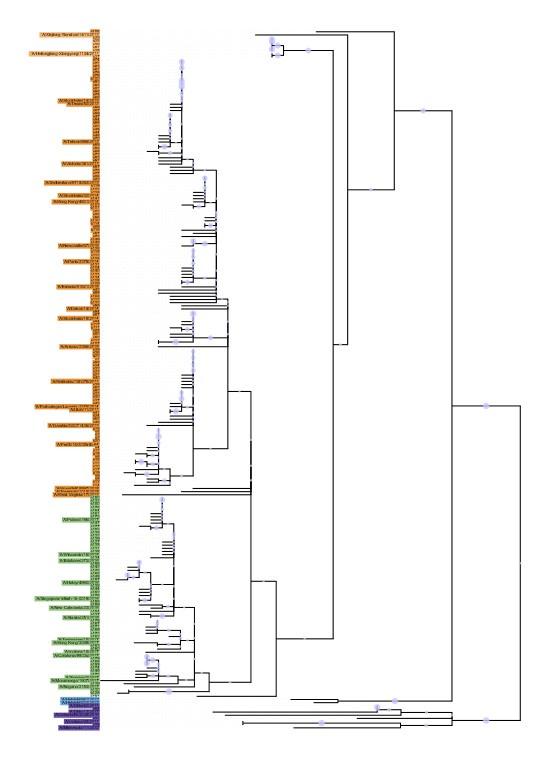
The discrepancies between the provided N2 phylogenetic tree using 180 selected N2 sequences was primarily due to visualization. In the tree presented in Figure 2 the phylogeny was ordered according to branch length in a decreasing way. Further, the tree represented in the rebuttal was built with PhyML 3.0 using JTT substitution model, while the tree in figure 2 was build in CLC Workbench 21.0.5 using Bishop-Friday substitution model. The tree below was built using the same methodology as Figure 2, including branch size ordering. No discrepancies are observed.
Phylogenetic tree representing relatedness of N2 head domain. N2 NA sequences were ordered according to the branch length and phylogenetic clusters are colored as follows: G1: orange, G2: green, G3: blue, and G4: purple. NA sequences that were retained in the breadth panel are named according to the corresponding H3N2 influenza viruses. The other NA sequences are coded.
Author response image 3.
The second weakness is the use of double-immune ferret sera (post-infection plus immunization with recombinant NA protein) or mouse sera (immunized twice with recombinant NA protein) to characterize the antigenicity of the selected A(H3N2) viruses. Conventionally, NA antigenicity is characterized using ferret sera after a single infection. Repeated influenza exposure in ferrets has been shown to enhance antibody binding affinity and may affect the cross-reactivity to heterologous strains (PMID: 29672713). The increased cross-reactivity is supported by the NAI titers shown in Table S3, as many of the double immune ferret sera showed the highest reactivity not against its own homologous virus but to heterologous strains. In response to the reviewer's comment, the authors agreed the use of double-immune ferret sera may be a limitation of the study. It would be helpful if the authors can discuss the potential effect on the use of double-immune ferret sera in antigenicity characterization in the manuscript.
Our study was designed to understand the breadth of the anti-NA response after the incorporation of NA as a vaccine antigens. Our data does not allow to conclude whether increased breadth of protection is merely due to increased antibody titers or whether an NA boost immunization was able to induce antibody responses against epitopes that were not previously recognized by primary response to infection. However, we now mention this possibility in the discussion and cite Kosikova et al. CID 2018, in this context.
Another weakness is that the authors used the newly constructed a model to predict antigenic distance of three recent A(H3N2) viruses but there is no experimental data to validate their prediction (eg. if these viruses are indeed antigenically deviating from group 2 strains as concluded by the authors). In response to the comment, the authors have taken two strains out of the dataset and use them for validation. The results is shown as Fig. R7. However, it may be useful to include this in the main manuscript to support the validity of the model.
The removal of 2 strains was performed to illustrate the predictive performance of the RF modeling. However, Random Forest does not require cross-validation. The reason is that RF modeling already uses an out-of-bag evaluation which, in short, consists of using only a fraction of the data for the creation of the decision trees (2/3 of the data), obviating the need for a set aside the test set:
“…In each bootstrap training set, about one-third of the instances are left out. Therefore, the out-of-bag estimates are based on combining only about one- third as many classifiers as in the ongoing main combination. Since the error rate decreases as the number of combinations increases, the out-of-bag estimates will tend to overestimate the current error rate. To get unbiased out-of-bag estimates, it is necessary to run past the point where the test set error converges. But unlike cross-validation, where bias is present but its extent unknown, the out-of-bag estimates are unbiased…” from https://www.stat.berkeley.edu/%7Ebreiman/randomforest2001.pdf
Reviewer #3 (Public Review):
Summary:
This paper by Portela Catani et al examines the antigenic relationships (measured using monotypic ferret and mouse sera) across a panel of N2 genes from the past 14 years, along with the underlying sequence differences and phylogenetic relationships. This is a highly significant topic given the recent increased appreciation of the importance of NA as a vaccine target, and the relative lack of information about NA antigenic evolution compared with what is known about HA. Thus, these data will be of interest to those studying the antigenic evolution of influenza viruses. The methods used are generally quite sound, though there are a few addressable concerns that limit the confidence with which conclusions can be drawn from the data/analyses.
Strengths:
- The significance of the work, and the (general) soundness of the methods. -Explicit comparison of results obtained with mouse and ferret sera
Weaknesses:
- Approach for assessing influence of individual polymorphisms on antigenicity does not account for potential effects of epistasis (this point is acknowledged by the authors).
We agree with the reviewer and this point was addressed in the previous rebuttal.
- Machine learning analyses neither experimentally validated nor shown to be better than simple, phylogenetic-based inference.
We respectfully disagree with the reviewer. This point was addressed in the previous rebuttal as follows.
This is a valid remark and indeed we have found a clear correlation between NAI cross reactivity and phylogenetic relatedness. However, besides achieving good prediction of the experimental data (as shown in Figure 5 and in FigureR7), machine Learning analysis has the potential to rank or indicate major antigenic divergences based on available sequences before it has consolidated as new clade. ML can also support the selection and design of broader reactive antigens. “
Recommendations for the authors:
Reviewer #2 (Recommendations For The Authors):
(1) Discuss the discrepancy between Fig. 2 and the newly constructed N2 phylogenetic tree with 180 randomly selected N2 sequences of A(H3N2) viruses from 2009-2017. Specifically please explain the antigenic vs. phylogenetic relationship observed in Fig. 2 was not observed in the large N2 phylogenetic tree.
Discrepancies were due to different method and visualization. A new tree was provided.
(2) Include a sentence to discuss the potential effect on the use of double-immune ferret sera in antigenic characterization.
We prefer not to speculate on this.
(3) Include the results of the exercise run (with the use of Swe17 and HK17) in the manuscript as a way to validate the model.
The exercise was performed to illustrate predictive potential of the RF modeling to the reviewer. However, cross-validation is not a usual requirement for random forest, since it uses out-of-bag calculations. We prefer to not include the exercise runs within the main manuscript.
-
eLife assessment
This study presents valuable data on the antigenic properties of neuraminidase proteins of human A/H3N2 influenza viruses sampled between 2009 and 2017. The antigenic properties are found to be generally concordant with genetic groups. Compared to a previous version, additional analyses have strengthened the work, with solid evidence supporting the claims of the authors.
-
Reviewer #1 (Public Review):
Summary
The authors investigated the antigenic diversity of recent (2009-2017) A/H3N2 influenza neuraminidases (NAs), the second major antigenic protein after haemagglutinin. They used 27 viruses and 43 ferret sera and performed NA inhibition. This work was supported by a subset of mouse sera. Clustering analysis determined 4 antigenic clusters, mostly in concordance with the genetic groupings. Association analysis was used to estimate important amino acid positions, which were shown to be more likely close to the catalytic site. Antigenic distances were calculated and a random forest model used to determine potential important sites.
This revision has addressed many of my concerns of inconsistencies in the methods, results and presentation. There are still some remaining weaknesses in the computational work.
Strengths
(1) The data cover recent NA evolution and a substantial number (43) of ferret (and mouse) sera were generated and titrated against 27 viruses. This is laborious experimental work and is the largest publicly available neuraminidase inhibition dataset that I am aware of. As such, it will prove a useful resource for the influenza community.
(2) A variety of computational methods were used to analyse the data, which give a rounded picture of the antigenic and genetic relationships and link between sequence, structure and phenotype.
(3) Issues raised in the previous review have been thoroughly addressed.
Weaknesses:
Some concerns regarding the robustness of the machine learning model and potential overfitting remain.
-
Reviewer #2 (Public Review):
Summary:
The authors characterized the antigenicity of N2 protein of 43 selected A(H3N2) influenza A viruses isolated from 2009-2017 using ferret and mice immune sera. Four antigenic groups were identified, which the authors claimed to be correlated with their respective phylogenic/ genetic groups. Among 102 amino acids differed by the 44 selected N2 proteins, the authors identified residues that differentiate the antigenicity of the four groups and constructed a machine-learning model that provides antigenic distance estimation. Three recent A(H3N2) vaccine strains were tested in the model but there was no experimental data to confirm the model prediction results.
Strengths:
This study used N2 protein of 44 selected A(H3N2) influenza A viruses isolated from 2009-2017 and generated corresponding panels of …
Reviewer #2 (Public Review):
Summary:
The authors characterized the antigenicity of N2 protein of 43 selected A(H3N2) influenza A viruses isolated from 2009-2017 using ferret and mice immune sera. Four antigenic groups were identified, which the authors claimed to be correlated with their respective phylogenic/ genetic groups. Among 102 amino acids differed by the 44 selected N2 proteins, the authors identified residues that differentiate the antigenicity of the four groups and constructed a machine-learning model that provides antigenic distance estimation. Three recent A(H3N2) vaccine strains were tested in the model but there was no experimental data to confirm the model prediction results.
Strengths:
This study used N2 protein of 44 selected A(H3N2) influenza A viruses isolated from 2009-2017 and generated corresponding panels of ferret and mouse sera to react with the selected strains. The amount of experimental data for N2 antigenicity characterization is large enough for model building.
Weaknesses:
One weakness is the use of double-immune ferret sera (post-infection plus immunization with recombinant NA protein) or mouse sera (immunized twice with recombinant NA protein) to characterize the antigenicity of the selected A(H3N2) viruses. Conventionally, NA antigenicity is characterized using ferret sera after a single infection. Repeated influenza exposure in ferrets has been shown to enhance antibody binding affinity and may affect the cross-reactivity to heterologous strains (PMID: 29672713). The increased cross-reactivity is supported by the NAI titers shown in Table S3, as many of the double immune ferret sera showed the highest reactivity not against its own homologous virus but to heterologous strains. In response to the reviewer's comment, the authors agreed the use of double-immune ferret sera may be a limitation of the study.
Another weakness is that the authors used the newly constructed a model to predict antigenic distance of three recent A(H3N2) viruses but there is no experimental data to validate their prediction (eg. if these viruses are indeed antigenically deviating from group 2 strains as concluded by the authors). Leaving out data from some strains for testing is a useful check, but due to phylogenetic correlations in the data the generalizability of the machine learning is not guaranteed.
-
Reviewer #3 (Public Review):
Summary:
This paper by Portela Catani et al examines the antigenic relationships (measured using monotypic ferret and mouse sera) across a panel of N2 genes from the past 14 years, along with the underlying sequence differences and phylogenetic relationships. This is a highly significant topic given the recent increased appreciation of the importance of NA as a vaccine target, and the relative lack of information about NA antigenic evolution compared with what is known about HA. Thus, these data will be of interest to those studying the antigenic evolution of influenza viruses. The methods used are generally quite sound, though there are a few addressable concerns that limit the confidence with which conclusions can be drawn from the data/analyses.
Strengths:
-The significance of the work, and the (general) …
Reviewer #3 (Public Review):
Summary:
This paper by Portela Catani et al examines the antigenic relationships (measured using monotypic ferret and mouse sera) across a panel of N2 genes from the past 14 years, along with the underlying sequence differences and phylogenetic relationships. This is a highly significant topic given the recent increased appreciation of the importance of NA as a vaccine target, and the relative lack of information about NA antigenic evolution compared with what is known about HA. Thus, these data will be of interest to those studying the antigenic evolution of influenza viruses. The methods used are generally quite sound, though there are a few addressable concerns that limit the confidence with which conclusions can be drawn from the data/analyses.
Strengths:
-The significance of the work, and the (general) soundness of the methods.
-Explicit comparison of results obtained with mouse and ferret seraWeaknesses:
- Machine learning analyses neither experimentally validated nor shown to be better than simple, phylogenetic-based inference.
-
-
Author Response
The following is the authors’ response to the original reviews.
Reviewer #1 (Public Review):
Summary
The authors investigated the antigenic diversity of recent (2009- 2017) A/H3N2 influenza neuraminidases (NAs), the second major antigenic protein after haemagglutinin. They used 27 viruses and 43 ferret sera and performed NA inhibition. This work was supported by a subset of mouse sera. Clustering analysis determined 4 antigenic clusters, mostly in concordance with the genetic groupings. Association analysis was used to estimate important amino acid positions, which were shown to be more likely close to the catalytic site. Antigenic distances were calculated and a random forest model was used to determine potential important sites.
This has the potential to be a very interesting piece of work. At present, there are …
Author Response
The following is the authors’ response to the original reviews.
Reviewer #1 (Public Review):
Summary
The authors investigated the antigenic diversity of recent (2009- 2017) A/H3N2 influenza neuraminidases (NAs), the second major antigenic protein after haemagglutinin. They used 27 viruses and 43 ferret sera and performed NA inhibition. This work was supported by a subset of mouse sera. Clustering analysis determined 4 antigenic clusters, mostly in concordance with the genetic groupings. Association analysis was used to estimate important amino acid positions, which were shown to be more likely close to the catalytic site. Antigenic distances were calculated and a random forest model was used to determine potential important sites.
This has the potential to be a very interesting piece of work. At present, there are inconsistencies in the methods, results and presentation that limit its impact. In particular, there are weaknesses in some of the computational work.
Strengths
(1) The data cover recent NA evolution and a substantial number (43) of ferret (and mouse) sera were generated and titrated against 27 viruses. This is laborious experimental work and is the largest publicly available neuraminidase inhibition dataset that I am aware of. As such, it will prove a useful resource for the influenza community.
(2) A variety of computational methods were used to analyse the data, which give a rounded picture of the antigenic and genetic relationships and link between sequence, structure and phenotype.
Weaknesses
(1) Inconsistency in experimental methods
Two ferret sera were boosted with H1N2, while recombinant NA protein for the others. This, and the underlying reason, are clearly explained in the manuscript. The authors note that boosting with live virus did not increase titres. Nevertheless, these results are included in the analysis when it would be better to exclude them (Figure 2 shows much lower titres to their own group than other sera).
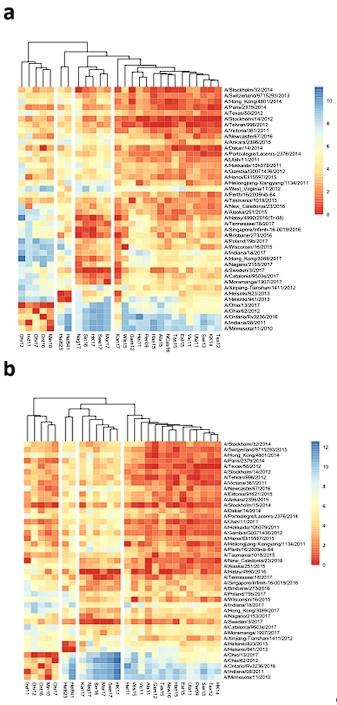
As an exercise, we have excluded the H1N2 boosted ferrets sera and no major impact was observed in the antigenic grouping (see Author response image 1a). Another way to control for differences in immunogenicity is to normalize the NAI values with the homologous ELISA titers for each antigen. Clustering based on these ELISA normalized NAI titers reveals the same 4 distinct antigenic groups but with one change: Kan17 is shifted from group 1 to group 2 (Author response image 1b). Note that a homologous ELISA titer is not available for A/West-Virginia/17/2012 and thus this serum sample is not included in Author response image 1b.
Author response image 1.
Antigenic and phylogenetic relatedness of N2 NAs. Phylogenetic tree based on the N2 NA head domain amino acid sequences and heat-map representing the average of normalized neuraminidase inhibition titer per H6N2 [log2 (max NAI/NAI)] determined in ferret sera after the boost (listed vertically). The red-to-blue scale indicates high-to-low NAI observed in ELLA against the H6N2 reassortants (listed at the bottom). UPGMA clustering of H6N2s inhibition profiles are shown on top of the heat map and colored according to the phylogenetic groups.(a) Based on the ferret sera with exclusion of the sera that were obtained following prime-boost by infection with H1N2 (A/Estonia/91625/2015 and A/Stockholm/15/2014). (b) Based on serum NAI titers that were normalized by the homologous ELISA titer.
(2) Inconsistency in experimental results
Clustering of the NA inhibition results identifies three viruses which do not cluster with their phylogenetic group. Again, this is clearly pointed out in the paper. Further investigation of this inconsistency is required to determine whether this has a genetic basis or is an experimental issue. It is difficult to trust the remaining data while this issue is unresolved.
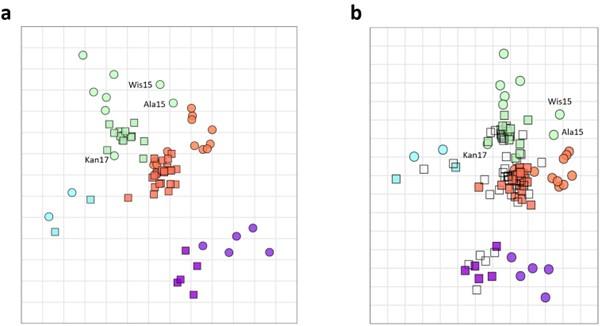
We understand the concern of the reviewer. It is important to keep in mind that discrete grouping of antigens allows to visualize major antigenic drifts. However, within closely related groups the cross reactivity of antisera is more likely distributed in a spectrum. When we constructed an antigenic map based on the antigenic cartography algorithm (as described by Smith D. et al, 2004), Kansas17, Wis15, and Ala15 are positioned more closely to antigenic group 1 than the majority of other antigens that were classified as group 2 (Author response image 2a). Similar results were obtained when individual ferret sera from the biological duplicates were used (Author response image 2b). This antigenic cartography map is now added as Figure 2. Figure supplement 3 to the revised manuscript.
Author response image 2.
The antigenic cartography was constructed using averaged data from pairs of ferrets (a). Similar analysis was performed on individual ferrets sera (b).
(3) Inconsistency in group labelling
A/Hatay/4990/2016 & A/New Caledonia/23/2016 are in phylogenetic group 1 in Figure 2 and phylogenetic group 1 in Figure 5 - figure supplement 1 panel a.
Our apologies: there was indeed a mistake in labeling of Figure 5. A new antigenic cartography was constructed and included in the revised manuscript. As a result Figure 5 - figure supplement has now become redundant and was removed from the manuscript.
A/Kansas/14/2017 is selected as a representative of antigenic group 2, when in Figure 2 it is labelled as AC1 (although Figure 2 - supplement 4 which the text is referring to shows data for A/Singapore/Infimh-16-0019/2016 as the representative of AC2). A/Kansas/14/2017 is coloured and labelled as AC2 in Figure 2 - supplement 5.
Thank you for pointing out this inconsistency. Kan17 clustered antigenically in group 1 based on the NAI values that were normalized relative to the serum with the maximal NAI value against the H6N2 virus that was tested. When using NAI titers that are normalization with the homologous ELISA titer, Kan17 is positioned in group 2. Likewise, antigenic cartography mapping positions Kan17 in group 2. Therefore, we conclude that A/Kansas/14/2017 NA is a representative of group 2.
The colouring is changed for Figure 3a at the bottom. A/Heilongjiang-Xiangyang/1134/2011 is coloured the same as AC4 viruses when it is AC1 in Figure 2. This lack of consistency makes the figures misleading.
We apologize for this mistake. The coloring in Figure 3a has been corrected.
(4) Data not presented, without explanation
The paper states that 44 sera and 27 H6N2 viruses were used (line 158). However, the results for the Kansas/14/2017 sera do not appear to be presented in any of the figures (e.g. Figure 2 phylogenetic tree, Figure 5 - figure supplement 1). It is not obvious why these data were not presented. The exclusion of this serum could affect the results as often the homologous titre is the highest and several heatmaps show the fold down from the highest titre.
Serum against A/Kansas/14/2017 was not prepared. For that reason, it is not included in the analysis. We agree that such homologous serum ideally should have been included and in the NAI assay would have resulted in a high if not the highest titer. However, we noticed that homologous sera did not always have the highest titers, especially in panels like ours were some antigens are closely related. The highest titer obtained against Kan17 H6N2 was from A/Bris/16 sera: 1/104, a titer that is in the range of other, homologous titers observed in the panel (Table S3). The Bris16 and Kan17 NAs have five amino acid differences. In summary, inclusion of Kan17 homologous sera would likely not impact the analysis and interpretation of the results because there are multiple highly cross-inhibiting heterologous serum samples against Kan17.
(5) The cMDS plot does not have sufficient quality assurance A cMDS plot is shown in Figure 5 - figure supplement 1, generated using classical MDS. The following support for the appropriateness of this visualisation is not given. a. Goodness of fit of the cMDS projection, including per point and per titre. b. Testing of the appropriate number of dimensions (the two sera from phylogenetic group 3 are clustered with phylogenetic group 2; additional dimensions might separate these groups). c. A measure of uncertainty in positioning, e.g. bootstrapping. d. A sensitivity analysis of the assumption about titres below the level of detection (i.e. that <20 = 10). Without this information, it is difficult to judge if the projection is reliable.
We agree with these comments. We have removed Figure 5 – figure supplement 1, and added new figure 2 – figure supplement 3 (antigenic cartography) instead.
(6) Choice of antigenic distance measure
The measure of antigenic distance used here is the average difference between titres for two sera. This is dependent on which viruses have been included in the analysis and will be biased by the unbalanced number of viruses in the different clusters (12, 8, 2, 5).
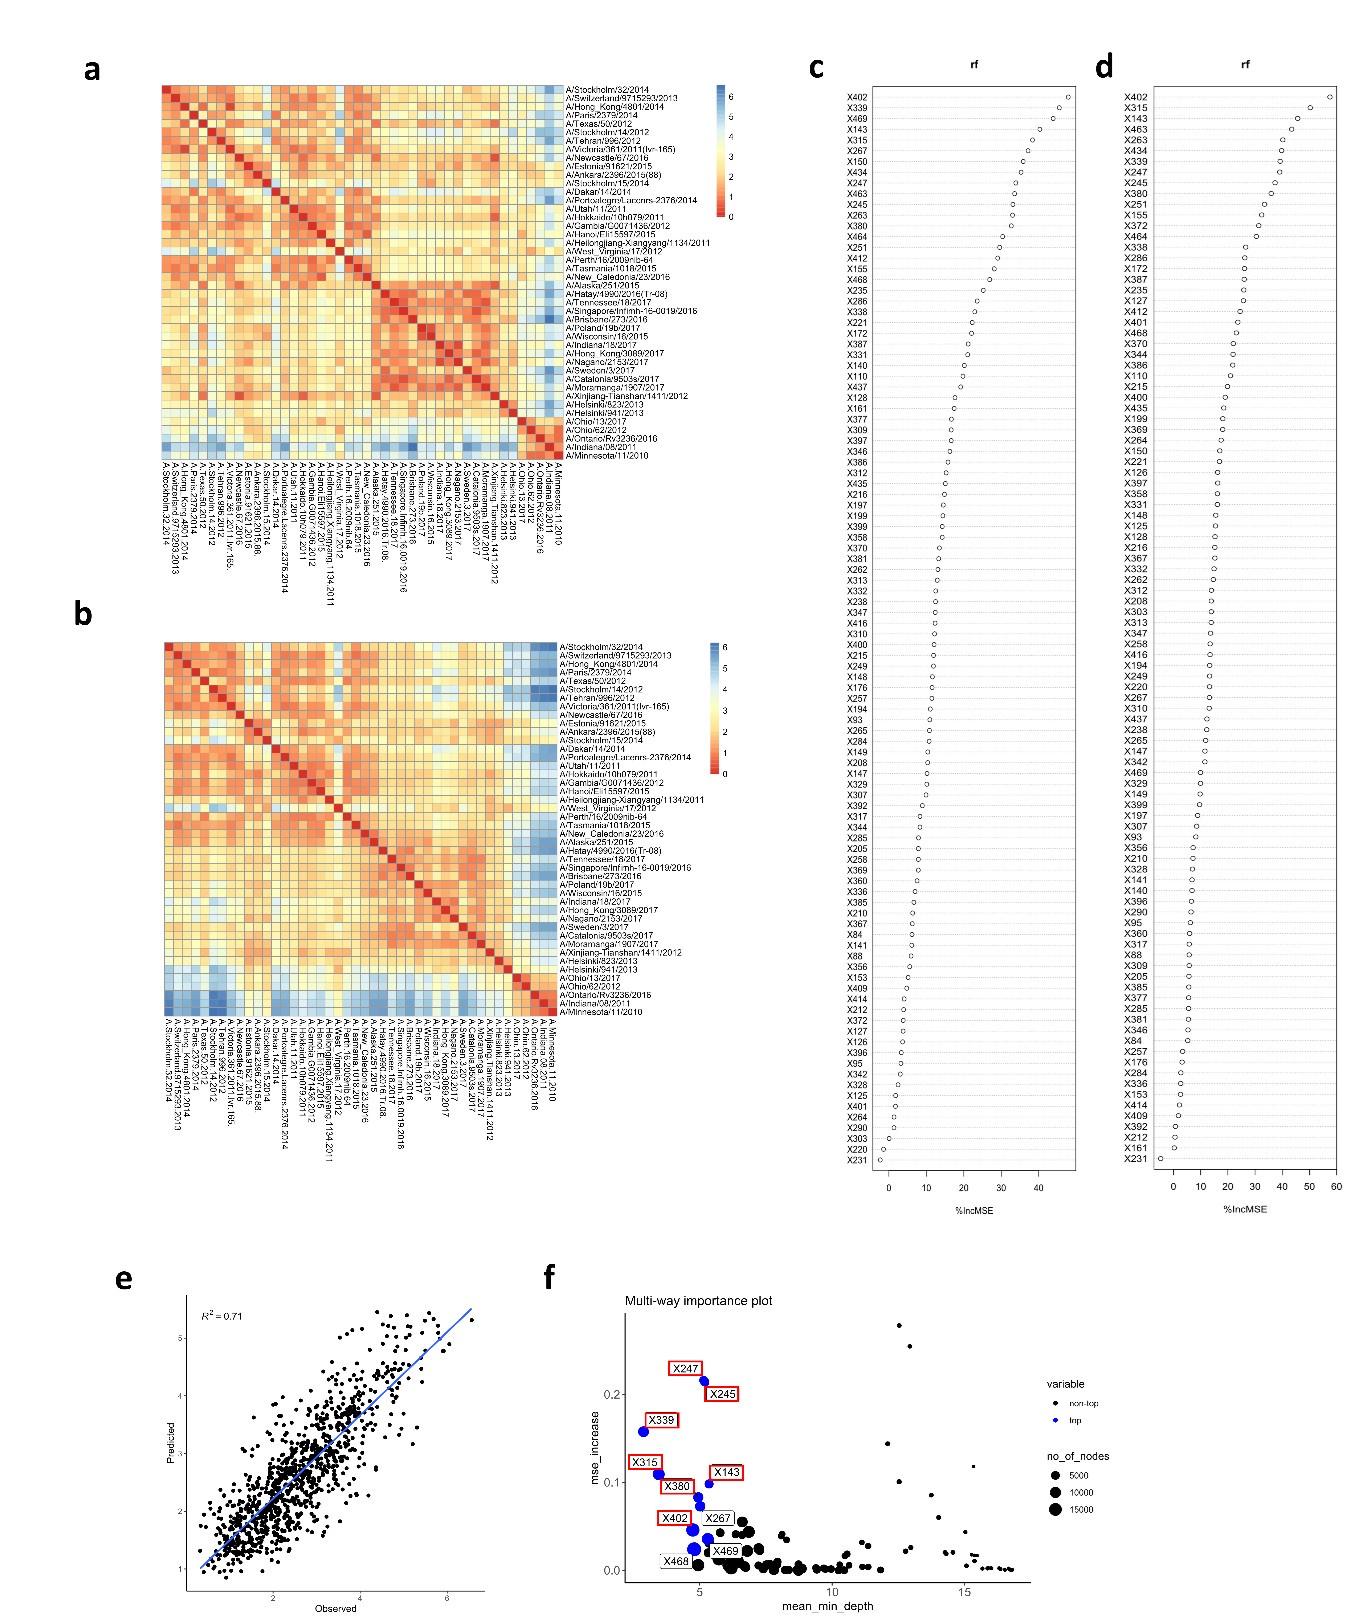
To verify the impact of the number of antigens on our analysis, the matrix of differences was generated with only 4 H6N2s representing at least one phylogenetic group (Per09, Sin16, Hel823 and Ind11) (Author response image 3a). This matrix is very similar to the one calculated based on all 27 antigens (Author response image 3b). The obtained matrix (Author response image 3a) was used in random forest to model antigenic distances and the result of prediction was plotted against real differences calculated based on the full data. The correlation coefficient (R2) of predicted vs observed values dropped from 0.81 to 0.71, suggesting that the number of antigens tested does not drastically affect the antigenic differences calculated based on serum values (Author response image 3e). Importantly, amino acid substitutions potentially associated with increased antigenic distances are similarly identified (Author response image 3c, d and f).
Author response image 3.
Matrix of differences was calculated using only 4 H6N2 antigens (a) or the full panel (b). The matrixes from (c) 4 or (d) 27 antigens were used in random forest modeling to estimate the impact of amino acid changes, respectively. The rf modeling data generated from 4 H6N2 only was plotted and correlated with values calculated from the full panel of 27 H6N2s (e). The multi-way importance plot indicates in red that 7 out of the 10 most important substitutions were identified by the analysis using only 4 H6N2s (f).
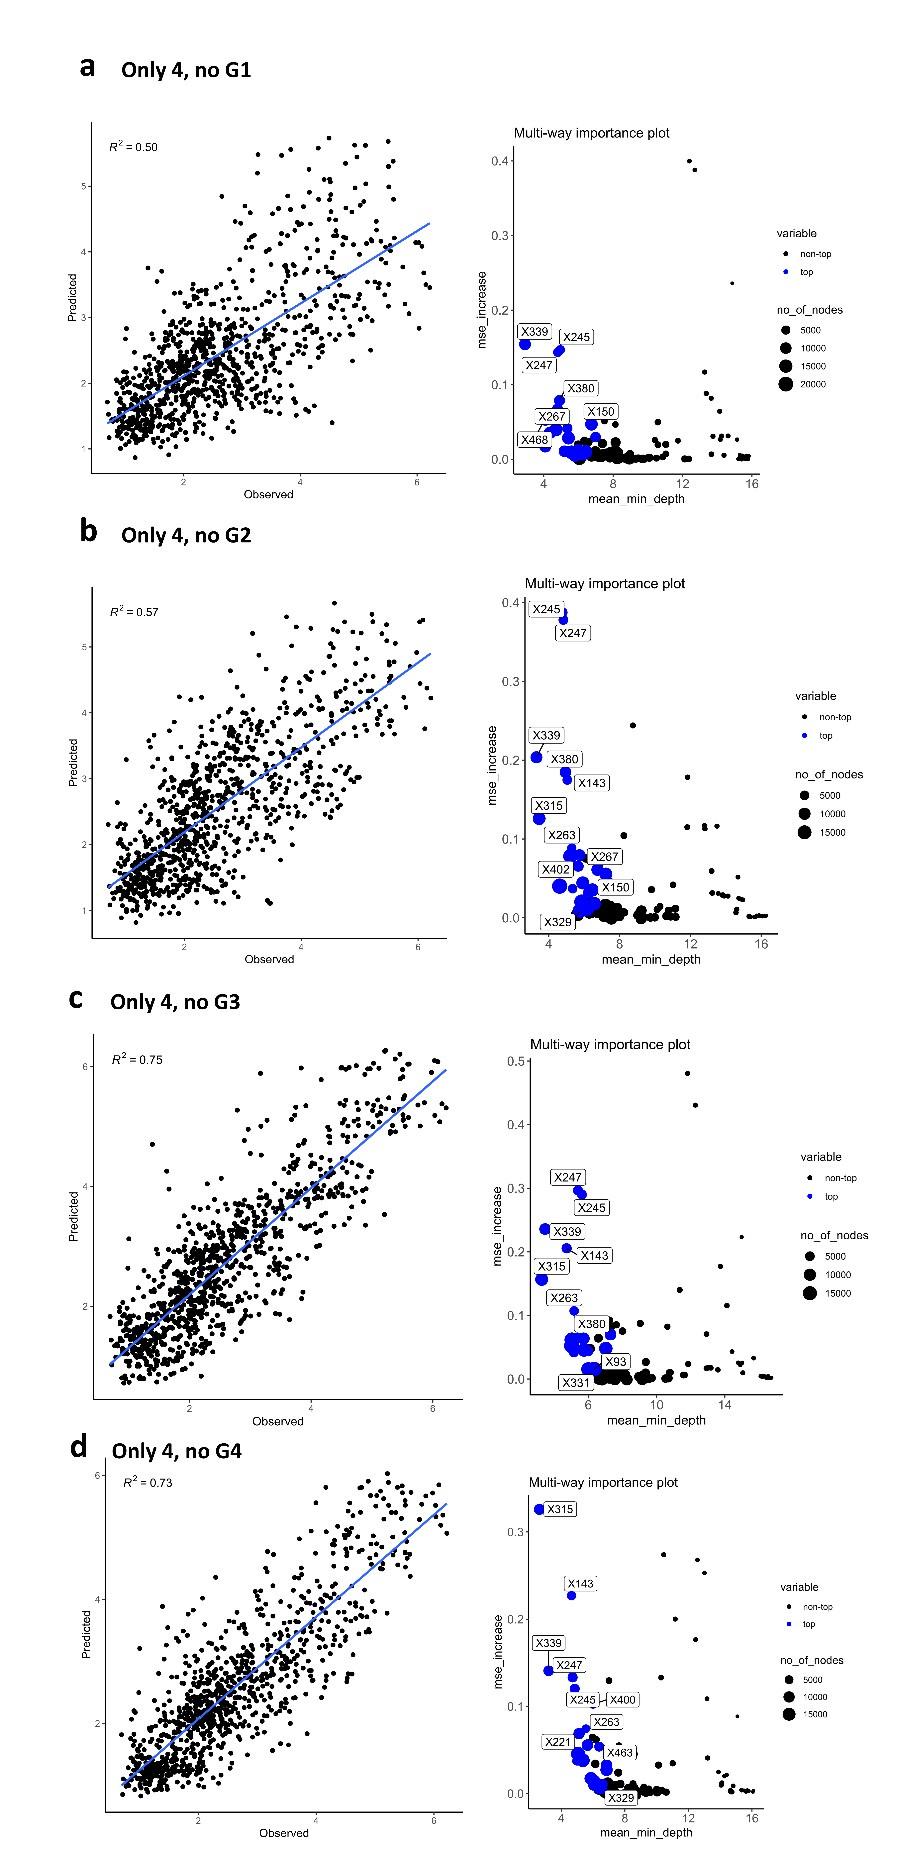
Interestingly, when matrix of differences is calculated using only 4 H6N2s data but not including at least one representative of antigenic group 1 and 2, the correlation coefficient between the predicted values and values obtained from the full panel is dramatically impacted (R2 values drops from 0.81 to 0.5 and 0.57. It is important to note that most of the sera also belong to phylogenetic antigens from groups 1 and 2. As a consequence, poorer prediction of those antigens would more drastically impact the correlation. No drastic drop was observed when representative H6N2s from group 3 or 4 were excluded from the data (from 0.81 to 0.75 and 0.73, Author response image 4 c and d).
Author response image 4.
Random forest analysis was repeated using only 4 antigens, but excluding representatives of one of the phylogenetic groups (a) no group 1, (b) no group 2, (c) no group 3, and (d) no group 4.
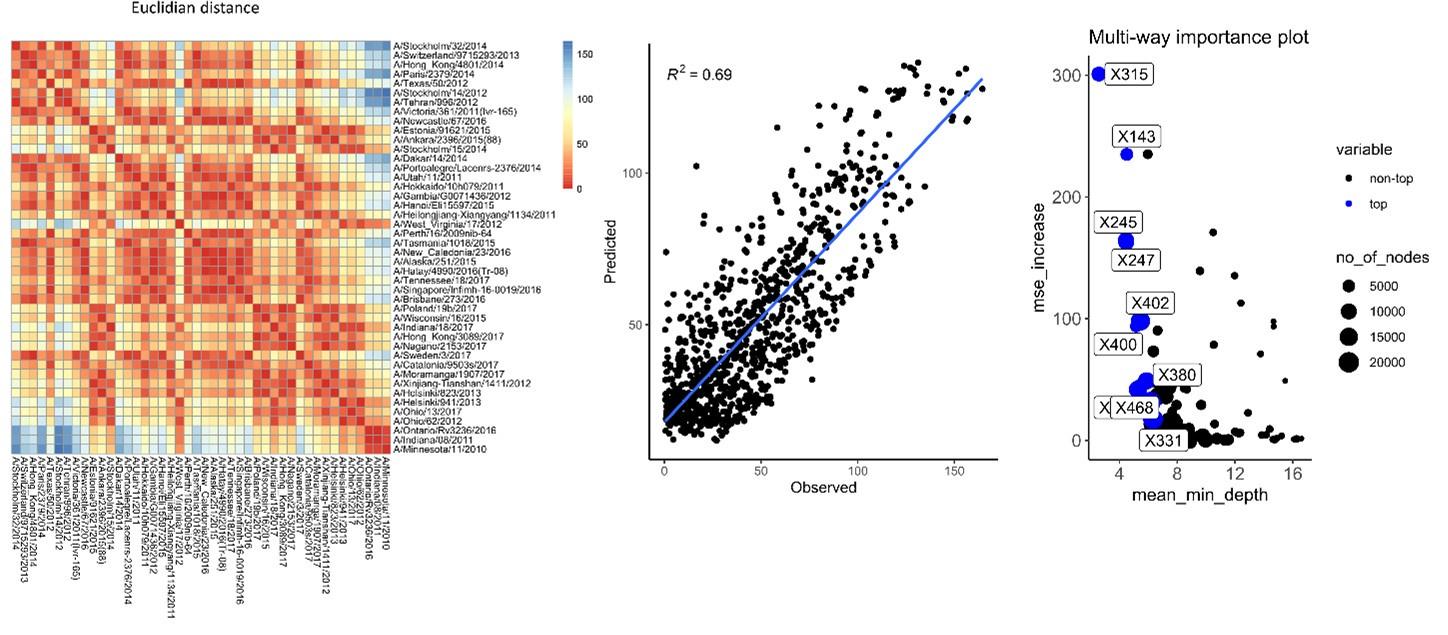
We also used Euclidean distances as a measure of differences (Author response image 5). The predictive values obtained in rf have a slightly reduced R2 compared to the values obtained using average of differences.
In conclusion the unbalanced number of antigens used per group and metric of distance does not seem to impact per se our analysis.
Author response image 5.
Antigenic distances were calculated using Euclidian distances of sera to sera. Those antigenic distances were used in rf for estimation of antigenic distance and importance of each amino acid substitution.
(7) Association analysis does not account for correlations
For each H6N2 virus and position, significance was calculated by comparing the titres between sera that did or did not have a change at that position. This does not take into account the correlations between positions. For haemagglutinin, it can be impossible to determine the true antigenic effects of such correlated substitutions with mutagenesis studies.
Most of the potential correlated effects cannot be addressed with the panel of N2s, except for combinations of substitution that are included in the panel, such as 245/247 with or without 468. Only mutagenesis studies would shed light on the epistatic effects. However, it is important to keep in mind that those individual substitutions in such kind of study likely do not reflect natural evolution of N2 (cfr. the importance of the NA charge balance (Wang et al., 2021: 10.7554/eLife.72516).
(8) Random forest method
25 features are used to classify 43 sera, which seems high (p/3 is typical for classification). By only considering mismatches, rather than the specific amino acid changes, some signals may be lost (for example, at a given position, one amino acid change might be neutral while another has a large antigenic effect). Features may be highly, or perfectly correlated, which will give them a lower reported importance and skew the results.
The number of features were optimized in the range from 5 to 80, with 25 being optimal (best R-value in predicted vs observed antigenic distances). Those features refer to the number of amino acid substitutions used in each tree. The number of trees was also optimized in the range of 100 to 2000.
In random forest the matrix of differences is made considering only position based and not the type of substitution in pairs of NA. Indeed, substitutions with distinct effects may skew results by indicating lower reported importance.
We have highlighted such potential bias in our discussion:
“Also, our modelling does not consider that substitution by other amino acids can have a distinct impact on the antigenic distance. As a consequence, predictions based on the model could underestimate or overestimate the importance of a particular amino acid residue substitution in some cases.”
Reviewer #2 (Public Review):
Summary:
The authors characterized the antigenicity of N2 protein of 44 selected A(H3N2) influenza A viruses isolated from 2009-2017 using ferret and mice immune sera. Four antigenic groups were identified, which correlated with their respective phylogenic/ genetic groups. Among 102 amino acids differed by the 44 selected N2 proteins, the authors identified residues that differentiate the antigenicity of the four groups and constructed a machine-learning model that provides antigenic distance estimation. Three recent A(H3N2) vaccine strains were tested in the model but there was no experimental data to confirm the model prediction results.
Strengths:
This study used N2 protein of 44 selected A(H3N2) influenza A viruses isolated from 2009-2017 and generated corresponding panels of ferret and mouse sera to react with the selected strains. The amount of experimental data for N2 antigenicity characterization is large enough for model building.
Weaknesses:
The main weakness is that the strategy of selecting 44 A(H3N2) viruses from 2009-2017 was not explained. It is not clear if they represent the overall genetic diversity of human A(H3N2) viruses circulating during this time. A comprehensive N2 phylogenetic tree of human A(H3N2) viruses from 2009-2017, with the selected 44 strains labeled in the tree, would be helpful to assess the representativeness of the strains included in the study.
The selection of antigens was performed using the method described by Bien and Tibshirani 2011 (doi: 10.1198/jasa.2011.tm10183). This method calculates MinMax distances to identify a central representative among distinct clusters.
To facilitate visualization of in a phylogenetic tree, only 180 representative N2 proteins from 2009-2017 were randomly selected (20 strains per year, unlabelled). Those 180 representatives and 44 readout panel strains (labelled) are shown in the phylogenetic tree below. Readout strains cover the major branches of the tree. The tree has been built using PhyML 3.0 using JTT substitution model and default parameters (Guindon S. et al, Systematic Biology 59(3):307-21, 2010) and visualized using ETE3 (Huerta-Cepas J. et al, Mol. Biol. Evol 33(6):1635-38, 2016).
Author response image 6.
The second weakness is the use of double-immune ferret sera (post-infection plus immunization with recombinant NA protein) or mouse sera (immunized twice with recombinant NA protein) to characterize the antigenicity of the selected A(H3N2) viruses. Conventionally, NA antigenicity is characterized using ferret sera after a single infection. Repeated influenza exposure in ferrets has been shown to enhance antibody binding affinity and may affect the cross-reactivity to heterologous strains (PMID: 29672713). The increased cross-reactivity is supported by the NAI titers shown in Table S3, as many of the double immune ferret sera showed the highest reactivity not against its own homologous virus but to heterologous strains. Although the authors used the post-infection ferret sera to characterize 5 viruses (Figure 2, Figure Supplement 4), the patterns did not correlate well. If the authors repeat the NA antigenic analysis using the post-infection ferret sera with lower cross-reactivity, will the authors be able to identify more antigenic groups instead of 4 groups?
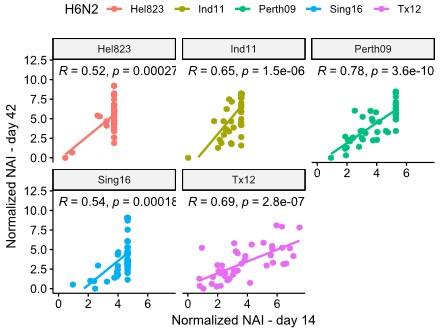
This is a very valuable remark. In their paper, Kosikova et al. (CID 2018) report that repeated infection of ferrets with antigenically slightly different H3N2 viruses results in a broader anti-HA response, compared to a prime infection of an influenza naïve ferret, which results in a narrower anti-HA response. In our ferret immunizations the boost was performed with recombinant, enzymatically active NA that was homologous to the NA of the H1N2 virus that was used for the priming by infection. We determined the NAI responses in sera from ferrets after H1N2 infection against 5 different H6N2 viruses (Figure 2 – figure supplement 5). Compared to NAI responses in sera from H1N2 infected and subsequently NA protein boosted ferrets, the NAI titers obtained after a single infection were considerably lower. Although the normalized NAI titers of day 14 and day 42 sera correlated well, we cannot exclude a degree of broadening of the NAI response in the NA protein boost sera (Author response image 7). On the other hand, repeated influenza antigen exposure is the reality for the majority of people.
Author response image 7.
Correlation obtained on NAI data from ferrets at day 14 after infection vs data from day 42 after boost.
Another weakness is that the authors used the newly constructed model to predict the antigenic distance of three recent A(H3N2) viruses but there is no experimental data to validate their prediction (eg. if these viruses are indeed antigenically deviating from group 2 strains as concluded by the authors).
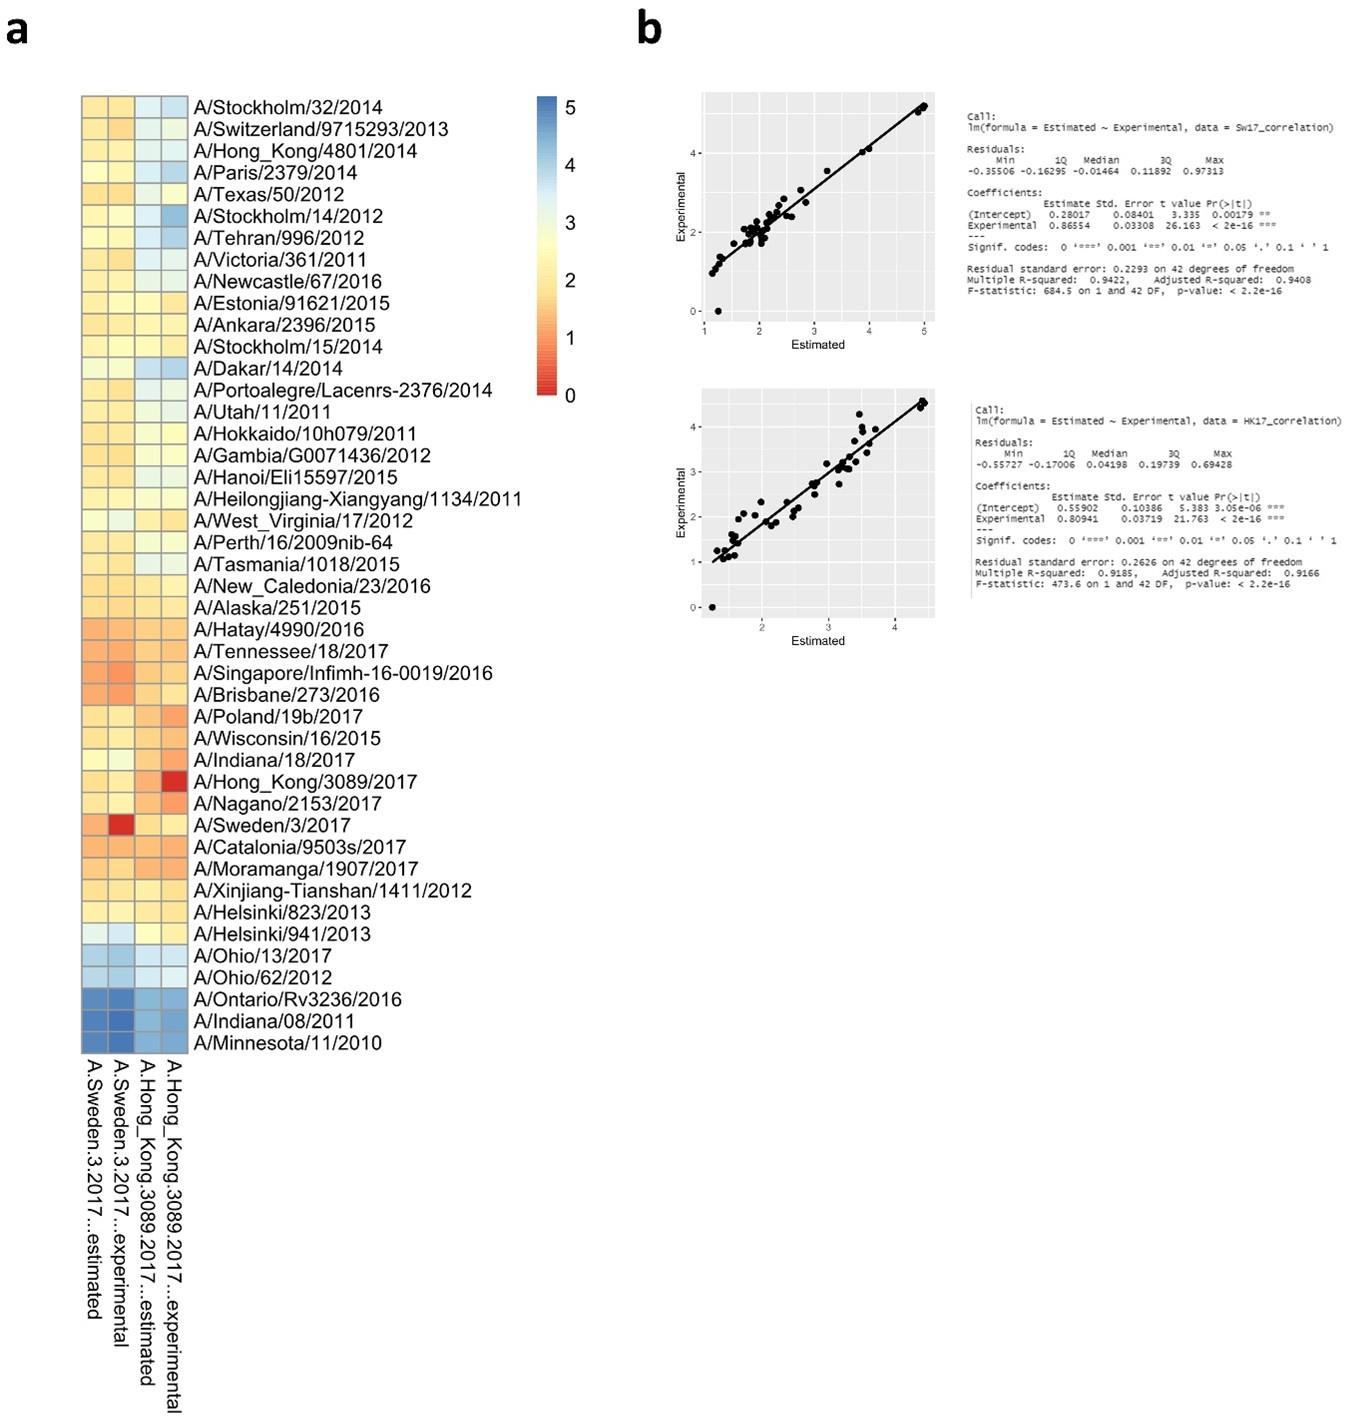
Indeed, there is no experimental data from A/Hong_Kong/45/2018, A/Tasmania/503/2020, or A/Darwin/9/2021. The generation of data to determine experimental values for A/Hong_Kong/45/2018, A/Tasmania/503/2020, or A/Darwin/9/2021 would require the generation of new reassortant viruses (H1N2s), recombinant protein and immunization of new ferrets. The ferrets sera would have to be analyzed against all 27 H6N2s, including duplicated control sera for normalization. The major point of the modeling was to evaluate if it is possible to predict the antigenic behavior based on amino acid substitutions.
As an exercise we have run the model again but this time excluding the Swe17 and HK17 antigens from the data set. Sequences of Sw17 or HK17 were then used to predict antigenic distances. The modeled versus experimental data are plotted in Author response image 8 and show a robust predictive outcome with R2 values of 0.94 and 0.91 for Sw17 and HK17, respectively.
Author response image 8.
Antigenic distances from Swe17 and HK17 calculated using the random forest algorithm that was constructed without experimental data from Swe17 and HK17. The predicted distances were plotted side by side to the experimental distances in (a) and correlations are shown in (b).
Reviewer #3 (Public Review):
Summary:
This paper by Portela Catani et al examines the antigenic relationships (measured using monotypic ferret and mouse sera) across a panel of N2 genes from the past 14 years, along with the underlying sequence differences and phylogenetic relationships. This is a highly significant topic given the recent increased appreciation of the importance of NA as a vaccine target, and the relative lack of information about NA antigenic evolution compared with what is known about HA. Thus, these data will be of interest to those studying the antigenic evolution of influenza viruses. The methods used are generally quite sound, though there are a few addressable concerns that limit the confidence with which conclusions can be drawn from the data/analyses.
Strengths:
- The significance of the work, and the (general) soundness of the methods.
- Explicit comparison of results obtained with mouse and ferret sera.
Weaknesses:
- Approach for assessing the influence of individual polymorphisms on antigenicity does not account for the potential effects of epistasis.
Indeed, possible epistatic effects or individual polymorphisms were not assessed, which is limited by the nature of the panel of N2s selected in the study. We now emphasize this in the discussion as follows:
“Also, our modelling does not consider that substitution by different amino acids can have distinct impact on antigenic distance. As a consequence, predictions based on the model could underestimate the importance of a particular amino acid residue substitution in some cases.”
- Machine learning analyses were neither experimentally validated nor shown to be better than simple, phylogenetic-based inference.
This is a valid remark and indeed we have found a clear correlation between NAI cross reactivity and phylogenetic relatedness. However, besides achieving good prediction of the experimental data (as shown in Figure 5 and in FigureR7), machine Learning analysis has the potential to rank or indicate major antigenic divergences based on available sequences before it has consolidated as new clade. ML can also support the selection and design of broader reactive antigens.
Recommendations for the authors:
Reviewer #1 (Recommendations For The Authors):
Major corrections
No major corrections, beyond the issues I touched on in the public review, for which I give a little more detail below:
Point 2. If there's not a putative genetic basis for the unexpected clustering seen in the NAI, then reiterating a small subset of the data would show the reliability of the experimental methods and substantiate this unexpected finding.
We thank the reviewer for this pertinent point and suggestion. We have modified our analysis by reiterating individual ferret data normalized with the homologous ELISA titers. This reiteration is shown in figure R1b. In this case both Kan17 and Wis15 are switched to antigenic group 2. The profile of sera inhibition against those 2 strains that shift from antigenic cluster 1 to 2, is clearly an intermediate between profiles observed in those 2 groups. Considering that antigenic evolution occurs gradually, it is not unexpected that those intermediate profiles would swing from one side to another when pushed to forced discrimination. Antigenic cartography mapping, as in Smith et al. (2004), also indicated that those H6N2s are located closer to G1 than overall antigens from G2. Raw data distribution (max and min EC50) also do not indicate potential bias in analysis.
Point 5. If you want to use antigenic cartography (Smith et al 2004), there is the R CRAN package (https://CRAN.R-project.org/package=Racmacs) which can handle threshold titres (like <20) and has functions for the diagnostic tools I describe, in order to quality assure the resulting plot. It does use a different antigenic distance metric than the paper currently uses, so you might not want to take that route.
Thank you for this suggestion. We have performed antigenic cartography using the methodology described by Smith et al made accessible by Sam Wilks. The outcome of this analysis has been added to the manuscript as Figure 2 – Figure supplement 3.
Point 6. More robust measures of antigenic distance take into account the homologous titre, homologous and heterologous titres (Archetti & Horsfall, 1950) or use the highest observed titre for a serum (Smith et al 2004). A limitation of the first two is that the antigenic distance can only be calculated when you have the homologous titre, which will limit you as you only have this for 26/43 sera. They may give similar results to your average antigenic distance, in which case your analysis still stands. Calculating antigenic distance using the homologous or maximum titre only gives the antigenic distance between the antigen and the serum. If you want the distance between all the sera, then further analysis is required (making an antigenic map and outputting the serum-serum distances, see the point above).
We thank the reviewer for these suggestions. A complete set of 43 H6N2 viruses that matches all 43 sera would have been ideal. This would require the generation of 17 additional H6N2 viruses and their testing in ELLA, a significant amount of work in terms of time and resources. Instead, we have generated an antigenic map of the 27 antigens and homologous sera (cfr. our response to point 5 above). Despite different methods the outcome showing 4 major antigenic groups is consistent.
Minor corrections
Table S1
A/New_Castle/67/2016 should be A/Newcastle/67/2016
A/Gambia/2012 is not the full virus name
Corrected.
Table S3 has multiple values of exactly 10.0. I think these should be <20 as they are below the threshold of detection for the assay.
All the values lower than 20 in Table S3 were replaced by “< 20”.
Line 376: A/Sidney/5/1997 should be A/Sydney/5/1997
Corrected.
Line 338: "25 randomly sampled data" is a bit vague, "25 randomly sampled features" would be better
Corrected.
Include RMSE of the random forest model.
RMSE=19.6 RMSE/mean = 0.207 is now mentioned in the manuscript.
Figure 5 - supplement 1: These plots are difficult to interpret as the aspect ratio is not 1:1, and panels a & b are difficult to compare as they have not been aligned (using a Procrustes analysis). It would be neater if they were labelled with short names.
We have generated an antigenic cartography map instead. As a consequence, the MDS has become redundant and Figure 5 – supplement 1 was removed.
Line 562: 98 variable residues, where it is 102 elsewhere in the text.
There are 4 mutations near the end of the NA stalk domain, which are not resolved in the N2 structure. Therefore, amino acid distances to these residues cannot be calculated.
No data availability statement. Some of the raw data is available in Table S3 and there is no link to the code.
The data and code used for generation of rf modelling was uploaded to Github and made available. The following statement has been added to the manuscript: “The data and code used for the generation of the rf model is available at https://github.com/SaelensLAB/RF..”
Reviewer #2 (Recommendations For The Authors):
(1) More than 42,000 NA sequences are available for the mentioned period on GISAID, it is therefore important to understand the selection criteria for the 44 strains and if these strains represent the overall genetic diversity of N2 of human A(H3N2) viruses. To demonstrate the representativeness of the 44 selected strains, please construct a representative N2 phylogenetic tree for human A(H3N2) viruses circulated in 2009-2017 and label the 44 selected strains on the tree.
The selection of antigens was performed using the method described by Bien and Tibshirani 2011 (doi: 10.1198/jasa.2011.tm10183). This method uses MinMax distances to identify a central representative among distinct clusters.
To facilitate visualization tree only of 180 representative N2 proteins from 2009-2017 were randomly selected (20 strains per year, unlabelled). Those 180 representatives and 44 readout panel strains (labelled) are shown in the phylogenetic tree below. Readout strains cover the major branches of the tree. The tree has been built using PhyML 3.0 using JTT substitution model and default parameters (Guindon S. et al, Systematic Biology 59(3):307-21, 2010) and visualized using ETE3 (Huerta-Cepas J. et al, Mol. Biol. Evol 33(6):1635-38, 2016).
Author response image 9.
(2) Double immune ferret sera may increase antibody binding affinity and cross-reactivity against heterologous strains. Using single-infection ferret sera may yield different antigenic grouping results (eg. may identify more antigenic groups). Can the authors repeat the NA antigenic grouping using single-infection ferret sera? Although data from a subset of 5 strains was presented (Figure 2, Figure Supplement 4), the information was not sufficient to support if the use of single-infection or double immune ferret sera will yield similar antigenic grouping results.
In our ferret immunizations the boost was performed with recombinant, enzymatically active NA that was homologous to the NA of the H1N2 virus that was used for the priming by infection. We determined the NAI responses in sera from ferrets after H1N2 infection against 5 different H6N2 viruses (Figure 2 – figure supplement 5). Compared to NAI responses in sera from H1N2 infected and subsequently NA protein boosted ferrets, the NAI titers obtained after a single infection were considerably lower. Although the normalized NAI titers of day 14 and day 42 sera correlated well, we cannot exclude a degree of broadening of the NAI response in the NA protein boost sera (Figure R6). On the other hand, repeated influenza antigen exposure is the reality for the majority of people.
(3) NA antigenicity data is presented in heat maps and the authors would often describe the heat map patterns matches without further explanations. Line 234-235, the heat map of mouse sera (Figure 2. Figure supplement 5) was described to match the results of ferret sera (Figure 2), but this tends to be subjective. A correlation analysis of 7 selected antigens showed a positive correlation, what about the other 37 antigens?
The interpretation of heatmaps is indeed very subjective, for this reason the correlation of the 7 selected antigens was also provided. The other 37 antigens were not tested. Considering the results using post boost sera, a simulation of using random forest modeling indicate that the data from one antigen of each antigenic group is sufficient to achieve a reliable predictive output (R2=0.71) (Figure R3 of this rebuttal).
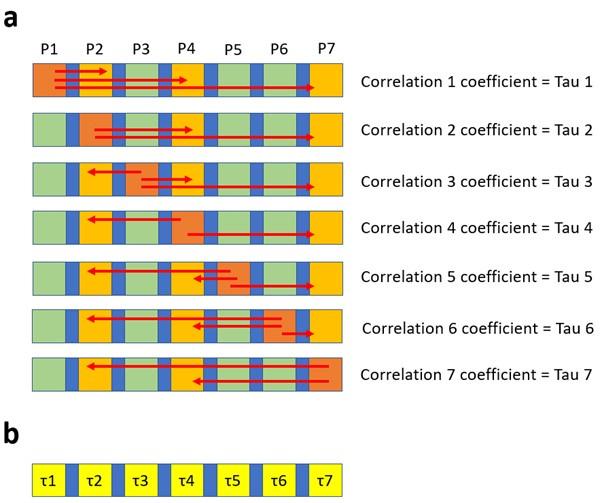
(4) Can the authors explain in more detail how data in Figure 4a was generated? According to the authors, residues close to the catalytic pocket are more likely to impact NAI. Can the authors explain how they define if a residue is close to the catalytic pocket?
The correlation of distances of amino acid residues with significance values is explained as follows. Consider 7 distinct elements that are distributed horizontally as shown by the squares in the figure below (Author response image 10a). The elements highlighted in yellow have a numerical propriety (in case of N2 neuraminidase this was the significance values obtained in the association study). Taking P1 as reference we can calculate the distance (red arrows) between P1 and P2, P4 and P7, those distances can them be correlated to intrinsic values of P2, P4 and P7, which enables the calculation of the correlation coefficient Tau. This same process is repeated for each position (or each amino acid), as a consequence every position will have a correlation coefficient calculated (Author response image 8b). This correlation coefficient can be represented as a heat map at the surface of N2.
Author response image 10.
The 2D scheme represents the strategy used to calculate the correlation (i.e. the Tau values) between distances and p-values. Tau values can then be presented in a heat map.
(5) Can the authors provide experimental data using the three recent A(H3N2) viruses as antigens and perform NAI assay to confirm if they are antigenic all deviating from group 2 viruses?
The generation of data to determine experimental values for A/Hong_Kong/45/2018, A/Tasmania/503/2020, or A/Darwin/9/2021 would require the generation of new reassortant viruses (H1N2s), recombinant protein and immunization of new ferrets. The ferrets sera would have to be analyzed against all 27 H6N2s, including duplicated control sera for normalization. The major point of the modeling was to evaluate if it is possible to predict the antigenic behavior based on amino acid substitutions.
As an exercise we have run the model again but this time excluding the Swe17 and HK17 antigens from the data set. Sequences of Sw17 or HK17 were then used to predict antigenic distances. The modeled versus experimental data are plotted in Author response image 7 and show a robust predictive outcome with R2 values of 0.94 and 0.91 for Sw17 and HK17, respectively.
(6) According to Ge et al. 2022 (PMID: 35387078), N2 NA's before 2014 (2007-2013) showed a 329-N-glycosylation and E344, and they were subsequently replaced by H3N2 viruses with E344K and 329 non-glycosylation changing the NI reactivity in ferret antisera towards later strains. Were these residues also predicted to be important to N2 antigenicity from your machine-learning method?
Three of the N2 NAs used in our panel, A/Victoria/361/2011, A/Hong_Kong/3089/2017, and A/Tennessee/18/2017, lack this N-glycosylation motif. The E344K substitution is present in another 3 NAs, derived from A/Nagano/2153/2017, A/Minnesota/11/2010, and A/Indiana/08/2011. The importance of those mutations is among the lowest ones predicted in our modeling. However, the differences in NAI reported by Ge et al. are low (not even twofold). The experimental variability in our study potentially limits the identification of substitutions with a subtle impact NAI. We have added the following to the discussion in our revised manuscript:
“It has been reported that an N-glycosylation site at position 329 combined with E344 in NA from human H3N2 viruses from 2007 to 2013 was gradually lost in later H3N2 viruses (Ge et al., 2022). This loss of an N-glycosylation site at position 329 combined with an E344K substitution was associated with a change in NAI reactivity in ferret sera. Three N2 NAs in our panel, derived from A/Victoria/361/2011, A/Hong_Kong/3089/2017, and A/Tennessee/18/2017, lack this N-glycosylation motif. The E344K substitution is present in three other NAs, derived from A/Nagano/2153/2017, A/Minnesota/11/2010, and A/Indiana/08/2011. The importance of those mutations is among the lowest ones predicted by our modeling. However, the differences in NAI reported by Ge et al. are very modest (lower than twofold). The experimental variability in our study potentially limits the identification of substitutions with a subtle impact NAI.”
Reviewer #3 (Recommendations For The Authors):
Specific suggestions:
Line 132: Did the authors confirm the absence of compensatory mutations due to a heterologous H6 background that could potentially confound downstream NAI results?
All NAs genes of the rescued H6N2 viruses were fully sequenced and were found to be identical to the expected NA sequences, with the only exception being the A/Tasmania/1018/2015 were a mixed population of wt and M467I was found. This substitution is located at the surface and at the top of the NA head domain, and thus could potentially impact NA antigenicity. However, A/Tasmania/1018/2015 H6N2s had a similar inhibition profile as other H6N2s in phylogenetic and antigenic group 1. This indicates that, at least in this mixed population, antigenicity was not drastically affected by the M467I substitution.
Line 96: how do these data rule out variation in the fraction of properly folded protein across NAs? They certainly show that properly folded NA protein is present, but not whether amounts vary between the different NAs.
SEC-MALS (size exclusion chromatography-Multiangle light scattering) data and enzymatic activity were considered as a proxy for correctly folded NA. Although the specific activity of the recombinant N2 NAs is expressed per mass unit (microgram), we cannot exclude that the fraction of properly folded protein across the different recombinant NAs may vary.
Lines 262-269: this analysis approach (based on my reading) seems to consider each polymorphism in isolation and thus does not seem well suited for accounting for epistatic interactions within the NA. For example, the effect of a substitution on NAI may be contingent upon other alleles within NA that are not cleanly segregated between the two serum comparator groups. Can the authors address the potential of epistasis within NA to confound the results shown in Figure 3?
Unfortunately, epistatic interactions cannot be solved using the panel of N2 selected for the study. This limitation is mentioned in our discussion:
“It is important to highlight that co-occurring substitutions in our panel (the ones present in the main branches of the phylogenetic tree) cannot be individually assessed by association analysis or the random forest model. The individual weight of those mutation on NA drift thus remains to be experimentally demonstrated.”
Line 331: is there a way to visualize and/or quantify how these two plots (F5 supplement 1a/b) reflect each other or not? Without this, it is hard to ascertain how they relate to each other.
We have generated an antigenic cartography map instead. As a consequence, the MDS has become redundant and Figure 5 – supplement 1 was removed.
Figure 4B structural images are not well labelled.
The active site in 1 of the protomers is now indicated with an arrow in the top and side views of the NA tetramer.
Lines 339-359: the ML predictions are just predictions and kind of meaningless without experimental validation of the predicted antigenic differences between recent NAs. This section would also be strengthened by an assessment of whether the ML approach obtains more accurate results than simply using phylogeny to predict antigenic relationships.
Indeed, there is no experimental data from A/Hong_Kong/45/2018, A/Tasmania/503/2020, or A/Darwin/9/2021. The generation of data to determine experimental values for A/Hong_Kong/45/2018, A/Tasmania/503/2020, or A/Darwin/9/2021 would require the generation of new reassortant viruses (H1N2s), recombinant protein and immunization of new ferrets. The ferrets sera would have to be analyzed against all 27 H6N2s, including duplicated control sera for normalization. The major point of the modeling was to evaluate if it is possible to predict the antigenic behavior based on amino acid substitutions.
As an exercise we have run the model again but this time excluding the Swe17 and HK17 antigens from the data set. Sequences of Sw17 or HK17 were then used to predict antigenic distances. The modeled versus experimental data are plotted in figure R7 and show a robust predictive outcome with R2 values of 0.94 and 0.91 for Sw17 and HK17, respectively. A major advantage of antigenic modeling is the potential to rank or indicate major antigenic divergences based on available sequences before it has consolidated as new clade. The support in selecting or designing broader reactive antigens is another advantage of machine learning analysis.
Lines 416-421: appreciate the direct comparison of results obtained from ferrets versus mice.
We thank the reviewer for expressing this appreciation.
-
eLife assessment
This study presents valuable data on the antigenic properties of neuraminidase proteins of human A/H3N2 influenza viruses sampled between 2009 and 2017. The antigenic properties are found to be generally concordant with genetic groups. Additional analysis have strengthened the revised manuscript, and the evidence supporting the claims is solid.
-
Reviewer #1 (Public Review):
Summary
The authors investigated the antigenic diversity of recent (2009-2017) A/H3N2 influenza neuraminidases (NAs), the second major antigenic protein after haemagglutinin. They used 27 viruses and 43 ferret sera and performed NA inhibition. This work was supported by a subset of mouse sera. Clustering analysis determined 4 antigenic clusters, mostly in concordance with the genetic groupings. Association analysis was used to estimate important amino acid positions, which were shown to be more likely close to the catalytic site. Antigenic distances were calculated and a random forest model used to determine potential important sites.
This revision has addressed many of my concerns of inconsistencies in the methods, results and presentation. There are still some remaining weaknesses in the computational work.
Strengths
(1) The data cover recent NA evolution and a substantial number (43) of ferret (and mouse) sera were generated and titrated against 27 viruses. This is laborious experimental work and is the largest publicly available neuraminidase inhibition dataset that I am aware of. As such, it will prove a useful resource for the influenza community.
(2) A variety of computational methods were used to analyse the data, which give a rounded picture of the antigenic and genetic relationships and link between sequence, structure and phenotype.
(3) Issues raised in the previous review have been thoroughly addressed.
Weaknesses
(1) Some inconsistencies and missing data in experimental methods
Two ferret sera were boosted with H1N2, while recombinant NA protein for the others. This, and the underlying reason, are clearly explained in the manuscript. The authors note that boosting with live virus did not increase titres. Additionally, one homologous serum (A/Kansas/14/2017) was not generated, although this would not necessarily have impacted the results.(2) Inconsistency in experimental results
Clustering of the NA inhibition results identifies three viruses which do not cluster with their phylogenetic group. Again this is clearly pointed out in the paper and is consistent with the two replicate ferret sera. Additionally, A/Kansas/14/2017 is in a different cluster based on the antigenic cartography vs the clustering of the titres(3) Antigenic cartography plot would benefit from documentation of the parameters and supporting analyses
a. The number of optimisations used
b. The final stress and the difference between the stress of the lowest few (e.g. 5) optimisations, or alternatively a graph of the stress of all the optimisations. Information on the stress per titre and per point, and whether any of these were outliers
c. A measure of uncertainty in position (e.g. from bootstrapping)(4) Random forest
The full dataset was used for the random forest model, including tuning the hyperparameters. It is more robust to have a training and test set to be able to evaluate overfitting (there are 25 features to classify 43 sera). -
Reviewer #2 (Public Review):
Summary:
The authors characterized the antigenicity of N2 protein of 43 selected A(H3N2) influenza A viruses isolated from 2009-2017 using ferret and mice immune sera. Four antigenic groups were identified, which the authors claimed to be correlated with their respective phylogenic/ genetic groups. Among 102 amino acids differed by the 44 selected N2 proteins, the authors identified residues that differentiate the antigenicity of the four groups and constructed a machine-learning model that provides antigenic distance estimation. Three recent A(H3N2) vaccine strains were tested in the model but there was no experimental data to confirm the model prediction results.Strengths:
This study used N2 protein of 44 selected A(H3N2) influenza A viruses isolated from 2009-2017 and generated corresponding panels of …Reviewer #2 (Public Review):
Summary:
The authors characterized the antigenicity of N2 protein of 43 selected A(H3N2) influenza A viruses isolated from 2009-2017 using ferret and mice immune sera. Four antigenic groups were identified, which the authors claimed to be correlated with their respective phylogenic/ genetic groups. Among 102 amino acids differed by the 44 selected N2 proteins, the authors identified residues that differentiate the antigenicity of the four groups and constructed a machine-learning model that provides antigenic distance estimation. Three recent A(H3N2) vaccine strains were tested in the model but there was no experimental data to confirm the model prediction results.Strengths:
This study used N2 protein of 44 selected A(H3N2) influenza A viruses isolated from 2009-2017 and generated corresponding panels of ferret and mouse sera to react with the selected strains. The amount of experimental data for N2 antigenicity characterization is large enough for model building.Weaknesses:
The main weakness is that the strategy of selecting 43 A(H3N2) viruses from 2009-2017 was not explained. It is not clear if they represent the overall genetic diversity of human A(H3N2) viruses circulating during this time. In response to the reviewer's comment, the authors have provided a N2 phylogenetic tree using180 randomly selected N2 sequences from human A(H3N2) viruses from 2009-2017. While the 43 strains seems to scatter across the N2 tree, the four antigenic groups described by the author did not correlated with their respective phylogenic/ genetic groups as shown in Fig. 2. The authors should show the N2 phylogenic tree together with Fig. 2 and discuss the discrepancy observed.The second weakness is the use of double-immune ferret sera (post-infection plus immunization with recombinant NA protein) or mouse sera (immunized twice with recombinant NA protein) to characterize the antigenicity of the selected A(H3N2) viruses. Conventionally, NA antigenicity is characterized using ferret sera after a single infection. Repeated influenza exposure in ferrets has been shown to enhance antibody binding affinity and may affect the cross-reactivity to heterologous strains (PMID: 29672713). The increased cross-reactivity is supported by the NAI titers shown in Table S3, as many of the double immune ferret sera showed the highest reactivity not against its own homologous virus but to heterologous strains. In response to the reviewer's comment, the authors agreed the use of double-immune ferret sera may be a limitation of the study. It would be helpful if the authors can discuss the potential effect on the use of double-immune ferret sera in antigenicity characterization in the manuscript.
Another weakness is that the authors used the newly constructed a model to predict antigenic distance of three recent A(H3N2) viruses but there is no experimental data to validate their prediction (eg. if these viruses are indeed antigenically deviating from group 2 strains as concluded by the authors). In response to the comment, the authors have taken two strains out of the dataset and use them for validation. The results is shown as Fig. R7. However, it may be useful to include this in the main manuscript to support the validity of the model.
-
Reviewer #3 (Public Review):
Summary:
This paper by Portela Catani et al examines the antigenic relationships (measured using monotypic ferret and mouse sera) across a panel of N2 genes from the past 14 years, along with the underlying sequence differences and phylogenetic relationships. This is a highly significant topic given the recent increased appreciation of the importance of NA as a vaccine target, and the relative lack of information about NA antigenic evolution compared with what is known about HA. Thus, these data will be of interest to those studying the antigenic evolution of influenza viruses. The methods used are generally quite sound, though there are a few addressable concerns that limit the confidence with which conclusions can be drawn from the data/analyses.Strengths:
-The significance of the work, and the (general) …Reviewer #3 (Public Review):
Summary:
This paper by Portela Catani et al examines the antigenic relationships (measured using monotypic ferret and mouse sera) across a panel of N2 genes from the past 14 years, along with the underlying sequence differences and phylogenetic relationships. This is a highly significant topic given the recent increased appreciation of the importance of NA as a vaccine target, and the relative lack of information about NA antigenic evolution compared with what is known about HA. Thus, these data will be of interest to those studying the antigenic evolution of influenza viruses. The methods used are generally quite sound, though there are a few addressable concerns that limit the confidence with which conclusions can be drawn from the data/analyses.Strengths:
-The significance of the work, and the (general) soundness of the methods.
-Explicit comparison of results obtained with mouse and ferret seraWeaknesses:
- Approach for assessing influence of individual polymorphisms on antigenicity does not account for potential effects of epistasis (this point is acknowledged by the authors).
- Machine learning analyses neither experimentally validated nor shown to be better than simple, phylogenetic-based inference. -
-
eLife assessment
This study presents valuable data on the antigenic properties of neuraminidase proteins of human A/H3N2 influenza viruses sampled between 2009 and 2017. The antigenic properties are found to be generally concordant with genetic groups. However, the evidence for claims concerning the molecular basis of the antigenic differences remains incomplete, as the computational methods have been insufficiently validated.
-
Reviewer #1 (Public Review):
Summary
The authors investigated the antigenic diversity of recent (2009- 2017) A/H3N2 influenza neuraminidases (NAs), the second major antigenic protein after haemagglutinin. They used 27 viruses and 43 ferret sera and performed NA inhibition. This work was supported by a subset of mouse sera. Clustering analysis determined 4 antigenic clusters, mostly in concordance with the genetic groupings. Association analysis was used to estimate important amino acid positions, which were shown to be more likely close to the catalytic site. Antigenic distances were calculated and a random forest model was used to determine potential important sites.This has the potential to be a very interesting piece of work. At present, there are inconsistencies in the methods, results and presentation that limit its impact. In …
Reviewer #1 (Public Review):
Summary
The authors investigated the antigenic diversity of recent (2009- 2017) A/H3N2 influenza neuraminidases (NAs), the second major antigenic protein after haemagglutinin. They used 27 viruses and 43 ferret sera and performed NA inhibition. This work was supported by a subset of mouse sera. Clustering analysis determined 4 antigenic clusters, mostly in concordance with the genetic groupings. Association analysis was used to estimate important amino acid positions, which were shown to be more likely close to the catalytic site. Antigenic distances were calculated and a random forest model was used to determine potential important sites.This has the potential to be a very interesting piece of work. At present, there are inconsistencies in the methods, results and presentation that limit its impact. In particular, there are weaknesses in some of the computational work.
Strengths
1. The data cover recent NA evolution and a substantial number (43) of ferret (and mouse) sera were generated and titrated against 27 viruses. This is laborious experimental work and is the largest publicly available neuraminidase inhibition dataset that I am aware of. As such, it will prove a useful resource for the influenza community.2. A variety of computational methods were used to analyse the data, which give a rounded picture of the antigenic and genetic relationships and link between sequence, structure and phenotype.
Weaknesses
1. Inconsistency in experimental methods
Two ferret sera were boosted with H1N2, while recombinant NA protein for the others. This, and the underlying reason, are clearly explained in the manuscript. The authors note that boosting with live virus did not increase titres. Nevertheless, these results are included in the analysis when it would be better to exclude them (Figure 2 shows much lower titres to their own group than other sera).2. Inconsistency in experimental results
Clustering of the NA inhibition results identifies three viruses which do not cluster with their phylogenetic group. Again this is clearly pointed out in the paper. Further investigation of this inconsistency is required to determine whether this has a genetic basis or is an experimental issue. It is difficult to trust the remaining data while this issue is unresolved.3. Inconsistency in group labelling
A/Hatay/4990/2016 & A/New Caledonia/23/2016 are in phylogenetic group 1 in Figure 2 and phylogenetic group 1 in Figure 5 - figure supplement 1 panel a.
A/Kansas/14/2017 is selected as a representative of antigenic group 2, when in Figure 2 it is labelled as AC1 (although Figure 2 - supplement 4 which the text is referring to shows data for A/Singapore/Infimh-16-0019/2016 as the representative of AC2). A/Kansas/14/2017 is coloured and labelled as AC2 in Figure 2 - supplement 5.
The colouring is changed for Figure 3a at the bottom. A/Heilongjiang-Xiangyang/1134/2011 is coloured the same as AC4 viruses when it is AC1 in Figure 2.
This lack of consistency makes the figures misleading.4. Data not presented, without explanation
The paper states that 44 sera and 27 H6N2 viruses were used (line 158). However, the results for the Kansas/14/2017 sera do not appear to be presented in any of the figures (e.g. Figure 2 phylogenetic tree, Figure 5 - figure supplement 1). It is not obvious why these data were not presented. The exclusion of this serum could affect the results as often the homologous titre is the highest and several heatmaps show the fold down from the highest titre.5. The cMDS plot does not have sufficient quality assurance
A cMDS plot is shown in Figure 5 - figure supplement 1, generated using classical MDS. The following support for the appropriateness of this visualisation is not given.
a. Goodness of fit of the cMDS projection, including per point and per titre.
b. Testing of the appropriate number of dimensions (the two sera from phylogenetic group 3 are clustered with phylogenetic group 2; additional dimensions might separate these groups).
c. A measure of uncertainty in positioning, e.g. bootstrapping.
d. A sensitivity analysis of the assumption about titres below the level of detection (i.e. that <20 = 10).
Without this information, it is difficult to judge if the projection is reliable.6. Choice of antigenic distance measure
The measure of antigenic distance used here is the average difference between titres for two sera. This is dependent on which viruses have been included in the analysis and will be biased by the unbalanced number of viruses in the different clusters (12, 8, 2, 5).7. Association analysis does not account for correlations
For each H6N2 virus and position, significance was calculated by comparing the titres between sera that did or did not have a change at that position. This does not take into account the correlations between positions. For haemagglutinin, it can be impossible to determine the true antigenic effects of such correlated substitutions with mutagenesis studies.8. Random forest method
25 features are used to classify 43 sera, which seems high (p/3 is typical for classification). By only considering mismatches, rather than the specific amino acid changes, some signals may be lost (for example, at a given position, one amino acid change might be neutral while another has a large antigenic effect). Features may be highly, or perfectly correlated, which will give them a lower reported importance and skew the results. -
Reviewer #2 (Public Review):
Summary:
The authors characterized the antigenicity of N2 protein of 44 selected A(H3N2) influenza A viruses isolated from 2009-2017 using ferret and mice immune sera. Four antigenic groups were identified, which correlated with their respective phylogenic/ genetic groups. Among 102 amino acids differed by the 44 selected N2 proteins, the authors identified residues that differentiate the antigenicity of the four groups and constructed a machine-learning model that provides antigenic distance estimation. Three recent A(H3N2) vaccine strains were tested in the model but there was no experimental data to confirm the model prediction results.Strengths:
This study used N2 protein of 44 selected A(H3N2) influenza A viruses isolated from 2009-2017 and generated corresponding panels of ferret and mouse sera to …Reviewer #2 (Public Review):
Summary:
The authors characterized the antigenicity of N2 protein of 44 selected A(H3N2) influenza A viruses isolated from 2009-2017 using ferret and mice immune sera. Four antigenic groups were identified, which correlated with their respective phylogenic/ genetic groups. Among 102 amino acids differed by the 44 selected N2 proteins, the authors identified residues that differentiate the antigenicity of the four groups and constructed a machine-learning model that provides antigenic distance estimation. Three recent A(H3N2) vaccine strains were tested in the model but there was no experimental data to confirm the model prediction results.Strengths:
This study used N2 protein of 44 selected A(H3N2) influenza A viruses isolated from 2009-2017 and generated corresponding panels of ferret and mouse sera to react with the selected strains. The amount of experimental data for N2 antigenicity characterization is large enough for model building.Weaknesses:
The main weakness is that the strategy of selecting 44 A(H3N2) viruses from 2009-2017 was not explained. It is not clear if they represent the overall genetic diversity of human A(H3N2) viruses circulating during this time. A comprehensive N2 phylogenetic tree of human A(H3N2) viruses from 2009-2017, with the selected 44 strains labeled in the tree, would be helpful to assess the representativeness of the strains included in the study. The second weakness is the use of double-immune ferret sera (post-infection plus immunization with recombinant NA protein) or mouse sera (immunized twice with recombinant NA protein) to characterize the antigenicity of the selected A(H3N2) viruses. Conventionally, NA antigenicity is characterized using ferret sera after a single infection. Repeated influenza exposure in ferrets has been shown to enhance antibody binding affinity and may affect the cross-reactivity to heterologous strains (PMID: 29672713). The increased cross-reactivity is supported by the NAI titers shown in Table S3, as many of the double immune ferret sera showed the highest reactivity not against its own homologous virus but to heterologous strains. Although the authors used the post-infection ferret sera to characterize 5 viruses (Figure 2, Figure Supplement 4), the patterns did not correlate well. If the authors repeat the NA antigenic analysis using the post-infection ferret sera with lower cross-reactivity, will the authors be able to identify more antigenic groups instead of 4 groups? Another weakness is that the authors used the newly constructed model to predict the antigenic distance of three recent A(H3N2) viruses but there is no experimental data to validate their prediction (eg. if these viruses are indeed antigenically deviating from group 2 strains as concluded by the authors). -
Reviewer #3 (Public Review):
Summary:
This paper by Portela Catani et al examines the antigenic relationships (measured using monotypic ferret and mouse sera) across a panel of N2 genes from the past 14 years, along with the underlying sequence differences and phylogenetic relationships. This is a highly significant topic given the recent increased appreciation of the importance of NA as a vaccine target, and the relative lack of information about NA antigenic evolution compared with what is known about HA. Thus, these data will be of interest to those studying the antigenic evolution of influenza viruses. The methods used are generally quite sound, though there are a few addressable concerns that limit the confidence with which conclusions can be drawn from the data/analyses.Strengths:
- The significance of the work, and the (general) …Reviewer #3 (Public Review):
Summary:
This paper by Portela Catani et al examines the antigenic relationships (measured using monotypic ferret and mouse sera) across a panel of N2 genes from the past 14 years, along with the underlying sequence differences and phylogenetic relationships. This is a highly significant topic given the recent increased appreciation of the importance of NA as a vaccine target, and the relative lack of information about NA antigenic evolution compared with what is known about HA. Thus, these data will be of interest to those studying the antigenic evolution of influenza viruses. The methods used are generally quite sound, though there are a few addressable concerns that limit the confidence with which conclusions can be drawn from the data/analyses.Strengths:
- The significance of the work, and the (general) soundness of the methods.
- Explicit comparison of results obtained with mouse and ferret sera.Weaknesses:
- Approach for assessing the influence of individual polymorphisms on antigenicity does not account for the potential effects of epistasis.
- Machine learning analyses were neither experimentally validated nor shown to be better than simple, phylogenetic-based inference. -
