High-altitude hypoxia exposure inhibits erythrophagocytosis by inducing macrophage ferroptosis in the spleen
Curation statements for this article:-
Curated by eLife

eLife assessment
This useful study reports that a week or more of hypoxia exposure in mice increases erythropoiesis and decreases the number of iron-recycling macrophages in the spleen, compromising their capacity for red blood cell phagocytosis – reflected by increased mature erythrocyte retention in the spleen. Compared to an earlier version, the study has been strengthened with mouse experiments under hypobaric hypoxia and complemented by extensive ex vivo analyses. Unfortunately, while some of the evidence is solid, the work as it currently stands only incompletely supports the authors' hypotheses. While the study would benefit from additional experiments that more directly buttress the central claims, it should be of interest to the fields of hemopoiesis and bone marrow biology and possibly also blood cancer.
This article has been Reviewed by the following groups
Discuss this preprint
Start a discussion What are Sciety discussions?Listed in
- Evaluated articles (eLife)
Abstract
High-altitude polycythemia (HAPC) affects individuals living at high altitudes, characterized by increased red blood cells (RBCs) production in response to hypoxic conditions. The exact mechanisms behind HAPC are not fully understood. We utilized a mouse model exposed to hypobaric hypoxia (HH), replicating the environmental conditions experienced at 6000 m above sea level, coupled with in vitro analysis of primary splenic macrophages under 1% O 2 to investigate these mechanisms. Our findings indicate that HH significantly boosts erythropoiesis, leading to erythrocytosis and splenic changes, including initial contraction to splenomegaly over 14 days. A notable decrease in red pulp macrophages (RPMs) in the spleen, essential for RBCs processing, was observed, correlating with increased iron release and signs of ferroptosis. Prolonged exposure to hypoxia further exacerbated these effects, mirrored in human peripheral blood mononuclear cells. Single-cell sequencing showed a marked reduction in macrophage populations, affecting the spleen’s ability to clear RBCs and contributing to splenomegaly. Our findings suggest splenic ferroptosis contributes to decreased RPMs, affecting erythrophagocytosis and potentially fostering continuous RBCs production in HAPC. These insights could guide the development of targeted therapies for HAPC, emphasizing the importance of splenic macrophages in disease pathology.
Article activity feed
-

-
-
-

Author Response
The following is the authors’ response to the previous reviews.
Recommendations for the authors:
(1) Substantial revision of the claims and interpretation of the results is needed, especially in the setting of additional data showing enhanced erythrophagocytosis with decreased RBC lifespan.
Thank you for your valuable feedback and suggestion for a substantial revision of the claims and interpretation of our results. We acknowledge the importance of considering additional data that shows enhanced erythrophagocytosis with decreased RBC lifespan. In response, we have revised our manuscript and incorporated additional experimental data to support and clarify our findings.
(1) In our original manuscript, we reported a decrease in the number of splenic red pulp macrophages (RPMs) and phagocytic erythrocytes after hypobaric …
Author Response
The following is the authors’ response to the previous reviews.
Recommendations for the authors:
(1) Substantial revision of the claims and interpretation of the results is needed, especially in the setting of additional data showing enhanced erythrophagocytosis with decreased RBC lifespan.
Thank you for your valuable feedback and suggestion for a substantial revision of the claims and interpretation of our results. We acknowledge the importance of considering additional data that shows enhanced erythrophagocytosis with decreased RBC lifespan. In response, we have revised our manuscript and incorporated additional experimental data to support and clarify our findings.
(1) In our original manuscript, we reported a decrease in the number of splenic red pulp macrophages (RPMs) and phagocytic erythrocytes after hypobaric hypoxia (HH) exposure. This conclusion was primarily based on our observations of reduced phagocytosis in the spleen.
(2) Additional experimental data on RBC labeling and erythrophagocytosis:
- Experiment 1 (RBC labeling and HH exposure)
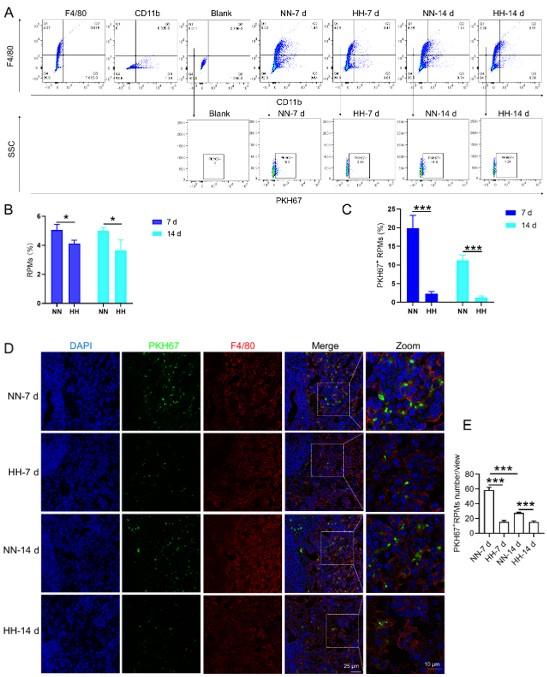
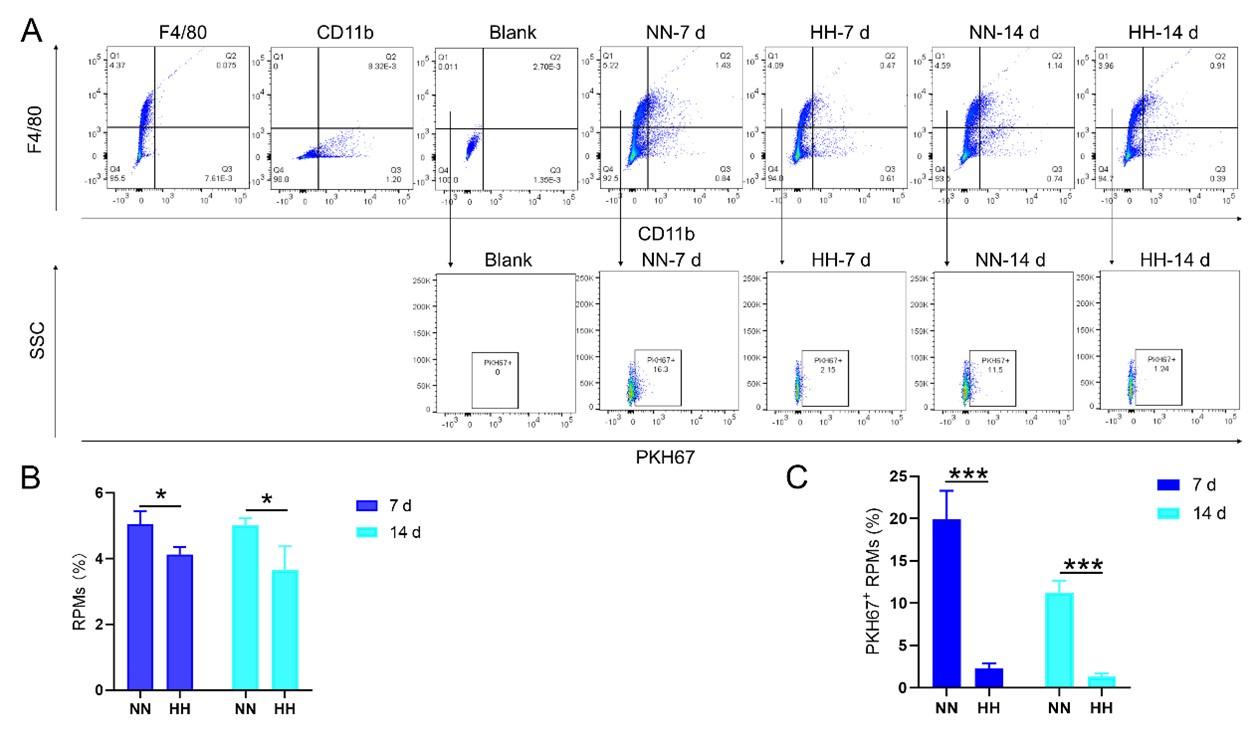
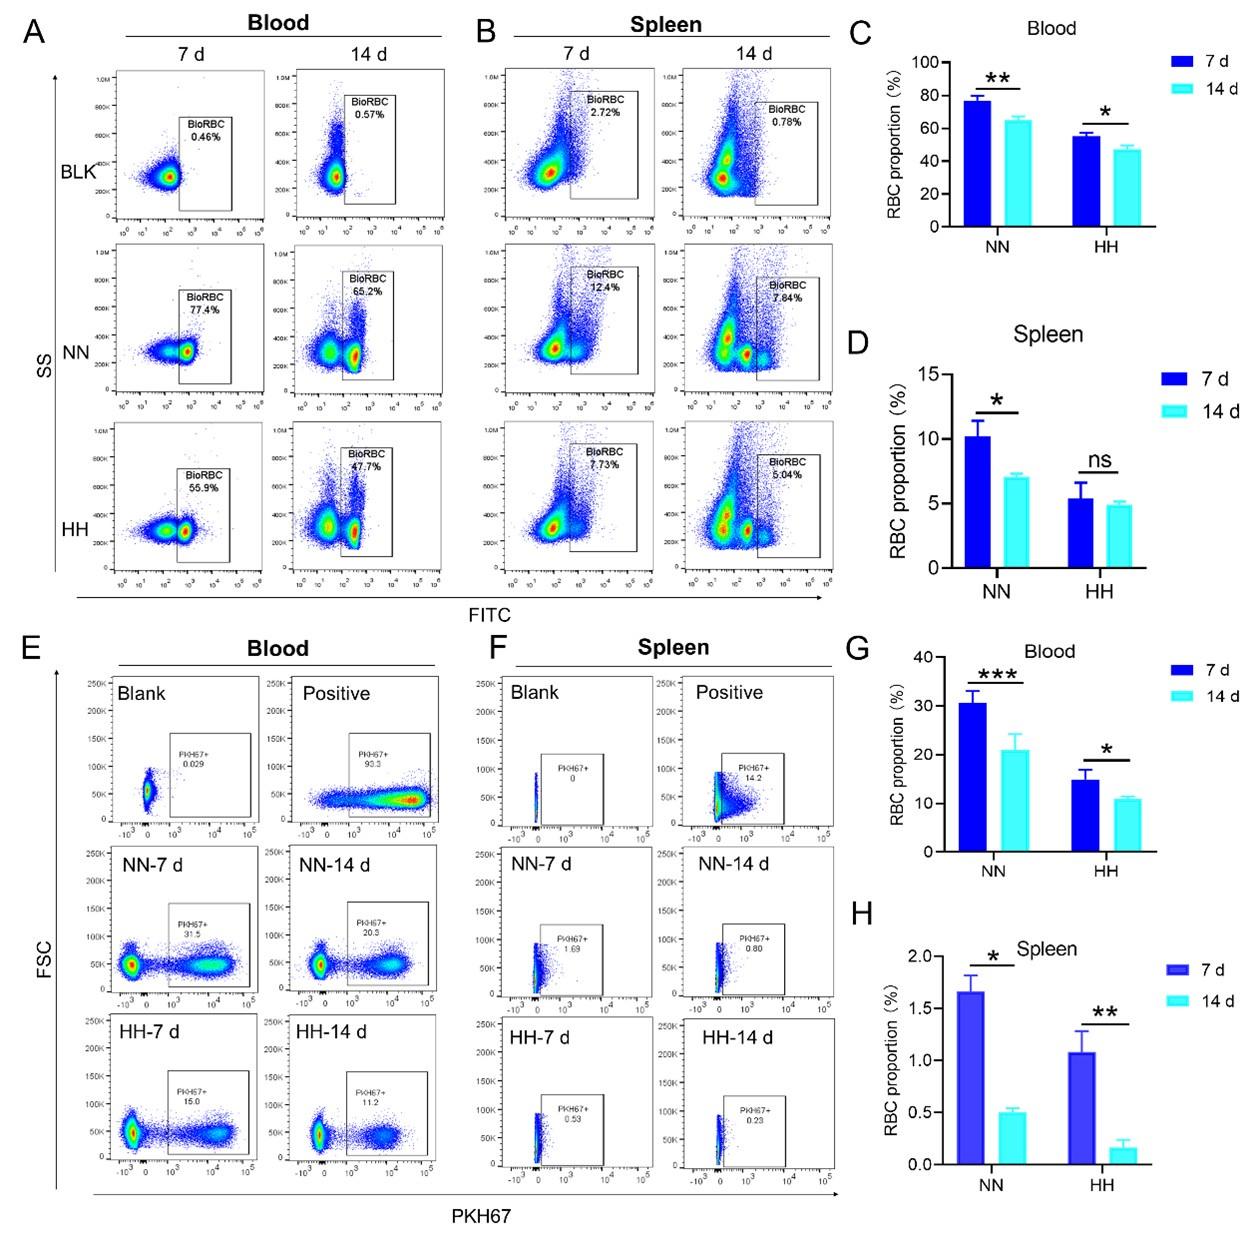
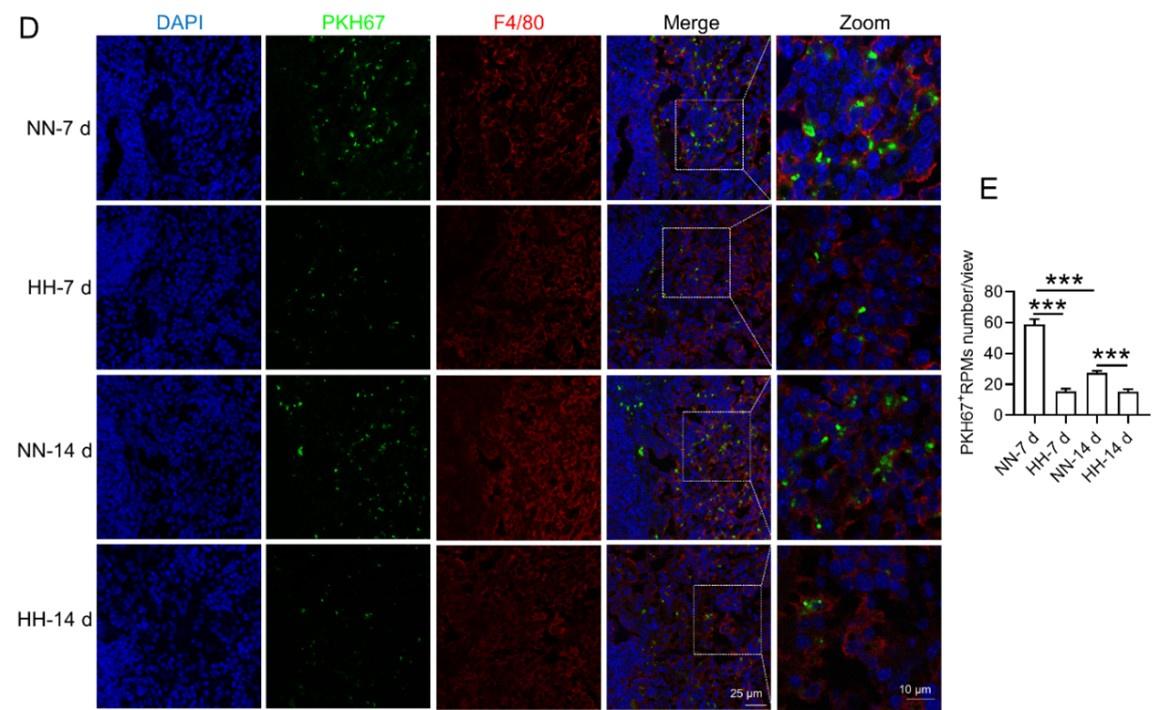
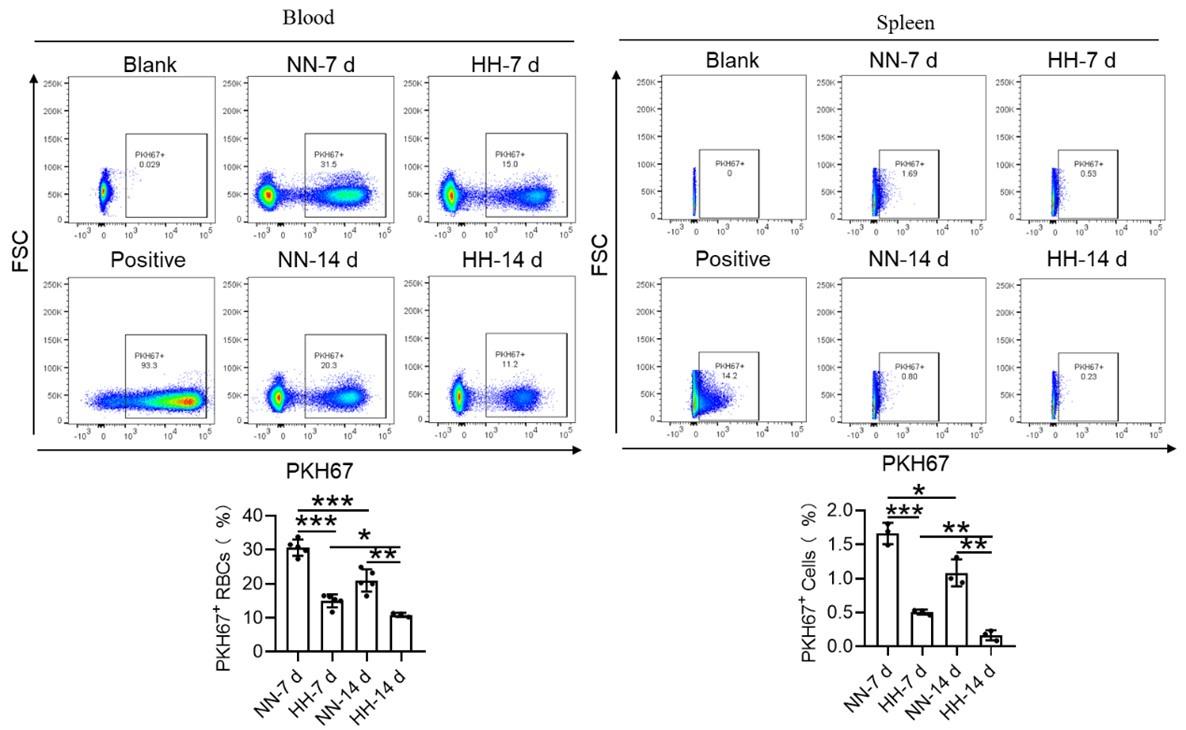
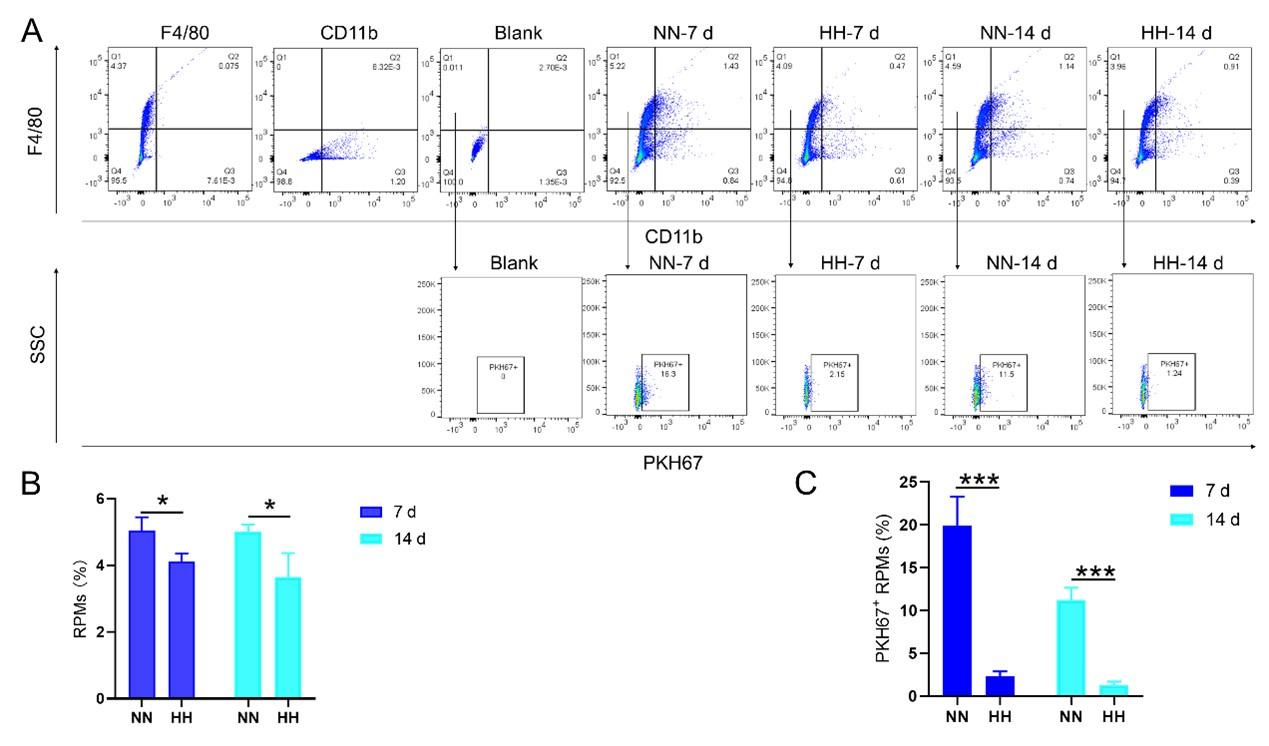
We conducted an experiment where RBCs from mice were labeled with PKH67 and injected back into the mice. These mice were then exposed to normal normoxia (NN) or HH for 7 or 14 days. The subsequent assessment of RPMs in the spleen using flow cytometry and immunofluorescence detection revealed a significant decrease in both the population of splenic RPMs (F4/80hiCD11blo, new Figure 5A and C) and PKH67-positive macrophages after HH exposure (as depicted in new Figure 5A and C-E). This finding supports our original claim of reduced phagocytosis under HH conditions.
Author response image 1.
-Experiment 2 (erythrophagocytosis enhancement)
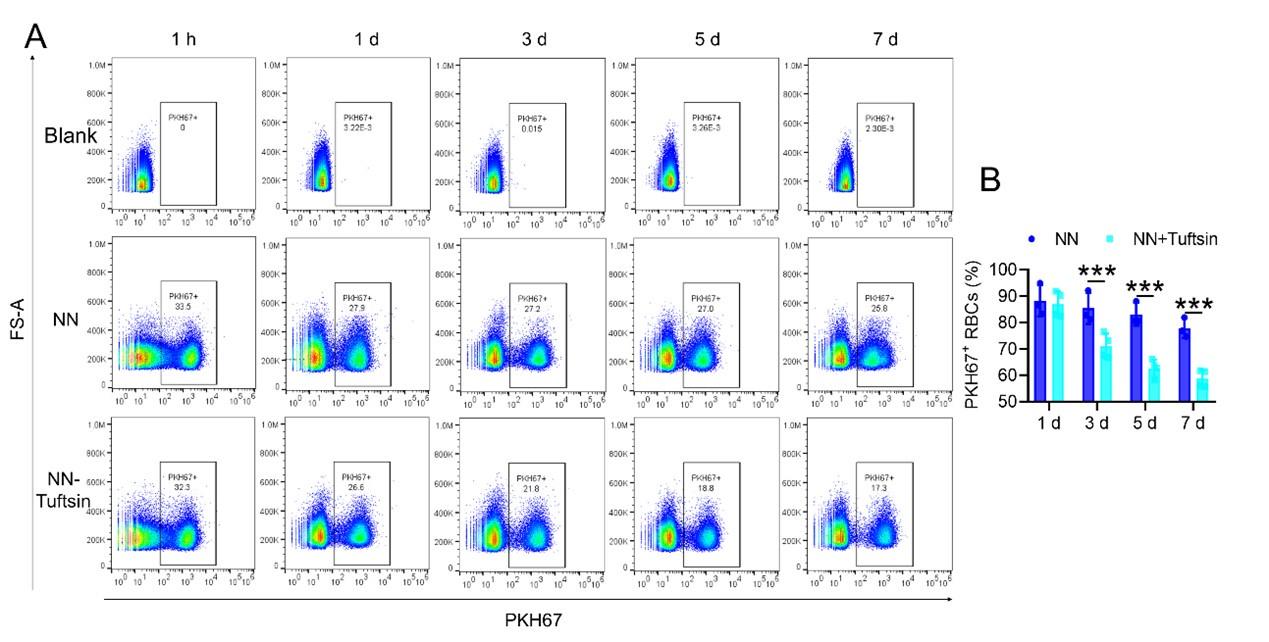
To examine the effects of enhanced erythrophagocytosis, we injected Tuftsin after administering PKH67-labelled RBCs. Our observations showed a significant decrease in PKH67 fluorescence in the spleen, particularly after Tuftsin injection compared to the NN group. This result suggests a reduction in RBC lifespan when erythrophagocytosis is enhanced (illustrated in new Figure 7, A-B).
Author response image 2.
(3) Revised conclusions:
The additional data from these experiments support our original findings by providing a more comprehensive view of the impact of HH exposure on splenic erythrophagocytosis.
The decrease in phagocytic RPMs and phagocytic erythrocytes after HH exposure, along with the observed decrease in RBC lifespan following enhanced erythrophagocytosis, collectively suggest a more complex interplay between hypoxia, erythrophagocytosis, and RBC lifespan than initially interpreted.
We think that these revisions and additional experimental data provide a more robust and detailed understanding of the effects of HH on splenic erythrophagocytosis and RBCs lifespan. We hope that these changes adequately address the concerns raised and strengthen the conclusions drawn in our manuscript.
(2) F4/80 high; CD11b low are true RPMs which the cells which the authors are presenting, i.e. splenic monocytes / pre-RPMs. To discuss RPM function requires the presentation of these cells specifically rather than general cells in the proper area of the spleen.
Thank you for your feedback requesting a substantial revision of our claims and interpretation, particularly considering additional data showing enhanced erythrophagocytosis with decreased RBC lifespan. In response, we have thoroughly revised our manuscript and included new experimental data that further elucidate the effects of HH on RPMs and erythrophagocytosis.
(1) Re-evaluation of RPMs population after HH exposure:
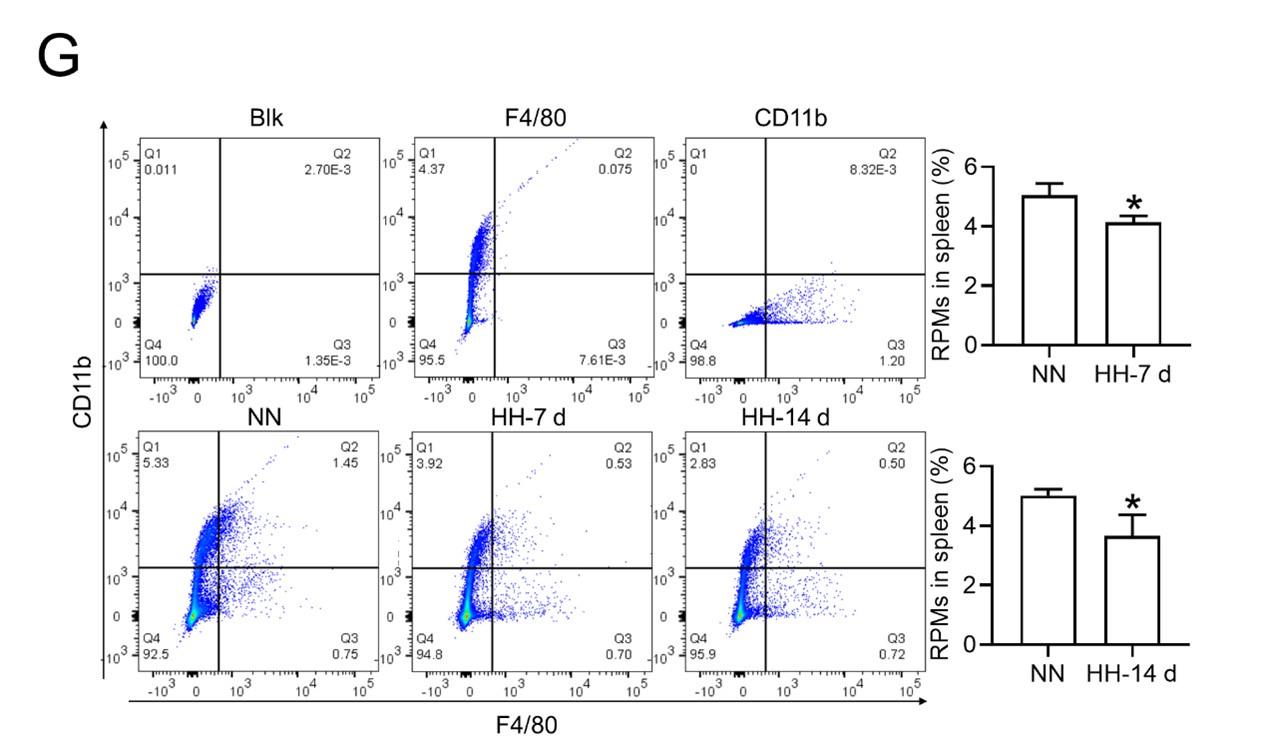
- Flow cytometry analysis (new Figure 3G, Figure 5A and B): We revisited the analysis of RPMs (F4/80hiCD11blo) in the spleen after 7 and 14 days of HH exposure. Our revised flow cytometry data consistently showed a significant decrease in the RPMs population post-HH exposure, reinforcing our initial findings.
Author response image 3.
Author response image 4.
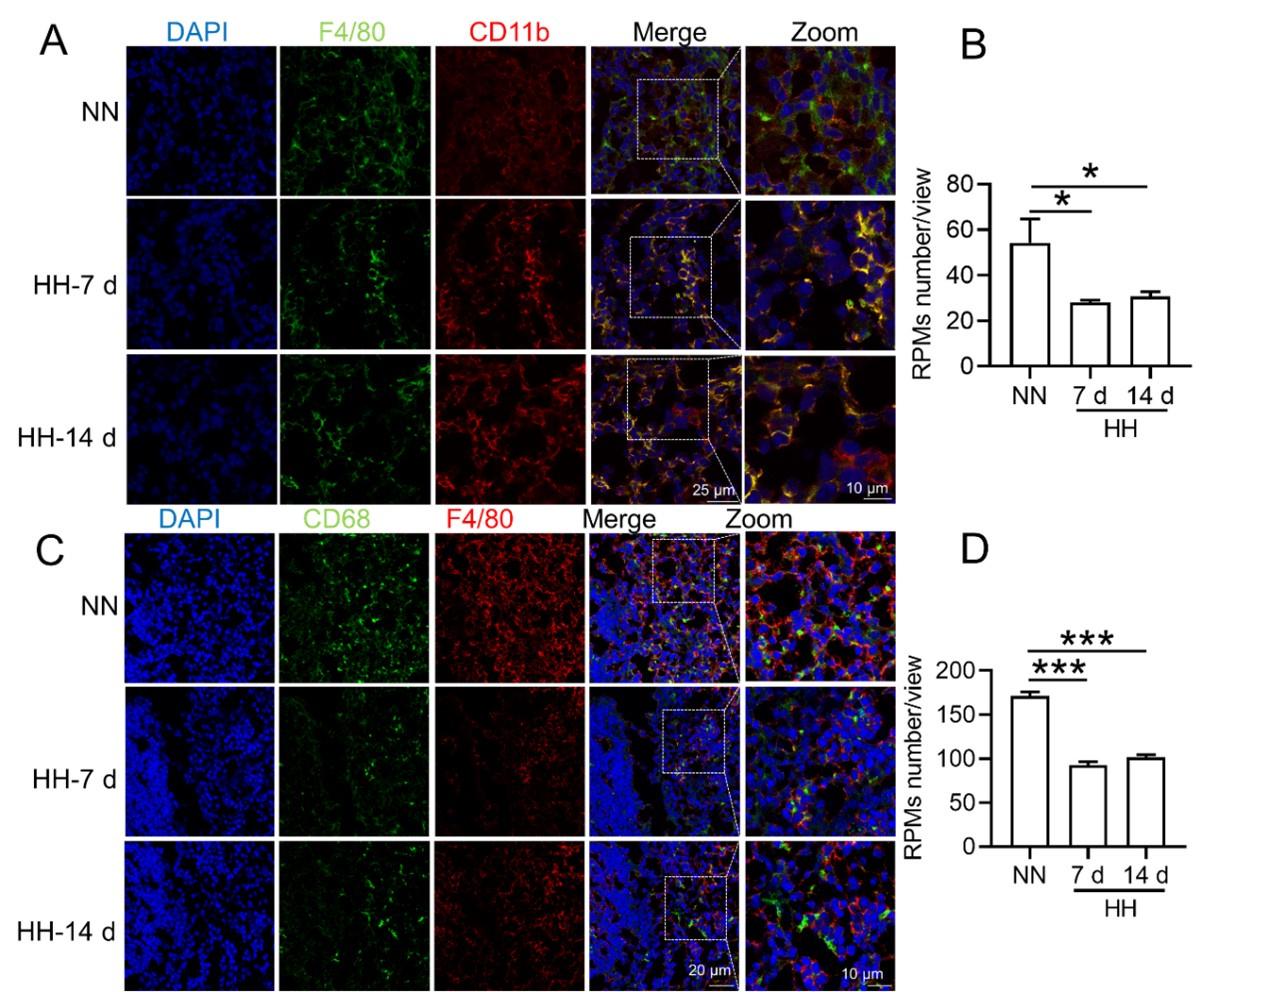
- In situ expression of RPMs (Figure S1, A-D):
We further confirmed the decreased population of RPMs through in situ co-staining with F4/80 and CD11b, and F4/80 and CD68, in spleen tissues. These results clearly demonstrated a significant reduction in F4/80hiCD11blo (Figure S1, A and B) and F4/80hiCD68hi (Figure S1, C and D) cells following HH exposure.
Author response image 5.
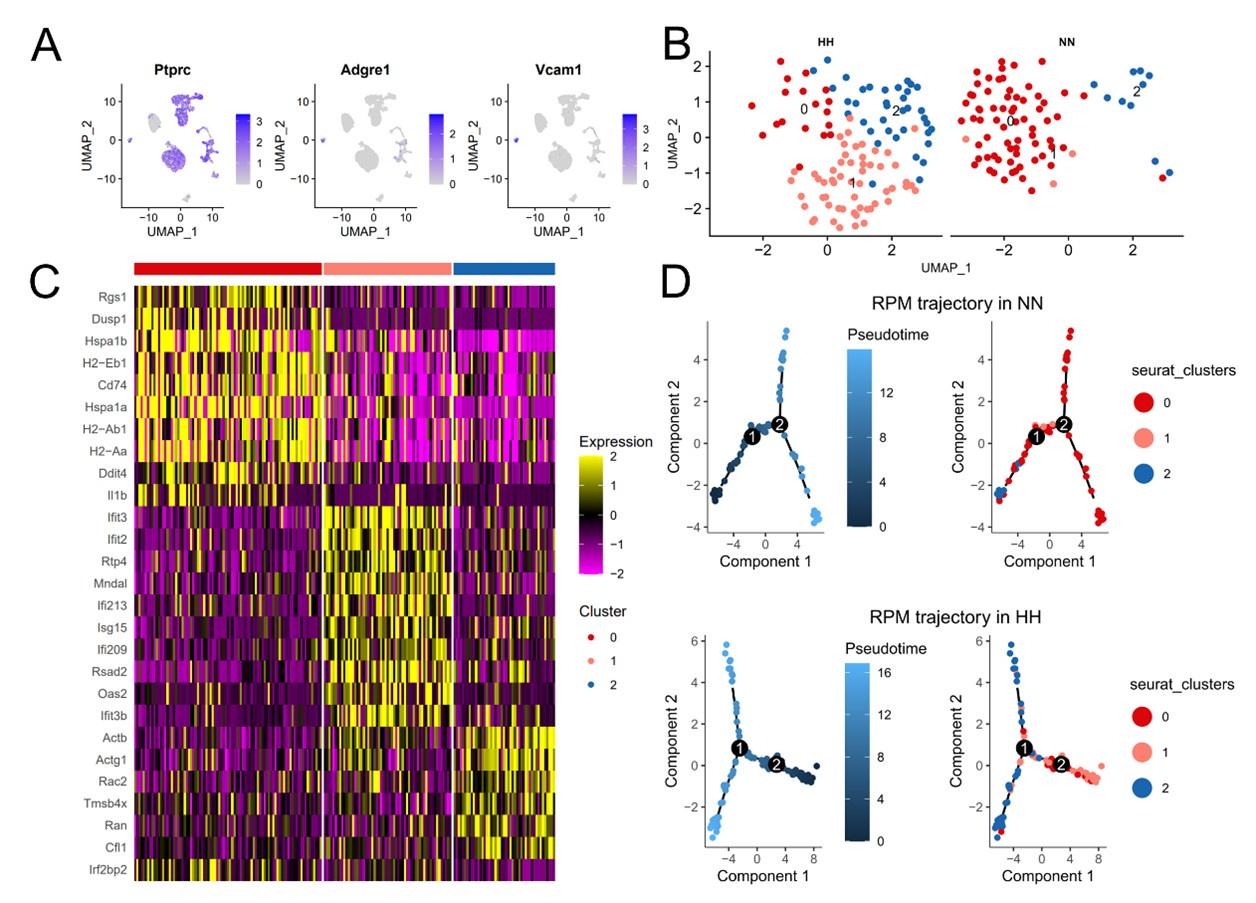
(2) Single-cell sequencing analysis of splenic RPMs:
We conducted a single-cell sequencing analysis of spleen samples post 7 days of HH exposure (Figure S2, A-C). This analysis revealed a notable shift in the distribution of RPMs, predominantly associated with Cluster 0 under NN conditions, to a reduced presence in this cluster after HH exposure.
Pseudo-time series analysis indicated a transition pattern change in spleen RPMs, with a shift from Cluster 2 and Cluster 1 towards Cluster 0 under NN conditions, and a reverse transition following HH exposure (Figure S2, B and D). This finding implies a decrease in resident RPMs in the spleen under HH conditions.
(3) Consolidated findings and revised interpretation:
The comprehensive analysis of flow cytometry, in situ staining, and single-cell sequencing data consistently indicates a significant reduction in the number of RPMs following HH exposure.
These findings, taken together, strongly support the revised conclusion that HH exposure leads to a decrease in RPMs in the spleen, which in turn may affect erythrophagocytosis and RBC lifespan.
Author response image 6.
In conclusion, our revised manuscript now includes additional experimental data and analyses, strengthening our claims and providing a more nuanced interpretation of the impact of HH on spleen RPMs and related erythrophagocytosis processes. We believe these revisions and additional data address your concerns and enhance the scientific validity of our study.
(3) RBC retention in the spleen should be measured anyway quantitatively, eg, with proper flow cytometry, to determine whether it is increased or decreased.
Thank you for your query regarding the quantitative measurement of RBC retention in the spleen, particularly in relation to HH exposure. We have utilized a combination of techniques, including flow cytometry and histological staining, to investigate this aspect comprehensively. Below is a summary of our findings and methodology.
(1) Flow cytometry analysis of labeled RBCs:
Our study employed both NHS-biotin (new Figure 4, A-D) and PKH67 labeling (new Figure 4, E-H) to track RBCs in mice exposed to HH. Flow cytometry results from these experiments (new Figure 4, A-H) showed a decrease in the proportion of labeled RBCs over time, both in the blood and spleen. Notably, there was a significantly greater reduction in the amplitude of fluorescently labeled RBCs after NN exposure compared to the reduced amplitude of fluorescently labeled RBCs observed in blood and spleen under HH exposure. The observed decrease in labeled RBCs was initially counterintuitive, as we expected an increase in RBC retention due to reduced erythrophagocytosis. However, this decrease can be attributed to the significantly increased production of RBCs following HH exposure, diluting the proportion of labeled cells.
Specifically, for blood, the biotin-labeled RBCs decreased by 12.06% under NN exposure and by 7.82% under HH exposure, while the PKH67-labeled RBCs decreased by 9.70% under NN exposure and by 4.09% under HH exposure. For spleen, the biotin-labeled RBCs decreased by 3.13% under NN exposure and by 0.46% under HH exposure, while the PKH67-labeled RBCs decreased by 1.16% under NN exposure and by 0.92% under HH exposure. These findings suggest that HH exposure leads to a decrease in the clearance rate of RBCs.
Author response image 7.
(2) Detection of erythrophagocytosis in spleen:
To assess erythrophagocytosis directly, we labeled RBCs with PKH67 and analyzed their uptake by splenic macrophages (F4/80hi) after HH exposure. Our findings (new Figure 5, D-E) indicated a decrease in PKH67-positive macrophages in the spleen, suggesting reduced erythrophagocytosis.
Author response image 8.
(3) Flow cytometry analysis of RBC retention:
Our flow cytometry analysis revealed a decrease in PKH67-positive RBCs in both blood and spleen (Figure S4). We postulated that this was due to increased RBC production after HH exposure. However, this method might not accurately reflect RBC retention, as it measures the proportion of PKH67-labeled RBCs relative to the total number of RBCs, which increased after HH exposure.
Author response image 9.
(4) Histological and immunostaining analysis:
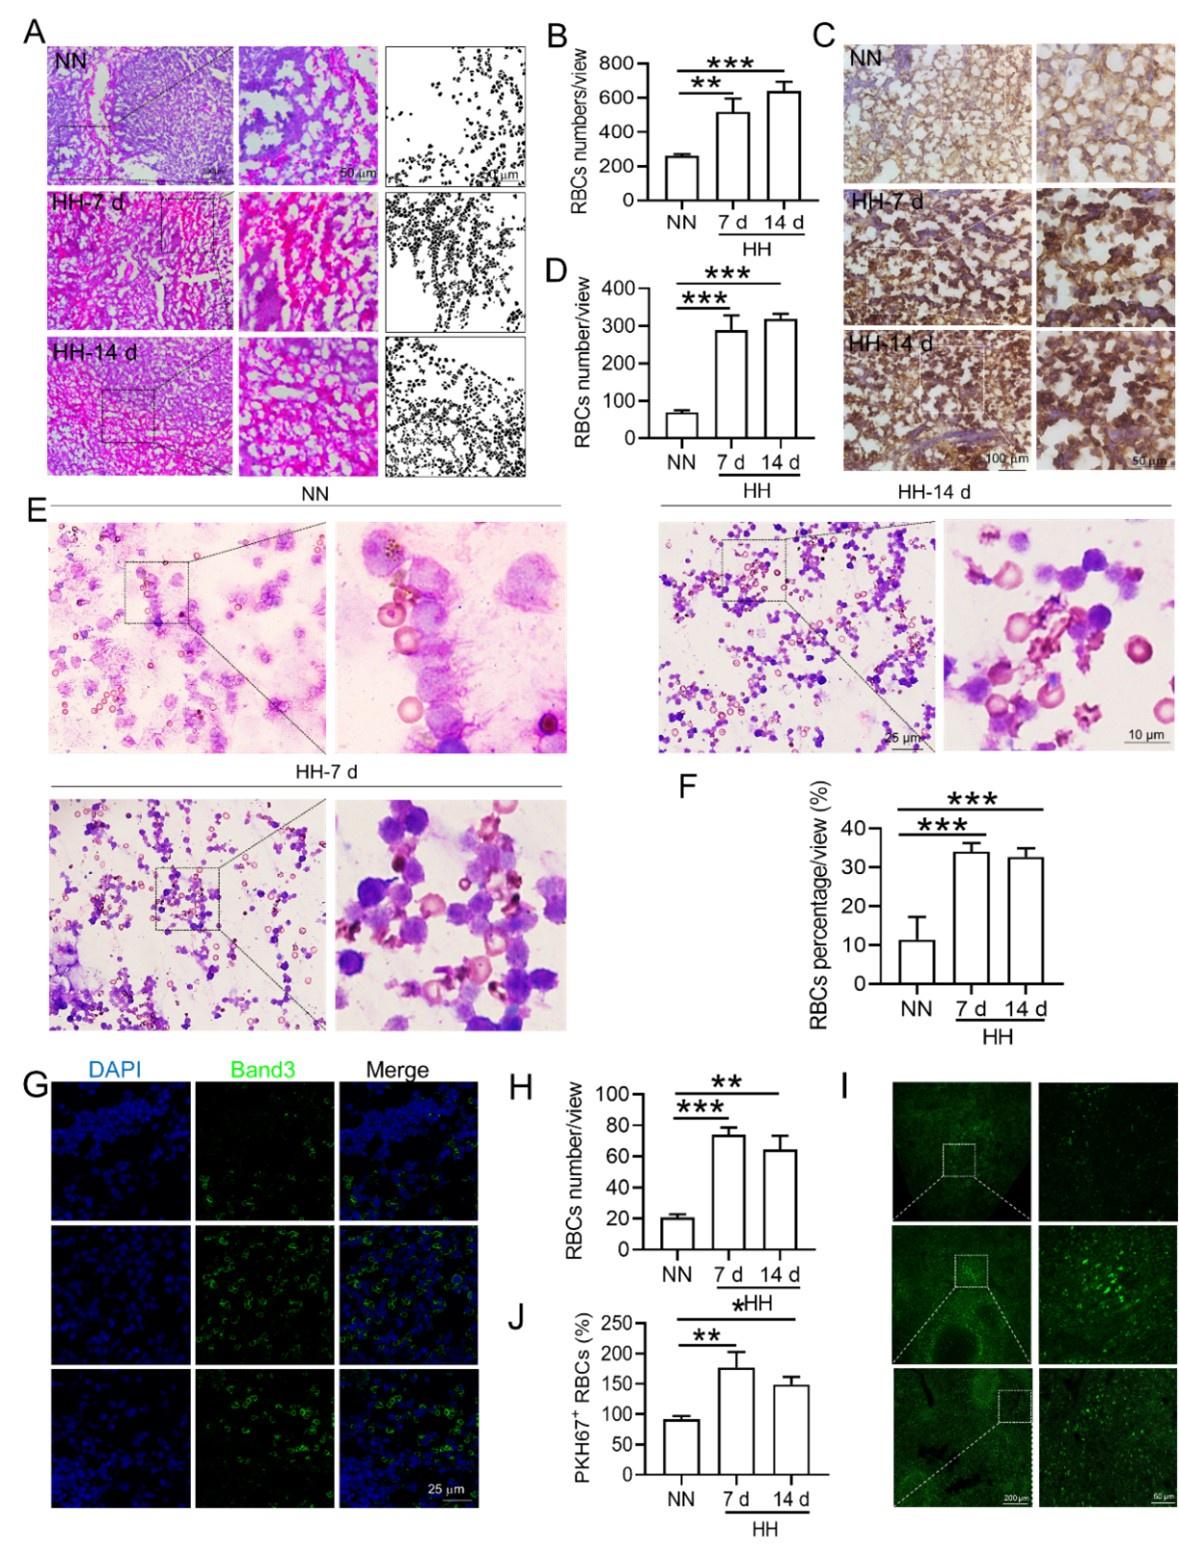
Histological examination using HE staining and band3 immunostaining in situ (new Figure 6, A-D, and G-H) revealed a significant increase in RBC numbers in the spleen after HH exposure. This was further confirmed by detecting retained RBCs in splenic single cells using Wright-Giemsa composite stain (new Figure 6, E and F) and retained PKH67-labelled RBCs in spleen (new Figure 6, I and J).
Author response image 10.
(5) Interpreting the data:
The comprehensive analysis suggests a complex interplay between increased RBC production and decreased erythrophagocytosis in the spleen following HH exposure. While flow cytometry indicated a decrease in the proportion of labeled RBCs, histological and immunostaining analyses demonstrated an actual increase in RBCs retention in the spleen. These findings collectively suggest that while the overall RBCs production is upregulated following HH exposure, the spleen's capacity for erythrophagocytosis is concurrently diminished, leading to increased RBCs retention.
(6) Conclusion:
Taken together, our results indicate a significant increase in RBCs retention in the spleen post-HH exposure, likely due to reduced residual RPMs and erythrophagocytosis. This conclusion is supported by a combination of flow cytometry, histological staining, and immunostaining techniques, providing a comprehensive view of RBC dynamics under HH conditions. We think these findings offer a clear quantitative measure of RBC retention in the spleen, addressing the concerns raised in your question.
(4) Numerous other methodological problems as listed below.
We appreciate your question, which highlights the importance of using multiple analytical approaches to understand complex physiological processes. Please find below our point-by-point response to the methodological comments.
Reviewer #1 (Recommendations For The Authors):
(1) Decreased BM and spleen monocytes d/t increased liver monocyte migration is unclear. there is no evidence that this happens or why it would be a reasonable hypothesis, even in splenectomized mice.
Thank you for highlighting the need for further clarification and justification of our hypothesized decrease in BM and spleen monocytes due to increased monocyte migration to the liver, particularly in the context of splenectomized mice. Indeed, our study has not explicitly verified an augmentation in mononuclear cell migration to the liver in splenectomized mice.
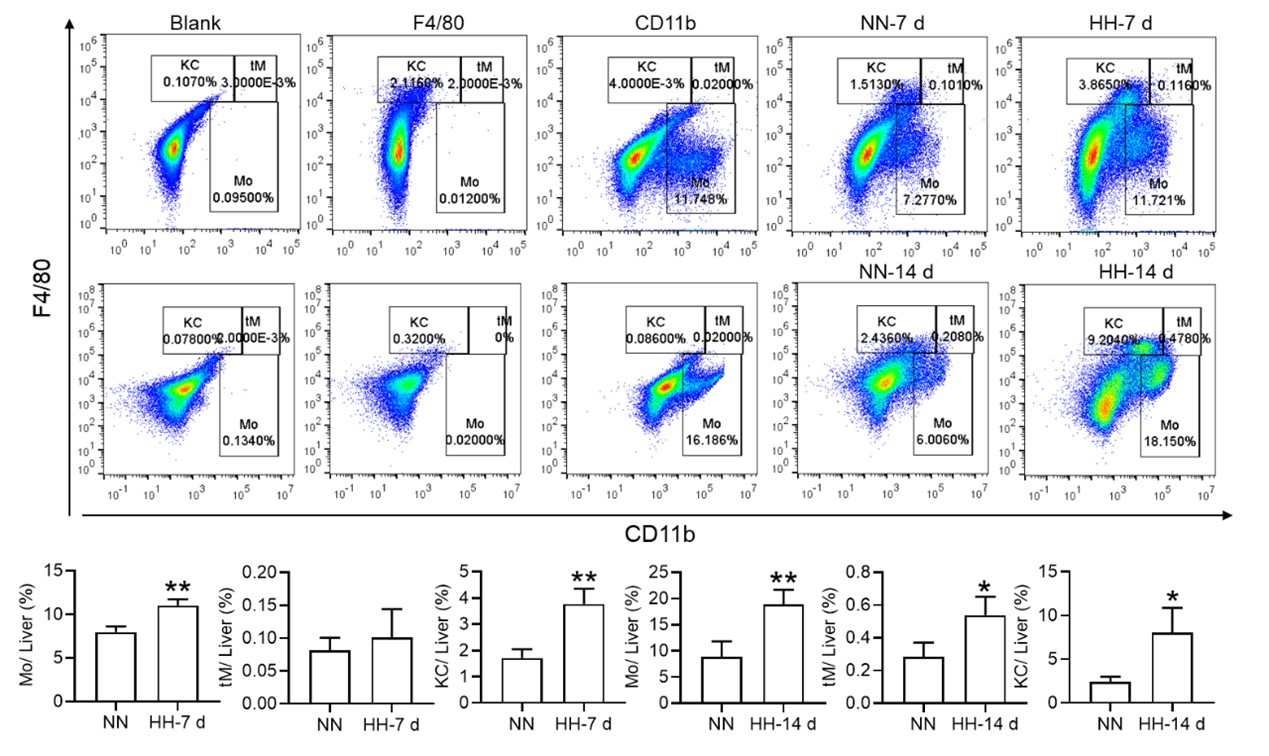
Nonetheless, our investigations have revealed a notable increase in monocyte migration to the liver after HH exposure. Noteworthy is our discovery of a significant upregulation in colony stimulating factor-1 (CSF-1) expression in the liver, observed after both 7 and 14 days of HH exposure (data not included). This observation was substantiated through flow cytometry analysis (as depicted in Figure S4), which affirmed an enhanced migration of monocytes to the liver. Specifically, we noted a considerable increase in the population of transient macrophages, monocytes, and Kupffer cells in the liver following HH exposure.
Author response image 11.

Considering these findings, we hypothesize that hypoxic conditions may activate a compensatory mechanism that directs monocytes towards the liver, potentially linked to the liver’s integral role in the systemic immune response. In accordance with these insights, we intend to revise our manuscript to reflect the speculative nature of this hypothesis more accurately, and to delineate the strategies we propose for its further empirical investigation. This amendment ensures that our hypothesis is presented with full consideration of its speculative basis, supported by a coherent framework for future validation.
(2) While F4/80+CD11b+ population is decreased, this is mainly driven by CD11b and F4/80+ alone population is significantly increased. This is counter to the hypothesis.
Thank you for addressing the apparent discrepancy in our findings concerning the F4/80+CD11b+ population and the increase in the F4/80+ alone population, which seems to contradict our initial hypothesis. Your observation is indeed crucial for the integrity of our study, and we appreciate the opportunity to clarify this matter.
(1) Clarification of flow cytometry results:
In response to the concerns raised, we revisited our flow cytometry experiments with a focus on more clearly distinguishing the cell populations. Our initial graph had some ambiguities in cell grouping, which might have led to misinterpretations.
The revised flow cytometry analysis, specifically aimed at identifying red pulp macrophages (RPMs) characterized as F4/80hiCD11blo in the spleen, demonstrated a significant decrease in the F4/80 population. This finding is now in alignment with our immunofluorescence results.
Author response image 12.

Author response image 13.
(2) Revised data and interpretation:
- The results presented in new Figure 3G and Figure 5 (A and B) consistently indicate a notable reduction in the RPMs population following HH exposure. This supports our revised understanding that HH exposure leads to a decrease in the specific macrophage subset (F4/80hiCD11blo) in the spleen.
We’ve updated our manuscript to reflect these new findings and interpretations. The revised manuscript details the revised flow cytometry analysis and discusses the potential mechanisms behind the observed changes in macrophage populations.
(3) HO-1 expression cannot be used as a surrogate to quantify number of macrophages as the expression per cell can decrease and give the same results. In addition, the localization of effect to the red pulp is not equivalent to an assertion that the conclusion applies to macrophages given the heterogeneity of this part of the organ and the spleen in general.
Thank you for your insightful comments regarding the use of HO-1 expression as a surrogate marker for quantifying macrophage numbers, and for pointing out the complexity of attributing changes in HO-1 expression specifically to macrophages in the splenic red pulp. Your observations are indeed valid and warrant a detailed response.
(1) Role of HO-1 in macrophage activity:
In our study, HO-1 expression was not utilized as a direct marker for quantifying macrophages. Instead, it was considered an indicator of macrophage activity, particularly in relation to erythrophagocytosis. HO-1, being upregulated in response to erythrophagocytosis, serves as an indirect marker of this process within splenic macrophages.
The rationale behind this approach was that increased HO-1 expression, induced by erythrophagocytosis in the spleen’s red pulp, could suggest an augmentation in the activity of splenic macrophages involved in this process.
(2) Limitations of using HO-1 as an indicator:
We acknowledge your point that HO-1 expression per cell might decrease, potentially leading to misleading interpretations if used as a direct quantifier of macrophage numbers. The variability in HO-1 expression per cell indeed presents a limitation in using it as a sole indicator of macrophage quantity.
Furthermore, your observation about the heterogeneity of the spleen, particularly the red pulp, is crucial. The red pulp is a complex environment with various cell types, and asserting that changes in HO-1 expression are exclusive to macrophages could oversimplify this complexity.
(3) Addressing the concerns:
To address these concerns, we propose to supplement our HO-1 expression data with additional specific markers for macrophages. This would help in correlating HO-1 expression more accurately with macrophage numbers and activity.
We also plan to conduct further studies to delineate the specific cell types in the red pulp contributing to HO-1 expression. This could involve techniques such as immunofluorescence or immunohistochemistry, which would allow us to localize HO-1 expression to specific cell populations within the splenic red pulp.
We’ve revised our manuscript to clarify the role of HO-1 expression as an indirect marker of erythrophagocytosis and to acknowledge its limitations as a surrogate for quantifying macrophage numbers.
(4) line 63-65 is inaccurate as red cell homeostasis reaches a new steady state in chronic hypoxia.
Thank you for pointing out the inaccuracy in lines 63-65 of our manuscript regarding red cell homeostasis in chronic hypoxia. Your feedback is invaluable in ensuring the accuracy and scientific integrity of our work. We’ve revised lines 63-65 to accurately reflect the understanding.
(5) Eryptosis is not defined in the manuscript.
Thank you for highlighting the omission of a definition for eryptosis in our manuscript. We acknowledge the significance of precisely defining such key terminologies, particularly when they play a crucial role in the context of our research findings. Eryptosis, a term referenced in our study, is a specialized form of programmed cell death unique to erythrocytes. Similar with apoptosis in other cell types, eryptosis is characterized by distinct physiological changes including cell shrinkage, membrane blebbing, and the externalization of phosphatidylserine on the erythrocyte surface. These features are indicative of the RBCs lifecycle and its regulated destruction process.
However, it is pertinent to note that our current study does not extensively delve into the mechanisms or implications of eryptosis. Our primary focus has been to elucidate the effects of HH exposure on the processes of splenic erythrophagocytosis and the resultant impact on the lifespan of RBCs. Given this focus, and to maintain the coherence and relevance of our manuscript, we have decided to exclude specific discussions of eryptosis from our revised manuscript. This decision aligns with our aim to provide a clear and concentrated exploration of the influence of HH exposure on RBCs dynamics and splenic function.
We appreciate your input, which has significantly contributed to enhancing the clarity and accuracy of our manuscript. The revision ensures that our research is presented with a focused scope, aligning closely with our experimental investigations and findings.
(6) Physiologically, there is no evidence that there is any "free iron" in cells, making line 89 point inaccurate.
Thank you for highlighting the concern regarding the reference to "free iron" in cells in line 89 of our manuscript. The term "free iron" in our manuscript was intended to refer to divalent iron (Fe2+), rather than unbound iron ions freely circulating within cells. We acknowledge that the term "free iron" might lead to misconceptions, as it implies the presence of unchelated iron, which is not physiologically common due to the potential for oxidative damage. To rectify this and provide clarity, we’ve revised line 89 of our manuscript to reflect our meaning more accurately. Instead of "free iron," we use "divalent iron (Fe2+)" to avoid any misunderstanding regarding the state of iron in cells. We also ensure that any implications drawn from the presence of Fe2+ in cells are consistent with current scientific literature and understanding.
(7) Fig 1f no stats
We appreciate your critical review and suggestions, which help in improving the accuracy and clarity of our research. We’ve revised statistic diagram of new Figure 1F.
(8) Splenectomy experiments demonstrate that erythrophagocytosis is almost completely replaced by functional macrophages in other tissues (likely Kupffer cells in the liver). there is only a minor defect and no data on whether it is in fact the liver or other organs that provide this replacement function and makes the assertions in lines 345-349 significantly overstated.
Thank you for your critical assessment of our interpretation of the splenectomy experiments, especially concerning the role of erythrophagocytosis by macrophages in other tissues, such as Kupffer cells in the liver. We appreciate your observation that our assertions may be overstated and acknowledge the need for more specific data to identify which organs compensate for the loss of splenic erythrophagocytosis.
(1) Splenectomy experiment findings:
Our findings in Figure 2D do indicate that in the splenectomized group under NN conditions, erythrophagocytosis is substantially compensated for by functional macrophages in other tissues. This is an important observation that highlights the body's ability to adapt to the loss of splenic function.
However, under HH conditions, our data suggest that the spleen plays an important role in managing erythrocyte turnover, as indicated by the significant impact of splenectomy on erythrophagocytosis and subsequent erythrocyte dynamics.
(2) Addressing the lack of specific organ identification:
We acknowledge that our study does not definitively identify which organs, such as the liver or others, take over the erythrophagocytosis function post-splenectomy. This is an important aspect that needs further investigation.
To address this, we also plan to perform additional experiments that could more accurately point out the specific tissues compensating for the loss of splenic erythrophagocytosis. This could involve tracking labeled erythrocytes or using specific markers to identify macrophages actively engaged in erythrophagocytosis in various organs.
(3) Revising manuscript statements:
Considering your feedback, we’ve revised the statements in lines 345-349 (lines 378-383 in revised manuscript) to enhance the scientific rigor and clarity of our research presentation.
(9) M1 vs M2 macrophage experiments are irrelevant to the main thrust of the manuscript, there are no references to support the use of only CD16 and CD86 for these purposes, and no stats are provided. It is also unclear why bone marrow monocyte data is presented and how it is relevant to the rest of the manuscript.
Thank you for your critical evaluation of the relevance and presentation of the M1 vs. M2 macrophage experiments in our manuscript. We appreciate your insights, especially regarding the use of specific markers and the lack of statistical analysis, as well as the relevance of bone marrow monocyte data to our study's main focus.
(1) Removal of M1 and M2 macrophage data:
Based on your feedback and our reassessment, we agree that the results pertaining to M1 and M2 macrophages did not align well with the main objectives of our manuscript. Consequently, we have decided to remove the related content on M1 and M2 macrophages from the revised manuscript. This decision was made to ensure that our manuscript remains focused and coherent, highlighting our primary findings without the distraction of unrelated or insufficiently supported data.
The use of only CD16 and CD86 markers for M1 and M2 macrophage characterization, without appropriate statistical analysis, was indeed a methodological limitation. We recognize that a more comprehensive set of markers and rigorous statistical analysis would be necessary for a meaningful interpretation of M1/M2 macrophage polarization. Furthermore, the relevance of these experiments to the central theme of our manuscript was not adequately established. Our study primarily focuses on erythrophagocytosis and red pulp macrophage dynamics under hypobaric hypoxia, and the M1/M2 polarization aspect did not contribute significantly to this narrative.
(2) Clarification on bone marrow monocyte data:
Regarding the inclusion of bone marrow monocyte data, we acknowledge that its relevance to the main thrust of the manuscript was not clearly articulated. In the revised manuscript, we provide a clearer rationale for its inclusion and how it relates to our primary objectives.
(3) Commitment to clarity and relevance:
We are committed to ensuring that every component of our manuscript contributes meaningfully to our overall objectives and research questions. Your feedback has been instrumental in guiding us to streamline our focus and present our findings more effectively.
We appreciate your valuable feedback, which has led to a more focused and relevant presentation of our research. These changes enhance the clarity and impact of our manuscript, ensuring that it accurately reflects our key research findings.
(10) Biotinolated RBC clearance is enhanced, demonstrating that RBC erythrophagocytosis is in fact ENHANCED, not diminished, calling into question the founding hypothesis that the manuscript proposes.
Thank you for your critical evaluation of our data on biotinylated RBC clearance, which suggests enhanced erythrophagocytosis under HH conditions. This observation indeed challenges our founding hypothesis that erythrophagocytosis is diminished in this setting. Below is a summary of our findings and methodology.
(1) Interpretation of RBC labeling results:
Both the previous results of NHS-biotin labeled RBCs (new Figure 4, A-D) and the current results of PKH67-labeled RBCs (new Figure 4, E-H) demonstrated a decrease in the number of labeled RBCs with an increase in injection time. The production of RBCs, including bone marrow and spleen production, was significantly increased following HH exposure, resulting in a consistent decrease in the proportion of labeled RBCs via flow cytometry detection both in the blood and spleen of mice compared to the NN group. However, compared to the reduced amplitude of fluorescently labeled RBCs observed in blood and spleen under NN exposure, there was a significantly weaker reduction in the amplitude of fluorescently labeled RBCs after HH exposure. Specifically, for blood, the biotin-labeled RBCs decreased by 12.06% under NN exposure and by 7.82% under HH exposure, while the PKH67-labeled RBCs decreased by 9.70% under NN exposure and by 4.09% under HH exposure. For spleen, the biotin-labeled RBCs decreased by 3.13% under NN exposure and by 0.46% under HH exposure, while the PKH67-labeled RBCs decreased by 1.16% under NN exposure and by 0.92% under HH exposure.
Author response image 14.
(2) Increased RBCs production under HH conditions:
It's important to note that RBCs production, including from bone marrow and spleen, was significantly increased following HH exposure. This increase in RBCs production could contribute to the decreased proportion of labeled RBCs observed in flow cytometry analyses, as there are more unlabeled RBCs diluting the proportion of labeled cells in the blood and spleen.
(3) Analysis of erythrophagocytosis in RPMs:
Our analysis of PKH67-labeled RBCs content within RPMs following HH exposure showed a significant reduction in the number of PKH67-positive RPMs in the spleen (new Figure 5). This finding suggests a decrease in erythrophagocytosis by RPMs under HH conditions.
Author response image 15.
(4) Reconciling the findings:
The apparent contradiction between enhanced RBC clearance (suggested by the reduced proportion of labeled RBCs) and reduced erythrophagocytosis in RPMs (indicated by fewer PKH67-positive RPMs) may be explained by the increased overall production of RBCs under HH. This increased production could mask the actual erythrophagocytosis activity in terms of the proportion of labeled cells. Therefore, while the proportion of labeled RBCs decreases more significantly under HH conditions, this does not necessarily indicate an enhanced erythrophagocytosis rate, but rather an increased dilution effect due to higher RBCs turnover.
(5) Revised interpretation and manuscript changes:
Given these factors, we update our manuscript to reflect this detailed interpretation and clarify the implications of the increased RBCs production under HH conditions on our observations of labeled RBCs clearance and erythrophagocytosis. We appreciate your insightful feedback, which has prompted a careful re-examination of our data and interpretations. We hope that these revisions provide a more accurate and comprehensive understanding of the effects of HH on erythrophagocytosis and RBCs dynamics.
(11) Legend in Fig 4c-4d looks incorrect and Fig 4e-4f is very non-specific since Wright stain does not provide evidence of what type of cells these are and making for a significant overstatement in the contribution of this data to "confirming" increased erythrophagocytosis in the spleen under HH exposure (line 395-396).
Thank you for your insightful observations regarding the data presentation and figure legends in our manuscript, particularly in relation to Figure 4 (renamed as Figure 6 in the revised manuscript) and the use of Wright-Giemsa composite staining. We appreciate your constructive feedback and acknowledge the importance of presenting our data with utmost clarity and precision.
(1) Amendments to Figure legends:
We recognize the necessity of rectifying inaccuracies in the legends of the previously labeled Figure 4C and D. Corrections have been meticulously implemented to ensure the legends accurately contain the data presented. Additionally, we acknowledge the error concerning the description of Wright staining. The method employed in our study is Wright-Giemsa composite staining, which, unlike Wright staining that solely stains cytoplasm (RBC), is capable of staining both nuclei and cytoplasm.
(2) Addressing the specificity of Wright-Giemsa Composite staining:
Our approach involved quantifying RBC retention using Wright-Giemsa composite staining on single splenic cells post-perfusion at 7 and 14 days post HH exposure. We understand and appreciate your concerns regarding the nonspecific nature of Wright staining. Although Wright stain is a general hematologic stain and not explicitly specific for certain cell types, its application in our study aimed to provide preliminary insights. The spleen cells, devoid of nuclei and thus likely to be RBCs, were stained and observed post-perfusion, indicating RBC retention within the spleen.
(3) Incorporating additional methods for RBC identification:
To enhance the specificity of our findings, we integrated supplementary methods for RBC identification in the revised manuscript. We employed band3 immunostaining (in the new Figure 6, C-D and G-H) and PKH67 labeling (Figure 6, I-J) for a more targeted identification of RBCs. Band3, serving as a reliable marker for RBCs, augments the specificity of our immunostaining approach. Likewise, PKH67 labeling affords a direct and definitive means to assess RBC retention in the spleen following HH exposure.
Author response image 16. same as 10
(4) Revised interpretation and manuscript modifications:
Based on these enhanced methodologies, we have refined our interpretation of the data and accordingly updated the manuscript. The revised narrative underscores that our conclusions regarding reduced erythrophagocytosis and RBC retention under HH conditions are corroborated by not only Wright-Giemsa composite staining but also by band3 immunostaining and PKH67 labeling, each contributing distinctively to our comprehensive understanding.
We are committed to ensuring that our manuscript precisely reflects the contribution of each method to our findings and conclusions. Your thorough review has been invaluable in identifying and rectifying areas for improvement in our research report and interpretation.
(12) Ferroptosis data in Fig 5 is not specific to macrophages and Fer-1 data confirms the expected effect of Fer-1 but there is no data that supports that Fer-1 reverses the destruction of these cells or restores their function in hypoxia. Finally, these experiments were performed in peritoneal macrophages which are functionally distinct from splenic RPM.
Thank you for your critique of our presentation and interpretation of the ferroptosis data in Figure 5 (renamed as Figure 9 in the revised manuscript), as well as your observations regarding the specificity of the experiments to macrophages and the effects of Fer-1. We value your input and acknowledge the need to clarify these aspects in our manuscript.
(1) Clarification on cell type used in experiments:
- We appreciate your attention to the details of our experimental setup. The experiments presented in Figure 9 were indeed conducted on splenic macrophages, not peritoneal macrophages, as incorrectly mentioned in the original figure legend. This was an error in our manuscript, and we have revised the figure legend accordingly to accurately reflect the cell type used.
(2) Specificity of ferroptosis data:
We recognize that the data presented in Figure 9 need to be more explicitly linked to the specific macrophage population being studied. In the revised manuscript, we ensure that the discussion around ferroptosis data is clearly situated within the framework of splenic macrophages.
We also provide additional methodological details in the 'Methods' section to reinforce the specificity of our experiments to splenic macrophages.
(3) Effects of Fer-1 on macrophage function and survival:
Regarding the effect of Fer-1, we agree that while our data confirms the expected effect of Fer-1 in inhibiting ferroptosis, we have not provided direct evidence that Fer-1 reverses the destruction of macrophages or restores their function in hypoxia.
To address this, we propose additional experiments to specifically investigate the impact of Fer-1 on the survival and functional restoration of splenic macrophages under hypoxic conditions. This would involve assessing not only the inhibition of ferroptosis but also the recovery of macrophage functionality post-treatment.
(4) Revised interpretation and manuscript changes:
We’ve revised the relevant sections of our manuscript to reflect these clarifications and proposed additional studies. This includes modifying the discussion of the ferroptosis data to more accurately represent the cell types involved and the limitations of our current findings regarding the effects of Fer-1.
The revised manuscript presents a more detailed interpretation of the ferroptosis data, clearly describing what our current experiments demonstrate and what remains to be investigated.
We are grateful for your insightful feedback, which has highlighted important areas for improvement in our research presentation. We think that these revisions will enhance the clarity and scientific accuracy of our manuscript, ensuring that our findings and conclusions are well-supported and precisely communicated.
Reviewer #2 (Recommendations For The Authors):
The following questions and remarks should be considered by the authors:
(1) The methods should clearly state whether the HH was discontinued during the 7 or 14 day exposure for cleaning, fresh water etc. Moreover, how was CO2 controlled? The procedure for splenectomy needs to be described in the methods.
Thank you for your inquiry regarding the specifics of our experimental methods, particularly the management of HH exposure and the procedure for splenectomy. We appreciate your attention to detail and the importance of these aspects for the reproducibility and clarity of our research.
(1) HH exposure conditions:
In our experiments, mice were continuously exposed to HH for the entire duration of 7 or 14 days, without interruption for activities such as cleaning or providing fresh water. This uninterrupted exposure was crucial for maintaining consistent hypobaric conditions throughout the experiment. The hypobaric chamber was configured to ensure a ventilation rate of 25 air exchanges per minute. This high ventilation rate was effective in regulating the concentration of CO2 inside the chamber, thereby maintaining a stable environment for the mice.
(2) The splenectomy was performed as follows:
After anesthesia, the mice were placed in a supine position, and their limbs were fixed. The abdominal operation area was skinned, disinfected, and covered with a sterile towel. A median incision was made in the upper abdomen, followed by laparotomy to locate the spleen. The spleen was then carefully pulled out through the incision. The arterial and venous directions in the splenic pedicle were examined, and two vascular forceps were used to clamp all the tissue in the main cadre of blood vessels below the splenic portal. The splenic pedicle was cut between the forceps to remove the spleen. The end of the proximal hepatic artery was clamped with a vascular clamp, and double or through ligation was performed to secure the site. The abdominal cavity was then cleaned to ensure there was no bleeding at the ligation site, and the incision was closed. Post-operatively, the animals were housed individually. Generally, they were able to feed themselves after recovering from anesthesia and did not require special care.
We hope this detailed description addresses your queries and provides a clear understanding of the experimental conditions and procedures used in our study. These methodological details are crucial for ensuring the accuracy and reproducibility of our research findings.
(2) The lack of changes in MCH needs explanation? During stress erythropoiesis some limit in iron availability should cause MCH decrease particularly if the authors claim that macrophages for rapid iron recycling are decreased. Fig 1A is dispensable. Fig 1G NN control 14 days does not make sense since it is higher than 7 days of HH.
Thank you for your inquiry regarding the lack of changes in Mean Corpuscular Hemoglobin (MCH) in our study, particularly in the context of stress erythropoiesis and decreased macrophage-mediated iron recycling. We appreciate the opportunity to provide further clarification on this aspect.
(1) Explanation for stable MCH levels:
Our research identified a decrease in erythrophagocytosis and iron recycling in the spleen following HH exposure. Despite this, the MCH levels remained stable. This observation can be explained by considering the compensatory roles of other organs, particularly the liver and duodenum, in maintaining iron homeostasis.
Specifically, our investigations revealed an enhanced capacity of the liver to engulf RBCs and process iron under HH conditions. This increased hepatic erythrophagocytosis likely compensates for the reduced splenic activity, thereby stabilizing MCH levels.
(2) Role of hepcidin and DMT1 expression:
Additionally, hypoxia is known to influence iron metabolism through the downregulation of Hepcidin and upregulation of Divalent Metal Transporter 1 (DMT1) expression. These alterations lead to enhanced intestinal iron absorption and increased blood iron levels, further contributing to the maintenance of MCH levels despite reduced splenic iron recycling.
(3) Revised Figure 1 and data presentation
To address the confusion regarding the data presented in Figure 1G, we have made revisions in our manuscript. The original Figure 1G, which did not align with the expected trends, has been removed. In its place, we have included a statistical chart of Figure 1F in the new version of Figure 1G. This revision will provide a clearer and more accurate representation of our findings.
(4) Manuscript updates and future research:
We update our manuscript to incorporate these explanations, ensuring that the rationale behind the stable MCH levels is clearly articulated. This includes a discussion on the role of the liver and duodenum in iron metabolism under hypoxic conditions.
Future research could explore in greater detail the mechanisms by which different organs contribute to iron homeostasis under stress conditions like HH, particularly focusing on the dynamic interplay between hepatic and splenic functions.
We thank you for your insightful question, which has prompted a thorough re-examination of our findings and interpretations. We believe that these clarifications will enhance the overall understanding of our study and its implications in the context of iron metabolism and erythropoiesis under hypoxic conditions.
(3) Fig 2 the difference between sham and splenectomy is really marginal and not convincing. Is there also a difference at 7 days? Why does the spleen size decrease between 7 and 14 days?
Thank you for your observations regarding the marginal differences observed between sham and splenectomy groups in Figure 2, as well as your inquiries about spleen size dynamics over time. We appreciate this opportunity to clarify these aspects of our study.
(1) Splenectomy vs. Sham group differences:
- In our experiments, the difference between the sham and splenectomy groups under HH conditions, though subtle, was consistent with our hypothesis regarding the spleen's role in erythrophagocytosis and stress erythropoiesis. Under NN conditions, no significant difference was observed between these groups, which aligns with the expectation that the spleen's contribution is more pronounced under hypoxic stress.
(2) Spleen size dynamics and peak stress erythropoiesis:
The observed splenic enlargement prior to 7 days can be attributed to a combination of factors, including the retention of RBCs and extramedullary hematopoiesis, which is known to be a response to hypoxic stress.
Prior research has elucidated that splenic stress-induced erythropoiesis, triggered by hypoxic conditions, typically attains its zenith within a timeframe of 3 to 7 days. This observation aligns with our Toluidine Blue (TO) staining results, which indicated that the apex of this response occurs at the 7-day mark (as depicted in Figure 1, F-G). Here, the culmination of this peak is characteristically succeeded by a diminution in extramedullary hematopoiesis, a phenomenon that could elucidate the observed contraction in spleen size, particularly in the interval between 7 and 14 days.
This pattern of splenic response under prolonged hypoxic stress is corroborated by studies such as those conducted by Wang et al. (2021), Harada et al. (2015), and Cenariu et al. (2021). These references collectively underscore that the spleen undergoes significant dynamism in reaction to sustained hypoxia. This dynamism is initially manifested as an enlargement of the spleen, attributable to escalated erythropoiesis and erythrophagocytosis. Subsequently, as these processes approach normalization, a regression in spleen size ensues.
We’ve revised our manuscript to include a more detailed explanation of these splenic dynamics under HH conditions, referencing the relevant literature to provide a comprehensive context for our findings. We will also consider performing additional analysis or providing further data on spleen size changes at 7 days to support our observations and ensure a thorough understanding of the splenic response to hypoxic stress over time.
(4) Fig 3 B the clusters should be explained in detail. If the decrease in macrophages in Fig 3K/L is responsible for the effect, why does splenectomy not have a much stronger effect? How do the authors know which cells died in the calcein stained population in Fig 3D?
Thank you for your insightful questions regarding the details of our data presentation in Figure 3, particularly about the identification of cell clusters and the implications of macrophage reduction. We appreciate the opportunity to address these aspects and clarify our findings.
(1) Explanation of cell clusters in Figure 3B:
In the revised manuscript, we have included detailed notes for each cell population represented in Figure 3B (Figure 3D in revised manuscript). These notes provide a clearer understanding of the cell types present in each cluster, enhancing the interpretability of our single-cell sequencing data.
This detailed annotation will help readers to better understand the composition of the splenic cell populations under study and how they are affected by hypoxic conditions.
(2) Impact of splenectomy vs. macrophage reduction:
The interplay between the reduction in macrophage populations, as evidenced by our single-cell sequencing data, and the ramifications of splenectomy presents a multifaceted scenario. Notably, the observed decline in macrophage numbers following HH exposure does not straightforwardly equate to a comparable alteration in overall splenic function, as might be anticipated with splenectomy.
In the context of splenectomy under HH conditions, a significant escalation in the RBCs count was observed, surpassing that in non-splenectomized mice exposed to HH. This finding underscores the spleen's critical role in modulating RBCs dynamics under HH. It also indirectly suggests that the diminished phagocytic capacity of the spleen following HH exposure contributes to an augmented RBCs count, albeit to a lesser extent than in the splenectomy group. This difference is attributed to the fact that, while the number of RPMs in the spleen post-HH is reduced, they are still present, unlike in the case of splenectomy, where they are entirely absent.
Splenectomy entails the complete removal of the spleen, thus eliminating a broad spectrum of functions beyond erythrophagocytosis and iron recycling mediated by macrophages. The nuanced changes observed in our study may be reflective of the spleen's diverse functionalities and the organism's adaptive compensatory mechanisms in response to the loss of this organ.
(3) Calcein stained population in Figure 3D:
Regarding the identification of cell death in the calcein-stained population in Figure 3D (Figure 3A in revised manuscript), we acknowledge that the specific cell types undergoing death could not be distinctly determined from this analysis alone.
The calcein staining method allows for the visualization of live (calcein-positive) and dead (calcein-negative) cells, but it does not provide specific information about the cell types. The decrease in macrophage population was inferred from the single-cell sequencing data, which offered a more precise identification of cell types.
(4) Revised manuscript and data presentation:
Considering your feedback, we have revised our manuscript to provide a more comprehensive explanation of the data presented in Figure 3, including the nature of the cell clusters and the interpretation of the calcein staining results.
We have also updated the manuscript to reflect the removal of Figure 3K/L results and to provide a more focused discussion on the relevant findings.
We are grateful for your detailed review, which has helped us to refine our data presentation and interpretation. These clarifications and revisions will enhance the clarity and scientific rigor of our manuscript, ensuring that our conclusions are well-supported and accurately conveyed.
(5) Is the reduced phagocytic capacity in Fig 4B significant? Erythrophagocytosis is compromised due to the considerable spontaneous loss of labelled erythrocytes; could other assays help? (potentially by a modified Chromium release assay?). Is it necessary to stimulated phagocytosis to see a significant effect?
Thank you for your inquiry regarding the significance of the reduced phagocytic capacity observed in Figure 4B, and the potential for employing alternative assays to elucidate erythrophagocytosis dynamics under HH conditions.
(1) Significance of reduced phagocytic capacity:
The observed reduction in the amplitude of fluorescently labeled RBCs in both the blood and spleen under HH conditions suggests a decrease in erythrophagocytosis. This is indicative of a diminished phagocytic capacity, particularly when contrasted with NN conditions.
(2) Investigation of erythrophagocytosis dynamics:
To delve deeper into erythrophagocytosis under HH, we employed Tuftsin to enhance this process. Following the injection of PKH67-labeled RBCs and subsequent HH exposure, we noted a significant decrease in PKH67 fluorescence in the spleen, particularly marked after the administration of Tuftsin. This finding implies that stimulated erythrophagocytosis can influence RBCs lifespan.
(3) Erythrophagocytosis under normal and hypoxic conditions:
Under normal conditions, the reduction in phagocytic activity is less apparent without stimulation. However, under HH conditions, our findings demonstrate a clear weakening of the phagocytic effect. While we established that promoting phagocytosis under NN conditions affects RBC lifespan, the impact of enhanced phagocytosis under HH on RBCs numbers was not explicitly investigated.
(4) Potential for alternative assays:
Considering the considerable spontaneous loss of labeled erythrocytes, alternative assays such as a modified Chromium release assay could provide further insights. Such assays might offer a more nuanced understanding of erythrophagocytosis efficiency and the stability of labeled RBCs under different conditions.
(5) Future research directions:
The implications of these results suggest that future studies should focus on comparing the effects of stimulated phagocytosis under both NN and HH conditions. This would offer a clearer picture of the impact of hypoxia on the phagocytic capacity of macrophages and the subsequent effects on RBC turnover.
In summary, our findings indicate a diminished erythrophagocytic capacity, with enhanced phagocytosis affecting RBCs lifespan. Further investigation, potentially using alternative assays, would be beneficial to comprehensively understand the dynamics of erythrophagocytosis in different physiological states.
(6) Can the observed ferroptosis be influenced by bi- and not trivalent iron chelators?
Thank you for your question regarding the potential influence of bi- and trivalent iron chelators on ferroptosis under hypoxic conditions. We appreciate the opportunity to discuss the implications of our findings in this context.
(1) Analysis of iron chelators on ferroptosis:
In our study, we did not specifically analyze the effects of bi- and trivalent iron chelators on ferroptosis under hypoxia. However, our observations with Deferoxamine (DFO), a well-known iron chelator, provide some insights into how iron chelation may influence ferroptosis in splenic macrophages under hypoxic conditions.
(2) Effect of DFO on oxidative stress markers:
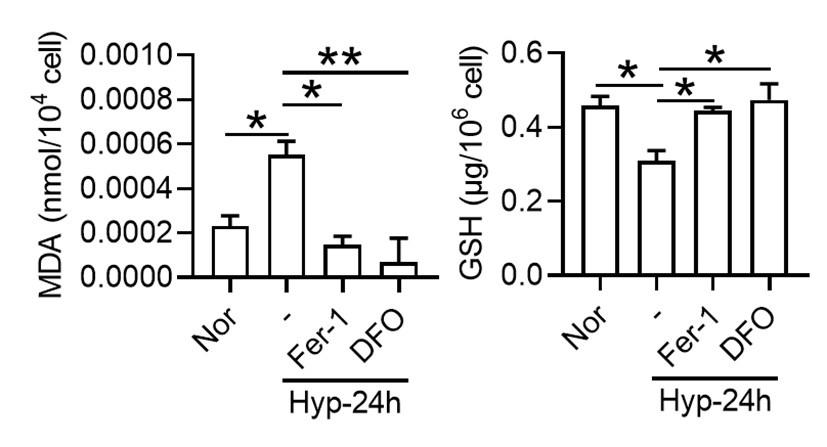
Our findings showed that under 1% O2, there was an increase in Malondialdehyde (MDA) content, a marker of lipid peroxidation, and a decrease in Glutathione (GSH) content, indicative of oxidative stress. These changes are consistent with the induction of ferroptosis, which is characterized by increased lipid peroxidation and depletion of antioxidants. Treatment with Ferrostatin-1 (Fer-1) and DFO effectively reversed these alterations. This suggests that DFO, like Fer-1, can mitigate ferroptosis in splenic macrophages under hypoxia, primarily by impacting MDA and GSH levels.
Author response image 17.
(3) Potential role of iron chelators in ferroptosis:
The effectiveness of DFO in reducing markers of ferroptosis indicates that iron availability plays a crucial role in the ferroptotic process under hypoxic conditions. It is plausible that both bi- and trivalent iron chelators could influence ferroptosis, given their ability to modulate iron availability within cells. Since ferroptosis is an iron-dependent form of cell death, chelating iron, irrespective of its valence state, could potentially disrupt the process by limiting the iron necessary for the generation of reactive oxygen species and lipid peroxidation.
(4) Additional research and manuscript updates:
Our study highlights the need for further research to explore the differential effects of various iron chelators on ferroptosis, particularly under hypoxic conditions. Such studies could provide a more comprehensive understanding of the role of iron in ferroptosis and the potential therapeutic applications of iron chelators. We update our manuscript to include these findings and discuss the potential implications of iron chelation in the context of ferroptosis under hypoxic conditions. This will provide a broader perspective on our research and its significance in understanding the mechanisms of ferroptosis.
-
eLife assessment
This useful study reports that a week or more of hypoxia exposure in mice increases erythropoiesis and decreases the number of iron-recycling macrophages in the spleen, compromising their capacity for red blood cell phagocytosis – reflected by increased mature erythrocyte retention in the spleen. Compared to an earlier version, the study has been strengthened with mouse experiments under hypobaric hypoxia and complemented by extensive ex vivo analyses. Unfortunately, while some of the evidence is solid, the work as it currently stands only incompletely supports the authors' hypotheses. While the study would benefit from additional experiments that more directly buttress the central claims, it should be of interest to the fields of hemopoiesis and bone marrow biology and possibly also blood cancer.
-
Reviewer #2 (Public Review):
The authors aimed at elucidating the development of high altitude polycythemia which affects mice and men staying in a hypoxic atmosphere at high altitude (hypobaric hypoxia; HH). HH causes increased erythropoietin production which stimulates the production of red blood cells. The authors hypothesize that increased production is only partially responsible for exaggerated red blood cell production, i.e. polycythemia, but that decreased erythrophagocytosis in the spleen contributes to high red blood cells counts.
The main strength of the study is the use of a mouse model exposed to HH in a hypobaric chamber. However, not all of the reported results are convincing due to some smaller effects which one may doubt to result in the overall increase in red blood cells as claimed by the authors. Moreover, direct …
Reviewer #2 (Public Review):
The authors aimed at elucidating the development of high altitude polycythemia which affects mice and men staying in a hypoxic atmosphere at high altitude (hypobaric hypoxia; HH). HH causes increased erythropoietin production which stimulates the production of red blood cells. The authors hypothesize that increased production is only partially responsible for exaggerated red blood cell production, i.e. polycythemia, but that decreased erythrophagocytosis in the spleen contributes to high red blood cells counts.
The main strength of the study is the use of a mouse model exposed to HH in a hypobaric chamber. However, not all of the reported results are convincing due to some smaller effects which one may doubt to result in the overall increase in red blood cells as claimed by the authors. Moreover, direct proof for reduced erythrophagocytosis is compromised due to a strong spontaneous loss of labelled red blood cells, although effects of labelled E. coli phagocytosis are shown.
Comments on latest version:
The authors have partly addressed my comments.
(1) The response to my question regarding unchanged MCH is a kind of "hand waiving" - maybe it would require substantially more extensive work to clarify this issue
(2) The moderate if not marginal difference in normal vs splenectomy argues against a significant role of the spleen - even if the difference was slightly larger in HH
(3) There is still overinterpretation of data. My Q was: Is the reduced phagocytic capacity in Fig 4B significant? Response: "This is indicative of a diminished phagocytic capacity, particularly when contrasted
with NN conditions." I guess that is a "no"(4) I assume my question with respect to bi- or trivalent iron chelators was misunderstood.
In general, as indicated above, it is an interesting hypothesis which is corroborated by data in several instances. Maybe the scientific community should decide whether it is all in all conclusive.
-
Reviewer #3 (Public Review):
The manuscript by Yang et al. investigated in mice how hypobaric hypoxia can modify the RBC clearance function of the spleen, a concept that is of interest. Via interpretation of their data, the authors proposed a model that hypoxia causes an increase in cellular iron levels, possibly in RPMs, leading to ferroptosis, and downregulates their erythrophagocytic capacity.
Comments on revised version:
The manuscript has now improved with all the new data, supporting the model proposed by the authors. However, it remains not very easy to follow for the conclusions and experimental details. Some of the most important remaining comments are listed below:
(1) Lines 401-406 - The conclusions in this new fragment sound a bit overstated - the authors do not directly measure erytrophagocytosis capacity, only the total …
Reviewer #3 (Public Review):
The manuscript by Yang et al. investigated in mice how hypobaric hypoxia can modify the RBC clearance function of the spleen, a concept that is of interest. Via interpretation of their data, the authors proposed a model that hypoxia causes an increase in cellular iron levels, possibly in RPMs, leading to ferroptosis, and downregulates their erythrophagocytic capacity.
Comments on revised version:
The manuscript has now improved with all the new data, supporting the model proposed by the authors. However, it remains not very easy to follow for the conclusions and experimental details. Some of the most important remaining comments are listed below:
(1) Lines 401-406 - The conclusions in this new fragment sound a bit overstated - the authors do not directly measure erytrophagocytosis capacity, only the total RBC parameters in the circulation. The increase is also very mild biologically between sham and splenectomized mice in HH conditions.
(2) scRNA seq data are still presented in a way that is very difficult to understand. The readers could not see from the graphics that macrophages are depleted. The clusters are not labelled - some clusters in the bin 'macrophahes+DC' seem actually to be more represented in Fig. 3E; Fig. 3F does not correspond to Fig. 3D. It would be maybe more informative to present like in Figure D side by side NN versus HH? The authors could consider moving the data from supplements that relate to RPMs to the main figure and making it consistent for the Clusters - eg, the authors show data for Cluster 0 in the supplement, and the same Cluster is not marked as macrophages in the main figure. This is quite difficult to follow.
(3) Figure 3G has likely mislabeled axis for F4/80 and CD11b - such mistakes should be avoided in a second revised version of the manuscript, and this data is now redundant with the data shown as new Figure 5A.
(4) The data from new Figure 4 should be better mentioned in the main body of the manuscript - all panels are mentioned twice in the text, first speaking about the decline of labelled RBCs and second referring to phagocytic capacity, whereas this figure only illustrates the decline of labelled RBCs, not directly phagocytic capacity of RPMs. What is lacking, as opposed to typical RBC life span assay, is the time '0' ('starting point') - this is particularly important as we can observe a big drop in labelled RBCs for eg 7 days between NN and HH group, actually implying increased removal of labelled RBCs within the first days of hypoxia exposure. What should be better labelled in this figure is that the proportion of RBCs are labelled RBCs not all RBCs (Y axis in individual panels). Overall, the new Figure 4 brings new data to the study, but how it is presented and discussed is not at the 'state-of-the-art' level (eg, missing the time '0') and is not very straightforward to the reader.
(5) In Figure 7, the experiments with Tuftsin are not very easy to follow, especially for the major conclusions. In panels A and B, the focus is the drug itself under NN conditions, with RBC removal as a readout. Then, in the next panels, the authors introduce HH, and then look at the F4/80 and iron staining. What was exactly the major point the authors wanted to make here?
(6) The data from Figure 8 are informative but do not address the individual cell types - eg, a drop in HO1 or FT may be due to the depletion of RPMs. An increase of TFR1 could be due to the retention of RBCs, the same as maybe labile iron. The data from PBMC are only very loosely linked to these phenotypes observed in the total spleen, and the reason for the regulation of the same proteins in PBMC might be different. It goes back to the data in Figure 3A-C, where also total splenocytes are investigated for their viability.
(7) Can the authors provide the data for the purity (eg cell surface markers) of their primary splenic macrophage cultures? Only ensuring that these are macrophages or addressing the readouts from Figure 8 in RPMs could link ferroptosis to RPMs under HH conditions.
(8) All the data are not presented as individual data points which is not widely applied in papers.
(9) No gating strategies are nicely illustrated or described.
-
-
Author Response
The following is the authors’ response to the original reviews.
We gratefully thank the editors and all reviewers for their time spend making their constructive remarks and useful suggestions, which has significantly raised the quality of the manuscript and has enable us to improve the manuscript. Each suggested comment brought forward by the reviewers was accurately considered. The manuscript has been revised in consideration of all suggestions.
Reviewer #1 (Public Review):
Wang and all present an interesting body of work focused on the effects of high altitude and hypoxia on erythropoiesis, resulting in erythrocytosis. This work is specifically focused on the spleen, identifying splenic macrophages as central cells in this effect. This is logical since these cells are involved in erythrophagocytosis and iron …
Author Response
The following is the authors’ response to the original reviews.
We gratefully thank the editors and all reviewers for their time spend making their constructive remarks and useful suggestions, which has significantly raised the quality of the manuscript and has enable us to improve the manuscript. Each suggested comment brought forward by the reviewers was accurately considered. The manuscript has been revised in consideration of all suggestions.
Reviewer #1 (Public Review):
Wang and all present an interesting body of work focused on the effects of high altitude and hypoxia on erythropoiesis, resulting in erythrocytosis. This work is specifically focused on the spleen, identifying splenic macrophages as central cells in this effect. This is logical since these cells are involved in erythrophagocytosis and iron recycling. The results suggest that hypoxia induces splenomegaly with decreased number of splenic macrophages. There is also evidence that ferroptosis is induced in these macrophages, leading to cell destruction. Finally, the data suggest that ferroptosis in splenic red pulp macrophages causes the decrease in RBC clearance, resulting in erythrocytosis aka lengthening the RBC lifespan. However, there are many issues with the presented results, with somewhat superficial data, meaning the conclusions are overstated and there is decreased confidence that the hypotheses and observed results are directly causally related to hypoxia.
Major points:
- The spleen is a relatively poorly understood organ but what is known about its role in erythropoiesis especially in mice is that it functions both to clear as well as to generate RBCs. The later process is termed extramedullary hematopoiesis and can occur in other bones beyond the pelvis, liver, and spleen. In mice, the spleen is the main organ of extramedullary erythropoiesis. The finding of transiently decreased spleen size prior to splenomegaly under hypoxic conditions is interesting but not well developed in the manuscript. This is a shortcoming as this is an opportunity to evaluate the immediate effect of hypoxia separately from its more chronic effect. Based just on spleen size, no conclusions can be drawn about what happens in the spleen in response to hypoxia.
Thank you for your insightful comments and questions. The spleen is instrumental in both immune response and the clearance of erythrocytes, as well as serving as a significant reservoir of blood in the body. This organ, characterized by its high perfusion rate and pliability, constricts under conditions of intense stress, such as during peak physical exertion, the diving reflex, or protracted periods of apnea. This contraction can trigger an immediate release of red blood cells (RBCs) into the bloodstream in instances of substantial blood loss or significant reduction of RBCs. Moreover, elevated oxygen consumption rates in certain animal species can be partially attributed to splenic contractions, which augment hematocrit levels and the overall volume of circulating blood, thereby enhancing venous return and oxygen delivery (Dane et al. J Appl Physiol, 2006, 101:289-97; Longhurst et al. Am J Physiol, 1986, 251: H502-9). In our investigation, we noted a significant contraction of the spleen following exposure to hypoxia for a period of one day. We hypothesized that the body, under such conditions, is incapable of generating sufficient RBCs promptly enough to facilitate enhanced oxygen delivery. Consequently, the spleen reacts by releasing its stored RBCs through splenic constriction, leading to a measurable reduction in spleen size.
However, we agree with you that further investigation is required to fully understand the implications of these changes. Considering the comments, we extended our research by incorporating more detailed examinations of spleen morphology and function during hypoxia, including the potential impact on extramedullary hematopoiesis. We anticipate that such an expanded analysis would not only help elucidate the initial response to hypoxia but also provide insights into the more chronic effects of this condition on spleen function and erythropoiesis.
- Monocyte repopulation of tissue resident macrophages is a minor component of the process being described and it is surprising that monocytes in the bone marrow and spleen are also decreased. Can the authors conjecture why this is happening? Typically, the expectation would be that a decrease in tissue resident macrophages would be accompanied by an increase in monocyte migration into the organ in a compensatory manner.
We appreciate your insightful query regarding the observed decrease in monocytes in the bone marrow and spleen, particularly considering the typical compensatory increase in monocyte migration into organs following a decrease in tissue resident macrophages.
The observed decrease in monocytes within the bone marrow is likely attributable to the fact that monocytes and precursor cells for red blood cells (RBCs) both originate from the same hematopoietic stem cells within the bone marrow. It is well established that exposure to hypobaric hypoxia (HH) induces erythroid differentiation specifically within the bone marrow, originating from these hematopoietic stem cells (Exp Hematol, 2021 May;97:32-46). As such, the differentiation to monocyte is reduced under hypoxic conditions, which may subsequently cause a decrease in migration to spleen.
Furthermore, we hypothesize that an increased migration of monocytes to other tissues under HH exposure may also contribute to the decreased migration to the spleen. The liver, which partially contributes to the clearance of RBCs, may play a role in this process. Our investigations to date have indeed identified an increased monocyte migration to the liver. We were pleased to discover an elevation in CSF1 expression in the liver following HH exposure for both 7 and 14 days. This finding was corroborated through flow cytometry, which confirmed an increase in monocyte migration to the liver.
Consequently, we propose that under HH conditions, the liver requires an increased influx of monocytes, which in turn leads to a decrease in monocyte migration to the spleen. However, it is important to note that these findings will be discussed more comprehensively in our forthcoming publication, and as such, the data pertaining to these results have not been included in the current manuscript.
Author response image 1.
- Figure 3 does not definitively provide evidence that cell death is specifically occurring in splenic macrophages and the fraction of Cd11b+ cells is not changed in NN vs HH. Furthermore, the IHC of F4/80 in Fig 3U is not definitive as cells can express F4/80 more or less brightly and no negative/positive controls are shown for this panel.
We appreciate your insightful comments and critiques regarding Figure 3. We acknowledge that the figure, as presented, does not definitively demonstrate that cell death is specifically occurring in splenic macrophages. While it is challenging to definitively determine the occurrence of cell death in macrophages based solely on Figure 3D-F, our single-cell analysis provides strong evidence that such an event occurs. We initially observed cell death within the spleen under hypobaric hypoxia (HH) conditions, and to discern the precise cell type involved, we conducted single-cell analyses. Regrettably, we did not articulate this clearly in our preliminary manuscript.
In the revised version, we have modified the sequence of Figure 3A-C and Figure 3D-F for better clarity. Besides, we observed a significant decrease in the fraction of F4/80hiCD11bhi macrophages under HH conditions compared to NN. To make the changes more evident in CD86 and CD206, we have transformed these scatter plots into histograms in our revised manuscript.
Author response image 2.

Considering the limitations of F4/80 as a conclusive macrophage identifier, we have concurrently presented the immunohistochemical (IHC) analyses of heme oxygenase-1 (HO-1). Functioning as a macrophage marker, particularly in cells involved in iron metabolism, HO-1 offers additional diagnostic accuracy. Observations from both F4/80 and HO-1 staining suggested a primary localization of positively stained cells within the splenic red pulp. Following exposure to hypoxia-hyperoxia (HH) conditions, a decrease was noted in the expression of both F4/80 and HO-1. This decrease implies that HH conditions contribute to a reduction in macrophage population and impede the iron metabolism process. In the revised version of our manuscript, we have enhanced the clarity of Figure 3U to illustrate the presence of positive staining, with an emphasis on HO-1 staining, which is predominantly observed in the red pulp.
Author response image 3.

- The phagocytic function of splenic red pulp macrophages relative to infection cannot be used directly to understand erythrophagocytosis. The standard approach is to use opsonized RBCs in vitro. Furthermore, RBC survival is a standard method to assess erythrophagocytosis function. In this method, biotin is injected via tail vein directly and small blood samples are collected to measure the clearance of biotinilation by flow; kits are available to accomplish this. Because the method is standard, Fig 4D is not necessary and Fig 4E needs to be performed only in blood by sampling mice repeatedly and comparing the rate of biotin decline in HH with NN (not comparing 7 d with 14 d).
We appreciate your insightful comments and suggestions. We concur that the phagocytic function of splenic red pulp macrophages in the context of infection may not be directly translatable to understanding erythrophagocytosis. Given our assessment that the use of cy5.5-labeled E.coli alone may not be sufficient to accurately evaluate the phagocytic function of macrophages, we extended our study to include the use of NHS-biotin-labeled RBCs to assess phagocytic capabilities. While the presence of biotin-labeled RBCs in the blood could provide an indication of RBC clearance, this measure does not exclusively reflect the spleen's role in the process, as it fails to account for the clearance activities of other organs.
Consequently, we propose that the remaining biotin-labeled RBCs in the spleen may provide a more direct representation of the organ's function in RBC clearance and sequestration. Our observations of diminished erythrophagocytosis at both 7- and 14-days following exposure to HH guided our subsequent efforts to quantify biotin-labeled RBCs in both the circulatory system and spleen. These measurements were conducted during the 7 to 14-day span following the confirmation of impaired erythrophagocytosis. Comparative evaluation of RBC clearance rates under NN and HH conditions provided further evidence supporting our preliminary observations, with the data revealing a decrease in the RBC clearance rate in the context of HH conditions. In response to feedback from other reviewers, we have elected to exclude the phagocytic results and the diagram of the erythrocyte labeling assay. These amendments will be incorporated into the revised manuscript. The reviewers' constructive feedback has played a crucial role in refining the methodological precision and coherence of our investigation.
- It is unclear whether Tuftsin has a specific effect on phagocytosis of RBCs without other potential confounding effects. Furthermore, quantifying iron in red pulp splenic macrophages requires alternative readily available more quantitative methods (e.g. sorted red pulp macrophages non-heme iron concentration).
We appreciate your comments and questions regarding the potential effect of Tuftsin on the phagocytosis of RBCs and the quantification of iron in red pulp splenic macrophages. Regarding the role of Tuftsin, we concur that the literature directly associating Tuftsin with erythrophagocytosis is scant. The work of Gino Roberto Corazza et al. does suggest a link between Tuftsin and general phagocytic capacity, but it does not specifically address erythrophagocytosis (Am J Gastroenterol, 1999;94:391-397). We agree that further investigations are required to elucidate the potential confounding effects and to ascertain whether Tuftsin has a specific impact on the phagocytosis of RBCs. Concerning the quantification of iron in red pulp splenic macrophages, we acknowledge your suggestion to employ readily available and more quantitative methods. We have incorporated additional Fe2+ staining in the spleen at two time points: 7 and 14 days subsequent to HH exposure (refer to the following Figure). The resultant data reveal an escalated deposition of Fe2+ within the red pulp, as evidenced in Figures 5 (panels L and M) and Figure S1 (panels L and M).
Author response image 4.

- In Fig 5, PBMCs are not thought to represent splenic macrophages and although of some interest, does not contribute significantly to the conclusions regarding splenic macrophages at the heart of the current work. The data is also in the wrong direction, namely providing evidence that PBMCs are relatively iron poor which is not consistent with ferroptosis which would increase cellular iron.
We appreciate your insightful critique regarding Figure 5 and the interpretation of our data on peripheral blood mononuclear cells (PBMCs) in relation to splenic macrophages. We understand that PBMCs do not directly represent splenic macrophages, and we agree that any conclusions drawn from PBMCs must be considered with caution when discussing the behavior of splenic macrophages.
The primary rationale for incorporating PBMCs into our study was to investigate the potential correspondence between their gene expression changes and those observed in the spleen after HH exposure. This was posited as a working hypothesis for further exploration rather than a conclusive statement. The gene expression in PBMCs was congruous with changes in the spleen's gene expression, demonstrating an iron deficiency phenotype, ostensibly due to the mobilization of intracellular iron for hemoglobin synthesis. Thus, it is plausible that NCOA4 may facilitate iron mobilization through the degradation of ferritin to store iron.
It remains ambiguous whether ferroptosis was initiated in the PBMCs during our study. Ferroptosis primarily occurs as a response to an increase in Fe2+ rather than an overall increase in intracellular iron. Our preliminary proposition was that relative changes in gene expression in PBMCs could potentially mirror corresponding changes in protein expression in the spleen, thereby potentially indicating alterations in iron processing capacity post-HH exposure. However, we fully acknowledge that this is a conjecture requiring further empirical substantiation or clinical validation.
- Tfr1 increase is typically correlated with cellular iron deficiency while ferroptosis consistent with iron loading. The direction of the changes in multiple elements relevant to iron trafficking is somewhat confusing and without additional evidence, there is little confidence that the authors have reached the correct conclusion. Furthermore, the results here are analyses of total spleen samples rather than specific cells in the spleen.
We appreciate your astute comments and agree that the observed increase in transferrin receptor (TfR) expression, typically associated with cellular iron deficiency, appears contradictory to the expected iron-loading state associated with ferroptosis. We understand that this apparent contradiction might engender some uncertainty about our conclusions. In our investigation, we evaluated total spleen samples as opposed to distinct cell types within the spleen, a factor that could have contributed to the seemingly discordant findings. An integral element to bear in mind is the existence of immature RBCs in the spleen, particularly within the hematopoietic island where these immature RBCs cluster around nurse macrophages. These immature RBCs contain abundant TfR which was needed for iron uptake and hemoglobin synthesis. These cells, which prove challenging to eliminate via perfusion, might have played a role in the observed upregulation in TfR expression, especially in the aftermath of HH exposure. Our further research revealed that the expression of TfR in macrophages diminished following hypoxic conditions, thereby suggesting that the elevated TfR expression in tissue samples may predominantly originate from other cell types, especially immature RBCs (refer to Author response image 5).
Author response image 5.

Reviewer #2 (Public Review):
The authors aimed at elucidating the development of high altitude polycythemia which affects mice and men staying in the hypoxic atmosphere at high altitude (hypobaric hypoxia; HH). HH causes increased erythropoietin production which stimulates the production of red blood cells. The authors hypothesize that increased production is only partially responsible for exaggerated red blood cell production, i.e. polycythemia, but that decreased erythrophagocytosis in the spleen contributes to high red blood cells counts.
The main strength of the study is the use of a mouse model exposed to HH in a hypobaric chamber. However, not all of the reported results are convincing due to some smaller effects which one may doubt to result in the overall increase in red blood cells as claimed by the authors. Moreover, direct proof for reduced erythrophagocytosis is compromised due to a strong spontaneous loss of labelled red blood cells, although effects of labelled E. coli phagocytosis are shown. Their discussion addresses some of the unexpected results, such as the reduced expression of HO-1 under hypoxia but due to the above-mentioned limitations much of the discussion remains hypothetical.
Thank you for your valuable feedback and insight. We appreciate the recognition of the strength of our study model, the exposure of mice to hypobaric hypoxia (HH) in a hypobaric animal chamber. We also understand your concerns about the smaller effects and their potential impact on the overall increase in red blood cells (RBCs), as well as the apparent reduced erythrophagocytosis due to the loss of labelled RBCs.
Erythropoiesis has been predominantly attributed to the amplified production of RBCs under conditions of HH. The focus of our research was to underscore the potential acceleration of hypoxia-associated polycythemia (HAPC) as a result of compromised erythrophagocytosis. Considering the spontaneous loss of labelled RBCs in vivo, we assessed the clearance rate of RBCs at the stages of 7 and 14 days within the HH environment, and subsequently compared this rate within the period from 7 to 14 days following the clear manifestation of erythrophagocytosis impairment at the two aforementioned points identified in our study. This approach was designed to negate the effects of spontaneous loss of labelled RBCs in both NN and HH conditions. Correspondingly, the results derived from blood and spleen analyses corroborated a decline in the RBC clearance rate under HH when juxtaposed with NN conditions.
Apart from the E. coli phagocytosis and the labeled RBCs experiment (this part of the results was removed in the revision), the injection of Tuftsin further substantiated the impairment of erythrophagocytosis in the HH spleen, as evidenced by the observed decrease in iron within the red pulp of the spleen post-perfusion. Furthermore, to validate our findings, we incorporated RBCs staining in splenic cells at 7 and 14 days of HH exposure, which provided concrete confirmation of impaired erythrophagocytosis (new Figure 4E).
Author response image 6.

As for the reduced expression of heme oxygenase-1 (HO-1) under hypoxia, we agree that this was an unexpected result, and we are in the process of further exploring the underlying mechanisms. It is possible that there are other regulatory pathways at play that are yet to be identified. However, we believe that by offering possible interpretations of our data and potential directions for future research, we contribute to the ongoing scientific discourse in this area.
Reviewer #3 (Public Review):
The manuscript by Yang et al. investigated in mice how hypobaric hypoxia can modify the RBC clearance function of the spleen, a concept that is of interest. Via interpretation of their data, the authors proposed a model that hypoxia causes an increase in cellular iron levels, possibly in RPMs, leading to ferroptosis, and downregulates their erythrophagocytic capacity. However, most of the data is generated on total splenocytes/total spleen, and the conclusions are not always supported by the presented data. The model of the authors could be questioned by the paper by Youssef et al. (which the authors cite, but in an unclear context) that the ferroptosis in RPMs could be mediated by augmented erythrophagocytosis. As such, the loss of RPMs in vivo which is indeed clear in the histological section shown (and is a strong and interesting finding) can be not directly caused by hypoxia, but by enhanced RBC clearance. Such a possibility should be taken into account.
Thank you for your insightful comments and constructive feedback. In their research, Youssef et al. (2018) discerned that elevated erythrophagocytosis of stressed red blood cells (RBCs) instigates ferroptosis in red pulp macrophages (RPMs) within the spleen, as evidenced in a mouse model of transfusion. This augmentation of erythrophagocytosis was conspicuous five hours post-injection of RBCs. Conversely, our study elucidated the decrease in erythrophagocytosis in the spleen after both 7 and 14 days.
Typically, macrophages exhibit an enhanced phagocytic capacity in the immediate aftermath of stress or stimulation. Nonetheless, the temporal points of observation in our study were considerably extended (7 and 14 days). It is currently unclear whether the phagocytic capacity is amplified during the acute phase of HH exposure, especially on the first day. Considering that the spleen contraction on the next day of HH leads to the release of stored RBCs into the bloodstream, and whether this initial reaction leads to ferroptosis, and the phagocytic capacity of RBCs is subsequently weakened after 7 or 14 days under sustained HH conditions.
Major points:
- The authors present data from total splenocytes and then relate the obtained data to RPMs, which are quantitatively a minor population in the spleen. Eg, labile iron is increased in the splenocytes upon HH, but the manuscript does not show that this occurs in the red pulp or RPMs. They also measure gene/protein expression changes in the total spleen and connect them to changes in macrophages, as indicated in the model Figure (Fig. 7). HO-1 and levels of Ferritin (L and H) can be attributed to the drop in RPMs in the spleen. Are any of these changes preserved cell-intrinsically in cultured macrophages? This should be shown to support the model (relates also to lines 487-88, where the authors again speculate that hypoxia decreases HO-1 which was not demonstrated). In the current stage, for example, we do not know if the labile iron increase in cultured cells and in the spleen in vivo upon hypoxia is the same phenomenon, and why labile iron is increased. To improve the manuscript, the authors should study specifically RPMs.
We express our gratitude for your perceptive remarks. In our initial manuscript, we did not evaluate labile iron within the red pulp and red pulp macrophages (RPMs). To address this oversight, we utilized the Lillie staining method, in accordance with the protocol outlined by Liu et al., (Chemosphere, 2021, 264(Pt 1):128413), to discern Fe2+ presence within these regions. The outcomes were consistent with our antecedent Western blot and flow cytometry findings in the spleen, corroborating an increment in labile iron specifically within the red pulp of the spleen.
Author response image 7.
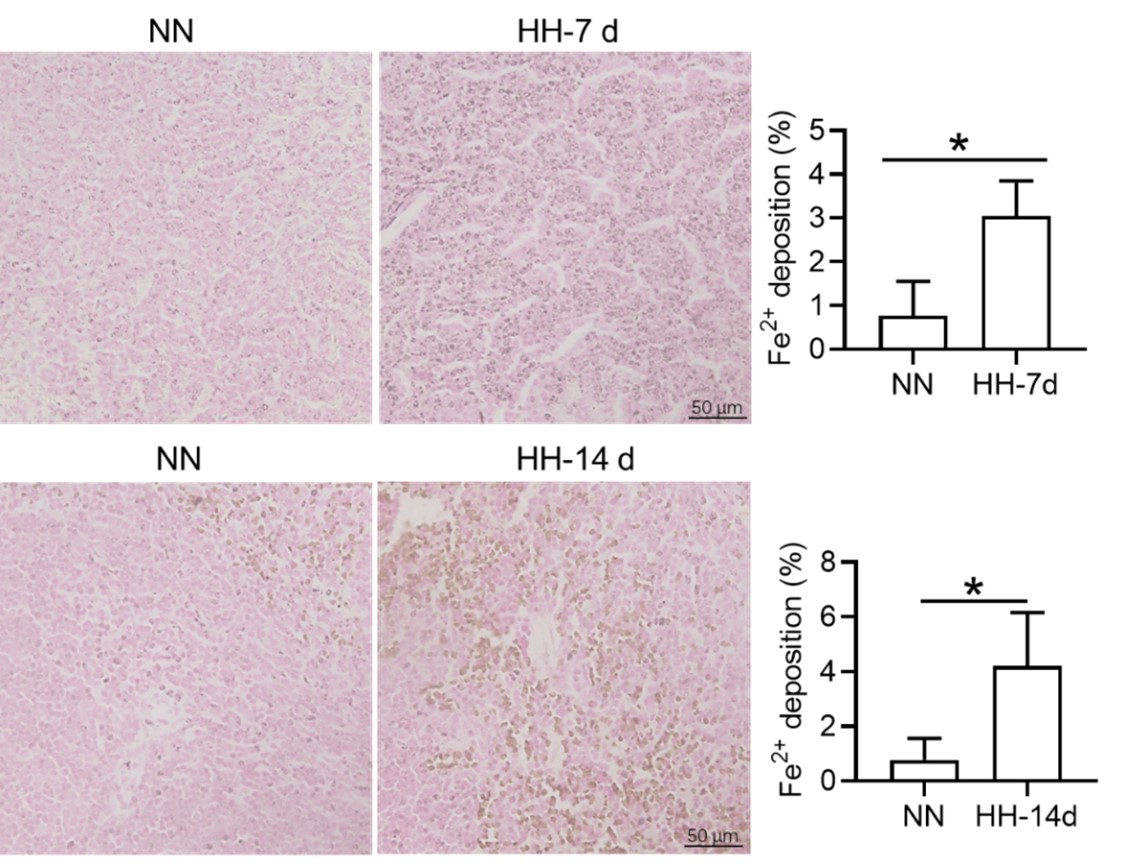
However, we acknowledge the necessity for other supplementary experimental efforts to further validate these findings. Additionally, we scrutinized the expression of heme oxygenase-1 (HO-1) and iron-related proteins, including transferrin receptor (TfR), ferroportin (Fpn), ferritin (Ft), and nuclear receptor coactivator 4 (NCOA4) in primary macrophages subjected to 1% hypoxic conditions, both with and without hemoglobin treatment. Our results indicated that the expression of ferroptosis-related proteins was consistent with in vivo studies, however the expression of iron related proteins was not similar in vitro and in vivo. It suggesting that the increase in labile iron in cultured cells and the spleen in vivo upon hypoxia are not identical phenomena. However, the precise mechanism remains elusive.
In our study, we observed a decrease in HO-1 protein expression following 7 and 14 days of HH exposure, as shown in Figure 3U, 5A, and S1A. This finding contradicts previous research that identified HO-1 as a hypoxia-inducible factor (HIF) target under hypoxic conditions (P J Lee et al., 1997). Our discussion, therefore, addressed the potential discrepancy in HO-1 expression under HH. According to our findings, HO-1 regulation under HH appears to be predominantly influenced by macrophage numbers and the RBCs to be processed in the spleen or macrophages, rather than by hypoxia alone.
It is challenging to discern whether the increased labile iron observed in vitro accurately reflects the in vivo phenomenon, as replicating the iron requirements for RBCs production induced by HH in vitro is inherently difficult. However, by integrating our in vivo and in vitro studies, we determined that the elevated Fe2+ levels were not dependent on HO-1 protein expression, as HO-1 levels was increased in vitro while decreasing in vivo under hypoxic/HH exposure.
Author response image 8.
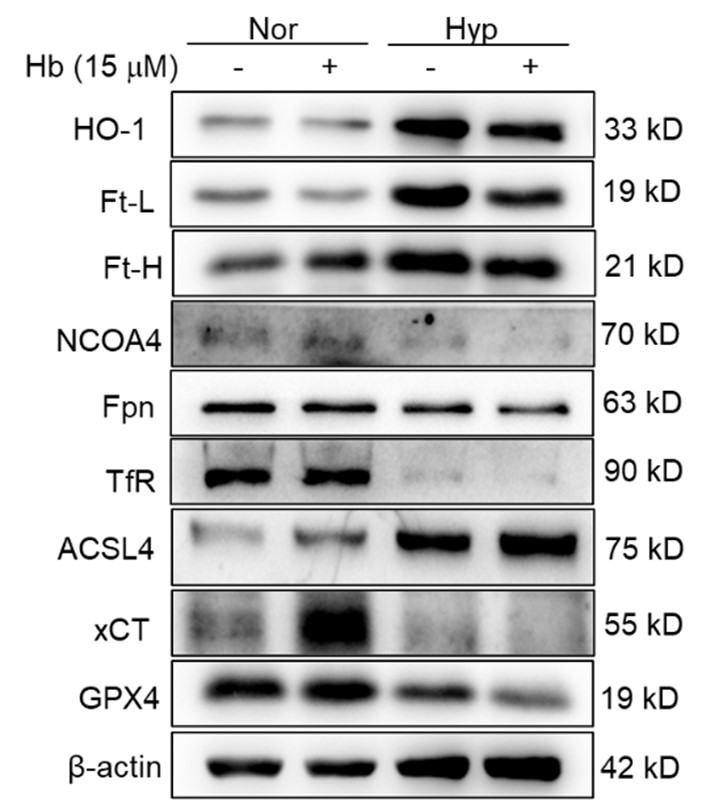
- The paper uses flow cytometry, but how this method was applied is suboptimal: there are no gating strategies, no indication if single events were determined, and how cell viability was assessed, which are the parent populations when % of cells is shown on the graphs. How RBCs in the spleen could be analyzed without dedicated cell surface markers? A drop in splenic RPMs is presented as the key finding of the manuscript but Fig. 3M shows gating (suboptimal) for monocytes, not RPMs. RPMs are typically F4/80-high, CD11-low (again no gating strategy is shown for RPMs). Also, the authors used single-cell RNAseq to detect a drop in splenic macrophages upon HH, but they do not indicate in Fig. A-C which cluster of cells relates to macrophages. Cell clusters are not identified in these panels, hence the data is not interpretable).
Thank you for your comments and constructive critique regarding our flow cytometry methodology and presentation. We understand the need for greater transparency and detailed explanation of our procedures, and we acknowledge that the lack of gating strategies and other pertinent information in our initial manuscript may have affected the clarity of our findings.
In our initial report, we provided an overview of the decline in migrated macrophages (F4/80hiCD11bhi), including both M1 and M2 expression in migrated macrophages, as illustrated in Figure 3, but did not specifically address the changes in red pulp macrophages (RPMs). Based on previous results, it is difficult to identify CD11b- and CD11blo cells. We will repeat the results and attempt to identify F4/80hiCD11blo cells in the revised manuscript. The results of the reanalysis are now included (Figure 3M). However, single-cell in vivo analysis studies may more accurately identify specific cell types that decrease after exposure to HH.
Author response image 9.

Furthermore, we substantiated the reduction in red pulp, as evidenced by Figure 4J, given that iron processing primarily occurs within the red pulp. In Figure 3, our initial objective was merely to illustrate the reduction in total macrophages in the spleen following HH exposure.
To further clarify the characterization of various cell types, we conducted a single-cell analysis. Our findings indicated that clusters 0,1,3,4,14,18, and 29 represented B cells, clusters 2, 10, 12, and 28 represented T cells, clusters 15 and 22 corresponded to NK cells, clusters 5, 11, 13, and 19 represented NKT cells, clusters 6, 9, and 24 represented cell cycle cells, clusters 26 and 17 represented plasma cells, clusters 21 and 23 represented neutrophils, cluster 30 represented erythrocytes, and clusters 7, 8, 16, 20, 24, and 27 represented dendritic cells (DCs) and macrophages, as depicted in Figure 3E.
- The authors draw conclusions that are not supported by the data, some examples: a) they cannot exclude eg the compensatory involvement of the liver in the RBCs clearance (the differences between HH sham and HH splenectomy is mild in Fig. 2 E, F and G).
Thank you for your insightful comments and for pointing out the potential involvement of other organs, such as the liver, in the RBC clearance under HH conditions. We concur with your observation that the differences between the HH sham and HH splenectomy conditions in Fig. 2 E, F, and G are modest. This could indeed suggest a compensatory role of other organs in RBC clearance when splenectomy is performed. Our intent, however, was to underscore the primary role of the spleen in this process under HH exposure.
In fact, after our initial investigations, we conducted a more extensive study examining the role of the liver in RBC clearance under HH conditions. Our findings, as illustrated in the figures submitted with this response, indeed support a compensatory role for the liver. Specifically, we observed an increase in macrophage numbers and phagocytic activity in the liver under HH conditions. Although the differences in RBC count between the HH sham and HH splenectomy conditions may seem minor, it is essential to consider the unit of this measurement, which is value*1012/ml. Even a small numerical difference can represent a significant biological variation at this scale.
Author response image 10.

b) splenomegaly is typically caused by increased extramedullary erythropoiesis, not RBC retention. Why do the authors support the second possibility? Related to this, why do the authors conclude that data in Fig. 4 G,H support the model of RBC retention? A significant drop in splenic RBCs (poorly gated) was observed at 7 days, between NN and HH groups, which could actually indicate increased RBC clearance capacity = less retention.
Prior investigations have predominantly suggested that spleen enlargement under hypoxic conditions stems from the spleen's extramedullary hematopoiesis. Nevertheless, an intriguing study conducted in 1994 by the General Hospital of Xizang Military Region reported substantial exaggeration and congestion of splenic sinuses in high altitude polycythemia (HAPC) patients. This finding was based on the dissection of spleens from 12 patients with HAPC (Zou Xunda, et al., Southwest Defense Medicine, 1994;5:294-296). Moreover, a recent study indicated that extramedullary erythropoiesis reaches its zenith between 3 to 7 days (Wang H et al., 2021).
Considering these findings, the present study postulates that hypoxia-induced inhibition of erythrophagocytosis may lead to RBC retention. However, we acknowledge that the manuscript in its current preprint form does not offer conclusive evidence to substantiate this hypothesis. To bridge this gap, we further conducted experiments where the spleen was perfused, and total cells were collected post HH exposure. These cells were then smeared onto slides and subjected to Wright staining. Our results unequivocally demonstrate an evident increase in deformation and retention of RBCs in the spleen following 7 and 14 days of HH exposure. This finding strengthens our initial hypothesis and contributes a novel perspective to the understanding of splenic responses under hypoxic conditions.
Author response image 11.

c) lines 452-54: there is no data for decreased phagocytosis in vivo, especially in the context of erythrophagocytosis. This should be done with stressed RBCs transfusion assays, very good examples, like from Youssef et al. or Threul et al. are available in the literature.
Thanks. In their seminal work, Youssef and colleagues demonstrated that the transfusion of stressed RBCs triggers erythrophagocytosis and subsequently incites ferroptosis in red pulp macrophages (RPMs) within a span of five hours. Given these observations, the applicability of this model to evaluate macrophage phagocytosis in the spleen or RPMs under HH conditions may be limited, as HH has already induced erythropoiesis in vivo. In addition, it was unclear whether the membrane characteristics of stress induced RBCs were similar to those of HH induced RBCs, as this is an important signal for in vivo phagocytosis. The ambiguity arises from the fact that we currently lack sufficient knowledge to discern whether the changes in phagocytosis are instigated by the presence of stressed RBCs or by changes of macrophages induced by HH in vivo. Nonetheless, we appreciate the potential value of this approach and intend to explore its utility in our future investigations. The prospect of distinguishing the effects of stressed RBCs from those of HH on macrophage phagocytosis is an intriguing line of inquiry that could yield significant insights into the mechanisms governing these physiological processes. We will investigate this issue in our further study.
d) Line 475 - ferritinophagy was not shown in response to hypoxia by the manuscript, especially that NCOA4 is decreased, at least in the total spleen.
Drawing on the research published in eLife in 2015, it was unequivocally established that ferritinophagy, facilitated by Nuclear Receptor Coactivator 4 (NCOA4), is indispensable for erythropoiesis. This process is modulated by iron-dependent HECT and RLD domain containing E3 ubiquitin protein ligase 2 (HERC2)-mediated proteolysis (Joseph D Mancias et al., eLife. 2015; 4: e10308). As is widely recognized, NCOA4 plays a critical role in directing ferritin (Ft) to the lysosome, where both NCOA4 and Ft undergo coordinated degradation. In our study, we provide evidence that exposure to HH stimulates erythropoiesis (Figure 1). We propose that this, in turn, could promote ferritinophagy via NCOA4, resulting in a decrease in NCOA4 protein levels post-HH exposure. We will further increase experiments to verify this concern. This finding not only aligns with the established understanding of ferritinophagy and erythropoiesis but also adds a novel dimension to the understanding of cellular responses to hypoxic conditions.
- In a few cases, the authors show only representative dot plots or histograms, without quantification for n>1. In Fig. 4B the authors write about a significant decrease (although with n=1 no statistics could be applied here; of note, it is not clear what kind of samples were analyzed here). Another example is Fig. 6I. In this case, it is even more important as the data are conflicting the cited article and the new one: PMCID: PMC9908853 which shows that hypoxia stimulates efferocytosis. Sometimes the manuscript claim that some changes are observed, although they are not visible in representative figures (eg for M1 and M2 macrophages in Fig. 3M)
We recognize that our initial portrayal of Figure 4B was lacking in precision, given that it did not include the corresponding statistical graph. While our results demonstrated a significant reduction in the ability to phagocytose E. coli, in line with the recommendations of other reviewers, we have opted to remove the results pertaining to E. coli phagocytosis in this revision, as they primarily reflected immune function.
In relation to PMC9908853, which reported metabolic adaptation facilitating enhanced macrophage efferocytosis in limited-oxygen environments, it is worth noting that the macrophages investigated in this study were derived from ER-Hoxb8 macrophage progenitors following the removal of β-estradiol. Consequently, questions arise regarding the comparability between these cultured macrophages and primary macrophages obtained fresh from the spleen post HH exposure. The characteristics and functions of these two different macrophage sources may not align precisely, and this distinction necessitates further investigation.
- There are several unclear issues in methodology:
- what is the purity of primary RPMs in the culture? RPMs are quantitatively poorly represented in splenocyte single-cell suspensions. This reviewer is quite skeptical that the processing of splenocytes from approx 1 mm3 of tissue was sufficient to establish primary RPM cultures. The authors should prove that the cultured cells were indeed RPMs, not monocyte-derived macrophages or other splenic macrophage subtypes.
Thank you for your thoughtful comments and inquiries. Firstly, I apologize if we did not make it clear in the original manuscript. The purity of the primary RPMs in our culture was found to be approximately 40%, as identified by F4/80hiCD11blo markers using flow cytometry. We recognize that RPMs are typically underrepresented in splenocyte single-cell suspensions, and the concern you raise about the potential for contamination by other cell types is valid.
We apologize for any ambiguities in the methodological description that may have led to misunderstandings during the review. Indeed, the entirety of the spleen is typically employed for splenic macrophage culture. The size of the spleen can vary dependent on the species and age of the animal, but in mice, it is commonly approximately 1 cm in length. The spleen is then dissected into minuscule fragments, each approximately 1 mm3 in volume, to aid in enzymatic digestion. This procedure does not merely utilize a single 1 mm3 tissue fragment for RPMs cultures. Although the isolation and culture of spleen macrophages can present considerable challenges, our method has been optimized to enhance the yield of this specific cell population.
- (around line 183) In the description of flow cytometry, there are several missing issues. In 1) it is unclear which type of samples were analyzed. In 2) it is not clear how splenocyte cell suspension was prepared.
Whole blood was extracted from the mice and collected into an anticoagulant tube, which was then set aside for subsequent thiazole orange (TO) staining.
Splenic tissue was procured from the mice and subsequently processed into a single-cell suspension using a 40 μm filter. The erythrocytes within the entire sample were subsequently lysed and eliminated, and the remaining cell suspension was resuspended in phosphate-buffered saline (PBS) in preparation for ensuing analyses.
We have meticulously revised these methodological details in the corresponding section of the manuscript to ensure clarity and precision.
- In line 192: what does it mean: 'This step can be omitted from cell samples'?
The methodology employed for the quantification of intracellular divalent iron content and lipid peroxidation level was executed as follows: Splenic tissue was first processed into a single cell suspension, subsequently followed by the lysis of RBCs. It should be noted that this particular stage is superfluous when dealing with isolated cell samples. Subsequently, a total of 1 × 10⁶ cells were incubated with 100 μL of BioTracker Far-red Labile Fe2+ Dye (1 mM, Sigma, SCT037, USA) for a duration of 1 hour, or alternatively, C11-Bodipy 581/591 (10 μM, Thermo Fisher, D3861, USA) for a span of 30 minutes. Post incubation, cells were thoroughly washed twice with PBS. Flow cytometric analysis was subsequently performed, utilizing the FL6 (638 nm/660 nm) channel for the determination of intracellular divalent iron content, and the FL1 (488 nm/525 nm) channel for the quantification of the lipid peroxidation level.
- 'TO method' is not commonly used anymore and hence it was unclear to this Reviewer. Reticulocytes should be analyzed with proper gating, using cell surface markers.
We are appreciative of your astute observation pertaining to the methodology we employed to analyze reticulocytes in our study. We value your recommendation to utilize cell surface markers for effective gating, which indeed represents a more modern and accurate approach. However, as reticulocyte identification is not the central focus of our investigation, we opted for the TO staining method—due to its simplicity and credibility of results. In our initial exploration, we adopted the TO staining method in accordance with the protocol outlined (Sci Rep, 2018, 8(1):12793), primarily owing to its established use and demonstrated efficacy in reticulocyte identification.
- The description of 'phagocytosis of E. coli and RBCs' in the Methods section is unclear and incomplete. The Results section suggests that for the biotinylated RBCs, phagocytosis? or retention? Of RBCs was quantified in vivo, upon transfusion. However, the Methods section suggests either in vitro/ex vivo approach. It is vague what was indeed performed and how in detail. If RBC transfusion was done, this should be properly described. Of note, biotinylation of RBCs is typically done in vivo only, being a first step in RBC lifespan assay. The such assay is missing in the manuscript. Also, it is not clear if the detection of biotinylated RBCs was performed in permeablized cells (this would be required).
Thanks for the comments. In our initial methodology, we employed Cy5.5-labeled Escherichia coli to probe phagocytic function, albeit with the understanding that this may not constitute the most ideal model for phagocytosis detection within this context (in light of recommendations from other reviewers, we have removed the E. coli phagocytosis results from this revision, as they predominantly mirror immune function). Our fundamental aim was to ascertain whether HH compromises the erythrophagocytic potential of splenic macrophages. In pursuit of this, we subsequently analyzed the clearance of biotinylated RBCs in both the bloodstream and spleen to assess phagocytic functionality in vivo.
In the present study, instead of transfusing biotinylated RBCs into mice, we opted to inject N-Hydroxysuccinimide (NHS)-biotin into the bloodstream. NHS-biotin is capable of binding with cell membranes in vivo and can be recognized by streptavidin-fluorescein isothiocyanate (FITC) after cells are extracted from the blood or spleen in vitro. Consequently, biotin-labeled RBCs were detectable in both the blood and spleen following NHS-biotin injection for a duration of 21 days. Ultimately, we employed flow cytometry to analyze the NHS-biotin labeled RBCs in the blood or spleen. This method facilitates the detection of live cells and is not applicable to permeabilized cells. We believe this approach better aligns with our investigative goals and offers a more robust evaluation of erythrophagocytic function under hypoxic conditions.
Recommendations for the authors: please note that you control which, if any, revisions, to undertake.
Thank you for your comments and recommendations. We appreciate your understanding that the choice of implementing revisions ultimately rests with us. However, we also value your expertise and will seriously consider your suggestions as they can provide additional perspectives to our work and contribute to the overall quality and robustness of our study.
We strive to produce research that meets the highest scientific standards and we believe that constructive criticism, such as yours, helps us to achieve this objective. We will carefully review your comments and consider the appropriate changes to make in order to address your concerns and improve our manuscript.
Reviewer #1 (Recommendations For The Authors):
Minor:
- HCV in text is a typo, should be HCT. Please edit.
Thanks for the correction. We’ve revised it.
- Fig 2D is not useful beyond the more accurate measure of HCT in Fig 2G and should be removed.
Thank you for your feedback and suggestion about Fig. 2D. We understand your point regarding the comparative accuracy of HCT in Fig. 2G. However, our intention in including Fig. 2D was to provide a more intuitive visual representation of the erythrocyte position levels, which we believe complements the more precise HCT data. We have observed that the erythrocyte positions significantly increased for 14 days after HH splenectomy, and this trend is visually depicted in Fig. 2D. While HCT provides a more accurate measure, Fig. 2D provides a snapshot that can be more immediately graspable, especially for readers who may prefer visual data. Nevertheless, we appreciate your perspective and will reassess whether the inclusion of Fig. 2D adds enough value to the overall understanding of our findings. If we find that it indeed does not contribute significantly, we will consider removing it in line with your suggestion.
- What is the purpose of performing splenectomy? It is well established that reticuloendothelial cells of the liver perform a redundant function to splenic macrophages and since these cells are not being evaluated, data following splenectomy is of limited value. Please remove or move to supplement. Alternatively, evaluate what happens in the liver in response to hypoxia. Is there an increase in erythroblasts? Is there a decrease in liver macrophages in the same way as in the spleen in non-splenectomized mice? The minimally increased HCT in hypoxic splenectomized mice (relative to non-splenectomized mice) suggests that the spleen does the primary work of clearance but not exclusively since there is still a major increase in response to hypoxia in splenectomized mice. The sentence (page 16, line 292) states that the spleen is essential which is not the case based on this data.
Thank you for your comments and recommendations. In reality, we have been consistently studying the liver's response to hypobaric hypoxia (HH) exposure. Nevertheless, the changes observed in the liver are contrary to those in the spleen, including an increase in macrophage count and the capacity for erythrophagocytosis, as well as processing heme iron (refer to the above figure for details).
It is widely accepted that HH exposure predominantly induces erythropoiesis by stimulating bone marrow production. The primary objective of this study was not to refute this central mechanism behind erythrocytosis. Instead, our intent was to supplement this understanding by proposing that impaired clearance of red blood cells (RBCs) could potentially exacerbate erythrocytosis. We believe this additional perspective could significantly enhance our understanding of the complex dynamics involved in RBC production and clearance under hypoxic conditions.
Reviewer #2 (Recommendations For The Authors):
The following questions and remarks should be considered by the authors:
1). The methods should clearly state whether the HH was discontinued during the 7- or 14-day exposure for cleaning, fresh water etc. Moreover, how was CO2 controlled? The procedure for splenectomy needs to be described in the methods.
Thank you for your insightful comments and questions. We apologize for any lack of clarity in our original description. To address your questions:
During the 7- or 14-day HH exposure, the HH was not discontinued for cleaning or providing fresh water. We ensured that the cage was thoroughly cleaned, and food and water were sufficiently stocked before placing the mice into the HH chamber. The design of the cage and the HH chamber allowed the mice to have continuous access to food and water during the entire exposure period.
Regarding the control of CO2, the HH chamber was equipped with a CO2 scrubbing system. The system utilized soda lime to absorb excess CO2 produced by the mice, and the air inside the chamber was exchanged with the air outside 25 times per hour to maintain a stable atmospheric concentration and ensure adequate oxygen supply.
As for the procedure for splenectomy, we apologize for the omission in the original manuscript. The mice were anesthetized using isoflurane, and a small incision was made in the left flank to expose the spleen. The spleen was then gently exteriorized, ligated, and excised. The incision was sutured, and the mice were allowed to recover under close monitoring. We ensured that all procedures were performed in accordance with our institution's guidelines for animal care.
- The lack of changes in MCH needs explanation? During stress erythropoiesis some limit in iron availability should cause MCH decrease particularly if the authors claim that macrophages for rapid iron recycling are decreased. Fig 1A is dispensable. Fig 1G NN control 14 days does not make sense since it is higher than 7 days of HH.
Thank you for your insightful comments and queries. Regarding the lack of changes in Mean Corpuscular Hemoglobin (MCH), our hypothesis is that the decrease in iron recycling in the spleen following HH is potentially compensated by the increased iron absorption or supply from the liver, thus maintaining the iron requirement for erythropoiesis. This may explain why MCH levels did not significantly change after HH exposure. We have indeed observed an increase in macrophage numbers and their erythrophagocytosis/heme iron processing ability after HH exposure for 7 or 14 days in liver (please refer to the above figure for details), suggesting a compensatory mechanism to ensure adequate iron for erythropoiesis.
Regarding your comment on Fig 1A, we included this figure to provide a baseline of the experimental condition before any treatment. However, we understand your point and will consider removing it if it does not contribute significantly to the interpretation of our results. As for Fig 1G, we agree that the control at 14 days being higher than 7 days of HH may seem counterintuitive. We believe this could be due to individual variations among the mice or potential experimental errors. However, considering recommendations from other reviewers, we have removed this result from the revised manuscript.
- Fig 2, the difference between sham and splenectomy is really marginal and not convincing. Is there also a difference at 7 days? Why does the spleen size decrease between 7 and 14 days?
We understand your concerns regarding the observed differences in Fig. 2 between sham and splenectomy groups. We acknowledge that while the absolute numerical differences may appear marginal, it is important to consider the unit of measurement. In the case of RBC count, the unit is 1012/L, hence even slight numerical differences can translate to significant variations in the actual count of RBCs.
We did not examine alterations occurring 7 days post-splenectomy in our study. The discernible trend of spleen size diminution between the 7th and 14th days is indeed compelling. It is plausible that this might be attributable to the body's adaptive response to hypobaric hypoxia (HH) exposure, wherein spleen size initially enlarges (at day 7) in response to compensatory erythropoiesis, followed by a reduction (at day 14) as the body acclimatizes to the HH conditions. Nevertheless, we did not identify a statistically significant difference between the measurements at day 7 and day 14, suggesting that this observation warrants further scrutiny.
- Fig 3B, the clusters should be explained in detail. If the decrease in macrophages in Fig 3K/L is responsible for the effect, why does splenectomy not have a much stronger effect? How do the authors know which cells died in the calcein stained population in Fig 3D?
Thank you for your insightful queries and comments. Regarding Fig. 3B, we apologize for not providing sufficient detail on the clusters in the original manuscript. We will ensure that we include a comprehensive explanation of the clusters, including the specific cell types and their respective markers, in our revision. (clusters 0,1,3,4,14,18, and 29 represented B cells, clusters 2, 10, 12, and 28 represented T cells, clusters 15 and 22 corresponded to NK cells, clusters 5, 11, 13, and 19 represented NKT cells, clusters 6, 9, and 24 represented cell cycle cells, clusters 26 and 17 represented plasma cells, clusters 21 and 23 represented neutrophils, cluster 30 represented erythrocytes, and clusters 7, 8, 16, 20, 24, and 27 represented dendritic cells (DCs) and macrophages).
As for the decrease in macrophages observed in Fig. 3K/L, it's important to note that the spleen is a complex organ comprising numerous cell types, all of which can contribute to its overall function. While macrophages play a crucial role in iron recycling and erythropoiesis, other cell types and factors may also influence these processes. Therefore, while splenectomy results in the removal of all splenic cells, the overall impact on these processes may not be as pronounced as the specific reduction in macrophages due to compensatory mechanisms from other tissues and cells.
Concerning Fig. 3D, we acknowledge the ambiguity in the initial interpretation. The calcein staining was utilized to determine cell viability, but it doesn't identify the specific cell types that have died. To address this, we performed a single-cell analysis, which can provide a more accurate identification of the specific cell types affected.
- Is the reduced phagocytic capacity in Fig4B significant? Erythrophagocytosis is compromised due to the considerable spontaneous loss of labelled erythrocytes; could other assays help? (potentially by a modified Chromium release assay?). Is it necessary to stimulated phagocytosis to see a significant effect?
We express our gratitude for your insightful queries and recommendations. In response to your initial question, the observed reduction in phagocytic capacity illustrated in Fig. 4B was indeed statistically significant. However, in alignment with feedback from other reviewers, we have elected to exclude the phagocytic results from this revised manuscript, as they predominantly reflect immune function rather than erythrophagocytosis of macrophages.
With respect to your proposal of potential alternatives to the erythrophagocytosis assay, we concur that the spontaneous loss of labeled erythrocytes could have influenced our results. Your suggestion of implementing a modified Chromium release assay is indeed an intriguing possibility that warrants further exploration.
Regarding the requirement for stimulating phagocytosis, we employed stimulation as a mechanism to investigate the potential for augmenting erythrophagocytosis and iron processing within the red pulp. Our findings suggest that increased phagocytosis in the spleen contributes positively to these processes. As part of the Tuftsin injection experiment, we assessed the RBC count and hemoglobin content. Despite an observed reduction trend, there were no statistically significant alterations. We are uncertain if the observation period was insufficiently long. Nevertheless, we concur that it would be worthwhile to explore inherent changes without external stimulation, and we will take this into consideration in our future research.
- Can the observed ferroptosis be influenced by bi- and not trivalent iron chelators?
Thank you for your insightful question. Indeed, the role of iron chelators in the observed ferroptosis is an important aspect to explore. Ferroptosis is a form of regulated cell death characterized by an iron-dependent accumulation of lipid peroxides, and the role of different iron chelators could potentially influence this process.
In the case of bi- versus trivalent iron chelators, their influence on ferroptosis could be distinct due to their specificities for different forms of iron. However, we have not yet investigated this in our current study.
Your suggestion has highlighted a valuable direction for our future research. We agree that examining the influence of bi- and trivalent iron chelators on the observed ferroptosis would provide a deeper understanding of the iron-dependent mechanisms involved in this process. We will consider this important aspect in our subsequent investigations.
Reviewer #3 (Recommendations For The Authors):
Methodology:
- Several syntax and grammatical errors, and unclear phrasing. Some factual errors as well: eg, line 380-81 the authors wrote that hypoxia increased viable cell numbers and phagocytosis ability, although their data suggest the opposite. Lines in Discussion 454-55 and in the Results 346-47 convey opposite messages.
We appreciate your attention to detail and your feedback on the language and factual discrepancies within the manuscript.
Upon revisiting lines 380-381, we would like to clarify that we had made a mistake. Our data indeed suggest that hypoxia led to a reduction in viable cell numbers and phagocytosis ability, not an increase as originally stated. We sincerely apologize for the confusion and will correct this statement in our revised manuscript.
As for the opposing messages between lines 454-455 in the Discussion and 346-347 in the Results, we apologize for any confusion caused. We understand that it is crucial to maintain consistent interpretation of our data throughout the manuscript. We will carefully reevaluate these sections and adjust our phrasing to ensure that our interpretations accurately reflect our results.
- It is not clear why the authors investigated CD47 expression.
Thank you for your question regarding our investigation of CD47 expression. CD47, also known as integrin-associated protein, is ubiquitously expressed on many cell types, including red blood cells (RBCs). In the context of our study, we used CD47 expression as an indicator of young RBCs, as CD47 is known to be highly expressed on newly produced RBCs. Our intention was to use CD47 positive cells as a proxy for new RBC production, which would give us insights into erythropoiesis under hypobaric hypoxia conditions. This marker thus provides valuable information about the rate and effectiveness of erythropoietic response to hypoxic stress. However, according to others reviewers’ suggestion, we removed this part of results in the revised manuscript.
Minor:
- Y axis is often labeled without sufficient detail.
- The legends do not specify the exact statistical tests.
- Some in vivo exp contain n=3 which is relatively low for mouse-based studies.
Some suggestions for the text:
Line 60: is the main cause of erythrocytosis which in turn alleviates..
62-66 - argumentation is not clear/grammatically correct and should be rephrased (eg, „RBC homeostasis is disturbed and never formed into a homeostasis status" - „homeostasis.. is never formed into a homeostasis status" sounds incorrect.
Ref # 8 - does not fit, I assume this was a mistake and the authors aimed to cite a Review article by Slusarczyk and Mleczko-Sanecka in Genes. However, this reference seems appropriate to be discussed in the Discussion section as it is very directly connected to the content of the present manuscript
76-78 - unclear/incomplete sentence (binding of iron to Tf and Tf-Fe delivery to the erythroid compartment is missing in this sentence, please, rephrase)
80 - iron is not stored ON FtL
90 - should be written: important role in iron recycling from RBCs
94 - phrasing 'damage of erythrophagocytosis' is incorrect
96-97 - should be written, for example: 'followed by eryptosis and iron recycling defects in the spleen'
282 - the sentence is grammatically incorrect and unclear.
292-94 - the statement is completely unclear, what can 'inhibit the excessive proliferation of RBCs'? What does it mean?
Reference to tuftsin was not provided (Am J Gastroenterol, 1999;94:391-397; PLoS One. 2012;7(4):e34933)
How quantification of microscopy images for F4/80 signal was performed?
In Figure 5, more explanation is required for the readers regarding the measured genes/proteins - why the patter of gene expression changes suggest ferroptosis?
Writing that ferroptosis INHIBITS phagocytosis is incorrect
Line 460 is unclear
468 - erythrocytophagy is not a commonly used term/
We are grateful for your keen eye and the time you have taken to provide such thorough feedback. It will undoubtedly help us to significantly enhance the clarity and completeness of our research. We have modified the corresponding sections in our manuscript to include these details. The comments have helped us ensure that our methodology is transparent and our findings are presented clearly. We have taken all your comments into consideration in our revision. we also have revised our manuscript to discuss these alternative interpretations more clearly and to acknowledge the potential limitations of our data.
-
eLife assessment
The authors set out to study the development of high altitude polycythemia, which affects mice in a hypoxia chamber and humans staying at a hypoxic atmosphere at high altitude. The findings are useful both for initiating the discussion of the hypothesis that splenic red pulp macrophages, central to red cell survival, are impacted by hypoxia, and for providing some data that partially supports this hypothesis. However, the current data are inadequate to fully support the authors' conclusions that RPM are inefficient during hypoxia, reducing erythrophagocytosis, and new data provides evidence of the opposite conclusion, given that RBC lifespan is decreased (rather than increased) in response to hypoxia, suggesting that RPM are more efficient at erythrophagocytosis.
-
Reviewer #1 (Public Review):
Wang and all present an interesting body of work focused on the effects of high altitude and hypoxia on erythropoiesis, resulting in erythrocytosis. This work is specifically focused on the spleen, targeting splenic macrophages as central cells in this effect. This is logical since these cells are involved in erythrophagocytosis and iron recycling. The results suggest that hypoxia induces splenomegaly with decreased number of splenic macrophages. There is also evidence that ferroptosis is induced in these macrophages, leading to cell destruction. However, additional data demonstrates that RBC clearance is increased, aka shortening the RBC lifespan, calling into question whether splenic function is impaired in hypoxia or whether the spleen enlargement is compensatory, leading to increased erythropoiesis; …
Reviewer #1 (Public Review):
Wang and all present an interesting body of work focused on the effects of high altitude and hypoxia on erythropoiesis, resulting in erythrocytosis. This work is specifically focused on the spleen, targeting splenic macrophages as central cells in this effect. This is logical since these cells are involved in erythrophagocytosis and iron recycling. The results suggest that hypoxia induces splenomegaly with decreased number of splenic macrophages. There is also evidence that ferroptosis is induced in these macrophages, leading to cell destruction. However, additional data demonstrates that RBC clearance is increased, aka shortening the RBC lifespan, calling into question whether splenic function is impaired in hypoxia or whether the spleen enlargement is compensatory, leading to increased erythropoiesis; similarly, increased iron in the spleen provides potential evidence of enhanced erythrophagocytosis with iron release. Many of the reviewers' prior comments are not addressed or only superficially addressed and the additional experimental results and text to the background and discussion sections in the revised manuscript does not increase enthusiasm or clarity. Taken together, there are many issues with the presented results, with somewhat superficial data, with overstated conclusions, decreasing confidence that the hypotheses and observed results are directly causally related to hypoxia in the way that the authors propose.
-
Reviewer #2 (Public Review):
The authors aimed at elucidating the development of high altitude polycythemia which affects mice and men staying in a hypoxic atmosphere at high altitude (hypobaric hypoxia; HH). HH causes increased erythropoietin production which stimulates the production of red blood cells. The authors hypothesize that increased production is only partially responsible for exaggerated red blood cell production, i.e. polycythemia, but that decreased erythrophagocytosis in the spleen contributes to high red blood cells counts.
The main strength of the study is the use of a mouse model exposed to HH in a hypobaric chamber. However, not all of the reported results are convincing due to some smaller effects which one may doubt to result in the overall increase in red blood cells as claimed by the authors. Moreover, direct …
Reviewer #2 (Public Review):
The authors aimed at elucidating the development of high altitude polycythemia which affects mice and men staying in a hypoxic atmosphere at high altitude (hypobaric hypoxia; HH). HH causes increased erythropoietin production which stimulates the production of red blood cells. The authors hypothesize that increased production is only partially responsible for exaggerated red blood cell production, i.e. polycythemia, but that decreased erythrophagocytosis in the spleen contributes to high red blood cells counts.
The main strength of the study is the use of a mouse model exposed to HH in a hypobaric chamber. However, not all of the reported results are convincing due to some smaller effects which one may doubt to result in the overall increase in red blood cells as claimed by the authors. Moreover, direct proof for reduced erythrophagocytosis is compromised due to a strong spontaneous loss of labelled red blood cells, although effects of labelled E. coli phagocytosis are shown.
Their discussion addresses some of the unexpected results, such as the reduced expression of HO-1 under hypoxia but due to the above mentioned limitations much of the discussion remains hypothetical.
In response to the reviewers´comments the authors extensively tried to address the points that were raised. They provided additional data, removed figures from the initial manuscript and referred to ongoing or further work. Nevertheless, not all questions could be answered leaving some hand-waiving and hypothetical explanations for some unexpected results.
-
Reviewer #3 (Public Review):
The manuscript by Yang et al. investigated in mice how hypobaric hypoxia can modify the RBC clearance function of the spleen, a concept that is of interest. Via interpretation of their data, the authors proposed a model that hypoxia causes an increase in cellular iron levels, possibly in RPMs, leading to ferroptosis, and downregulates their erythrophagocytic capacity. However, most of the data is generated on total splenocytes/total spleen, and the conclusions are not always supported by the presented data. The model of the authors could be questioned by the paper by Youssef et al. (which the authors cite, but in an unclear context) that the ferroptosis in RPMs could be mediated by augmented erythrophagocytosis. As such, the loss of RPMs in vivo which is indeed clear in the histological section shown (and is …
Reviewer #3 (Public Review):
The manuscript by Yang et al. investigated in mice how hypobaric hypoxia can modify the RBC clearance function of the spleen, a concept that is of interest. Via interpretation of their data, the authors proposed a model that hypoxia causes an increase in cellular iron levels, possibly in RPMs, leading to ferroptosis, and downregulates their erythrophagocytic capacity. However, most of the data is generated on total splenocytes/total spleen, and the conclusions are not always supported by the presented data. The model of the authors could be questioned by the paper by Youssef et al. (which the authors cite, but in an unclear context) that the ferroptosis in RPMs could be mediated by augmented erythrophagocytosis. As such, the loss of RPMs in vivo which is indeed clear in the histological section shown (and is a strong and interesting finding) can be not directly caused by hypoxia, but by enhanced RBC clearance. Such a possibility should be taken into account.
Major points:
The authors present data from total splenocytes and then relate the obtained data to RPMs, which are quantitatively a minor population in the spleen. Eg, labile iron is increased in the splenocytes upon HH, but the manuscript does not show that this occurs in the red pulp or RPMs. They also measure gene/protein expression changes in the total spleen and connect them to changes in macrophages, as indicated in the model Figure (Fig. 7). HO-1 and levels of Ferritin (L and H) can be attributed to the drop in RPMs in the spleen. Are any of these changes preserved cell-intrinsically in cultured macrophages? This should be shown to support the model (relates also to lines 487-88, where the authors again speculate that hypoxia decreases HO-1 which was not demonstrated). In the current stage, for example, we do not know if the labile iron increase in cultured cells and in the spleen in vivo upon hypoxia is the same phenomenon, and why labile iron is increased. To improve the manuscript, the authors should study specifically RPMs.
The paper uses flow cytometry, but how this method was applied is suboptimal: there are no gating strategies, no indication if single events were determined, and how cell viability was assessed, which are the parent populations when % of cells is shown on the graphs. How RBCs in the spleen could be analyzed without dedicated cell surface markers? A drop in splenic RPMs is presented as the key finding of the manuscript but Fig. 3M shows gating (suboptimal) for monocytes, not RPMs. RPMs are typically F4/80-high, CD11-low (again no gating strategy is shown for RPMs). Also, the authors used single-cell RNAseq to detect a drop in splenic macrophages upon HH, but they do not indicate in Fig. A-C which cluster of cells relates to macrophages. Cell clusters are not identified in these panels, hence the data is not interpretable).
The authors draw conclusions that are not supported by the data, some examples:
a) They cannot exclude eg the compensatory involvement of the liver in the RBCs clearance (the differences between HH sham and HH splenectomy is mild in Fig. 2 E, F and G)
b) Splenomegaly is typically caused by increased extramedullary erythropoiesis, not RBC retention. Why do the authors support the second possibility? Related to this, why do the authors conclude that data in Fig. 4 G,H support the model of RBC retention? A significant drop in splenic RBCs (poorly gated) was observed at 7 days, between NN and HH groups, which could actually indicate increased RBC clearance capacity = less retention.
c) Lines 452-54: there is no data for decreased phagocytosis in vivo, especially in the context of erythrophagocytosis. This should be done with stressed RBCs transfusion assays, very good examples, like from Youssef et al. or Threul et al. are available in the literature.
d) Line 475 - ferritinophagy was not shown in response to hypoxia by the manuscript, especially that NCOA4 is decreased, at least in the total spleen.
In a few cases, the authors show only representative dot plots or histograms, without quantification for n>1. In Fig. 4B the authors write about a significant decrease (although with n=1 no statistics could be applied here; of note, it is not clear what kind of samples were analyzed here). Another example is Fig. 6I. In this case, it is even more important as the data are conflicting the cited article and the new one: PMCID: PMC9908853 which shows that hypoxia stimulates efferocytosis. Sometimes the manuscript claim that some changes are observed, although they are not visible in representative figures (eg for M1 and M2 macrophages in Fig. 3M)
There are several unclear issues in methodology:
- what is the purity of primary RPMs in the culture? RPMs are quantitatively poorly represented in splenocyte single-cell suspensions. This reviewer is quite skeptical that the processing of splenocytes from approx 1 mm3 of tissue was sufficient to establish primary RPM cultures. The authors should prove that the cultured cells were indeed RPMs, not monocyte-derived macrophages or other splenic macrophage subtypes.
- (around line 183) In the description of flow cytometry, there are several missing issues. In 1) it is unclear which type of samples were analyzed. In 2) it is not clear how splenocyte cell suspension was prepared.
- In line 192: what does it mean: 'This step can be omitted from cell samples'?
- 'TO method' is not commonly used anymore and hence it was unclear to this Reviewer. Reticulocytes should be analyzed with proper gating, using cell surface markers.
- The description of 'phagocytosis of E. coli and RBCs' in the Methods section is unclear and incomplete. The Results section suggests that for the biotinylated RBCs, phagocytosis? or retention? Of RBCs was quantified in vivo, upon transfusion. However, the Methods section suggests either in vitro/ex vivo approach. It is vague what was indeed performed and how in detail. If RBC transfusion was done, this should be properly described. Of note, biotinylation of RBCs is typically done in vivo only, being a first step in RBC lifespan assay. The such assay is missing in the manuscript. Also, it is not clear if the detection of biotinylated RBCs was performed in permeablized cells (this would be required).The authors did not substantially improve the quality of their manuscript in the revised version, at least in the case of the limitations which I have spotted. The major points which remain unclear:
1. No gating strategies for flow cytometry are provided.
2. Figure 3M still does not show a typical F4/80 vs CD11b gating, with a population of true RPMs gated.
3. In a few cases data still lack biological replicates+statistics.
4. Results from scRNA-seq are not presented more clearly (=clusters in Fig 3E are described as macrophages, but it is not explained which among the clusters are RPMs).
5. The compensatory role of liver macrophages is omitted.
6. The authors misunderstood by suggestion to perform in vivo erythrophagocytosis assay using stained RBCs. This assay quantifies the true capacity for erythrophagocytosis in RPMs or KCs in the organ, regardless of the ferroptosis that may be a subsequent consequence (please, see initial Figures in Yousseff et al. paper). Using the percentage of biotin-positive RBCs in the spleen (although this method is not well described in the Methods), the authors rather show increased RBCs clearance at 7 days following hypoxia. Hence, the model where first hypoxia increases erythrophagocytosis in RPMs, consequently leading to their ferroptosis still cannot be excluded.
7. The Methods are poorly described and unclear - the authors claimed that they have used in vivo biotinylation assay to assess the lifespan of RBCs but it is not described. Instead, the paragraph „Phagocytosis of E. coli and RBCs" suggests that RBCs were stained with biotin for phagocytic assay in culture with macrophages. Phagocytosis of E. coli is still described in the Methods although the authors opted to remove the data from the revised manuscript.
Some points are unclear in the current version of the manuscript, after the addition of new data:
8. Data in Figure 4D versus 4E,F are not consistent, showing less retention versus increased retention of RBCs in the spleen (retention of senescent RBCs in the spleen should be measured anyway quantitatively, eg, with proper flow cytometry)
9. The increase of labile iron in the red pulp might not be in RPMs - especially since they seem depleted. Flow cytometry should be used to assess which cell types show increased iron levels. -
-
Author Response
Reviewer #1 (Public Review):
Wang and all present an interesting body of work focused on the effects of high altitude and hypoxia on erythropoiesis, resulting in erythrocytosis. This work is specifically focused on the spleen, identifying splenic macrophages as central cells in this effect. This is logical since these cells are involved in erythrophagocytosis and iron recycling. The results suggest that hypoxia induces splenomegaly with decreased number of splenic macrophages. There is also evidence that ferroptosis is induced in these macrophages, leading to cell destruction. Finally, the data suggest that ferroptosis in splenic red pulp macrophages causes the decrease in RBC clearance, resulting in erythrocytosis aka lengthening the RBC lifespan. However, there are many issues with the presented results, with …
Author Response
Reviewer #1 (Public Review):
Wang and all present an interesting body of work focused on the effects of high altitude and hypoxia on erythropoiesis, resulting in erythrocytosis. This work is specifically focused on the spleen, identifying splenic macrophages as central cells in this effect. This is logical since these cells are involved in erythrophagocytosis and iron recycling. The results suggest that hypoxia induces splenomegaly with decreased number of splenic macrophages. There is also evidence that ferroptosis is induced in these macrophages, leading to cell destruction. Finally, the data suggest that ferroptosis in splenic red pulp macrophages causes the decrease in RBC clearance, resulting in erythrocytosis aka lengthening the RBC lifespan. However, there are many issues with the presented results, with somewhat superficial data, meaning the conclusions are overstated and there is decreased confidence that the hypotheses and observed results are directly causally related to hypoxia.
Major points:
- The spleen is a relatively poorly understood organ but what is known about its role in erythropoiesis especially in mice is that it functions both to clear as well as to generate RBCs. The later process is termed extramedullary hematopoiesis and can occur in other bones beyond the pelvis, liver, and spleen. In mice, the spleen is the main organ of extramedullary erythropoiesis. The finding of transiently decreased spleen size prior to splenomegaly under hypoxic conditions is interesting but not well developed in the manuscript. This is a shortcoming as this is an opportunity to evaluate the immediate effect of hypoxia separately from its more chronic effect. Based just on spleen size, no conclusions can be drawn about what happens in the spleen in response to hypoxia.
Thank you for your insightful comments and questions. The spleen is instrumental in both immune response and the clearance of erythrocytes, as well as serving as a significant reservoir of blood in the body. This organ, characterized by its high perfusion rate and pliability, constricts under conditions of intense stress, such as during peak physical exertion, the diving reflex, or protracted periods of apnea. This contraction can trigger an immediate release of red blood cells (RBCs) into the bloodstream in instances of substantial blood loss or significant reduction of RBCs. Moreover, elevated oxygen consumption rates in certain animal species can be partially attributed to splenic contractions, which augment hematocrit levels and the overall volume of circulating blood, thereby enhancing venous return and oxygen delivery (Dane et al. J Appl Physiol, 2006, 101:289-97; Longhurst et al. Am J Physiol, 1986, 251: H502-9). In our investigation, we noted a significant contraction of the spleen following exposure to hypoxia for a period of one day. We hypothesized that the body, under such conditions, is incapable of generating sufficient RBCs promptly enough to facilitate enhanced oxygen delivery. Consequently, the spleen reacts by releasing its stored RBCs through splenic constriction, leading to a measurable reduction in spleen size.
However, we agree with you that further investigation is required to fully understand the implications of these changes. Considering the comments, we propose to extend our research by incorporating more detailed examinations of spleen morphology and function during hypoxia, including the potential impact on extramedullary hematopoiesis. We anticipate that such an expanded analysis would not only help elucidate the initial response to hypoxia but also provide insights into the more chronic effects of this condition on spleen function and erythropoiesis.
- Monocyte repopulation of tissue resident macrophages is a minor component of the process being described and it is surprising that monocytes in the bone marrow and spleen are also decreased. Can the authors conjecture why this is happening? Typically, the expectation would be that a decrease in tissue resident macrophages would be accompanied by an increase in monocyte migration into the organ in a compensatory manner.
We appreciate your insightful query regarding the observed decrease in monocytes in the bone marrow and spleen, particularly considering the typical compensatory increase in monocyte migration into organs following a decrease in tissue resident macrophages.
The observed decrease in monocytes within the bone marrow is likely attributable to the fact that monocytes and precursor cells for red blood cells (RBCs) both originate from the same hematopoietic stem cells within the bone marrow. It is well established that exposure to hypobaric hypoxia (HH) induces erythroid differentiation specifically within the bone marrow, originating from these hematopoietic stem cells. As such, we postulate that the differentiation into monocytes is reduced under hypoxic conditions, which may subsequently cause a decrease in migration to the spleen.
Furthermore, we hypothesize that an increased migration of monocytes to other tissues under HH exposure may also contribute to the decreased migration to the spleen. The liver, which partially contributes to the clearance of RBCs, may play a role in this process. Our investigations to date have indeed identified an increased monocyte migration to the liver. We were pleased to discover an elevation in CSF1 expression in the liver following HH exposure for both 7 and 14 days. This finding was corroborated through flow cytometry, which confirmed an increase in monocyte migration to the liver.
Consequently, we propose that under HH conditions, the liver requires an increased influx of monocytes, which in turn leads to a decrease in monocyte migration to the spleen. However, it is important to note that these findings will be discussed more comprehensively in our forthcoming publication, and as such, the data pertaining to these results have not been included in the current manuscript.

- Figure 3 does not definitively provide evidence that cell death is specifically occurring in splenic macrophages and the fraction of Cd11b+ cells is not changed in NN vs HH. Furthermore, the IHC of F4/80 in Fig 3U is not definitive as cells can express F4/80 more or less brightly and no negative/positive controls are shown for this panel.
We appreciate your insightful comments and critiques regarding Figure 3. We acknowledge that the figure, as presented, does not definitively demonstrate that cell death is specifically occurring in splenic macrophages. While it is challenging to definitively determine the occurrence of cell death in macrophages based solely on Figure 3D-F, our single-cell analysis provides strong evidence that such an event occurs. We initially observed cell death within the spleen under hypobaric hypoxia (HH) conditions, and to discern the precise cell type involved, we conducted single-cell analyses. Regrettably, we did not articulate this clearly in our preliminary manuscript. In the revised version, we have modified the sequence of Figure 3A-C and Figure 3D-F for better clarity. Besides, we observed a significant decrease in the fraction of F4/80hiCD11bhi macrophages under HH conditions compared to NN. To make the changes more evident in CD86 and CD206, we have transformed these scatter plots into histograms in our revised manuscript.
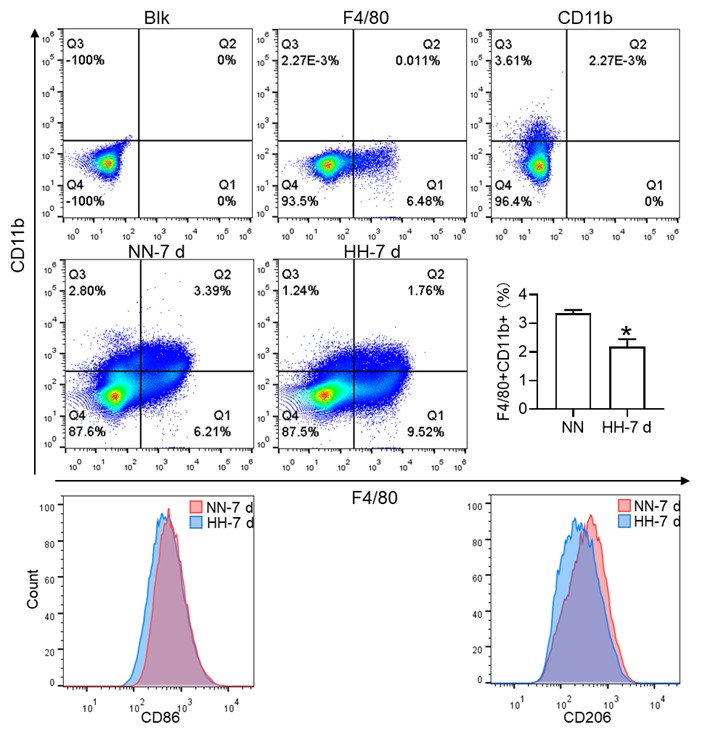
Considering the limitations of F4/80 as a conclusive macrophage identifier, we have concurrently presented the immunohistochemical (IHC) analyses of heme oxygenase-1 (HO-1). Functioning as a macrophage marker, particularly in cells involved in iron metabolism, HO-1 offers additional diagnostic accuracy. Observations from both F4/80 and HO-1 staining suggested a primary localization of positively stained cells within the splenic red pulp. Following exposure to hypoxia-hyperoxia (HH) conditions, a decrease was noted in the expression of both F4/80 and HO-1. This decrease implies that HH conditions contribute to a reduction in macrophage population and impede the iron metabolism process. In the revised version of our manuscript, we have enhanced the clarity of Figure 3U to illustrate the presence of positive staining, with an emphasis on HO-1 staining, which is predominantly observed in the red pulp.
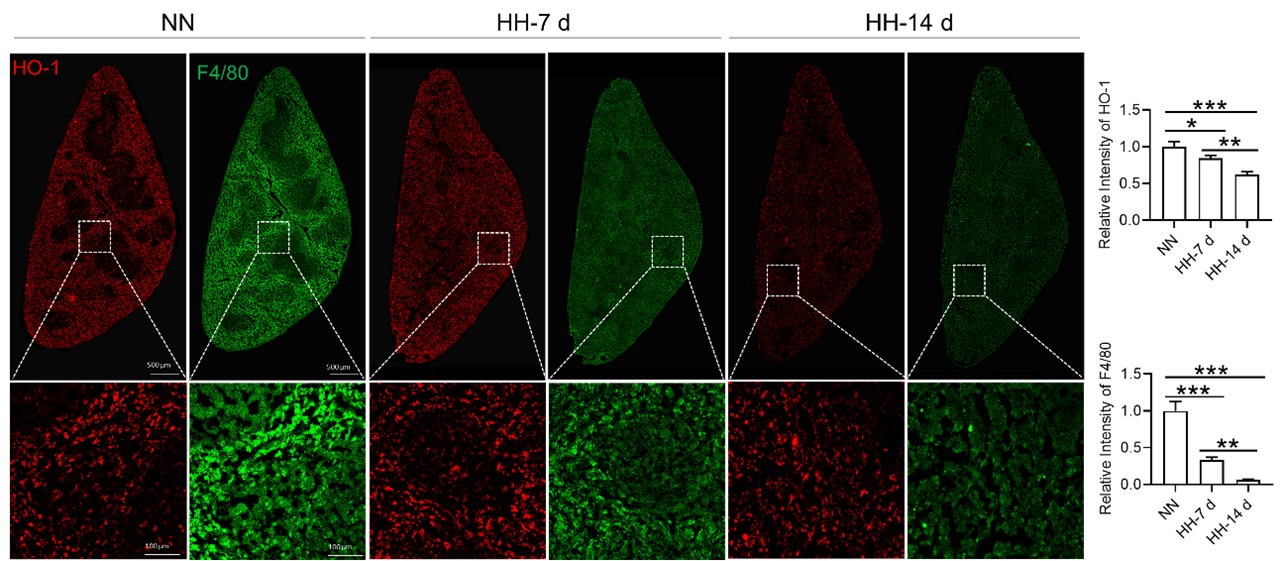
- The phagocytic function of splenic red pulp macrophages relative to infection cannot be used directly to understand erythrophagocytosis. The standard approach is to use opsonized RBCs in vitro. Furthermore, RBC survival is a standard method to assess erythrophagocytosis function. In this method, biotin is injected via tail vein directly and small blood samples are collected to measure the clearance of biotinilation by flow; kits are available to accomplish this. Because the method is standard, Fig 4D is not necessary and Fig 4E needs to be performed only in blood by sampling mice repeatedly and comparing the rate of biotin decline in HH with NN (not comparing 7 d with 14 d).
We appreciate your insightful comments and suggestions. We concur that the phagocytic function of splenic red pulp macrophages in the context of infection may not be directly translatable to understanding erythrophagocytosis. Given our assessment that the use of cy5.5-labeled E.coli alone may not be sufficient to accurately evaluate the phagocytic function of macrophages, we extended our study to include the use of NHS-biotin-labeled RBCs to assess phagocytic capabilities. While the presence of biotin-labeled RBCs in the blood could provide an indication of RBC clearance, this measure does not exclusively reflect the spleen's role in the process, as it fails to account for the clearance activities of other organs.
Consequently, we propose that the remaining biotin-labeled RBCs in the spleen may provide a more direct representation of the organ's function in RBC clearance and sequestration. Our observations of diminished erythrophagocytosis at both 7 and 14 days following exposure to HH guided our subsequent efforts to quantify biotin-labeled RBCs in both the circulatory system and spleen. These measurements were conducted during the 7 to 14-day span following the confirmation of impaired erythrophagocytosis. Comparative evaluation of RBC clearance rates under NN and HH conditions provided further evidence supporting our preliminary observations, with the data revealing a decrease in the RBC clearance rate in the context of HH conditions. In response to feedback from other reviewers, we have elected to exclude the phagocytic results and the diagram of the erythrocyte labeling assay. These amendments will be incorporated into the revised manuscript. The reviewers' constructive feedback has played a crucial role in refining the methodological precision and coherence of our investigation.
- It is unclear whether Tuftsin has a specific effect on phagocytosis of RBCs without other potential confounding effects. Furthermore, quantifying iron in red pulp splenic macrophages requires alternative readily available more quantitative methods (e.g. sorted red pulp macrophages non-heme iron concentration).
We appreciate your comments and questions regarding the potential effect of Tuftsin on the phagocytosis of RBCs and the quantification of iron in red pulp splenic macrophages. Regarding the role of Tuftsin, we concur that the literature directly associating Tuftsin with erythrophagocytosis is scant. The work of Gino Roberto Corazza et al. does suggest a link between Tuftsin and general phagocytic capacity, but it does not specifically address erythrophagocytosis (Am J Gastroenterol, 1999;94:391-397). We agree that further investigations are required to elucidate the potential confounding effects and to ascertain whether Tuftsin has a specific impact on the phagocytosis of RBCs. Concerning the quantification of iron in red pulp splenic macrophages, we acknowledge your suggestion to employ readily available and more quantitative methods. We have incorporated additional Fe2+ staining in the spleen at two time points: 7 and 14 days subsequent to HH exposure (refer to the following Figure). The resultant data reveal an escalated deposition of Fe2+ within the red pulp, as evidenced in Figures 5 (panels L and M) and Figure 7 (panels L and M).
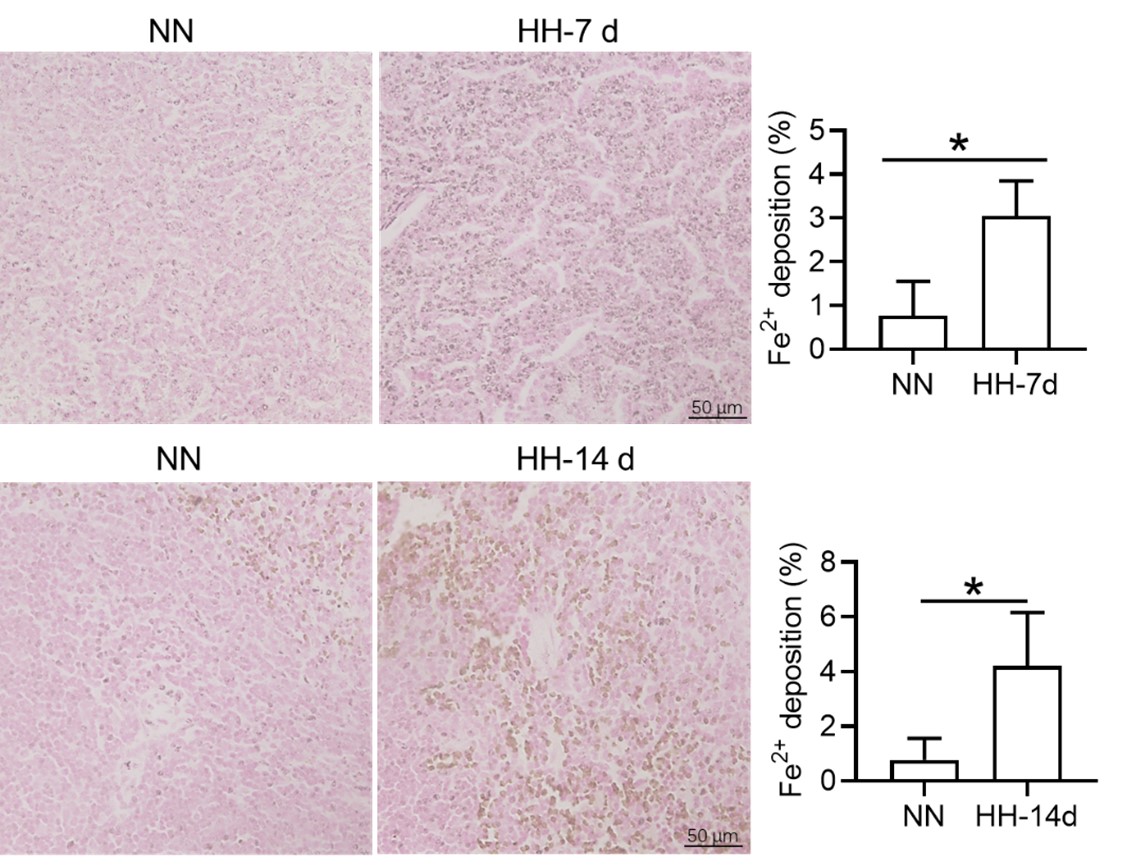
- In Fig 5, PBMCs are not thought to represent splenic macrophages and although of some interest, does not contribute significantly to the conclusions regarding splenic macrophages at the heart of the current work. The data is also in the wrong direction, namely providing evidence that PBMCs are relatively iron poor which is not consistent with ferroptosis which would increase cellular iron.
We appreciate your insightful critique regarding Figure 5 and the interpretation of our data on peripheral blood mononuclear cells (PBMCs) in relation to splenic macrophages. We understand that PBMCs do not directly represent splenic macrophages, and we agree that any conclusions drawn from PBMCs must be considered with caution when discussing the behavior of splenic macrophages.
The primary rationale for incorporating PBMCs into our study was to investigate the potential correspondence between their gene expression changes and those observed in the spleen after HH exposure. This was posited as a working hypothesis for further exploration rather than a conclusive statement. The gene expression in PBMCs was congruous with changes in the spleen's gene expression, demonstrating an iron deficiency phenotype, ostensibly due to the mobilization of intracellular iron for hemoglobin synthesis. Thus, it is plausible that NCOA4 may facilitate iron mobilization through the degradation of ferritin to store iron.
It remains ambiguous whether ferroptosis was initiated in the PBMCs during our study. Ferroptosis primarily occurs as a response to an increase in Fe2+ rather than an overall increase in intracellular iron. Our preliminary proposition was that relative changes in gene expression in PBMCs could potentially mirror corresponding changes in protein expression in the spleen, thereby potentially indicating alterations in iron processing capacity post-HH exposure. However, we fully acknowledge that this is a conjecture requiring further empirical substantiation or clinical validation.
- Tfr1 increase is typically correlated with cellular iron deficiency while ferroptosis consistent with iron loading. The direction of the changes in multiple elements relevant to iron trafficking is somewhat confusing and without additional evidence, there is little confidence that the authors have reached the correct conclusion. Furthermore, the results here are analyses of total spleen samples rather than specific cells in the spleen.
We appreciate your astute comments and agree that the observed increase in transferrin receptor (TfR) expression, typically associated with cellular iron deficiency, appears contradictory to the expected iron-loading state associated with ferroptosis. We understand that this apparent contradiction might engender some uncertainty about our conclusions.
In our investigation, we evaluated total spleen samples as opposed to distinct cell types within the spleen, a factor that could have contributed to the seemingly discordant findings. An integral element to bear in mind is the existence of immature RBCs in the spleen, particularly within the hematopoietic island where these immature RBCs cluster around nurse macrophages. These immature RBCs contain abundant TfR which was needed for iron uptake and hemoglobin synthesis. These cells, which prove challenging to eliminate via perfusion, might have played a role in the observed upregulation in TfR expression, especially in the aftermath of HH exposure. Our further research revealed that the expression of TfR in macrophages diminished following hypoxic conditions, thereby suggesting that the elevated TfR expression in tissue samples may predominantly originate from other cell types, especially immature RBCs (refer to subsequent Figure).
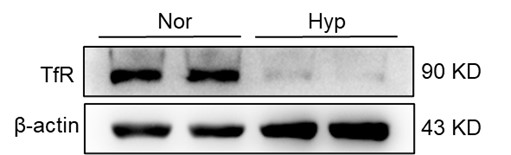
Reviewer #2 (Public Review):
The authors aimed at elucidating the development of high altitude polycythemia which affects mice and men staying in the hypoxic atmosphere at high altitude (hypobaric hypoxia; HH). HH causes increased erythropoietin production which stimulates the production of red blood cells. The authors hypothesize that increased production is only partially responsible for exaggerated red blood cell production, i.e. polycythemia, but that decreased erythrophagocytosis in the spleen contributes to high red blood cells counts.
The main strength of the study is the use of a mouse model exposed to HH in a hypobaric chamber. However, not all of the reported results are convincing due to some smaller effects which one may doubt to result in the overall increase in red blood cells as claimed by the authors. Moreover, direct proof for reduced erythrophagocytosis is compromised due to a strong spontaneous loss of labelled red blood cells, although effects of labelled E. coli phagocytosis are shown. Their discussion addresses some of the unexpected results, such as the reduced expression of HO-1 under hypoxia but due to the above-mentioned limitations much of the discussion remains hypothetical.
Thank you for your valuable feedback and insight. We appreciate the recognition of the strength of our study model, the exposure of mice to hypobaric hypoxia (HH) in a hypobaric animal chamber. We also understand your concerns about the smaller effects and their potential impact on the overall increase in red blood cells (RBCs), as well as the apparent reduced erythrophagocytosis due to the loss of labelled RBCs.
Erythropoiesis has been predominantly attributed to the amplified production of RBCs under conditions of HH. The focus of our research was to underscore the potential acceleration of hypoxia-associated polycythemia (HAPC) as a result of compromised erythrophagocytosis. Considering the spontaneous loss of labelled RBCs in vivo, we assessed the clearance rate of RBCs at the stages of 7 and 14 days within the HH environment, and subsequently compared this rate within the period from 7 to 14 days following the clear manifestation of erythrophagocytosis impairment at the two aforementioned points identified in our study. This approach was designed to negate the effects of spontaneous loss of labelled RBCs in both NN and HH conditions. Correspondingly, the results derived from blood and spleen analyses corroborated a decline in the RBC clearance rate under HH when juxtaposed with NN conditions.
Apart from the E. coli phagocytosis and the labeled RBCs experiment (this part of the results was removed in the revision), the injection of Tuftsin further substantiated the impairment of erythrophagocytosis in the HH spleen, as evidenced by the observed decrease in iron within the red pulp of the spleen post-perfusion. Furthermore, to validate our findings, we incorporated RBCs staining in splenic cells at 7 and 14 days of HH exposure, which provided concrete confirmation of impaired erythrophagocytosis (new Figure 4E).

As for the reduced expression of heme oxygenase-1 (HO-1) under hypoxia, we agree that this was an unexpected result, and we are in the process of further exploring the underlying mechanisms. It is possible that there are other regulatory pathways at play that are yet to be identified. However, we believe that by offering possible interpretations of our data and potential directions for future research, we contribute to the ongoing scientific discourse in this area.
Reviewer #3 (Public Review):
The manuscript by Yang et al. investigated in mice how hypobaric hypoxia can modify the RBC clearance function of the spleen, a concept that is of interest. Via interpretation of their data, the authors proposed a model that hypoxia causes an increase in cellular iron levels, possibly in RPMs, leading to ferroptosis, and downregulates their erythrophagocytic capacity. However, most of the data is generated on total splenocytes/total spleen, and the conclusions are not always supported by the presented data. The model of the authors could be questioned by the paper by Youssef et al. (which the authors cite, but in an unclear context) that the ferroptosis in RPMs could be mediated by augmented erythrophagocytosis. As such, the loss of RPMs in vivo which is indeed clear in the histological section shown (and is a strong and interesting finding) can be not directly caused by hypoxia, but by enhanced RBC clearance. Such a possibility should be taken into account.
Thank you for your insightful comments and constructive feedback. In their research, Youssef et al. (2018) discerned that elevated erythrophagocytosis of stressed red blood cells (RBCs) instigates ferroptosis in red pulp macrophages (RPMs) within the spleen, as evidenced in a mouse model of transfusion. This augmentation of erythrophagocytosis was conspicuous five hours post-injection of RBCs. Conversely, our study elucidated the decrease in erythrophagocytosis in the spleen after both 7 and 14 days.
Typically, macrophages exhibit an enhanced phagocytic capacity in the immediate aftermath of stress or stimulation. Nonetheless, the temporal points of observation in our study were considerably extended (seven and fourteen days). It remains uncertain whether phagocytic capability was amplified during the acute phase of HH exposure—particularly within the first day, considering that splenoconstriction under HH for one day results in the release of stored RBCs into the bloodstream—and whether this initial response could precipitate ferroptosis and subsequently diminished erythrophagocytosis at the 7 or 14 day marks under continued HH conditions.
Major points:
- The authors present data from total splenocytes and then relate the obtained data to RPMs, which are quantitatively a minor population in the spleen. Eg, labile iron is increased in the splenocytes upon HH, but the manuscript does not show that this occurs in the red pulp or RPMs. They also measure gene/protein expression changes in the total spleen and connect them to changes in macrophages, as indicated in the model Figure (Fig. 7). HO-1 and levels of Ferritin (L and H) can be attributed to the drop in RPMs in the spleen. Are any of these changes preserved cell-intrinsically in cultured macrophages? This should be shown to support the model (relates also to lines 487-88, where the authors again speculate that hypoxia decreases HO-1 which was not demonstrated). In the current stage, for example, we do not know if the labile iron increase in cultured cells and in the spleen in vivo upon hypoxia is the same phenomenon, and why labile iron is increased. To improve the manuscript, the authors should study specifically RPMs.
We express our gratitude for your perceptive remarks. In our initial manuscript, we did not evaluate labile iron within the red pulp and red pulp macrophages (RPMs). To address this oversight, we utilized the Lillie staining method, in accordance with the protocol outlined by Liu et al., (Chemosphere, 2021, 264(Pt 1):128413), to discern Fe2+ presence within these regions. The outcomes were consistent with our antecedent Western blot and flow cytometry findings in the spleen, corroborating an increment in labile iron specifically within the red pulp of the spleen.

However, we acknowledge the necessity for other supplementary experimental efforts to further validate these findings. Additionally, we scrutinized the expression of heme oxygenase-1 (HO-1) and iron-related proteins, including transferrin receptor (TfR), ferroportin (Fpn), ferritin (Ft), and nuclear receptor coactivator 4 (NCOA4) in primary macrophages subjected to 1% hypoxic conditions, both with and without hemoglobin treatment. Our results indicated that the expression of ferroptosis-related proteins was consistent with in vivo studies, however the expression of iron related proteins was not similar in vitro and in vivo. It suggesting that the increase in labile iron in cultured cells and the spleen in vivo upon hypoxia are not identical phenomena. However, the precise mechanism remains elusive.
In our study, we observed a decrease in HO-1 protein expression following 7 and 14 days of HH exposure, as shown in Figure 3U, 5A, and S1A. This finding contradicts previous research that identified HO-1 as a hypoxia-inducible factor (HIF) target under hypoxic conditions (P J Lee et al., 1997). Our discussion, therefore, addressed the potential discrepancy in HO-1 expression under HH. According to our findings, HO-1 regulation under HH appears to be predominantly influenced by macrophage numbers and the RBCs to be processed in the spleen or macrophages, rather than by hypoxia alone.
It is challenging to discern whether the increased labile iron observed in vitro accurately reflects the in vivo phenomenon, as replicating the iron requirements for RBCs production induced by HH in vitro is inherently difficult. However, by integrating our in vivo and in vitro studies, we determined that the elevated Fe2+ levels were not dependent on HO-1 protein expression, as HO-1 levels was increased in vitro while decreasing in vivo under hypoxic/HH exposure.

- The paper uses flow cytometry, but how this method was applied is suboptimal: there are no gating strategies, no indication if single events were determined, and how cell viability was assessed, which are the parent populations when % of cells is shown on the graphs. How RBCs in the spleen could be analyzed without dedicated cell surface markers? A drop in splenic RPMs is presented as the key finding of the manuscript but Fig. 3M shows gating (suboptimal) for monocytes, not RPMs. RPMs are typically F4/80-high, CD11-low (again no gating strategy is shown for RPMs). Also, the authors used single-cell RNAseq to detect a drop in splenic macrophages upon HH, but they do not indicate in Fig. A-C which cluster of cells relates to macrophages. Cell clusters are not identified in these panels, hence the data is not interpretable).
Thank you for your comments and constructive critique regarding our flow cytometry methodology and presentation. We understand the need for greater transparency and detailed explanation of our procedures, and we acknowledge that the lack of gating strategies and other pertinent information in our initial manuscript may have affected the clarity of our findings.
In our initial report, we provided an overview of the decline in migrated macrophages (F4/80hiCD11bhi), including both M1 and M2 expression in migrated macrophages, as illustrated in Figure 3, but did not specifically address the changes in red pulp macrophages (RPMs). Based on previous results, it is difficult to identify CD11b- and CD11blo cells. We will repeat the results and attempt to identify F4/80hiCD11blo cells in the revised manuscript. The results of the reanalysis are now included (Figure 3M). However, single-cell in vivo analysis studies may more accurately identify specific cell types that decrease after exposure to HH.
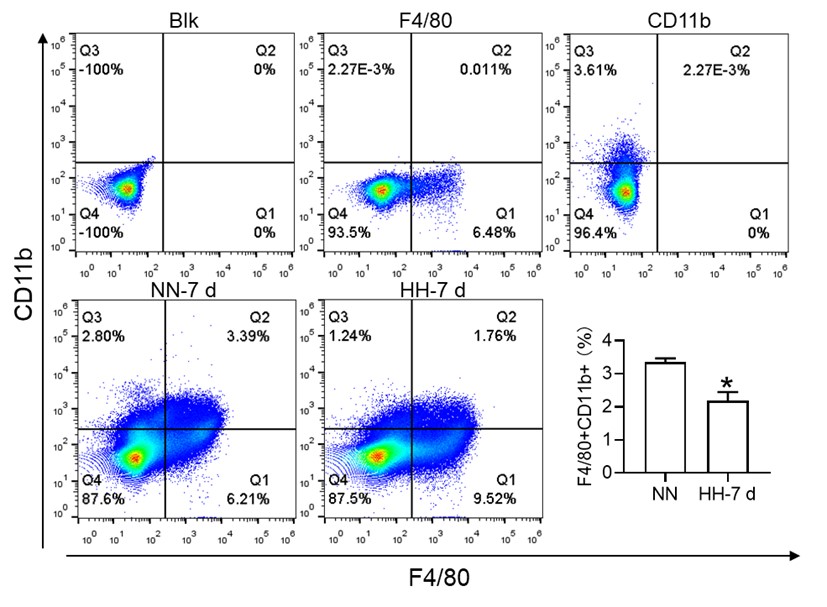
Furthermore, we substantiated the reduction in red pulp, as evidenced by Figure 4J, given that iron processing primarily occurs within the red pulp. In Figure 3, our initial objective was merely to illustrate the reduction in total macrophages in the spleen following HH exposure.
To further clarify the characterization of various cell types, we conducted a single-cell analysis. Our findings indicated that clusters 0,1,3,4,14,18, and 29 represented B cells, clusters 2, 10, 12, and 28 represented T cells, clusters 15 and 22 corresponded to NK cells, clusters 5, 11, 13, and 19 represented NKT cells, clusters 6, 9, and 24 represented cell cycle cells, clusters 26 and 17 represented plasma cells, clusters 21 and 23 represented neutrophils, cluster 30 represented erythrocytes, and clusters 7, 8, 16, 20, 24, and 27 represented dendritic cells (DCs) and macrophages, as depicted in Figure 3E.
- The authors draw conclusions that are not supported by the data, some examples: a) they cannot exclude eg the compensatory involvement of the liver in the RBCs clearance (the differences between HH sham and HH splenectomy is mild in Fig. 2 E, F and G).
Thank you for your insightful comments and for pointing out the potential involvement of other organs, such as the liver, in the RBC clearance under HH conditions. We concur with your observation that the differences between the HH sham and HH splenectomy conditions in Fig. 2 E, F, and G are modest. This could indeed suggest a compensatory role of other organs in RBC clearance when splenectomy is performed. Our intent, however, was to underscore the primary role of the spleen in this process under HH exposure.
In fact, after our initial investigations, we conducted a more extensive study examining the role of the liver in RBC clearance under HH conditions. Our findings, as illustrated in the figures submitted with this response, indeed support a compensatory role for the liver. Specifically, we observed an increase in macrophage numbers and phagocytic activity in the liver under HH conditions. Although the differences in RBC count between the HH sham and HH splenectomy conditions may seem minor, it is essential to consider the unit of this measurement, which is value*1012/ml. Even a small numerical difference can represent a significant biological variation at this scale.

b) splenomegaly is typically caused by increased extramedullary erythropoiesis, not RBC retention. Why do the authors support the second possibility? Related to this, why do the authors conclude that data in Fig. 4 G,H support the model of RBC retention? A significant drop in splenic RBCs (poorly gated) was observed at 7 days, between NN and HH groups, which could actually indicate increased RBC clearance capacity = less retention.
Prior investigations have predominantly suggested that spleen enlargement under hypoxic conditions stems from the spleen's extramedullary hematopoiesis. Nevertheless, an intriguing study conducted in 1994 by the General Hospital of Xizang Military Region reported substantial exaggeration and congestion of splenic sinuses in high altitude polycythemia (HAPC) patients. This finding was based on the dissection of spleens from 12 patients with HAPC (Zou Xunda, et al., Southwest Defense Medicine, 1994;5:294-296). Moreover, a recent study indicated that extramedullary erythropoiesis reaches its zenith between 3 to 7 days (Wang H et al., 2021).
Considering these findings, the present study postulates that hypoxia-induced inhibition of erythrophagocytosis may lead to RBC retention. However, we acknowledge that the manuscript in its current preprint form does not offer conclusive evidence to substantiate this hypothesis. To bridge this gap, we further conducted experiments where the spleen was perfused, and total cells were collected post HH exposure. These cells were then smeared onto slides and subjected to Wright staining. Our results unequivocally demonstrate an evident increase in deformation and retention of RBCs in the spleen following 7 and 14 days of HH exposure. This finding strengthens our initial hypothesis and contributes a novel perspective to the understanding of splenic responses under hypoxic conditions.
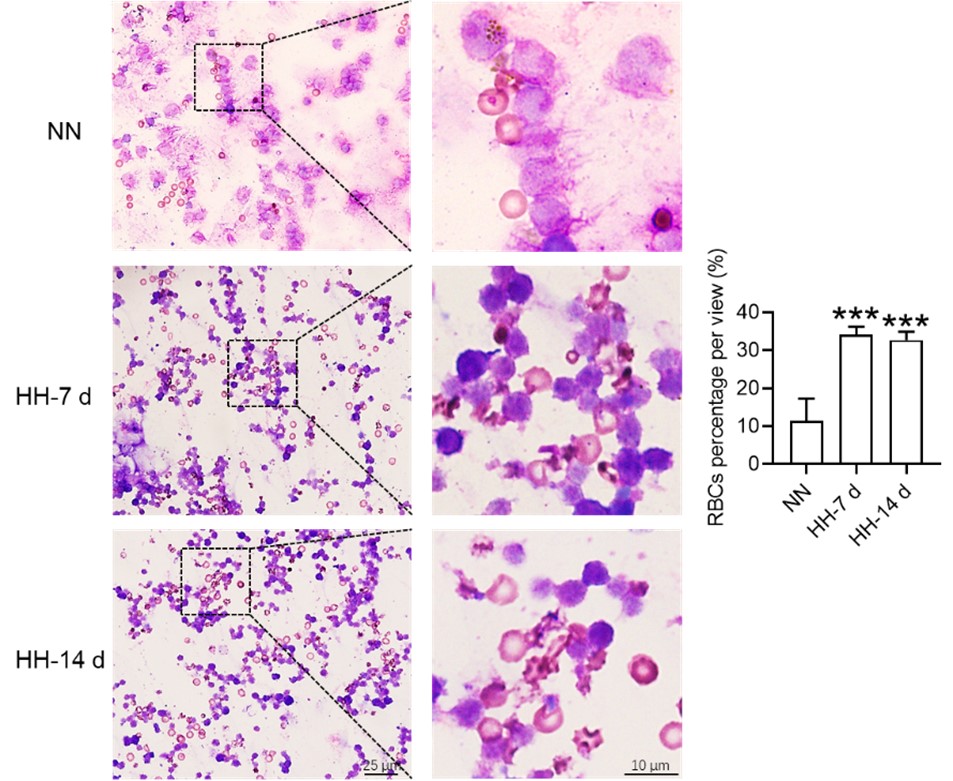
c) lines 452-54: there is no data for decreased phagocytosis in vivo, especially in the context of erythrophagocytosis. This should be done with stressed RBCs transfusion assays, very good examples, like from Youssef et al. or Threul et al. are available in the literature.
Thanks. In their seminal work, Youssef and colleagues demonstrated that the transfusion of stressed RBCs triggers erythrophagocytosis and subsequently incites ferroptosis in red pulp macrophages (RPMs) within a span of five hours. Given these observations, the applicability of this model to evaluate macrophage phagocytosis in the spleen or RPMs under HH conditions may be limited, as HH has already induced erythropoiesis in vivo. In addition, it was unclear whether the membrane characteristics of stress induced RBCs were similar to those of HH induced RBCs, as this is an important signal for in vivo phagocytosis. The ambiguity arises from the fact that we currently lack sufficient knowledge to discern whether the changes in phagocytosis are instigated by the presence of stressed RBCs or by changes of macrophages induced by HH in vivo. Nonetheless, we appreciate the potential value of this approach and intend to explore its utility in our future investigations. The prospect of distinguishing the effects of stressed RBCs from those of HH on macrophage phagocytosis is an intriguing line of inquiry that could yield significant insights into the mechanisms governing these physiological processes. We will investigate this issue in our further study.
d) Line 475 - ferritinophagy was not shown in response to hypoxia by the manuscript, especially that NCOA4 is decreased, at least in the total spleen.
Drawing on the research published in eLife in 2015, it was unequivocally established that ferritinophagy, facilitated by Nuclear Receptor Coactivator 4 (NCOA4), is indispensable for erythropoiesis. This process is modulated by iron-dependent HECT and RLD domain containing E3 ubiquitin protein ligase 2 (HERC2)-mediated proteolysis (Joseph D Mancias et al., eLife. 2015; 4: e10308). As is widely recognized, NCOA4 plays a critical role in directing ferritin (Ft) to the lysosome, where both NCOA4 and Ft undergo coordinated degradation.
In our study, we provide evidence that exposure to HH stimulates erythropoiesis (Figure 1). We propose that this, in turn, could promote ferritinophagy via NCOA4, resulting in a decrease in NCOA4 protein levels post-HH exposure. We will further increase experiments to verify this concern. This finding not only aligns with the established understanding of ferritinophagy and erythropoiesis but also adds a novel dimension to the understanding of cellular responses to hypoxic conditions.
- In a few cases, the authors show only representative dot plots or histograms, without quantification for n>1. In Fig. 4B the authors write about a significant decrease (although with n=1 no statistics could be applied here; of note, it is not clear what kind of samples were analyzed here). Another example is Fig. 6I. In this case, it is even more important as the data are conflicting the cited article and the new one: PMCID: PMC9908853 which shows that hypoxia stimulates efferocytosis. Sometimes the manuscript claim that some changes are observed, although they are not visible in representative figures (eg for M1 and M2 macrophages in Fig. 3M)
We recognize that our initial portrayal of Figure 4B was lacking in precision, given that it did not include the corresponding statistical graph. While our results demonstrated a significant reduction in the ability to phagocytose E. coli, in line with the recommendations of other reviewers, we have opted to remove the results pertaining to E. coli phagocytosis in this revision, as they primarily reflected immune function. In relation to PMC9908853, which reported metabolic adaptation facilitating enhanced macrophage efferocytosis in limited-oxygen environments, it is worth noting that the macrophages investigated in this study were derived from ER-Hoxb8 macrophage progenitors following the removal of β-estradiol. Consequently, questions arise regarding the comparability between these cultured macrophages and primary macrophages obtained fresh from the spleen post HH exposure. The characteristics and functions of these two different macrophage sources may not align precisely, and this distinction necessitates further investigation.
- There are several unclear issues in methodology:
- what is the purity of primary RPMs in the culture? RPMs are quantitatively poorly represented in splenocyte single-cell suspensions. This reviewer is quite skeptical that the processing of splenocytes from approx 1 mm3 of tissue was sufficient to establish primary RPM cultures. The authors should prove that the cultured cells were indeed RPMs, not monocyte-derived macrophages or other splenic macrophage subtypes.
Thank you for your thoughtful comments and inquiries. Firstly, I apologize if we did not make it clear in the original manuscript. The purity of the primary RPMs in our culture was found to be approximately 40%, as identified by F4/80hiCD11blo markers using flow cytometry. We recognize that RPMs are typically underrepresented in splenocyte single-cell suspensions, and the concern you raise about the potential for contamination by other cell types is valid.
We apologize for any ambiguities in the methodological description that may have led to misunderstandings during the review. Indeed, the entirety of the spleen is typically employed for splenic macrophage culture. The size of the spleen can vary dependent on the species and age of the animal, but in mice, it is commonly approximately 1 cm in length. The spleen is then dissected into minuscule fragments, each approximately 1 mm3 in volume, to aid in enzymatic digestion. This procedure does not merely utilize a single 1 mm3 tissue fragment for RPMs cultures. Although the isolation and culture of spleen macrophages can present considerable challenges, our method has been optimized to enhance the yield of this specific cell population.
- (around line 183) In the description of flow cytometry, there are several missing issues. In 1) it is unclear which type of samples were analyzed. In 2) it is not clear how splenocyte cell suspension was prepared.
- Whole blood was extracted from the mice and collected into an anticoagulant tube, which was then set aside for subsequent thiazole orange (TO) staining. 2) Splenic tissue was procured from the mice and subsequently processed into a single-cell suspension using a 40 μm filter. The erythrocytes within the entire sample were subsequently lysed and eliminated, and the remaining cell suspension was resuspended in phosphate-buffered saline (PBS) in preparation for ensuing analyses.
We have meticulously revised these methodological details in the corresponding section of the manuscript to ensure clarity and precision.
- In line 192: what does it mean: 'This step can be omitted from cell samples'?
The methodology employed for the quantification of intracellular divalent iron content and lipid peroxidation level was executed as follows: Splenic tissue was first processed into a single cell suspension, subsequently followed by the lysis of RBCs. It should be noted that this particular stage is superfluous when dealing with isolated cell samples. Subsequently, a total of 1 × 10⁶ cells were incubated with 100 μL of BioTracker Far-red Labile Fe2+ Dye (1 mM, Sigma, SCT037, USA) for a duration of 1 hour, or alternatively, C11-Bodipy 581/591 (10 μM, Thermo Fisher, D3861, USA) for a span of 30 minutes. Post incubation, cells were thoroughly washed twice with PBS. Flow cytometric analysis was subsequently performed, utilizing the FL6 (638 nm/660 nm) channel for the determination of intracellular divalent iron content, and the FL1 (488 nm/525 nm) channel for the quantification of the lipid peroxidation level.
- 'TO method' is not commonly used anymore and hence it was unclear to this Reviewer. Reticulocytes should be analyzed with proper gating, using cell surface markers.
We are appreciative of your astute observation pertaining to the methodology we employed to analyze reticulocytes in our study. We value your recommendation to utilize cell surface markers for effective gating, which indeed represents a more modern and accurate approach. However, as reticulocyte identification is not the central focus of our investigation, we opted for the TO staining method—due to its simplicity and credibility of results. In our initial exploration, we adopted the TO staining method in accordance with the protocol outlined (Sci Rep, 2018, 8(1):12793), primarily owing to its established use and demonstrated efficacy in reticulocyte identification.
- The description of 'phagocytosis of E. coli and RBCs' in the Methods section is unclear and incomplete. The Results section suggests that for the biotinylated RBCs, phagocytosis? or retention? Of RBCs was quantified in vivo, upon transfusion. However, the Methods section suggests either in vitro/ex vivo approach. It is vague what was indeed performed and how in detail. If RBC transfusion was done, this should be properly described. Of note, biotinylation of RBCs is typically done in vivo only, being a first step in RBC lifespan assay. The such assay is missing in the manuscript. Also, it is not clear if the detection of biotinylated RBCs was performed in permeablized cells (this would be required).
Thanks for the comments. In our initial methodology, we employed Cy5.5-labeled Escherichia coli to probe phagocytic function, albeit with the understanding that this may not constitute the most ideal model for phagocytosis detection within this context (in light of recommendations from other reviewers, we have removed the E. coli phagocytosis results from this revision, as they predominantly mirror immune function). Our fundamental aim was to ascertain whether HH compromises the erythrophagocytic potential of splenic macrophages. In pursuit of this, we subsequently analyzed the clearance of biotinylated RBCs in both the bloodstream and spleen to assess phagocytic functionality in vivo.
In the present study, instead of transfusing biotinylated RBCs into mice, we opted to inject N-Hydroxysuccinimide (NHS)-biotin into the bloodstream. NHS-biotin is capable of binding with cell membranes in vivo and can be recognized by streptavidin-fluorescein isothiocyanate (FITC) after cells are extracted from the blood or spleen in vitro. Consequently, biotin-labeled RBCs were detectable in both the blood and spleen following NHS-biotin injection for a duration of 21 days.
Ultimately, we employed flow cytometry to analyze the NHS-biotin labeled RBCs in the blood or spleen. This method facilitates the detection of live cells and is not applicable to permeabilized cells. We believe this approach better aligns with our investigative goals and offers a more robust evaluation of erythrophagocytic function under hypoxic conditions.
-
eLife assessment
The authors set out to study the development of high altitude polycythemia, which affects mice in a hypoxia chamber and humans staying at a hypoxic atmosphere at high altitude. The findings are useful both for initiating the discussion of the hypothesis that splenic red pulp macrophages, central to red cell survival, are impacted by hypoxia, and for providing some data that partially supports this hypothesis. However, the current data are inadequate to fully support the authors' conclusions.
-
Reviewer #1 (Public Review):
Wang and all present an interesting body of work focused on the effects of high altitude and hypoxia on erythropoiesis, resulting in erythrocytosis. This work is specifically focused on the spleen, identifying splenic macrophages as central cells in this effect. This is logical since these cells are involved in erythrophagocytosis and iron recycling. The results suggest that hypoxia induces splenomegaly with decreased number of splenic macrophages. There is also evidence that ferroptosis is induced in these macrophages, leading to cell destruction. Finally, the data suggest that ferroptosis in splenic red pulp macrophages causes the decrease in RBC clearance, resulting in erythrocytosis aka lengthening the RBC lifespan. However, there are many issues with the presented results, with somewhat superficial …
Reviewer #1 (Public Review):
Wang and all present an interesting body of work focused on the effects of high altitude and hypoxia on erythropoiesis, resulting in erythrocytosis. This work is specifically focused on the spleen, identifying splenic macrophages as central cells in this effect. This is logical since these cells are involved in erythrophagocytosis and iron recycling. The results suggest that hypoxia induces splenomegaly with decreased number of splenic macrophages. There is also evidence that ferroptosis is induced in these macrophages, leading to cell destruction. Finally, the data suggest that ferroptosis in splenic red pulp macrophages causes the decrease in RBC clearance, resulting in erythrocytosis aka lengthening the RBC lifespan. However, there are many issues with the presented results, with somewhat superficial data, meaning the conclusions are overstated and there is decreased confidence that the hypotheses and observed results are directly causally related to hypoxia.
Major points:
The spleen is a relatively poorly understood organ but what is known about its role in erythropoiesis especially in mice is that it functions both to clear as well as to generate RBCs. The later process is termed extramedullary hematopoiesis and can occur in other bones beyond the pelvis, liver, and spleen. In mice, the spleen is the main organ of extramedullary erythropoiesis. The finding of transiently decreased spleen size prior to splenomegaly under hypoxic conditions is interesting but not well developed in the manuscript. This is a shortcoming as this is an opportunity to evaluate the immediate effect of hypoxia separately from its more chronic effect. Based just on spleen size, no conclusions can be drawn about what happens in the spleen in response to hypoxia.
Monocyte repopulation of tissue resident macrophages is a minor component of the process being described and it is surprising that monocytes in the bone marrow and spleen are also decreased. Can the authors conjecture why this is happening? Typically, the expectation would be that a decrease in tissue resident macrophages would be accompanied by an increase in monocyte migration into the organ in a compensatory manner.
Figure 3 does not definitively provide evidence that cell death is specifically occurring in splenic macrophages and the fraction of Cd11b+ cells is not changed in NN vs HH. Furthermore, the IHC of F4/80 in Fig 3U is not definitive as cells can express F4/80 more or less brightly and no negative/positive controls are shown for this panel.
The phagocytic function of splenic red pulp macrophages relative to infection cannot be used directly to understand erythrophagocytosis. The standard approach is to use opsonized RBCs in vitro. Furthermore, RBC survival is a standard method to assess erythrophagocytosis function. In this method, biotin is injected via tail vein directly and small blood samples are collected to measure the clearance of biotinilation by flow; kits are available to accomplish this. Because the method is standard, Fig 4D is not necessary and Fig 4E needs to be performed only in blood by sampling mice repeatedly and comparing the rate of biotin decline in HH with NN (not comparing 7 d with 14 d).
It is unclear whether Tuftsin has a specific effect on phagocytosis of RBCs without other potential confounding effects. Furthermore, quantifying iron in red pulp splenic macrophages requires alternative readily available more quantitative methods (e.g. sorted red pulp macrophages non-heme iron concentration).
In Fig 5, PBMCs are not thought to represent splenic macrophages and although of some interest, does not contribute significantly to the conclusions regarding splenic macrophages at the heart of the current work. The data is also in the wrong direction, namely providing evidence that PBMCs are relatively iron poor which is not consistent with ferroptosis which would increase cellular iron.
Tfr1 increase is typically correlated with cellular iron deficiency while ferroptosis consistent with iron loading. The direction of the changes in multiple elements relevant to iron trafficking is somewhat confusing and without additional evidence, there is little confidence that the authors have reached the correct conclusion. Furthermore, the results here are analyses of total spleen samples rather than specific cells in the spleen.
-
Reviewer #2 (Public Review):
The authors aimed at elucidating the development of high altitude polycythemia which affects mice and men staying in the hypoxic atmosphere at high altitude (hypobaric hypoxia; HH). HH causes increased erythropoietin production which stimulates the production of red blood cells. The authors hypothesize that increased production is only partially responsible for exaggerated red blood cell production, i.e. polycythemia, but that decreased erythrophagocytosis in the spleen contributes to high red blood cells counts.
The main strength of the study is the use of a mouse model exposed to HH in a hypobaric chamber. However, not all of the reported results are convincing due to some smaller effects which one may doubt to result in the overall increase in red blood cells as claimed by the authors. Moreover, direct …
Reviewer #2 (Public Review):
The authors aimed at elucidating the development of high altitude polycythemia which affects mice and men staying in the hypoxic atmosphere at high altitude (hypobaric hypoxia; HH). HH causes increased erythropoietin production which stimulates the production of red blood cells. The authors hypothesize that increased production is only partially responsible for exaggerated red blood cell production, i.e. polycythemia, but that decreased erythrophagocytosis in the spleen contributes to high red blood cells counts.
The main strength of the study is the use of a mouse model exposed to HH in a hypobaric chamber. However, not all of the reported results are convincing due to some smaller effects which one may doubt to result in the overall increase in red blood cells as claimed by the authors. Moreover, direct proof for reduced erythrophagocytosis is compromised due to a strong spontaneous loss of labelled red blood cells, although effects of labelled E. coli phagocytosis are shown.
Their discussion addresses some of the unexpected results, such as the reduced expression of HO-1 under hypoxia but due to the above mentioned limitations much of the discussion remains hypothetical.
-
Reviewer #3 (Public Review):
The manuscript by Yang et al. investigated in mice how hypobaric hypoxia can modify the RBC clearance function of the spleen, a concept that is of interest. Via interpretation of their data, the authors proposed a model that hypoxia causes an increase in cellular iron levels, possibly in RPMs, leading to ferroptosis, and downregulates their erythrophagocytic capacity. However, most of the data is generated on total splenocytes/total spleen, and the conclusions are not always supported by the presented data. The model of the authors could be questioned by the paper by Youssef et al. (which the authors cite, but in an unclear context) that the ferroptosis in RPMs could be mediated by augmented erythrophagocytosis. As such, the loss of RPMs in vivo which is indeed clear in the histological section shown (and is …
Reviewer #3 (Public Review):
The manuscript by Yang et al. investigated in mice how hypobaric hypoxia can modify the RBC clearance function of the spleen, a concept that is of interest. Via interpretation of their data, the authors proposed a model that hypoxia causes an increase in cellular iron levels, possibly in RPMs, leading to ferroptosis, and downregulates their erythrophagocytic capacity. However, most of the data is generated on total splenocytes/total spleen, and the conclusions are not always supported by the presented data. The model of the authors could be questioned by the paper by Youssef et al. (which the authors cite, but in an unclear context) that the ferroptosis in RPMs could be mediated by augmented erythrophagocytosis. As such, the loss of RPMs in vivo which is indeed clear in the histological section shown (and is a strong and interesting finding) can be not directly caused by hypoxia, but by enhanced RBC clearance. Such a possibility should be taken into account.
Major points:
The authors present data from total splenocytes and then relate the obtained data to RPMs, which are quantitatively a minor population in the spleen. Eg, labile iron is increased in the splenocytes upon HH, but the manuscript does not show that this occurs in the red pulp or RPMs. They also measure gene/protein expression changes in the total spleen and connect them to changes in macrophages, as indicated in the model Figure (Fig. 7). HO-1 and levels of Ferritin (L and H) can be attributed to the drop in RPMs in the spleen. Are any of these changes preserved cell-intrinsically in cultured macrophages? This should be shown to support the model (relates also to lines 487-88, where the authors again speculate that hypoxia decreases HO-1 which was not demonstrated). In the current stage, for example, we do not know if the labile iron increase in cultured cells and in the spleen in vivo upon hypoxia is the same phenomenon, and why labile iron is increased. To improve the manuscript, the authors should study specifically RPMs.
The paper uses flow cytometry, but how this method was applied is suboptimal: there are no gating strategies, no indication if single events were determined, and how cell viability was assessed, which are the parent populations when % of cells is shown on the graphs. How RBCs in the spleen could be analyzed without dedicated cell surface markers? A drop in splenic RPMs is presented as the key finding of the manuscript but Fig. 3M shows gating (suboptimal) for monocytes, not RPMs. RPMs are typically F4/80-high, CD11-low (again no gating strategy is shown for RPMs). Also, the authors used single-cell RNAseq to detect a drop in splenic macrophages upon HH, but they do not indicate in Fig. A-C which cluster of cells relates to macrophages. Cell clusters are not identified in these panels, hence the data is not interpretable).
The authors draw conclusions that are not supported by the data, some examples:
a) they cannot exclude eg the compensatory involvement of the liver in the RBCs clearance (the differences between HH sham and HH splenectomy is mild in Fig. 2 E, F and G)
b) splenomegaly is typically caused by increased extramedullary erythropoiesis, not RBC retention. Why do the authors support the second possibility? Related to this, why do the authors conclude that data in Fig. 4 G,H support the model of RBC retention? A significant drop in splenic RBCs (poorly gated) was observed at 7 days, between NN and HH groups, which could actually indicate increased RBC clearance capacity = less retention.
c) lines 452-54: there is no data for decreased phagocytosis in vivo, especially in the context of erythrophagocytosis. This should be done with stressed RBCs transfusion assays, very good examples, like from Youssef et al. or Threul et al. are available in the literature.
d) Line 475 - ferritinophagy was not shown in response to hypoxia by the manuscript, especially that NCOA4 is decreased, at least in the total spleen.
In a few cases, the authors show only representative dot plots or histograms, without quantification for n>1. In Fig. 4B the authors write about a significant decrease (although with n=1 no statistics could be applied here; of note, it is not clear what kind of samples were analyzed here). Another example is Fig. 6I. In this case, it is even more important as the data are conflicting the cited article and the new one: PMCID: PMC9908853 which shows that hypoxia stimulates efferocytosis. Sometimes the manuscript claim that some changes are observed, although they are not visible in representative figures (eg for M1 and M2 macrophages in Fig. 3M)
There are several unclear issues in methodology:
- what is the purity of primary RPMs in the culture? RPMs are quantitatively poorly represented in splenocyte single-cell suspensions. This reviewer is quite skeptical that the processing of splenocytes from approx 1 mm3 of tissue was sufficient to establish primary RPM cultures. The authors should prove that the cultured cells were indeed RPMs, not monocyte-derived macrophages or other splenic macrophage subtypes.
- (around line 183) In the description of flow cytometry, there are several missing issues. In 1) it is unclear which type of samples were analyzed. In 2) it is not clear how splenocyte cell suspension was prepared.
- In line 192: what does it mean: 'This step can be omitted from cell samples'?
- 'TO method' is not commonly used anymore and hence it was unclear to this Reviewer. Reticulocytes should be analyzed with proper gating, using cell surface markers.
- The description of 'phagocytosis of E. coli and RBCs' in the Methods section is unclear and incomplete. The Results section suggests that for the biotinylated RBCs, phagocytosis? or retention? Of RBCs was quantified in vivo, upon transfusion. However, the Methods section suggests either in vitro/ex vivo approach. It is vague what was indeed performed and how in detail. If RBC transfusion was done, this should be properly described. Of note, biotinylation of RBCs is typically done in vivo only, being a first step in RBC lifespan assay. The such assay is missing in the manuscript. Also, it is not clear if the detection of biotinylated RBCs was performed in permeablized cells (this would be required). -
