Diversity and functional specialization of oyster immune cells uncovered by integrative single-cell level investigations
Curation statements for this article:-
Curated by eLife

eLife Assessment
The manuscript by de La Forest Divonne et al. offers an important and detailed exploration of the immune cells in the oyster Crassostrea gigas, by correlating distinct hemocyte morphotypes with specific single-cell transcriptional profiles. The evidence supporting the conclusion is convincing, deriving from the comprehensive dataset that not only captures unicellular diversity but also associates these cells with distinct immune roles, making it an invaluable resource for the broader research community.
This article has been Reviewed by the following groups
Discuss this preprint
Start a discussion What are Sciety discussions?Listed in
- Evaluated articles (eLife)
Abstract
Mollusks are a major component of animal biodiversity and play a critical role in ecosystems and global food security. The Pacific oyster, Crassostrea (Magallana) gigas , is the most farmed bivalve mollusk in the world and is becoming a model species for invertebrate biology. Despite the extensive research on hemocytes, the immune cells of bivalves, their characterization remains elusive. Here, we were able to extensively characterize the diverse hemocytes and identified at least seven functionally distinct cell types and three hematopoietic lineages. A combination of single-cell RNA sequencing, quantitative cytology, cell sorting, functional assays, and pseudo-time analyses was used to deliver a comprehensive view of the distinct hemocyte types. This integrative analysis enabled us to reconcile molecular and cellular data and identify distinct cell types performing specialized immune functions, such as phagocytosis, reactive oxygen species production, copper accumulation, and expression of antimicrobial peptides. This study emphasized the need for more in depth studies of cellular immunity in mollusks and non-model invertebrates and set the ground for further comparative immunology studies at the cellular level.
Article activity feed
-

-
-

eLife Assessment
The manuscript by de La Forest Divonne et al. offers an important and detailed exploration of the immune cells in the oyster Crassostrea gigas, by correlating distinct hemocyte morphotypes with specific single-cell transcriptional profiles. The evidence supporting the conclusion is convincing, deriving from the comprehensive dataset that not only captures unicellular diversity but also associates these cells with distinct immune roles, making it an invaluable resource for the broader research community.
-
Reviewer #1 (Public review):
Summary
In this manuscript, De La Forest Divonne et al. build a repertory of hemocytes from adult Pacific oysters combining scRNAseq data with cytologic and biochemical analyses. Three categories of hemocytes were described previously in this species (i.e. blast, hyalinocyte and granulocytes). Based on scRNAseq data, the authors identified 7 hemocyte clusters presenting distinct transcriptional signatures. Using Kegg pathway enrichment and RBGOA, the authors determined the main molecular features of the clusters. In parallel, using cytologic markers, the authors classified 7 populations of hemocytes (i.e. ML, H, BBL, ABL, SGC, BGC, and VC) presenting distinct sizes, nucleus sizes, acidophilic/basophilic, presence of pseudopods, cytoplasm/nucleus ratio and presence of granules. Then, the authors compared the …
Reviewer #1 (Public review):
Summary
In this manuscript, De La Forest Divonne et al. build a repertory of hemocytes from adult Pacific oysters combining scRNAseq data with cytologic and biochemical analyses. Three categories of hemocytes were described previously in this species (i.e. blast, hyalinocyte and granulocytes). Based on scRNAseq data, the authors identified 7 hemocyte clusters presenting distinct transcriptional signatures. Using Kegg pathway enrichment and RBGOA, the authors determined the main molecular features of the clusters. In parallel, using cytologic markers, the authors classified 7 populations of hemocytes (i.e. ML, H, BBL, ABL, SGC, BGC, and VC) presenting distinct sizes, nucleus sizes, acidophilic/basophilic, presence of pseudopods, cytoplasm/nucleus ratio and presence of granules. Then, the authors compared the phenotypic features with potential transcriptional signatures seen in the scRNAseq. The hemocytes were separated in a density gradient to enrich for specific subpopulations. The cell composition of each cell fraction was determined using cytologic markers and the cell fractions were analysed by quantitative PCR targeting major cluster markers (two per cluster). With this approach, the authors could assign cluster 7 to VC, cluster 2 to H, and cluster 3 to SGC. The other clusters did not show a clear association with this experimental approach. Using phagocytic assays, ROS, and copper monitoring, the authors showed that ML and SGC are phagocytic, ML produces ROS, and SGC and BGC accumulate copper. Then with the density gradient/qPCR approach, the authors identified the populations expressing anti-microbial peptides (ABL, BBL, and H). At last, the authors used Monocle to predict differentiation trajectories for each subgroup of hemocytes using cluster 4 as the progenitor subpopulation.
The manuscript provides a comprehensive characterisation of the diversity of circulating immune cells found in Pacific oysters.
Strengths
The combination of scRNAseq, cytologic markers and gradient based hemocyte sorting offers an integrative view of the immune cell diversity.
Hemocytes represent a very plastic cell population that has key roles in homeostatic and challenged conditions. Grasping the molecular features of these cells at the single-cell level will help understand their biology.
This type of study may help elucidate the diversification of immune cells in comparative studies and evolutionary immunology.Weaknesses
Several figures show inconsistency leading to erroneous conclusions and some conclusions are poorly supported. Moreover, the manuscript remains highly descriptive with limited comparison with the available literature.
Comments on revisions:
The authors replied to most comments.
-
Author response:
The following is the authors’ response to the previous reviews
Reviewer #1 (Recommendations for the authors):
Major comments
(1) Line 201: The threshold of 0.25 was maintained to select enriched genes, which minimize the value of the GO term enrichment analyses. It may notably explain why the term phagosome is enriched in cluster 7, while experimental data indicate that cluster 7 is not phagocytic. In addition, the authors mentioned in the 1st response to reviewer that they would include DotPlot to illustrate the specificity of the genes corresponding to the main GO terms. This should notably include the ribosomal genes found enriched in cluster 4, which constitute the basis used by the authors to call cluster 4 the progenitor cluster.
We appreciate the reviewer’s concern regarding our chosen log2FC threshold (0.25) …
Author response:
The following is the authors’ response to the previous reviews
Reviewer #1 (Recommendations for the authors):
Major comments
(1) Line 201: The threshold of 0.25 was maintained to select enriched genes, which minimize the value of the GO term enrichment analyses. It may notably explain why the term phagosome is enriched in cluster 7, while experimental data indicate that cluster 7 is not phagocytic. In addition, the authors mentioned in the 1st response to reviewer that they would include DotPlot to illustrate the specificity of the genes corresponding to the main GO terms. This should notably include the ribosomal genes found enriched in cluster 4, which constitute the basis used by the authors to call cluster 4 the progenitor cluster.
We appreciate the reviewer’s concern regarding our chosen log2FC threshold (0.25) for GO term enrichment. To assess the robustness of our approach, we tested more stringent thresholds (e.g., 0.5) and verified that our overall interpretations remain consistent. However, we acknowledge that certain GO terms, such as phagosome, may appear in clusters that are not primarily phagocytic. This is likely due to the fact that genes involved in vesicle trafficking, endo-lysosomal compartments and intracellular degradation processes overlap with those classically associated with phagocytosis.
Therefore, the KEGG-based enrichment of phagosome in cluster 7 does not necessarily imply active phagocytosis but could instead reflect these alternative vesicular processes. As we show, cluster 7 correspond to vesicular cells, and as seen in cytology we named these cells after their very high content of vesicular structures. As functional annotation based solely on transcriptomic data can sometimes lead to overinterpretations, we emphasize the importance of biological validation, which we have partially addressed through functional assays in this study.
Regarding the specificity of ribosomal gene expression in cluster 4, we analyzed the distribution of ribosomal genes expressed across all clusters, as shown in Supplementary Figure S1-J. This analysis demonstrates that cluster 4 is specifically enriched in ribosome-related genes, reinforcing its characterization as a transcriptionally active population. Given that ribosomal gene expression is a key feature often associated with proliferative or metabolically active cells, these findings support our initial interpretation that cluster 4 may represent an undifferentiated or progenitor-like population.
We acknowledge the reviewer’s suggestion to include a DotPlot to further illustrate the specificity of these genes in cluster 4. However, we believe that Supplementary Figure S1-J already effectively demonstrates this enrichment by presenting the percentage of ribosomal genes per cluster. A DotPlot representation would primarily convey the same information in a different format, but without providing additional insight into the specificity of ribosomal gene expression within cluster 4.
(2) The lineage analysis is highly speculative and based on weak evidences. Initiating the hemocyte lineage to C4 is based on rRNA expression levels. C6 would constitute a better candidate, notably with the expression of PU-1, ELF2 and GATA3 that regulate progenitors differentiation in mammals (doi: 10.3389/fimmu.2019.00228, doi:10.1128/microbiolspec.mchd-0024-2, doi: 10.1098/rsob.180152) while C4 do not display any specific transcription factors (Figure 7I). In addition, the representation and interpretation of the transcriptome dynamics in the different lineages are erroneous. There are major inconsistencies between the data shown in the heatmaps Fig7C-H, Fig S10 and the dotplot in Fig7I. For example, Gata3 (G31054) and CgTFEB (G30997) illustrate the inconsistency. Fig S10C show GATA3 going down from cluster 4 to cluster 6 while Fig 7I show an increase level of expression in 6 compared to 4. CgTFEB (G30997) decrease from C4 to VC in Fig 7F while it increases according to Fig 7I. At last, Figure 7D: the umap show transition from C4 to C5 while the heatmap mention C4 to C6 (I believe there is a mix up with Figure 7E.
We sincerely apologize for the inconsistencies noted between the different panels of Figure 7. These discrepancies resulted from using an incorrect matrix dataset during the initial representation. To address this issue, we have fully reprocessed the data and now provide a corrected and improved depiction of gene expression dynamics along the pseudotime trajectory. We are grateful to the reviewer for having help us to correct theses mistakes.
In the revised version, we offer a comprehensive and consistent representation of expression level variations for key genes identified by the Monocle3 algorithm. Supplementary Figure S10 now presents the average expression variation of these significant genes as a function of pseudotime. Based on this dataset, we carefully selected representative genes to construct panels C to H of Figure 7, ensuring coherence across all figures. These updated panels show both average expression levels and the percentage of expressing cells along the pseudotime trajectory, providing a clearer interpretation of transcriptomic dynamics.
We appreciate the reviewer’s helpful feedback regarding our lineage analysis and the suggestion that cluster 6 might be a more appropriate progenitor based on the expression of mammalian-like transcription factors such as PU-1, ELF2, and GATA3. Below, we clarify our rationale for choosing cluster 4 as the root of the pseudotime and discuss the functional implications of the identified transcription factors.
We can hypothesize that clusters 4, 5, or 6 could each potentially represent early progenitor-like states, as these three clusters are transcriptionally close (Lines 539-541). These clusters have not yet been conclusively identified in terms of classical hemocyte morphology, and they appear to arise from ABL- or BBL-type cells. Our decision to root the pseudotime at cluster 4 was motivated by its strong expression of core transcription and translation genes, suggesting a particular stage of translation activity that was not observed for cluster 5 or cluster 6. Cluster 5 and 6 may correspond to a similar population of cells, most probably Blast-Like cells at different stages of cell cycle or differentiation engagement.
Although cluster 6 expresses PU-1, ELF2, and GATA3, which are known regulators of haematopoietic progenitor differentiation in vertebrates, it is essential to highlight that structural homology does not necessarily imply functional equivalence. Moreover, the expression of PU-1, ELF2, and GATA3 does not strictly characterize a population as “undifferentiated” or progenitor-like. Studies such as those by Buenrostro et al. (Cell, 2018) have demonstrated that these transcription factors can remain active in or reemerge during more lineage-committed stages. For instance, PU-1 is essential for myeloid and B-cell differentiation, GATA3 is involved in T-lymphocyte lineage commitment (though transiently expressed in early progenitors), and ELF2 participates in lineage-specific pathways. Thus, their presence does not imply a primitive state but rather highlights their broader functional roles in guiding and refining lineage decisions. Functional annotation of these transcription factors in invertebrate systems remains speculative, particularly as morphological or molecular markers specific to these early hemocyte lineages are not yet fully established. Further functional assays (e.g., knockdown/overexpression or lineage tracing using cells (ABL and BBL) from clusters 4, 5 and 6) will be necessary to determine which hemocyte population harbor progenitor properties and differentiation potential.
To further address the reviewer’s concern, we performed complementary pseudotime analyses by initiating Monocle 3 trajectories from clusters 4, 5, and 6 individually, as well as collectively (4/5/6). These analyses (see attached figure) confirm that the overall differentiation topology remains unchanged regardless of the selected root, consistently revealing two main pathways: one leading to hyalinocytes and the other to the granular lineage (ML, SGC, and VC). This consistency strongly suggests that clusters 4, 5, and 6 represent related pools of progenitor-like cells. Therefore, choosing cluster 4 based on its transcription/translation readiness does not alter the inferred branching architecture of hemocyte differentiation.
We appreciate the reviewer’s suggestions, which have helped us improve our manuscript and clarify our rationale.
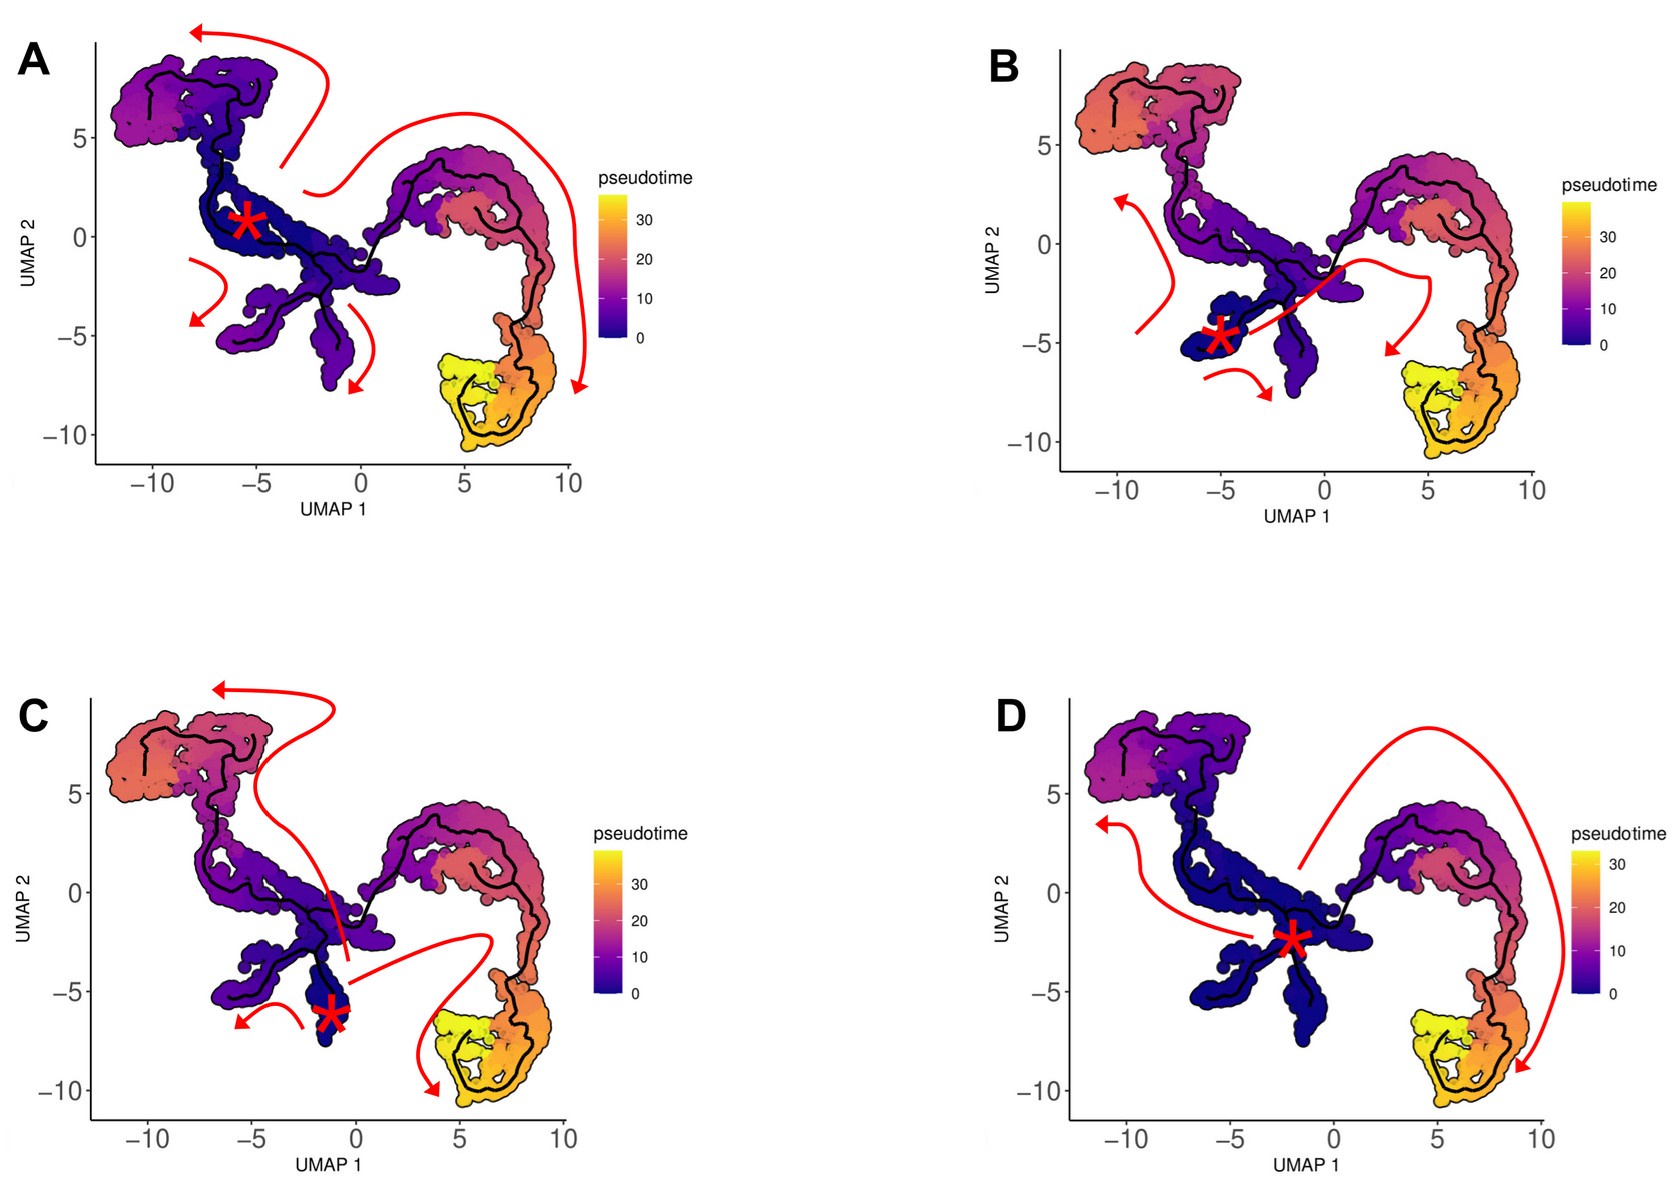
Author response image 1.
Representation of the trajectories obtained from Monocle3 analysis using different pseudotime origins, showing that changing the rooting did not alter the overall differentiation topology. (A) Pathways identified with cluster 4, (B) cluster 5, (C) cluster 6, and (D) cluster 4/5/6 origins.
(3) Concerning the AMP expression analysis in Figure 6: the qPCR data show that Cg-BPI and Cg-Defh are expressed broadly in all fractions including 6 and 7, which is in conflict with the statement Line 473 indicating that SGC (fractions 6 and 7) is not expressing AMP. In addition, this analysis should be combined with the expression profile of all AMP in the scRNAseq data (list available in 10.1016/j.fsi.2015.02.040).
We thank the reviewer for highlighting this point. We acknowledge that the qPCR data show expression of Cg-BPI and Cg-Defh across all fractions, including fractions 6 and 7 corresponding to SGC. However, our conclusion that SGCs do not express antimicrobial peptides (AMPs) was based on a correlation analysis rather than direct detection of AMPs in granular cells. Specifically, the qPCR experiments were designed to measure AMP expression levels in fractionated hemocyte populations relative to a control sample of whole hemolymph. We then performed a correlation analysis between AMP expression levels and the proportion of each hemocyte type in the fractions. This approach allowed us to infer a lower expression of AMP in granular cells, as reflected in the heatmap presented in Figure 6.
Regarding the suggestion to integrate AMP expression profiles from scRNA-seq data, we wrote that the limited sequencing depth of our scRNA-seq analysis was insufficient to accurately detect AMP expression (Ligne 472-473 → “However, due to the limited sequencing depth, the scRNA-seq analysis was not sensitive enough to reveal AMP expression.”. Additionally, many of the known AMPs of Crassostrea gigas are not annotated in the genome, further complicating their identification within the scRNA-seq dataset. As a result, we were unable to perform the requested integration of AMP expression profiles from scRNA-seq data.
(4) The transcription factor expression analysis is descriptive and the interpretation too partial. These data should be compared with other systems. Most transcription factors show functional conservation, notably in the inflammatory pathways, which can provide valuable information to understand the function of the clusters 5 and 6 for which limited data are available.
We appreciate the reviewer’s suggestion to compare the identified transcription factors with other systems. However, since we did not perform a detailed phylogenetic analysis of the transcription factors identified in our dataset, we refrain from making assumptions about their functional conservation across species. Our analysis aims to provide a descriptive overview of transcription factor expression patterns in hemocyte clusters, which serves as a foundation for future functional studies. While transcription factor profiles may provide insights into the potential roles of clusters 5 and 6, assigning precise functions based solely on bioinformatic predictions remains speculative. Further experimental validation, including functional assays and evolutionary analyses, would be necessary to confirm the roles of these transcription factors, which is beyond the scope of the present study.
Minor comments
Line 212-213: the text should be reformulated. In the result part, it is more important to mention that the reannotation is based on conserved proteins functions than to mention the tool Orson.
We have reworded this section to emphasize that the updated annotation is function-based, using Orson primarily as the bioinformatics tool for improved GO annotation. We now place the emphasis on the conserved protein functions underlying the reannotation. Lines 212-215 : “Using the Orson pipeline (see Materials and Methods), these files were used to extract and process the longest CDSs for GO-term annotation, and we then reannotated each predicted protein by sequence homology, assigning putative functions and improving downstream GO-term analyses.”
Figure 2: I would recommend homogenizing the two Dotplot representation with the same color gradient and representing the gene numbers in both case.
We appreciate the reviewer’s suggestion to improve the clarity and consistency of Figure 2. In response, we have homogenized the color gradients across the two DotPlot representations and have included gene numbers in both cases to ensure a more uniform and informative visualization.
Table 2: pct1 and pct2 should be presented individually like in table 1
We now present these columns separately (pct1, pct2) as in Table 1, so readers can compare the fraction of expressing cells in each cluster more transparently.
Line 403-414: how many cells were quantified for the phagocytic experiments ?
We have added the exact number of cells that were counted to determine phagocytic indices and the number of technical/biological replicates. Line 411, the text was modified : “Macrophage-like cells and small granule cells showed a phagocytic activity of 49 % and 55 %, respectively, and a phagocytosis index of 3.5 and 5.2 particles per cell respectively (Fig. 5B and Supp. Fig. 7B), as confirmed in 3 independent experiments examining a total of 2,807 cells.”
Line 458: for copper staining, how many cells and how many replicates were done for the quantification ?
We have specified the number of hemocytes and number of independent replicates used when quantifying rhodanine-stained (copper-accumulating) cells. Line 458 the following text was added : “and a total of 1,562 cells were examined across three independent experiments.”
Line 461: what are the authors referring to when mentioning the link between copper homeostasis and scRNAseq?
Single-cell RNA sequencing (scRNA-seq) analysis revealed an upregulation of several copper transport– related genes, including G4790 (a copper transporter) with a 2.7 log2FC and a pct ratio of 42, as well as the divalent cation transporters G5864 (zinc transporter ZIP10) and G4920 (zinc transporter 8), specifically in cluster 3 cells identified as small granule cells. These findings reinforce a potential role for this cluster in metal homeostasis.
We modified lines 462-467 as : “ These results provide functional evidence that small granule cells (SGCs) are specialized in metal homeostasis in addition to phagocytosis, as suggested by the scRNA-seq data identifying cluster 3. Specifically, single-cell RNA sequencing revealed an upregulation of copper transport– related genes, including G4790 (a copper transporter) with a 2.7 log2FC and a pct ratio of 42, reinforcing the role of SGCs in copper homeostasis (see Supp. File S1).”
Line 611: it would be nice to display the enrichment of the phagocytic receptor in cluster 3 (dotplot or feature plot) to illustrate the comment.
We appreciate the reviewer’s insightful suggestion regarding a more comprehensive analysis of phagocytic receptors. While a full inventory is beyond the scope of this study, we acknowledge the value of such an approach and hope that our findings will serve as a foundation for future investigations in this direction.
Although we have highlighted certain phagocytic receptors (e.g., a scavenger receptor domain-containing gene) in our scRNA-seq dataset, it is beyond the scope of the current study to inventory all phagocytosisrelated receptors in the C. gigas genome, which itself would be a substantial undertaking. Moreover, singlecell RNA sequencing captures only about 15–20% of each cell’s mRNA, so we inherently lose a significant portion of the transcriptome, further limiting our ability to pinpoint all relevant phagocytic receptor genes. Adding more figures to cover every candidate receptor would risk overloading this paper, thus we focus on the most prominent examples. A promising approach for more exhaustive analysis would involve efficiently isolating granulocytes (e.g., via Percoll gradient) and performing targeted RNA-seq on this cell population to thoroughly explore genes involved in phagocytosis.
Line 640-644: the authors mentioned that ML may be able to perform ETosis based on the oxidative burst.
This hypothesis requires further evidences. Are other markers of ETosis expressed in this cell type?
We agree that additional experimental evidence (e.g., detection of histone citrullination, extracellular DNA networks) is necessary to confirm ETosis in molluscan immune cells. We present ML-mediated ETosis only as a speculative possibility based on oxidative burst capacity as it was shown in different pieces of work that ETosis is inhibited by NADPH inhibitors (Poirier et al. 2014). Nevertheless, the expression of histones in the macrophage-like cluster (cluster 1) reinforces this possibility, as histone modifications play a key role in chromatin decondensation during ETosis.
Reviewer #2 (Recommendations for the authors):
Figure 1: In Figure 1B, the cell clusters are named 1 to 7, whereas in Figure 1C they are displayed as clusters 0 to 6. There is a mismatch between the identification of the clusters.
We thank the reviewer for identifying this inconsistency. The cluster numbering has been corrected to ensure consistency between Figures 1B and 1C.
Figure 2B: the font size could be increased for greater clarity.
We thank the reviewer for this suggestion. The font size in Figure 2B has been increased to improve clarity and readability.
Line 221: "Figures 2B, C and D" appears to refer to Figure S2 rather than the main Figure 2.
The text has been corrected to properly reference the figure.
Line 754: "Anopheles gambiae" should be italicised
We thank the reviewer for pointing this out. "Anopheles gambiae" has been italicized accordingly.
Bibliography
Integrated Single-Cell Analysis Maps the Continuous Regulatory Landscape of Human Hematopoietic
Differentiation. Buenrostro, Jason D. et al. Cell, Volume 173, Issue 6, 1535 - 1548.e16
Antimicrobial Histones and DNA Traps in Invertebrate Immunity
Poirier, Aurore C. et al. Journal of Biological Chemistry, Volume 289, Issue 36, 24821 - 24831
-
-
-
eLife Assessment
This manuscript offers an exploration of the immune cells in the oyster Crassostrea gigas, by correlating distinct hemocyte morphotypes with specific single-cell transcriptional profiles. The evidence supporting the conclusion is convincing, deriving from the comprehensive dataset that not only captures unicellular diversity but also associates these cells with distinct immune roles, making it an important resource for the broader research community. There are some concerns on the data presentation that leave some questions.
-
Reviewer #1 (Public review):
Summary
In this manuscript, De La Forest Divonne et al. build a repertory of hemocytes from adult Pacific oysters combining scRNAseq data with cytologic and biochemical analyses. Three categories of hemocytes were described previously in this species (i.e. blast, hyalinocyte and granulocytes). Based on scRNAseq data, the authors identified 7 hemocyte clusters presenting distinct transcriptional signatures. Using Kegg pathway enrichment and RBGOA, the authors determined the main molecular features of the clusters. In parallel, using cytologic markers, the authors classified 7 populations of hemocytes (i.e. ML, H, BBL, ABL, SGC, BGC, and VC) presenting distinct sizes, nucleus sizes, acidophilic/basophilic, presence of pseudopods, cytoplasm/nucleus ratio and presence of granules. Then, the authors compared the …
Reviewer #1 (Public review):
Summary
In this manuscript, De La Forest Divonne et al. build a repertory of hemocytes from adult Pacific oysters combining scRNAseq data with cytologic and biochemical analyses. Three categories of hemocytes were described previously in this species (i.e. blast, hyalinocyte and granulocytes). Based on scRNAseq data, the authors identified 7 hemocyte clusters presenting distinct transcriptional signatures. Using Kegg pathway enrichment and RBGOA, the authors determined the main molecular features of the clusters. In parallel, using cytologic markers, the authors classified 7 populations of hemocytes (i.e. ML, H, BBL, ABL, SGC, BGC, and VC) presenting distinct sizes, nucleus sizes, acidophilic/basophilic, presence of pseudopods, cytoplasm/nucleus ratio and presence of granules. Then, the authors compared the phenotypic features with potential transcriptional signatures seen in the scRNAseq. The hemocytes were separated in a density gradient to enrich for specific subpopulations. The cell composition of each cell fraction was determined using cytologic markers and the cell fractions were analysed by quantitative PCR targeting major cluster markers (two per cluster). With this approach, the authors could assign cluster 7 to VC, cluster 2 to H, and cluster 3 to SGC. The other clusters did not show a clear association with this experimental approach. Using phagocytic assays, ROS, and copper monitoring, the authors showed that ML and SGC are phagocytic, ML produces ROS, and SGC and BGC accumulate copper. Then with the density gradient/qPCR approach, the authors identified the populations expressing anti-microbial peptides (ABL, BBL, and H). At last, the authors used Monocle to predict differentiation trajectories for each subgroup of hemocytes using cluster 4 as the progenitor subpopulation.
The manuscript provides a comprehensive characterisation of the diversity of circulating immune cells found in Pacific oysters.
Strengths
The combination of scRNAseq, cytologic markers and gradient based hemocyte sorting offers an integrative view of the immune cell diversity.
Hemocytes represent a very plastic cell population that has key roles in homeostatic and challenged conditions. Grasping the molecular features of these cells at the single-cell level will help understand their biology.
This type of study may help elucidate the diversification of immune cells in comparative studies and evolutionary immunology.Weaknesses
Several figures show inconsistency leading to erroneous conclusions and some conclusions are poorly supported. Moreover, the manuscript remains highly descriptive with limited comparison with the available literature.
-
Reviewer #2 (Public review):
Summary:
This work provides a comprehensive understanding of cellular immunity in bivalves. To precisely describe the hemocytes of the oyster C. gigas, the authors morphologically characterized seven distinct cell groups, which they then correlated with single-cell RNA sequencing analysis, also resulting in seven transcriptional profiles. They employed multiple strategies to establish relationships between each morphotype and the scRNAseq profile. The authors correlated the presence of marker genes from each cluster identified in scRNAseq with hemolymph fractions enriched for different hemocyte morphotypes. This approach allowed them to correlate three of the seven cell types, namely hyalinocytes (H), small granule cells (SGC), and vesicular cells (VC). A macrophage-like (ML) cell type was correlated through …
Reviewer #2 (Public review):
Summary:
This work provides a comprehensive understanding of cellular immunity in bivalves. To precisely describe the hemocytes of the oyster C. gigas, the authors morphologically characterized seven distinct cell groups, which they then correlated with single-cell RNA sequencing analysis, also resulting in seven transcriptional profiles. They employed multiple strategies to establish relationships between each morphotype and the scRNAseq profile. The authors correlated the presence of marker genes from each cluster identified in scRNAseq with hemolymph fractions enriched for different hemocyte morphotypes. This approach allowed them to correlate three of the seven cell types, namely hyalinocytes (H), small granule cells (SGC), and vesicular cells (VC). A macrophage-like (ML) cell type was correlated through the expression of macrophage-specific genes and its capacity to produce reactive oxygen species. Three other cell types correspond to blast-like cells, including an immature blast cell type from which distinct hematopoietic lineages originate to give rise to H, SGC, VC, and ML cells. Additionally, ML cells and SGCs demonstrated phagocytic properties, with SGCs also involved in metal homeostasis. On the other hand, H cells, non-granular cells, and blast cells expressed antimicrobial peptides. This study thus provides a complete landscape of oyster hemocytes with functional validation linked to immune activities. This resource will be valuable for studying the impact of bacterial or viral infections in oysters.
The main strength of this study lies in its comprehensive and integrative approach, combining single-cell RNA sequencing, cytological analysis, cell fractionation and functional assays to provide a robust characterization of hemocyte populations in Crassostrea gigas.
(1) The innovative use of marker genes, quantifying their expression within specific cell fractions, allows for precise annotation of different cellular clusters, bridging the gap between morphological observations and transcriptional profiles.
(2)The study provides detailed insights into the immune functions of different hemocyte types, including the identification of professional phagocytes, ROS-producing cells, and cells expressing antimicrobial peptides.
(3) The identification and analysis of transcription factors specific to different hemocyte types and lineages offer crucial insights into cell fate determination and differentiation processes in oyster immune cells.
(4) The authors significantly advance the understanding of oyster immune cell diversity by identifying and characterizing seven distinct hemocyte transcriptomic clusters and morphotypes.
These strengths collectively make this study a significant contribution to the field of invertebrate immunology, providing a comprehensive framework for understanding oyster hemocyte diversity and function.
Conclusion:
The authors largely achieved their primary objective of providing a comprehensive characterization of oyster immune cells. They successfully integrated multiple approaches to identify and describe distinct hemocyte types. The correlation of these cell types with specific immune functions represents a significant advancement in understanding oyster immunity. The authors are aware of the limitations of their study, particularly with regards to the pseudotime analysis, which provides a conceptual framework for understanding lineage relationships but requires further experimental validation to confirm its findings.
This study is likely to have a significant impact on the field of invertebrate immunology, particularly in bivalve research. It provides a new standard for comprehensive immune cell characterization in invertebrates. The identification of specific markers for different hemocyte types will facilitate future research on oyster immunity. The proposed model of hemocyte lineages, while requiring further validation, offers a framework for studying hematopoiesis in bivalves.
-
Reviewer #3 (Public review):
The paper addresses pivotal questions concerning the multifaceted functions of oyster hemocytes by integrating single-cell RNA sequencing (scRNA-seq) data with analyses of cell morphology, transcriptional profiles, and immune functions. In addition to investigating granulocyte cells, the study delves into the potential roles of blast and hyalinocyte cells. A key discovery highlighted in this research is the identification of cell types engaged in antimicrobial activities, encompassing processes such as phagocytosis, intracellular copper accumulation, oxidative bursts, and antimicrobial peptide synthesis.
A particularly intriguing aspect of the study lies in the exploration of hemocyte lineages, warranting further investigation, such as employing scRNA-seq on embryos at various developmental stages.
-
Author response:
The following is the authors’ response to the original reviews.
Reviewer #1 (Public review):
Summary:
In this manuscript, De La Forest Divonne et al. build a repertory of hemocytes from adult Pacific oysters combining scRNAseq data with cytologic and biochemical analyses. Three categories of hemocytes were described previously in this species (i.e. blast, hyalinocyte, and granulocytes). Based on scRNAseq data, the authors identified 7 hemocyte clusters presenting distinct transcriptional signatures. Using Kegg pathway enrichment and RBGOA, the authors determined the main molecular features of the clusters. In parallel, using cytologic markers, the authors classified 7 populations of hemocytes (i.e. ML, H, BBL, ABL, SGC, BGC, and VC) presenting distinct sizes, nucleus sizes, acidophilic/basophilic, presence of …
Author response:
The following is the authors’ response to the original reviews.
Reviewer #1 (Public review):
Summary:
In this manuscript, De La Forest Divonne et al. build a repertory of hemocytes from adult Pacific oysters combining scRNAseq data with cytologic and biochemical analyses. Three categories of hemocytes were described previously in this species (i.e. blast, hyalinocyte, and granulocytes). Based on scRNAseq data, the authors identified 7 hemocyte clusters presenting distinct transcriptional signatures. Using Kegg pathway enrichment and RBGOA, the authors determined the main molecular features of the clusters. In parallel, using cytologic markers, the authors classified 7 populations of hemocytes (i.e. ML, H, BBL, ABL, SGC, BGC, and VC) presenting distinct sizes, nucleus sizes, acidophilic/basophilic, presence of pseudopods, cytoplasm/nucleus ratio and presence of granules. Then, the authors compared the phenotypic features with potential transcriptional signatures seen in the scRNAseq. The hemocytes were separated in a density gradient to enrich for specific subpopulations. The cell composition of each cell fraction was determined using cytologic markers and the cell fractions were analysed by quantitative PCR targeting major cluster markers (two per cluster). With this approach, the authors could assign cluster 7 to VC, cluster 2 to H, and cluster 3 to SGC. The other clusters did not show a clear association with this experimental approach. Using phagocytic assays, ROS, and copper monitoring, the authors showed that ML and SGC are phagocytic, ML produces ROS, and SGC and BGC accumulate copper. Then with the density gradient/qPCR approach, the authors identified the populations expressing anti-microbial peptides (ABL, BBL, and H). At last, the authors used Monocle to predict differentiation trajectories for each subgroup of hemocytes using cluster 4 as the progenitor subpopulation.
The manuscript provides a comprehensive characterisation of the diversity of circulating immune cells found in Pacific oysters.
Strengths:
The combination of the two approaches offers a more integrative view.
Hemocytes represent a very plastic cell population that has key roles in homeostatic and challenged conditions. Grasping the molecular features of these cells at the single-cell level will help understand their biology.
This type of study may help elucidate the diversification of immune cells in comparative studies and evolutionary immunology.
Weaknesses:
The study should be more cautious about the conclusions, include further analyses, and inscribe the work in a more general framework.
Reviewer #1 (Recommendations for the authors):
The manuscript provides a comprehensive characterisation of the diversity of circulating immune cells found in Pacific oysters.
Major comments:
(1) The introduction would benefit from a clear description of what is known about immune cell development and diversity in this model. The bibliography on the three subtypes origins and properties (i.e. blast, hyalinocyte, and granulocytes) should be described in the introduction.
We thank Reviewer #1 for their valuable comments, which have allowed us to further improve our manuscript. We have enriched the introduction with the following addition (line 79 to 82):
“Blast-like cells are considered as undifferentiated hemocyte types (20), hyalinocytes (21) seem to be more involved in wound repair, and granulocytes, more implicated in immune surveillance. The latter are considered as the main immunocompetent hemocyte types (22).”
(2) The authors mentioned a previous scRNAseq dataset produced in another oyster species. They should compare the two datasets to show the robustness of the molecular signatures determined in the present study. In addition, the authors do not mention markers identified in the literature that could be relevant to characterize the clusters (e.g. inflammatory pathway PMID: 29751033, proliferative markers PMID: 36591234/ PMID: 29317231, granulocyte markers PMID: 30633961 ... list not exhaustive). Overall, the comparison of this manuscript dataset and the available literature is too partial
We appreciate the reviewer’s suggestion to compare our dataset with previously published scRNAseq data and to integrate markers from the literature. Below, we address these points in detail.
The transcription factors involved in hematopoiesis, such as Tal1, Sox, Runx, and GATA, are highly conserved across metazoans. These markers were identified in our dataset, consistent with findings in other species (1–3), including the previously mentioned scRNA-seq dataset in C. hongkongensis (4). However, defining robust and specific markers for distinct hemocyte types remains an ambitious goal that requires validation across diverse biological contexts - work that is beyond the scope of the present study. Additionally, meaningful comparisons between datasets are constrained by differences in annotation frameworks and the absence of a standardized system for defining hemocyte subtypes. These limitations underscore the need for harmonization efforts to facilitate robust cross-study comparisons. Nonetheless, our dataset provides a strong foundation for future comparative analyses once such standardization is achieved.
In response to the reviewer’s comment, we have added a paragraph to the discussion (lines 747 - 760) detailing that we identified conserved transcription factor markers in C. gigas and C. hongkongensis.
(3) The authors sequenced 3000 cells without providing more comprehensive information/rationale on the analysed population. What is the number of hemocytes found in an adult? What proportion of the whole hemocyte population does this analysis represent? Does it include the tissue-interacting hemocytes? Also, what is the rationale for choosing that specific stage?
We thank the reviewer for their insightful questions regarding the analyzed hemocyte population.
Adult 18-month-old Crassostrea gigas contain approximately 1 million circulating hemocytes per mL of hemolymph, with an average of 1 mL of hemolymph per individual. Thus, this represents approximately 1 million circulating hemocytes per oyster. For our scRNA-seq analysis, we sampled 3,000 hemocytes, which corresponds to 0.3% of the total circulating hemocyte population.
The number of cells processed was optimized to minimize the occurrence of doublets during scRNAseq. Following 10x Genomics Chromium guidelines, we loaded 4,950 cells to successfully recover a target of 3,000 cells, with a doublet rate of 2.4%, well below the target threshold of 2.5%. This information has been added on line 125 of the document. The target was 3,000 cells, and as reported in Supplementary Table S1, the estimated number of cells after STAR-solo alignment was 2,937. This ensures the reliability and accuracy of single-cell transcriptomic data.
We selected 18-month-old oysters for two key reasons: (i) to facilitate hemolymph collection, as hemocyte counts are more stable and sufficient at this stage, enabling us to collect enough cells for all planned experiments, including functional and cytological analyses; and (ii) to use oysters that are not susceptible to OsHV-1 μVar herpesvirus, which predominantly affects younger animals. This ensured that the hemocyte populations analyzed were not influenced by viral infections or related immune responses.
Our study focused on circulating hemocytes collected from hemolymph, which does not include tissue-interacting hemocytes. While these cells may represent an additional population of interest, they fall outside the scope of our current investigation.
By carefully selecting the animal stage and optimizing cell sampling, we ensured that the scRNA-seq dataset provides a robust representation of circulating hemocyte diversity while maintaining high data quality.
(4) For the GO term enrichment analysis, the authors included all genes presenting a cluster enrichment above L2FC>0.25. This seems extremely low to find distinct functions for each cluster. The risk is to call "cluster specific GO term" GO terms for which the genes are poorly enriched in the cluster. For the most important GO term mentioned in the text, the authors should show the expression levels of the genes (with DotPlot similar to Fig1D) to illustrate the specificity of the GO term. At last, the GO enrichment scores were apparently calculated using the whole genome as background. The analysis, aiming at finding differences between hemocyte subgroups, should use the genes detected in the dataset as background.
We appreciate the reviewer's concerns regarding the threshold used for GO term enrichment analysis and the choice of background genes. Below, we provide clarification on these points.
For nuanced comparisons, such as those between activation states of the same cell type, lower thresholds for log2FC (e.g., ≥0.25) are commonly used to detect subtle regulatory shifts. In single-cell RNA sequencing (scRNA-seq) analyses, it is typical to use a log2FC threshold between 0.25 and 0.5 to ensure that biologically relevant, yet subtle, changes are captured. For our analysis, this threshold was chosen to maintain sensitivity to such shifts, particularly given the diversity and functional specialization of hemocyte clusters.
To address the reviewer's suggestion, we will include DotPlot representations (similar to Fig. 1D) for the most significant GO terms highlighted in the text. This will illustrate the expression levels of the associated genes across clusters and demonstrate their specificity to the identified GO terms.
Regarding the background used in the GO enrichment analysis, we employed the Rank Based Gene Ontology Analysis (RBGOA) approach, which explicitly states in its documentation: "It is important to have the latter two tables representing the whole genome (or transcriptome) — at least the portion that was measured — rather than some select group of genes since the test relies on comparing the behavior of individual GO categories to the whole." Our analysis was conducted in agreement with these initial recommendations, ensuring that the results are consistent with the methodology outlined for RBGOA.
(5) The authors reannotated the genes of C. gigas to reach 73.1% annotation. What are the levels of annotations found prior to the reannotation? What do the scores/scale bars from the RBGOA analysis mean in Figures 2B-D?
Thank you for your comment. The original annotation for C. gigas was based on the work of Penaloza et al. (5), which provided GO annotations for 18,750 out of 30,724 genes, corresponding to 61% annotation. Following our reannotation efforts, we were able to increase the annotation coverage to 73.1%, enhancing the resolution of downstream analyses. In response to the reviewer’s comment, we have updated the results section (line 211 and 216) to explicitly include the original annotation coverage of 61% from the work of Penaloza et al., followed by details on our newly achieved annotation percentage of 73.1%.
Thank you for pointing this out. We apologize for the oversight regarding the scale bar in Figures 2BD. The colors in the original figure correspond to a z-score calculated from the gene ratio, which was not clearly explained and may have caused confusion. In the revised version of the manuscript, we propose a new representation to facilitate understanding and improve the clarity of the data presentation (Figure 2B).
(6) The authors describe first the result of the Kegg enrichment analysis and then of the RBGOA. To gain fluidity, I would suggest merging the results of both Kegg and RBGOA for each cluster.
Thank you for the suggestion. To enhance the fluidity of the results section, we have redesigned the KEGG/RBGOA figure (see figure 2A and 2B) to present the results for each cluster in an integrated manner. This revised approach aims to provide a clearer and more cohesive representation of the findings.
(7) The authors make correlations between gradient fraction containing multiple hemocyte populations and qPCR expression levels of cluster-specific markers to associated cytologic features with specific clusters. If feasible, I would recommend validating the association of several markers with hemocyte subgroups using in situ hybridisation or immunolabelling.
Cytological identification of hemocytes in our study relies on MCDH staining, which provides detailed morphological and cytological information. Unfortunately, the fixation methods required for in situ hybridization (ISH) or immunolabeling are not compatible with those used for MCDH staining. We attempted to combine these approaches but found that the fixation protocols necessary for ISH or immunolabeling compromised the quality of the cytological features observed with MCDH staining. Consequently, such validation was not feasible within the constraints of our experimental setup.
(8) Anti-microbial peptides are mentioned as enriched in agranular cells based on the gradient/qPCR analysis (Figure 6). Are these AMPs regulated by inflammatory pathways? Are any inflammatory pathways enriched in any scRNAseq cluster? In addition, without validating the data by directly labelling AMP in the different populations, it seems hard to conclude that AMP are expressed only by agranular cells.
In oysters, two families of antimicrobial peptides/proteins appear to be transcriptionally regulated in hemocytes in response to an infection. The first is that of Cg-BigDefs (6). A 2020 article indicates that the expression of CgBigDef1 is regulated by CgRel, an ortholog of the NFkB transcription factor, which also control the expression of the proinflammatory cytokine CgIL17 (7). Cg-BPI is induced in response to infection but its regulatory pathways remain unknown (8). The last well characterized family of antimicrobial peptides is Cg-Defs. It exhibits constitutive expression in hemocytes.
In our scRNA-seq analysis, CgRel (G12420) shows an increased expression in cluster 5, with a log2FC of 0.4 (equivalent to a 1.32-fold change or 32% higher expression compared to other clusters). Cluster 5 corresponds to blast-like cells, which are transcriptionally distinct and predominantly found in fractions 1, 2, and 3. These same fractions exhibit the highest CgBigDef expression, as demonstrated by qPCR.
From our qPCR results, we see no expression of the three AMP families in cell-sorted granular cells while the cell-sorted agranular cells are positive for the three AMP families, even for inducible ones. Still, we agree that labelling of cell sorted hemocyte populations would reinforce our data. We now specify in the text that further staining would be necessary to confirm these transcriptomic results (Discussion, lines 695 to 296).
(9) The authors should play down some statements concerning cluster identity. In the absence of a true lineage tracing approach, it is possible that those clusters represent states rather than true cell subtypes. Immune cells are very plastic in nature and able to adapt to the environment, even in conditions that are considered homeostatic.
We appreciate the reviewer’s insightful comment regarding the plasticity of immune cells and the potential for clusters to represent states rather than distinct cell subtypes. We agree that, in the absence of a lineage tracing approach, definitive classification of clusters as fixed subtypes is challenging. Immune cells, including those in invertebrates, are known for their high degree of plasticity and adaptability to environmental cues.
In response to the reviewer’s comment, we have revised the Discussion section to include a statement clarifying that these clusters may represent dynamic states rather than fixed subtypes, thereby acknowledging the plasticity of immune cells (lines 766 to 770).
(10) Related to the above issue, there is no indication of stem cells being present in the cell population. Is there any possibility to look for proliferative or progenitor markers? In homeostatic and in challenged conditions (for example Zymosan treatment)? This would provide some hints into the cellular pathways involved in the response. Perhaps determining the number/fraction of phagocytic cells in challenged conditions would help as well, in the absence of time-lapse assays.
Thank you for highlighting the possibility of stem cells or progenitor markers in our hemocyte populations. In our current analysis, we did not detect any known stem cell or proliferative markers, nor evidence of a clearly defined hematopoiesis site in the hemolymph. Indeed, previous work suggests that oyster hematopoiesis may occur in tissues such as the gills, implying that stem or progenitor cells might not circulate in the hemolymph under homeostatic conditions. Consequently, it is plausible that our observation of no proliferative cell populations partly reflects their absence in hemolymph, especially in naïve (unstimulated) oysters. To conclusively identify potential progenitor cells and their proliferative activity, further approaches involving deliberate perturbation of hemocyte homeostasis - such as immunological challenge (e.g., Zymosan treatment) combined with lineagetracing or proliferation assays - would be necessary. These future investigations would not only clarify whether proliferative cells emerge in the hemolymph in response to environmental or pathological stimuli but also help elucidate the broader cellular pathways underlying oyster immune responses.
In response to the reviewer’s comment, we have revised the Discussion (lines 742 to 745) and added : “Nevertheless, we did not detect any canonical stem or progenitor cell populations in our dataset, underscoring the need for future investigations - potentially involving immunological challenges and lineage-tracing assays - to clarify whether proliferative cells circulate in the hemolymph or instead reside primarily in tissue compartments.”
(11) Could the authors discuss the phagocytic hemocytes in light of scavenger receptor expression?
We thank the reviewer for this insightful question. Our study identifies macrophage-like cells and small granule cells as the principal phagocytes in Crassostrea gigas, capable of robust pathogen engulfment. Transcriptomic data reveal that these cell types express markers associated with endocytosis and immune defense pathways, such as CLEC and LACC24, which are integral to their phagocytic functionality.
Interestingly, our single-cell RNA sequencing analysis indicates that cluster 3, corresponding to small granule cells, expresses the scavenger receptor cysteine-rich (SRCR) gene G3876, annotated as an Low-density lipoprotein receptor-related protein with a Log2 fold change (Log2FC) of 0.77. This finding directly links small granule cells to scavenger receptor-mediated functions, supporting their role as professional phagocytes. Scavenger receptors, including SRCR proteins, are known for their ability to bind and internalize diverse ligands, including pathogens, and their presence in small granule cells highlights a potential mechanism for pathogen recognition and clearance.
Additionally, scavenger receptors are significantly expanded in oysters, as shown in Wang et al. (9). These receptors exhibit dynamic upregulation in hemocytes upon pathogen exposure, particularly following stimulation with pathogen-associated molecular patterns (PAMPs) such as lipopolysaccharide (LPS). This evidence suggests that SRCR proteins, including the one identified in our study, play a pivotal role in the phagocytic activities of hemocytes by facilitating pathogen recognition and internalization.
We propose to add this paragraph (lines 610 to 618) in the Discussion : “Interestingly, our scRNA-seq analysis indicates that SGC (cluster 3) expresses the scavenger receptor cysteine-rich (SRCR) gene G3876, annotated as an Low-density lipoprotein receptor-related protein with a Log2 fold change (Log2FC) of 0.77 linking them to scavenger receptor-mediated pathogen recognition and clearance. This aligns with findings by Wang et al. (9), who demonstrated significant expansion and dynamic regulation of SRCR genes in response to pathogen-associated molecular patterns. “
(12) I am not convinced by the added value of the lineage analysis and the manuscript could stand without it. There is no experimental validation to substantiate the filiation between the clusters. In addition, rooting the lineage to cluster 4 is poorly justified (enrichment in the ribosomal transcript). Cluster 6 is also enriched in ribosomal transcripts and this enrichment can be caused by the low threshold used for the selection of cluster-specific genes (L2FC >0.25). At last, cluster 4 > VC and cluster 4 >SGC belong to the same lineage according to Figure 7 FH.
We thank the reviewer for their detailed comments regarding the lineage analysis. We acknowledge the limitations in experimentally validating the proposed filiation between clusters, as hemocytes in Crassostrea gigas cannot currently be cultivated ex-vivo, and we lack the ability to isolate cells specifically from cluster 4 for further functional assays. Consequently, our lineage analysis is based solely on transcriptomic data and pseudo-time trajectory analysis.
Hematopoietic stem cells (HSCs) are a population of stem cells that are largely cell-cycle-quiescent (G0 phase) with low biosynthetic activity. Upon stimulation and stress HScs undergo proliferation and differentiation and produce all lineages of hemocytes.
Ribosomal proteins play a multifaceted role in preserving the balance between stem cell quiescence and activation. By ensuring precise regulation of protein synthesis, they allow stem cells to maintain their undifferentiated state while remaining poised for activation when needed. Furthermore, ribosomal proteins contribute to the cellular stress response, safeguarding stem cells from oxidative damage and other stressors that could compromise their functionality. Importantly, ribosomal biogenesis and the dynamic assembly of ribosomes provide a regulatory mechanism that fine-tunes the transition from self-renewal to differentiation, a critical feature of hematopoietic stem cells (HSCs) and other stem cell types. These mechanisms collectively highlight the indispensable role of ribosomal proteins in stem cell biology, underscoring their relevance to our study's findings.
In vertebrate, the maintenance of hematopoietic stem cells (HSCs) and hematopoietic homeostasis is widely acknowledged to rely on the proper regulation of ribosome function and protein synthesis (10). This process necessitates the coordinated expression of numerous genes, including genes that encode ribosomal proteins (RP genes) and those involved in regulating ribosome biogenesis and protein translation. Disruptions or mutations in these critical genes are associated with the development of congenital disorders (11). Among these, Rpl22 (found in cluster 4 with a Log2FC of 1.59) has been shown to play a pivotal role in HSC maintenance by balancing ribosomal protein paralog activity, which is critical for the emergence and function of HSCs (12).
Regarding the justification for rooting the lineage to cluster 4, our decision was informed by the enrichment of ribosomal transcripts and functional annotations suggesting a role in translation and cell proliferation, consistent with a precursor-like state. The use of a log2 fold-change (L2FC) threshold of >0.25, while conservative, allowed us to include subtle but meaningful transcriptional shifts essential for resolving lineage transitions.
Finally, the lineage progression from cluster 4 to vesicular cells (VC), macrophage-like cells (ML), and ultimately small granule cells (SGC) is supported by trajectory analysis (Figure 7FH), which consistently places VC and ML as intermediates in the differentiation process toward SGC. Although experimental validation is currently not feasible, these findings provide a conceptual framework for future investigations when cell isolation and functional validation tools become available.
(13) The figures containing heatmaps (Figure 7, Figure 2, Figure S10) or too many subpanels (Figure S5) and Table S5 are hardly readable.
Thank you for highlighting the issues related to the clarity of the heatmaps (Figures 2, 7, and S10), the multi-panel figure (Figure S5), and Table S5. In response to your feedback, we have revised all of these elements to enhance readability and comprehension. Specifically, we increased font sizes, optimized color scales, and reorganized the layout of the subpanels to emphasize the key findings. We also updated Table S5 to ensure that the data are presented in a clear and easily interpretable format.
We trust that these modifications address the concerns raised and improve the overall clarity of the figures and table.
(14) A number of single-cell analyses are now available in different species and the authors allude to similar pathways/transcription factors being involved. Perhaps the authors could expand on this in the discussion section.
Transcription factors involved in hematopoiesis, such as Tal1, Runx and GATA, are highly conserved across metazoans. Consistent with findings in other species, our dataset identifies these markers, reinforcing the evolutionary conservation of these pathways. Furthermore, these markers are also reported in the previous scRNA-seq dataset for C. hongkongensis (4), supporting the robustness of our molecular signatures. However, defining specific and robust markers for distinct hemocyte types remains an ambitious task, requiring additional validation in diverse biological and experimental contexts. This validation is beyond the scope of the present study.
In addition, meaningful comparisons between scRNA-seq datasets are constrained by differences in annotation frameworks and the absence of standardized definitions for hemocyte subtypes. Harmonizing these datasets to enable robust cross-species comparisons is a critical challenge for future studies. Nonetheless, the insights provided by our dataset establish a strong foundation for such comparative analyses when these standardization efforts are realized.
In crayfish (1), 16 transcriptomic clusters were identified corresponding to three hemocyte types, with markers such as integrin prominently expressed in hyalinocytes, consistent with our identification of integrin-related genes in hemocytes. In shrimp (1), 11 transcriptomic clusters were described, with markers of hemocytes in immune-activated states, that we observed also in our dataset. For Anopheles gambiae (2), 8 transcriptomic clusters were identified, including clusters with high ribosomal activity, analogous to those we described in our study. Finally, in Bombyx mori (3), 20 transcriptomic clusters were reported, corresponding to five cytological hemocyte types. Transcription factors such as bHLH, myc, and runt were identified in granulocytes and oenocytoid, showing parallels with markers identified in our dataset.
Despite these similarities, cross-species comparisons are hindered by variability in genome availability and annotation quality, which complicates the precise identification and functional characterization of genes across datasets. Notably, we did not detect pro-phenoloxidase genes in our dataset, unlike shrimp and crayfish, suggesting potential species-specific differences in immune mechanisms.
Regarding the previously published C. hongkongensis scRNA-seq dataset (4), we observe overlap in markers such as runx and GATA. However, direct comparisons remain limited due to differences in dataset annotations and definitions of hemocyte subtypes. This underscores the need for standardized frameworks to facilitate cross-study comparisons. While we emphasize that robust cross-species validation was beyond the scope of this study, our findings contribute valuable insights into the molecular signatures of oyster hemocytes and provide a framework for future comparative research.
We have expanded our discussion to include comparisons with available scRNAseq data from other invertebrate specie (lines 747 to 760)
Minor comments:
(1) Figure 2A-D: to increase the readability of the figure, the authors should display only the GO terms mentioned in the text and keep the full list in supplementary data.
To enhance the fluidity of the results section, we have redesigned the KEGG/RBGOA figure to present the results for each cluster in an integrated manner (See figure 2A and 2B).
(2) Line 223: the authors mention that cluster 1 is characterized by its morphology without providing an explanation or evidence.
We have revised the description of Cluster 1 to remove references to morphology, ensuring consistency with the data presented at this stage of the manuscript (lines 227 to 229) : ”Cluster 1, comprising 27.6 % of cells, is characterized by GO-terms related to myosin complex, lamellipodium, membrane and actin cytoskeleton remodelling, as well as phosphotransferase activity.”
(3) Line 306: the authors mentioned expression levels and associated them with Log2FC, which represents an enrichment, not the level of expression.
Thank you for pointing this out. We agree that log2FC represents enrichment rather than absolute expression levels. We have revised the text in the manuscript to clarify this distinction (line 309). The corrected text now states that log2FC reflects the degree of enrichment or depletion of a gene in a specific cluster relative to others, rather than its absolute expression level.
(4) Figure 4B: the figure shows the distribution of all hemocytes subgroups for each fraction. To better appreciate the distribution of the subgroups in the different fractions, it would be good to have the number of cells of each subtype in the fractions.
We thank the reviewer for their suggestion to include the number of cells of each subtype in the fractions. While we do not have the exact total number of cells per fraction, we systematically performed hemocyte counts for each fraction as part of our methodology. These counts provide a robust estimation of hemocyte distributions across fractions.
Including these counts in the figure could be an alternative approach; however, we believe it would not significantly enhance the interpretability of the data, as the focus of this analysis is on the relative proportions of hemocyte subtypes rather than absolute numbers. The current representation provides a clear and concise overview of subtype distribution patterns, which aligns with the goals of the study.
Nevertheless, if the reviewer considers it essential, we are open to integrating the hemocyte counts into the figure or supplementing the information in the text or supplementary materials to provide additional context.
(5) Line 487-488: the authors mentioned that monocle 3 can deduce the differentiation pathway from the mRNA splice variant. I did not find this information in the publication associated with the statement.
Thank you for pointing this out. We acknowledge the inaccuracy in our statement regarding Monocle3's capabilities. Monocle3 does not deduce differentiation pathways based on mRNA splice variants, as was erroneously suggested in the manuscript. Instead, Monocle3 performs trajectory inference using gene expression profiles. It calculates distances between cells based on their transcriptomic profiles, where cells with similar profiles are positioned closer together, and those with distinct profiles are farther apart. This method enables the construction of potential differentiation trajectories by identifying paths between transcriptionally related cells.
We revise the text in the manuscript to accurately describe this process and remove the incorrect reference to mRNA splice variants (lines 495 to 497).
(6) Figures 6C-H display heatmaps with two columns representing the beginning and the end of the lineage predicted. It would be more talkative to show the whole path presented in Figure S10.
Thank you for pointing out that Figures 7C–H currently only show the beginning and end of the predicted lineage, limiting the clarity of the intermediate stages. In response to your suggestion, we have revised these figures to include the full trajectory as presented in Figure S10, ensuring that the intermediate transitions are more clearly visualized. We believe these modifications offer a more comprehensive overview of the entire lineage and enhance the interpretability of our results.
Bibliography:
(1) F. Xin, X. Zhang, Hallmarks of crustacean immune hemocytes at single-cell resolution. Front. Immunol. 14 (2023).
(2) H. Kwon, M. Mohammed, O. Franzén, J. Ankarklev, R. C. Smith, Single-cell analysis of mosquito hemocytes identifies signatures of immune cell subtypes and cell differentiation. eLife 10, e66192 (2021).
(3) M. Feng, L. Swevers, J. Sun, Hemocyte Clusters Defined by scRNA-Seq in Bombyx mori: In Silico Analysis of Predicted Marker Genes and Implications for Potential Functional Roles. Front. Immunol. 13 (2022).
(4) J. Meng, G. Zhang, W.-X. Wang, Functional heterogeneity of immune defenses in molluscan oysters Crassostrea hongkongensis revealed by high-throughput single-cell transcriptome. Fish & Shellfish Immunology 120, 202–213 (2022).
(5) C. Peñaloza, A. P. Gutierrez, L. Eöry, S. Wang, X. Guo, A. L. Archibald, T. P. Bean, R. D. Houston, A chromosome-level genome assembly for the Pacific oyster Crassostrea gigas. GigaScience 10, giab020 (2021).
(6) R. D. Rosa, A. Santini, J. Fievet, P. Bulet, D. Destoumieux-Garzón, E. Bachère, Big Defensins, a Diverse Family of Antimicrobial Peptides That Follows Different Patterns of Expression in Hemocytes of the Oyster Crassostrea gigas. PLOS ONE 6, e25594 (2011).
(7) Y. Li, J. Sun, Y. Zhang, M. Wang, L. Wang, L. Song, CgRel involved in antibacterial immunity by regulating the production of CgIL17s and CgBigDef1 in the Pacific oyster Crassostrea gigas. Fish & Shellfish Immunology 97, 474–482 (2020).
(8) Evidence of a bactericidal permeability increasing protein in an invertebrate, the Crassostrea gigas Cg-BPI | PNAS. https://www.pnas.org/doi/abs/10.1073/pnas.0702281104.
(9) L. Wang, H. Zhang, M. Wang, Z. Zhou, W. Wang, R. Liu, M. Huang, C. Yang, L. Qiu, L. Song, The transcriptomic expression of pattern recognition receptors: Insight into molecular recognition of various invading pathogens in Oyster Crassostrea gigas. Developmental & Comparative Immunology 91, 1–7 (2019).
(10) R. A. J. Signer, J. A. Magee, A. Salic, S. J. Morrison, Haematopoietic stem cells require a highly regulated protein synthesis rate. Nature 509, 49–54 (2014).
(11) A. Narla, B. L. Ebert, Ribosomopathies: human disorders of ribosome dysfunction. Blood 115, 3196–3205 (2010).
(12) Y. Zhang, A.-C. E. Duc, S. Rao, X.-L. Sun, A. N. Bilbee, M. Rhodes, Q. Li, D. J. Kappes, J. Rhodes, D. L. Wiest, Control of Hematopoietic Stem Cell Emergence by Antagonistic Functions of Ribosomal Protein Paralogs. Developmental Cell 24, 411–425 (2013).
Reviewer #2 (Public review):
Summary:
This work provides a comprehensive understanding of cellular immunity in bivalves. To precisely describe the hemocytes of the oyster C. gigas, the authors morphologically characterized seven distinct cell groups, which they then correlated with single-cell RNA sequencing analysis, also resulting in seven transcriptional profiles. They employed multiple strategies to establish relationships between each morphotype and the scRNAseq profile. The authors correlated the presence of marker genes from each cluster identified in scRNAseq with hemolymph fractions enriched for different hemocyte morphotypes. This approach allowed them to correlate three of the seven cell types, namely hyalinocytes (H), small granule cells (SGC), and vesicular cells (VC). A macrophage-like (ML) cell type was correlated through the expression of macrophage-specific genes and its capacity to produce reactive oxygen species. Three other cell types correspond to blast-like cells, including an immature blast cell type from which distinct hematopoietic lineages originate to give rise to H, SGC, VC, and ML cells. Additionally, ML cells and SGCs demonstrated phagocytic properties, with SGCs also involved in metal homeostasis. On the other hand, H cells, nongranular cells, and blast cells expressed antimicrobial peptides. This study thus provides a complete landscape of oyster hemocytes with functional validation linked to immune activities. This resource will be valuable for studying the impact of bacterial or viral infections in oysters.
Strengths:
The main strength of this study lies in its comprehensive and integrative approach, combining single-cell RNA sequencing, cytological analysis, cell fractionation, and functional assays to provide a robust characterization of hemocyte populations in Crassostrea gigas.
(1) The innovative use of marker genes, quantifying their expression within specific cell fractions, allows for precise annotation of different cellular clusters, bridging the gap between morphological observations and transcriptional profiles.
(2) The study provides detailed insights into the immune functions of different hemocyte types, including the identification of professional phagocytes, ROS-producing cells, and cells expressing antimicrobial peptides.
(3) The identification and analysis of transcription factors specific to different hemocyte types and lineages offer crucial insights into cell fate determination and differentiation processes in oyster immune cells.
(4) The authors significantly advance the understanding of oyster immune cell diversity by identifying and characterizing seven distinct hemocyte transcriptomic clusters and morphotypes.
These strengths collectively make this study a significant contribution to the field of invertebrate immunology, providing a comprehensive framework for understanding oyster hemocyte diversity and function.
Weaknesses:
(1) The authors performed scRNAseq/lineage analysis and cytological analysis on oysters from two different sources. The methodology of the study raises concerns about the consistency of the sample and the variability of the results. The specific post-processing of hemocytes for scRNAseq, such as cell filtering, might also affect cell populations or gene expression profiles. It's unclear if the seven hemocyte types and their proportions were consistent across both samples. This inconsistency may affect the correlation between morphological and transcriptomic data.
We thank the reviewer for highlighting the importance of sample consistency and potential variability, and we acknowledge the need for clarification regarding the use of oysters from two different sources.
Oysters from La Tremblade (known pathogen-free in standardized conditions) were used to establish the hemocyte transcriptomic atlas through scRNA-seq and for cytological analyses. Oysters from the Thau Lagoon (Bouzigues) were used for cytological, functional, and fractionation experiments. These oysters were sampled during non-epidemic periods and monitored under Ifremer’s microbiological surveillance to ensure pathogen free status.
The cytological results (hemocytograms) presented in Figure 3 and Supplementary Figure S3 were derived from Thau Lagoon oysters. To clarify, we updated The Table 3 in Figure 3 and Supplementary Figure S3 to explicitly display hemocyte counts for oysters from both La Tremblade and Thau Lagoon. These data confirm consistent proportions of hemocyte types across both sources, with no significant differences (p > 0.05).
Hemocyte isolation and filtering protocols were rigorously optimized to preserve cell viability and morphology during scRNA-seq library preparation. Viability assays and cytological evaluations confirmed that these procedures did not significantly alter hemocyte populations or their proportions. Sample processing times were minimized to ensure that the scRNA-seq results accurately reflect the native state of the hemolymph.
Taken together, our results confirm that variability between oyster sources or methodological processes did not compromise our findings. This ensures that the correlations between morphological and transcriptomic data are reliable and robust.
(2) The authors claim to use pathogen-free adult oysters (lines 95 and 119), but no supporting data is provided. It's unclear if the oysters were tested for bacterial and viral contaminations, particularly Vibrio and OsHV-1 μVar herpesvirus.
The oysters used in this study were sourced from two distinct origins. First, the animals (18 months old) utilized for scRNA-seq and cytological analyses were obtained from the Ifremer controlled farm located in La Tremblade, France (GPS coordinates: 45.7981624714465, -1.150171788447683). This facility exclusively produces standardized oysters bred in controlled conditions with filtered seawater, entirely isolated from environmental known pathogens. The oysters from this source are certified “pathogen-free” upon arrival at the laboratory, following Ifremer's stringent quality control protocols. We have replaced the term 'pathogen-free' with 'known pathogen-free’ (line 123) to accurately reflect the animals' true status.
Second, for the fractionation experiments and functional tests, oysters were either sourced from the aforementioned Ifremer farm or from a producer located in the Thau Lagoon, France (GPS coordinates: 43.44265228308842, 3.6359883059292057). The Thau Lagoon is subject to comprehensive environmental and microbiological surveillance by the Ifremer monitoring network and the regional veterinary laboratory. For these experiments, we specifically selected oysters aged 18 months - an age associated with reduced susceptibility to OsHV-1 μVar herpesvirus - and ensured that sampling occurred outside of any detected epidemic periods. Furthermore, prior to experimentation, hemocyte samples from all oysters were examined. Oysters showing signs of contamination or exhibiting abnormal hemocyte profiles were excluded from the study.
These measures ensured that the oysters used in this work were of high health status and minimized the likelihood of bacterial or viral contamination, including Vibrio and OsHV-1 μVar.
(3) The KEGG and Gene Ontology analyses, while informative, are very descriptive and lack interpretation. The use of heatmaps with dendrograms for grouping cell clusters and GO terms is not discussed in the results, missing an opportunity to explore cell-type relationships. The changing order of cell clusters across panels B, C, and D in Figure 2 makes it challenging to correlate with panel A and to compare across different GO term categories. The dendrograms suggest proximity between certain clusters (e.g., 4 and 1) across different GO term types, implying similarity in cell processes, but this is not discussed. Grouping GO terms as in Figure 2A, rather than by dendrogram, might provide a clearer visualization of main pathways. Lastly, a more integrated discussion linking GO term and KEGG pathway analyses could offer a more comprehensive view of cell type characteristics. The presentation of scRNAseq results lacks depth in interpretation, particularly regarding the potential roles of different cell types based on their transcriptional profiles and marker genes. Additionally, some figures (2B, C, D, and 7C to H) suffer from information overload and small size, further hampering readability and interpretation.
Thank you for your valuable suggestions regarding the presentation and interpretation of our KEGG and Gene Ontology (GO) analyses. In response, we revised Figure 2 to enhance clarity and provide deeper insights into cell-type relationships and biological processes.
The revised figure 2 reorganizes GO term analysis into a more intuitive layout, grouping related biological processes and pathways in a structured manner. This approach replaces the dendrogram organization and provides a clearer visualization of key pathways for each cell cluster.
(4) The pseudotime analysis presented in the study provides modest additional information to what is already manifest from the clustering and UMAP visualization. The central and intermediate transcriptomic profile of cluster 4 relative to other clusters is apparent from the UMAP and the expression of shared marker genes across clusters (as shown in Figure 1D). The statement by the authors that 'the two types of professional phagocytes belong to the same granular cell lineage' (lines 594-596) should be formulated with more caution. While the pseudotime trajectory links macrophage-like (ML) and small granule-like (SGC) cells, this doesn't definitively establish a direct lineage relationship. Such trajectories can result from similarities in gene expression induced by factors other than lineage relationships, such as responses to environmental stimuli or cell cycle states. To conclusively establish this lineage relationship, additional experiments like cell lineage tracing would be necessary, if such tools are available for C. gigas.
We appreciate the reviewer’s detailed feedback on the pseudotime analysis and its interpretation. While we acknowledge that the clustering and UMAP visualization provide valuable insights, the pseudotime analysis offers a complementary approach by highlighting significantly expressed genes, including key transcription factors, that might otherwise be overlooked in differential expression analysis based solely on Log2FC between clusters. In our study, the pseudotime analysis revealed transcription factors known to play crucial roles in hemocyte differentiation, providing additional depth to our understanding of hemocyte lineage relationships and functional specialization.
Regarding the statement on lines 594 - 596, we agree that the evidence provided by pseudotime trajectories does not definitively establish a direct lineage relationship between macrophage-like (ML) and small granule-like (SGC) cells. Instead, these trajectories suggest potential developmental connections that warrant further investigation. We propose the following revised sentence (lines 616 to 618) :
"The pseudotime trajectory linking macrophage-like (ML) and small granule-like (SGC) cells suggests a potential developmental relationship within the granular cell lineage; however, this hypothesis requires further validation."
We also concur with the reviewer that additional experiments, such as cell lineage tracing, would be necessary to definitively establish this relationship. Unfortunately, the long-term cultivation of hemocytes in C. gigas is currently not feasible. However, we are planning to develop FACS-based approaches to separate the seven hemocyte subtypes, which will allow us to refine their ontology and explore their potential lineage relationships more precisely.
(6) Given the mention of herpesvirus as a major oyster pathogen, the lack of discussion on genes associated with antiviral immunity is a notable omission. While KEGG pathway analysis associated herpesvirus with cluster 1, the specific genes involved are not elaborated upon.
Thank you for your valuable observation regarding the lack of discussion on genes associated with antiviral immunity, particularly in the context of herpes virus infection. The KEGG pathway analysis indeed identified a weak signature associated with herpesvirus in Cluster 1, primarily involving genes encoding beta integrins. In humans, beta integrins have been described as receptors facilitating herpesvirus entry (1). However, in the case of naive oysters used in this study, the KEGG signature was subtle, likely reflecting the absence of active viral infection. Additionally, beta integrins are multifunctional molecules that also play critical roles in processes such as cell adhesion, a function attributed to hyalinocytes, as highlighted in our results.
Given the naive status of the oysters and the weak antiviral signature observed, we chose not to discuss these findings in detail in this study. However, ongoing work in our laboratory aims to further investigate the specific hemocyte populations targeted by OsHV-1, which may shed light on the role of integrins in antiviral immunity in oysters.
We hope this clarifies our approach and the context of the KEGG findings. Thank you for bringing this important perspective to our attention.
(7) The discussion misses an opportunity for comparative analysis with related species. Specifically, a comparison of gene markers and cell populations with Crassostrea hongkongensis, could highlight similarities and differences across systems.
In response to the reviewer’s comment, we have added a comparative analysis between C. hongkongensis and C. gigas hemocyte populations, situating our findings within the broader context of invertebrate immune cell diversity and specialization (lines 747 to 760)
Reviewer #2 (Recommendations for the authors):
(1) Lines 92-93: The authors should add references associated with transcriptomic studies of C. gigas hemocytes.
Thank you for pointing this out. In the revised manuscript, we have added references to previous transcriptomic studies of C. gigas hemocytes (line 83).
(2) Line 121 and 127: The authors should clarify whether 3,000 represents the number of cells loaded or their target for analysis.
The number of cells processed was optimized to minimize the occurrence of doublets during scRNAseq. Following 10x Genomics Chromium guidelines, we loaded 4,950 cells to successfully recover a target of 3,000 cells, with a doublet rate of 2.4%, well below the target threshold of 2.5%. This information has been added on line 125 of the document. The target was 3,000 cells, and as reported in Supplementary Table S1, the estimated number of cells after STAR-solo alignment was 2,937. This ensures the reliability and accuracy of single-cell transcriptomic data.
(3) Line 129: "Supp. Table 1" in the text and "Supp. Table S1" in the figure title should be edited.
The inconsistency between "Supp. Table 1" in the text and "Supp. Table S1" in the figure title has been corrected for uniformity throughout the manuscript (line 134).
(4) Line 138-139: The authors should clarify that the heatmap displays the top 10 positively enriched marker genes for each cluster, as identified by Seurat's differential expression analysis. It is important to note that the analysis does not explicitly show under-represented transcripts, but rather highlights the contrast between cluster-specific overexpressed genes and their lower expression in other clusters.
We have clarified that the heatmap displays the top 10 positively enriched marker genes for each cluster, as identified by Seurat's differential expression analysis, and that the analysis highlights cluster-specific overexpressed genes rather than explicitly showing under-represented transcripts (lines 143 - 145).
(5) Figure 1: The authors should consider improving or potentially removing Figure 1C. The gene IDs are not readable due to their small size, which significantly reduces the informative value of the figure. In addition, the data presented in this heatmap is largely redundant with the more informative and readable dot plot in Figure 1D, which shows both expression levels and the percentage of cells expressing each gene.
Thank you for your suggestion regarding Figure 1C. In the revised manuscript, we have removed the original panel C from the main figure and transferred it to Supplementary Figure S1K, which improves readability while retaining the relevant data. We have also renumbered the remaining panels for clarity, with the former panel D now designated as panel C. We believe these adjustments address the reviewer’s concerns and streamline the presentation of the data.
(6) Table 1: The authors should clarify in the legend the statistical significance criteria (adjusted p-value) for the genes listed.
As requested, we have added the adjusted p-value threshold (adj. p-value < 0.05) to the legend of Table 1.
(7) Line 188: The authors should align the text description of the KEGG pathways in cluster 7 with Figure 2A, describing Wnt signaling pathway and clarifying the terminology "endosome pathway" to ensure consistency.
In the revised text, we have aligned our description with Figure 2A by explicitly mentioning the Wnt signaling pathway in cluster 7 (lines 193 to 194).
The endo-lysosomal pathway encompasses a series of membrane-bound compartments and trafficking events responsible for the uptake of macromolecules from the extracellular environment, their subsequent sorting in endosomes, and eventual degradation in lysosomes. This pathway is tightly regulated, ensuring not only the breakdown of macromolecules but also the recycling of membrane components and signaling receptors essential for maintaining cellular homeostasis (2). In our study, the KEGG signatures of cluster 7 highlight the involvement of the endo-lysosomal pathway.
(8) Line 223: The authors should revise the description of cluster 1, avoiding references to morphology at this point in the manuscript, as no morphological data has been presented yet.
We have revised the description of Cluster 1 to remove references to morphology, ensuring consistency with the data presented at this stage of the manuscript (lines 227 to 229) : ”Cluster 1, comprising 27.6 % of cells, is characterized by GO-terms related to myosin complex, lamellipodium, membrane and actin cytoskeleton remodelling, as well as phosphotransferase activity.”
(9) Figure 2: The authors should revise Figure 2 to improve the clarity. For Figure 2A, they should address the redundancy in the "Global and overview maps" category by removing overlapping pathways such as carbon metabolism and biosynthesis of amino acids, which are likely represented in more specific metabolic categories (glycolysis, pentose). They could consider grouping similar pathways together, such as combining "Amino acid metabolism" with "Metabolism of other amino acids," and separating metabolic pathways from cellular processes for easier interpretation. They should also address the surprising absence of certain expected pathways like lipid metabolism, nucleotide metabolism, and cofactor/vitamin metabolism, as well as cellular processes such as cell growth and chromatin modeling. Even if these pathways are not enriched in specific clusters, mentioning their absence could provide valuable context for the reader.
In the revised version of the manuscript, we propose a new representation to facilitate understanding and improve the clarity of the data presentation.
(10) For Figures 2B, C, and D, the authors should significantly increase the font size of text and numbers, ensuring readability at 100% scale in PDF format. They could also add labels directly on each graph to clearly indicate the type of GO terms represented, (Biological Process, Cellular Component, or Molecular Function).
In the revised version of the manuscript, we propose a new representation to facilitate understanding and improve the clarity of the data presentation.
(11) Line 247-250: The authors should revise their description of cell types to follow the same order as presented in Figure 3A.
We have revised the description of cell types in the manuscript to follow the same order as presented in Figure 3A, as requested.
(12) Line 265-266: The authors should develop the significance of the nucleo-cytoplasmic ratio in hemocyte morphology and identification.
We thank the editor for bringing this to our attention and apologize for the discrepancy between the terminology used in the text and the results presented in Figure 3. The text refers to the nuclear-tocytoplasmic ratio (N/C), while the figure mistakenly displays the inverse ratio, cytoplasmic-to-nuclear ratio (C/N). We recognize that this inversion may cause confusion and will ensure consistency between the text and the figure.
To address this, we propose correcting the figure legend and labels in Figure 3 to align with the terminology used in the text (N/C ratio). This will prevent confusion and maintain clarity throughout the manuscript.
The nuclear-to-cytoplasmic (N:C) ratio, also known as the nucleus:cytoplasm ratio or N/C ratio, is a well-established measurement in cell biology that reflects the relative size of the nucleus to the cytoplasm. This ratio is frequently used as a morphologic feature in the diagnosis of atypia and malignancy in human cells, underscoring its diagnostic value. In the context of our study, we use the N:C ratio to provide a more precise and quantitative description of hemocyte types in Crassostrea gigas. Specifically, the N:C ratio allows us to distinguish between different hemocyte morphotypes, such as blasts and granular cells, and to enrich the characterization of their functional specialization. This quantitative measure supports the morphological classification and enhances the reproducibility and clarity of hemocyte identification.
(13) Line 286-294: The authors should review and correct the legend for Figure 3. It seems that the description of results related to Figure 3C has been mistakenly inserted into the legend.
We thank the reviewer for pointing out this issue with the legend of Figure 3. The description of results related to Figure 3C has now been removed from the legend. The revised legend focuses solely on the figure elements, improving clarity and consistency. We believe this adjustment addresses the reviewer's comment effectively.
(14) Figure 3: The authors should revise the legend for Figure 3A to provide more detailed and explicit descriptions of the "Size, shape and particularities" of the ML, SGC, BGC, and VC hemocyte types.
We thank the reviewer for their insightful suggestion to provide more explicit descriptions in the legend for Figure 3A. We have revised the legend to include detailed explanations of the "Size, shape, and particularities" for the ML, SGC, BGC, and VC hemocyte types. Specifically, we have clarified that size refers to the average granule diameter, shape describes the morphology of the granules (e.g., spherical or elongated), and particularities highlight distinguishing features such as granule color or fluorescence properties observed under specific staining or imaging conditions. We believe this updated legend provides the level of detail requested and enhances the clarity of the figure (lines 294 - 297).
(15) Figure 4: The authors should clarify the method used for calculating relative gene expression in Figure 4A and Figure 6. They should explicitly state in the figure legend that the expression was normalized to the Cg-rps6 reference gene, as mentioned in line 835. The authors should also provide details on the calculation method used (e.g., 2-ΔCt method) and confirm whether the reference gene was expressed at similar levels across all clusters.
We thank the reviewer for pointing out the need for additional clarity regarding the calculation of relative gene expression in Figures 4A and 6. To address this, we have revised the legends for both figures to explicitly state that gene expression levels were normalized to the reference gene Cg-rps6 and calculated using the 2^-ΔCt method. We have also confirmed that Cg-rps6 was stably expressed across all hemocyte clusters and explicitly mentioned this in the revised legends. These changes ensure greater transparency and address the reviewer’s concerns (lines 342 to 346).
(16) The authors could consider removing or modifying Figure 4B, as it appears to be redundant with Figure 3C. Both figures show the average percentage of each hemocyte type in the seven Percoll gradient fractions.
We thank the reviewer for highlighting potential redundancy between Figures 3C and 4B. While both figures present the distribution of hemocyte types across Percoll gradient fractions, Figure 4B serves a distinct and critical purpose in the manuscript. Specifically, it provides the numerical data necessary to understand the correlations shown in Figure 4A, where we analyze the relationship between gene expression levels and the distribution of hemocyte types. These detailed percentages are essential for interpreting the statistical robustness and biological relevance of the correlation matrix, which could not be derived solely from the qualitative visualization in Figure 3C.
(17) Figure 5: The authors should address the redundancy between Figure S7B and Figure 5B, as they appear to present the same data. In Figure S7B, "SGC" is incorrectly abbreviated as "G".
In the revised version of the manuscript, we addressed the redundancy between the two figures and we corrected the incorrectly abbreviated SGC.
(18) Line 412: The authors should correct the typographical error, changing "Pecoll" to "Percoll".
In the revised version of the manuscript, we correct this typographical error (line 417).
(19) Line 417: The statement about the inhibitor apocynin likely refers to Figure 5D, not Figure 5C.
In the revised version of the manuscript, we have corrected this reference error to accurately refer to Figure 5D (line 422).
(20) Line 441-444: The authors should provide references to support their annotation of cluster 1 as macrophage-like cells based on macrophage-specific genes. These references should cite established literature on known macrophage gene markers, particularly in bivalves or related species if available. They need to clarify whether specific gene markers exist for each of the hemocyte morphotypes they have identified. If such markers are known from previous studies, they should be mentioned and referenced.
We propose to modify lines 446 to 449 to address the reviewer's concerns. Cluster 1, which we have termed "macrophage-like" due to its pronounced phagocytic activity and reactive oxygen species (ROS) production, is enriched in Angiopoietin-1 receptor expression (Table 1). Angiopoietin receptors belong to the Tie receptor family, which is expressed in a subset of macrophages known as Tie2-expressing monocytes (TEMs) in humans (3–5). While our analysis reveals a strong overexpression of the Angiopoietin-1 receptor, we acknowledge that this receptor is not an exclusive marker for macrophages.
In bivalves, including oysters, no definitive molecular markers have been established for macrophagelike cells as they are defined functionally in this study. Consequently, the identification of such cells relies on their functional characteristics rather than strict marker expression. To clarify, we propose the following revision to the sentence:
Furthermore, this cluster expresses macrophage-related genes, including the macrophage-expressed gene 1 protein (G30226) (Supp. Data S1), along with maturation factors for dual oxidase, an enzyme involved in peroxide formation (Supp. Fig. S8), supporting its designation as macrophage-like based on functional characteristics.
(21) Figure 7: For Figures 7C to 7H, the authors should increase the font size of gene names and descriptions to ensure legibility in both printed versions and digital formats. To simplify these figures, the authors could consider displaying less differentially expressed genes for each lineage, along with the top genes for each differentiation pathway. If detailed gene information is crucial, they could move the full list to a supplementary table and reference it in the figure legend. Regarding Figure 7I, the authors should reorder the transcription factor genes by cluster and specificity to improve visualization and interpretation, like in Figure 1D.
Thank you for these valuable suggestions regarding Figure 7. We have revised Figures 7C–H to ensure improved readability. Furthermore, we have simplified these panels by highlighting fewer differentially expressed genes for each lineage. In Figure 7I, we have reordered the transcription factor genes by cluster and specificity, following a layout similar to Figure 1D, to facilitate clearer visualization and interpretation of the data.
(22) Line 490: The authors should provide more precise references to the specific GO terms and figure panels they are discussing.
To address this comment, we have revised the sentence and provided additional information in the text to clearly indicate where the corresponding figure panels can be found in the manuscript (line 499)
(23) Line 510: The authors state that "5 cell lineages could be defined," but the subsequent text and Figure 7C to H actually present 6 distinct lineages.
We have corrected in the manuscript. 6 lineages could be defined (line 521).
(24) Line 534: The authors should consider further investigating the pluripotent potential of cluster 4 cells by exploring known or potential stem cell markers in their scRNAseq data.
Thank you for highlighting the possibility of pluripotent potential of cluster 4. In our current analysis, we did not detect any known stem cell or proliferative markers, nor evidence of a clearly defined hematopoiesis site in the hemolymph. Indeed, previous work suggests that oyster hematopoiesis may occur in tissues such as the gills, implying that stem or progenitor cells might not circulate in the hemolymph under homeostatic conditions. Consequently, it is plausible that our observation of no proliferative cell populations partly reflects their absence in hemolymph, especially in naïve (unstimulated) oysters. To conclusively identify potential progenitor cells and their proliferative activity, further approaches involving deliberate perturbation of hemocyte homeostasis - such as immunological challenge (e.g., Zymosan treatment) combined with lineage-tracing or proliferation assays - would be necessary. These future investigations would not only clarify whether proliferative cells emerge in the hemolymph in response to environmental or pathological stimuli but also help elucidate the broader cellular pathways underlying oyster immune responses.
In response to the reviewer’s comment, we have revised the Discussion (lines 695 to 696) and added : “Nevertheless, we did not detect any canonical stem or progenitor cell populations in our dataset, underscoring the need for future investigations - potentially involving immunological challenges and lineage-tracing assays - to clarify whether proliferative cells circulate in the hemolymph or instead reside primarily in tissue compartments.”
(25) Figure S10: The authors should significantly improve the readability of Figure S10 by increasing the font size. Currently, the small font size makes it impossible for readers to discern the information presented.
Thank you for highlighting the readability concerns regarding Figure S10. In response to your comment, we have increased the overall size and font of the figure, ensuring that all labels and legends are clearly legible in both printed and digital formats. We believe these adjustments will allow readers to more easily interpret the information presented.
(26) Line 896: The authors should correct the typographical error on line 896 by deleting the additional bracket.
In the revised version of the manuscript, we correct this typographical error.
(27) Figure S12: The authors should address the absence of any reference to Figure S12 in the main text of the manuscript.
The reference to Supp. Figure S12 has been corrected. It was a referencing error between Supp. Figure S11(in the discussion, line 670) and Supp. Figure S12.
Bibliography:
(1) G. Campadelli-Fiume, D. Collins-McMillen, T. Gianni, A. D. Yurochko, Integrins as Herpesvirus Receptors and Mediators of the Host Signalosome. Annual Review of Virology 3, 215–236 (2016).
(2) J. P. Luzio, P. R. Pryor, N. A. Bright, Lysosomes: fusion and function. Nat Rev Mol Cell Biol 8, 622–632 (2007).
(3) A. S. Harney, E. N. Arwert, D. Entenberg, Y. Wang, P. Guo, B.-Z. Qian, M. H. Oktay, J. W. Pollard, J. G. Jones, J. S. Condeelis, Real-Time Imaging Reveals Local, Transient Vascular Permeability, and Tumor Cell Intravasation Stimulated by TIE2hi Macrophage-Derived VEGFA. Cancer Discov 5, 932–943 (2015).
(4) M. De Palma, R. Mazzieri, L. S. Politi, F. Pucci, E. Zonari, G. Sitia, S. Mazzoleni, D. Moi, M. A. Venneri, S. Indraccolo, A. Falini, L. G. Guidotti, R. Galli, L. Naldini, Tumor-targeted interferon-alpha delivery by Tie2-expressing monocytes inhibits tumor growth and metastasis. Cancer Cell 14, 299–311 (2008).
(5) M. De Palma, M. A. Venneri, R. Galli, L. Sergi Sergi, L. S. Politi, M. Sampaolesi, L. Naldini, Tie2 identifies a hematopoietic lineage of proangiogenic monocytes required for tumor vessel formation and a mesenchymal population of pericyte progenitors. Cancer Cell 8, 211–226 (2005).
Reviewer #3 (Public review):
The paper addresses pivotal questions concerning the multifaceted functions of oyster hemocytes by integrating single-cell RNA sequencing (scRNA-seq) data with analyses of cell morphology, transcriptional profiles, and immune functions. In addition to investigating granulocyte cells, the study delves into the potential roles of blast and hyalinocyte cells. A key discovery highlighted in this research is the identification of cell types engaged in antimicrobial activities, encompassing processes such as phagocytosis, intracellular copper accumulation, oxidative bursts, and antimicrobial peptide synthesis.
A particularly intriguing aspect of the study lies in the exploration of hemocyte lineages, warranting further investigation, such as employing scRNA-seq on embryos at various developmental stages.
In the opinion of this reviewer, the discussion should compare and contrast the transcriptome characteristics of hemocytes, particularly granule cells, across the three species of bivalves, aligning with the published scRNA-seq studies in this field to elucidate the uniformities and variances in bivalve hemocytes.
Reviewer #3 (Recommendations for the authors):
Minor Concerns:
(1) In the context of C. gigas, the notable expansion of stress and immune-related genes in its genome stands out. It is anticipated that the article will discuss the expression patterns of classical immune-related genes like TLR and RLR across different cell clusters.
We appreciate the reviewer's interest in the expression patterns of classical immune-related genes, such as Toll-like receptors (TLRs) and RIG-I-like receptors (RLRs), across different cell clusters in Crassostrea gigas. In our single-cell RNA sequencing (scRNA-seq) analysis, we did not detect significant expression of TLR or RLR genes. This absence can be attributed to several factors. First, technical limitations of scRNA-seq: The droplet-based scRNA-seq technology employed in our study captures only a fraction of the transcripts present in each cell approximately 10–20% (https://kb.10xgenomics.com/hc/en-us/articles/360001539051-What-fraction-of-mRNA-transcriptsare-captured-per-cell). This inherent limitation often results in the underrepresentation of genes with low expression levels. Consequently, TLRs and RLRs, which may be expressed at low levels in certain hemocytes, could be undetected due to this capture inefficiency. TLRs are typically expressed at low basal levels under resting conditions and are upregulated in response to specific stimuli or pathogenic challenges (1, 2). Given that our study analyzed hemocytes in their basal state, the expression levels of these receptors may have been below the detection threshold of the scRNA-seq platform. Furthermore, as highlighted by De Lorgeril et al. (3) the expression of these immune receptors varies depending on the resistance of the oyster. This variability further underscores the dynamic and context-dependent nature of TLR and RLR expression
To comprehensively assess the expression patterns of TLRs and RLRs across different hemocyte clusters, future studies could incorporate targeted enrichment strategies, such as bulk RNA-seq or single-cell technologies with higher capture efficiencies. Additionally, analyzing hemocytes under stimulated conditions or comparing oysters with varying levels of resistance could provide insights into the inducible and context-specific expression of these immune receptors.
(2) Clarification is needed in lines 265-266 regarding the nucleo-cytoplasmic ratio (N/C) terminology to prevent confusion, considering the discrepancy with the results presented in Figure 3.
We thank the editor for bringing this to our attention and apologize for the discrepancy between the terminology used in the text and the results presented in Figure 3. The text refers to the nuclear-tocytoplasmic ratio (N/C), while the figure mistakenly displays the inverse ratio, cytoplasmic-to-nuclear ratio (C/N). We recognize that this inversion may cause confusion and will ensure consistency between the text and the figure.
To address this, we propose correcting the figure legend and labels in Figure 3 to align with the terminology used in the text (N/C ratio). This will prevent confusion and maintain clarity throughout the manuscript.
(3) The selection of cluster 4 as the root for pseudotime analysis based on high ribosomal protein expression raises questions. It would be beneficial to elaborate on the inclusion of other genes, such as cell cycle or mitotic-related genes, to validate the pseudotime analysis outcomes.
We appreciate the reviewer’s insightful comment on the significance of ribosomal proteins in stem cell maintenance.
Hematopoietic stem cells (HSCs) are a population of stem cells that are largely cell-cycle-quiescent (G0 phase) with low biosynthetic activity. Upon stimulation and stress HScs undergo proliferation and differentiation and produce all lineages of hemocytes.
Ribosomal proteins play a multifaceted role in preserving the balance between stem cell quiescence and activation. By ensuring precise regulation of protein synthesis, they allow stem cells to maintain their undifferentiated state while remaining poised for activation when needed. Furthermore, ribosomal proteins contribute to the cellular stress response, safeguarding stem cells from oxidative damage and other stressors that could compromise their functionality. Importantly, ribosomal biogenesis and the dynamic assembly of ribosomes provide a regulatory mechanism that fine-tunes the transition from self-renewal to differentiation, a critical feature of hematopoietic stem cells (HSCs) and other stem cell types. These mechanisms collectively highlight the indispensable role of ribosomal proteins in stem cell biology, underscoring their relevance to our study's findings.
In vertebrate, the maintenance of hematopoietic stem cells (HSCs) and hematopoietic homeostasis is widely acknowledged to rely on the proper regulation of ribosome function and protein synthesis (4). This process necessitates the coordinated expression of numerous genes, including genes that encode ribosomal proteins (RP genes) and those involved in regulating ribosome biogenesis and protein translation. Disruptions or mutations in these critical genes are associated with the development of congenital disorders (5). Among these, Rpl22 (found in cluster 4 with a Log2FC of 1.59) has been shown to play a pivotal role in HSC maintenance by balancing ribosomal protein paralog activity, which is critical for the emergence and function of HSCs (6).
(4) What is the resolution of the cell clustering employed in the study? Given that cluster 1 potentially encompasses two distinct cell types, Macrophage-Like and Big Granule cells, further sub-clustering efforts and correlation analyses between cluster markers and cell morphologies could aid in their differentiation.
Thank you for your inquiry regarding the resolution of our cell clustering. As described in the Materials and Methods section, we used the Seurat FindClusters function with a resolution parameter of r = 0.1 for the scRNA-seq dataset. We performed sub-clustering within Cluster 1, resulting in four distinct subclusters. However, despite analyzing various specific markers, we did not identify any marker uniquely associated with the Big Granule Cell (BGC) morphology. Notably, LACC24 specifically marks a subset of cells within Cluster 1, as shown in Supplementary Figure S8, although this gene alone was insufficient to definitively distinguish a distinct BGC population.
(5) Line 78's statement regarding the primary identification of three hemocyte cell types in C. gigas-blast, hyalinocyte, and granulocyte cells would benefit from including references to substantiate this claim.
We thank Reviewer #1 for their valuable comments, which have allowed us to further improve our manuscript. We have enriched the introduction with the following addition (lines 79 to 82):
“Blast-like cells are considered undifferentiated hemocyte types (Donaghy et al., 2010), hyalinocytes appear to play a key role in wound repair (de la Ballina et al., 2020), and granulocytes are primarily involved in immune surveillance. Among these, granulocytes are regarded as the main immunocompetent hemocyte type (Wang et al., 2017).”
Conclusion:
The authors largely achieved their primary objective of providing a comprehensive characterization of oyster immune cells. They successfully integrated multiple approaches to identify and describe distinct hemocyte types. The correlation of these cell types with specific immune functions represents a significant advancement in understanding oyster immunity. However, certain aspects of their objectives have not been fully achieved. The lineage relationships proposed on the basis of pseudotime analysis, while interesting, require further experimental validation. The potential of antiviral defense mechanisms, an important aspect of oyster immunity, has not been discussed in depth.
This study is likely to have a significant impact on the field of invertebrate immunology, particularly in bivalve research. It provides a new standard for comprehensive immune cell characterization in invertebrates. The identification of specific markers for different hemocyte types will facilitate future research on oyster immunity. The proposed model of hemocyte lineages, while requiring further validation, offers a framework for studying hematopoiesis in bivalves.
Bibliography:
(1) J. Chen, J. Lin, F. Yu, Z. Zhong, Q. Liang, H. Pang, S. Wu, Transcriptome analysis reveals the function of TLR4-MyD88 pathway in immune response of Crassostrea hongkongensis against Vibrio Parahemolyticus. Aquaculture Reports 25, 101253 (2022).
(2) Y. Zhang, X. He, F. Yu, Z. Xiang, J. Li, K. L. Thorpe, Z. Yu, Characteristic and Functional Analysis of Toll-like Receptors (TLRs) in the lophotrocozoan, Crassostrea gigas, Reveals Ancient Origin of TLR-Mediated Innate Immunity. PLOS ONE 8, e76464 (2013).
(3) J. de Lorgeril, B. Petton, A. Lucasson, V. Perez, P.-L. Stenger, L. Dégremont, C. Montagnani, J.M. Escoubas, P. Haffner, J.-F. Allienne, M. Leroy, F. Lagarde, J. Vidal-Dupiol, Y. Gueguen, G.
Mitta, Differential basal expression of immune genes confers Crassostrea gigas resistance to Pacific oyster mortality syndrome. BMC Genomics 21, 63 (2020).
(4) R. A. J. Signer, J. A. Magee, A. Salic, S. J. Morrison, Haematopoietic stem cells require a highly regulated protein synthesis rate. Nature 509, 49–54 (2014).
(5) A. Narla, B. L. Ebert, Ribosomopathies: human disorders of ribosome dysfunction. Blood 115, 3196–3205 (2010).
(6) Y. Zhang, A.-C. E. Duc, S. Rao, X.-L. Sun, A. N. Bilbee, M. Rhodes, Q. Li, D. J. Kappes, J. Rhodes, D. L. Wiest, Control of Hematopoietic Stem Cell Emergence by Antagonistic Functions of Ribosomal Protein Paralogs. Developmental Cell 24, 411–425 (2013).
-
eLife Assessment
This manuscript offers an exploration of the immune cells in the oyster Crassostrea gigas, by correlating distinct hemocyte morphotypes with specific single-cell transcriptional profiles. The evidence supporting the conclusion is convincing, deriving from the comprehensive dataset that not only captures unicellular diversity but also associates these cells with distinct immune roles, making it an important resource for the broader research community. There are some concerns on the data presentation that leave some questions.
-
Reviewer #1 (Public review):
Summary:
In this manuscript, De La Forest Divonne et al. build a repertory of hemocytes from adult Pacific oysters combining scRNAseq data with cytologic and biochemical analyses. Three categories of hemocytes were described previously in this species (i.e. blast, hyalinocyte, and granulocytes). Based on scRNAseq data, the authors identified 7 hemocyte clusters presenting distinct transcriptional signatures. Using Kegg pathway enrichment and RBGOA, the authors determined the main molecular features of the clusters. In parallel, using cytologic markers, the authors classified 7 populations of hemocytes (i.e. ML, H, BBL, ABL, SGC, BGC, and VC) presenting distinct sizes, nucleus sizes, acidophilic/basophilic, presence of pseudopods, cytoplasm/nucleus ratio and presence of granules. Then, the authors compared …
Reviewer #1 (Public review):
Summary:
In this manuscript, De La Forest Divonne et al. build a repertory of hemocytes from adult Pacific oysters combining scRNAseq data with cytologic and biochemical analyses. Three categories of hemocytes were described previously in this species (i.e. blast, hyalinocyte, and granulocytes). Based on scRNAseq data, the authors identified 7 hemocyte clusters presenting distinct transcriptional signatures. Using Kegg pathway enrichment and RBGOA, the authors determined the main molecular features of the clusters. In parallel, using cytologic markers, the authors classified 7 populations of hemocytes (i.e. ML, H, BBL, ABL, SGC, BGC, and VC) presenting distinct sizes, nucleus sizes, acidophilic/basophilic, presence of pseudopods, cytoplasm/nucleus ratio and presence of granules. Then, the authors compared the phenotypic features with potential transcriptional signatures seen in the scRNAseq. The hemocytes were separated in a density gradient to enrich for specific subpopulations. The cell composition of each cell fraction was determined using cytologic markers and the cell fractions were analysed by quantitative PCR targeting major cluster markers (two per cluster). With this approach, the authors could assign cluster 7 to VC, cluster 2 to H, and cluster 3 to SGC. The other clusters did not show a clear association with this experimental approach. Using phagocytic assays, ROS, and copper monitoring, the authors showed that ML and SGC are phagocytic, ML produces ROS, and SGC and BGC accumulate copper. Then with the density gradient/qPCR approach, the authors identified the populations expressing anti-microbial peptides (ABL, BBL, and H). At last, the authors used Monocle to predict differentiation trajectories for each subgroup of hemocytes using cluster 4 as the progenitor subpopulation.
The manuscript provides a comprehensive characterisation of the diversity of circulating immune cells found in Pacific oysters.
Strengths:
The combination of the two approaches offers a more integrative view.
Hemocytes represent a very plastic cell population that has key roles in homeostatic and challenged conditions. Grasping the molecular features of these cells at the single-cell level will help understand their biology.
This type of study may help elucidate the diversification of immune cells in comparative studies and evolutionary immunology.
Weaknesses:
The study should be more cautious about the conclusions, include further analyses, and inscribe the work in a more general framework.
-
Reviewer #2 (Public review):
Summary:
This work provides a comprehensive understanding of cellular immunity in bivalves. To precisely describe the hemocytes of the oyster C. gigas, the authors morphologically characterized seven distinct cell groups, which they then correlated with single-cell RNA sequencing analysis, also resulting in seven transcriptional profiles. They employed multiple strategies to establish relationships between each morphotype and the scRNAseq profile. The authors correlated the presence of marker genes from each cluster identified in scRNAseq with hemolymph fractions enriched for different hemocyte morphotypes. This approach allowed them to correlate three of the seven cell types, namely hyalinocytes (H), small granule cells (SGC), and vesicular cells (VC). A macrophage-like (ML) cell type was correlated through …
Reviewer #2 (Public review):
Summary:
This work provides a comprehensive understanding of cellular immunity in bivalves. To precisely describe the hemocytes of the oyster C. gigas, the authors morphologically characterized seven distinct cell groups, which they then correlated with single-cell RNA sequencing analysis, also resulting in seven transcriptional profiles. They employed multiple strategies to establish relationships between each morphotype and the scRNAseq profile. The authors correlated the presence of marker genes from each cluster identified in scRNAseq with hemolymph fractions enriched for different hemocyte morphotypes. This approach allowed them to correlate three of the seven cell types, namely hyalinocytes (H), small granule cells (SGC), and vesicular cells (VC). A macrophage-like (ML) cell type was correlated through the expression of macrophage-specific genes and its capacity to produce reactive oxygen species. Three other cell types correspond to blast-like cells, including an immature blast cell type from which distinct hematopoietic lineages originate to give rise to H, SGC, VC, and ML cells. Additionally, ML cells and SGCs demonstrated phagocytic properties, with SGCs also involved in metal homeostasis. On the other hand, H cells, non-granular cells, and blast cells expressed antimicrobial peptides. This study thus provides a complete landscape of oyster hemocytes with functional validation linked to immune activities. This resource will be valuable for studying the impact of bacterial or viral infections in oysters.
Strengths:
The main strength of this study lies in its comprehensive and integrative approach, combining single-cell RNA sequencing, cytological analysis, cell fractionation, and functional assays to provide a robust characterization of hemocyte populations in Crassostrea gigas.
(1) The innovative use of marker genes, quantifying their expression within specific cell fractions, allows for precise annotation of different cellular clusters, bridging the gap between morphological observations and transcriptional profiles.
(2) The study provides detailed insights into the immune functions of different hemocyte types, including the identification of professional phagocytes, ROS-producing cells, and cells expressing antimicrobial peptides.
(3) The identification and analysis of transcription factors specific to different hemocyte types and lineages offer crucial insights into cell fate determination and differentiation processes in oyster immune cells.
(4) The authors significantly advance the understanding of oyster immune cell diversity by identifying and characterizing seven distinct hemocyte transcriptomic clusters and morphotypes.
These strengths collectively make this study a significant contribution to the field of invertebrate immunology, providing a comprehensive framework for understanding oyster hemocyte diversity and function.
Weaknesses:
(1) The authors performed scRNAseq/lineage analysis and cytological analysis on oysters from two different sources. The methodology of the study raises concerns about the consistency of the sample and the variability of the results. The specific post-processing of hemocytes for scRNAseq, such as cell filtering, might also affect cell populations or gene expression profiles. It's unclear if the seven hemocyte types and their proportions were consistent across both samples. This inconsistency may affect the correlation between morphological and transcriptomic data.
(2) The authors claim to use pathogen-free adult oysters (lines 95 and 119), but no supporting data is provided. It's unclear if the oysters were tested for bacterial and viral contaminations, particularly Vibrio and OsHV-1 μVar herpesvirus.
(3) The KEGG and Gene Ontology analyses, while informative, are very descriptive and lack interpretation. The use of heatmaps with dendrograms for grouping cell clusters and GO terms is not discussed in the results, missing an opportunity to explore cell-type relationships. The changing order of cell clusters across panels B, C, and D in Figure 2 makes it challenging to correlate with panel A and to compare across different GO term categories. The dendrograms suggest proximity between certain clusters (e.g., 4 and 1) across different GO term types, implying similarity in cell processes, but this is not discussed. Grouping GO terms as in Figure 2A, rather than by dendrogram, might provide a clearer visualization of main pathways. Lastly, a more integrated discussion linking GO term and KEGG pathway analyses could offer a more comprehensive view of cell type characteristics. The presentation of scRNAseq results lacks depth in interpretation, particularly regarding the potential roles of different cell types based on their transcriptional profiles and marker genes. Additionally, some figures (2B, C, D, and 7C to H) suffer from information overload and small size, further hampering readability and interpretation.
(4) The pseudotime analysis presented in the study provides modest additional information to what is already manifest from the clustering and UMAP visualization. The central and intermediate transcriptomic profile of cluster 4 relative to other clusters is apparent from the UMAP and the expression of shared marker genes across clusters (as shown in Figure 1D). The statement by the authors that 'the two types of professional phagocytes belong to the same granular cell lineage' (lines 594-596) should be formulated with more caution. While the pseudotime trajectory links macrophage-like (ML) and small granule-like (SGC) cells, this doesn't definitively establish a direct lineage relationship. Such trajectories can result from similarities in gene expression induced by factors other than lineage relationships, such as responses to environmental stimuli or cell cycle states. To conclusively establish this lineage relationship, additional experiments like cell lineage tracing would be necessary, if such tools are available for C. gigas.
(6) Given the mention of herpesvirus as a major oyster pathogen, the lack of discussion on genes associated with antiviral immunity is a notable omission. While KEGG pathway analysis associated herpesvirus with cluster 1, the specific genes involved are not elaborated upon.
(7) The discussion misses an opportunity for comparative analysis with related species. Specifically, a comparison of gene markers and cell populations with Crassostrea hongkongensis, could highlight similarities and differences across systems.
Conclusion:
The authors largely achieved their primary objective of providing a comprehensive characterization of oyster immune cells. They successfully integrated multiple approaches to identify and describe distinct hemocyte types. The correlation of these cell types with specific immune functions represents a significant advancement in understanding oyster immunity. However, certain aspects of their objectives have not been fully achieved. The lineage relationships proposed on the basis of pseudotime analysis, while interesting, require further experimental validation. The potential of antiviral defense mechanisms, an important aspect of oyster immunity, has not been discussed in depth.
This study is likely to have a significant impact on the field of invertebrate immunology, particularly in bivalve research. It provides a new standard for comprehensive immune cell characterization in invertebrates. The identification of specific markers for different hemocyte types will facilitate future research on oyster immunity. The proposed model of hemocyte lineages, while requiring further validation, offers a framework for studying hematopoiesis in bivalves.
-
Reviewer #3 (Public review):
The paper addresses pivotal questions concerning the multifaceted functions of oyster hemocytes by integrating single-cell RNA sequencing (scRNA-seq) data with analyses of cell morphology, transcriptional profiles, and immune functions. In addition to investigating granulocyte cells, the study delves into the potential roles of blast and hyalinocyte cells. A key discovery highlighted in this research is the identification of cell types engaged in antimicrobial activities, encompassing processes such as phagocytosis, intracellular copper accumulation, oxidative bursts, and antimicrobial peptide synthesis.
A particularly intriguing aspect of the study lies in the exploration of hemocyte lineages, warranting further investigation, such as employing scRNA-seq on embryos at various developmental stages.
In the …
Reviewer #3 (Public review):
The paper addresses pivotal questions concerning the multifaceted functions of oyster hemocytes by integrating single-cell RNA sequencing (scRNA-seq) data with analyses of cell morphology, transcriptional profiles, and immune functions. In addition to investigating granulocyte cells, the study delves into the potential roles of blast and hyalinocyte cells. A key discovery highlighted in this research is the identification of cell types engaged in antimicrobial activities, encompassing processes such as phagocytosis, intracellular copper accumulation, oxidative bursts, and antimicrobial peptide synthesis.
A particularly intriguing aspect of the study lies in the exploration of hemocyte lineages, warranting further investigation, such as employing scRNA-seq on embryos at various developmental stages.
In the opinion of this reviewer, the discussion should compare and contrast the transcriptome characteristics of hemocytes, particularly granule cells, across the three species of bivalves, aligning with the published scRNA-seq studies in this field to elucidate the uniformities and variances in bivalve hemocytes.
-
-
