Motor actions are spatially organized in motor and dorsal premotor cortex
Curation statements for this article:-
Curated by eLife

eLife assessment
This paper measures the neural activity in reach-to-grasp and reach-only tasks using intrinsic optical imaging. The paper describes these in the relationship to the Intra-cortical micro stimulation maps of the same animals. The dataset is unique and potentially highly important. However, the claim of "clustered neural activity" is not tested against any quantifiable alternative hypothesis of non-clustered activity, and support for this idea is therefore currently incomplete.
This article has been Reviewed by the following groups
Discuss this preprint
Start a discussion What are Sciety discussions?Listed in
- Evaluated articles (eLife)
Abstract
Frontal motor areas are central to controlling voluntary movements. In non-human primates, the motor areas contain independent, somatotopic, representations of the forelimb (i.e., motor maps). But are the neural codes for actions spatially organized within those forelimb representations? Addressing this question would provide insight into the poorly understood structure–function relationships of the cortical motor system. Here, we tackle the problem using high-resolution optical imaging and motor mapping in motor (M1) and dorsal premotor (PMd) cortex. Two macaque monkeys performed an instructed reach-to-grasp task while cortical activity was recorded with intrinsic signal optical imaging (ISOI). The spatial extent of activity in M1 and PMd was then quantified in relation to the forelimb motor maps, which we obtained from the same hemisphere with intracortical microstimulation. ISOI showed that task-related activity was concentrated in patches that collectively overlapped <40% of the M1 and PMd forelimb representations. The spatial organization of the patches was consistent across task conditions despite small variations in forelimb use. Nevertheless, the largest condition differences in forelimb use were reflected in the magnitude of cortical activity. Distinct time course profiles from patches in arm zones and patches in hand zones suggest functional differences within the forelimb representations. The results collectively support an organizational framework wherein the forelimb representations contain subzones enriched with neurons tuned for specific actions. Thus, the often-overlooked spatial dimension of neural activity appears to be an important organizing feature of the neural code in frontal motor areas.
Article activity feed
-

-

Author Response
Reviewer #1 (Public Review):
This paper describes the neural activity, measured by intrinsic optical imaging in reach-to-grasp, and reach-only conditions in relation to the Intra-cortical micro stimulation maps. The paper mostly describes a relatively unique and potentially useful data set. However, in the current version, no real hypotheses about the organization of M1 and PMd are tested convincingly. For example, the claim of "clustered neural activity" is not tested against any quantifiable alternative hypothesis of non-clustered activity, and support for this idea is therefore incomplete.
The combination of intrinsic optical imaging and intra-cortical micro-stimulation of the motor system of two macaque monkeys promised to be a unique and highly interesting dataset. The experiments are carefully conducted. In …
Author Response
Reviewer #1 (Public Review):
This paper describes the neural activity, measured by intrinsic optical imaging in reach-to-grasp, and reach-only conditions in relation to the Intra-cortical micro stimulation maps. The paper mostly describes a relatively unique and potentially useful data set. However, in the current version, no real hypotheses about the organization of M1 and PMd are tested convincingly. For example, the claim of "clustered neural activity" is not tested against any quantifiable alternative hypothesis of non-clustered activity, and support for this idea is therefore incomplete.
The combination of intrinsic optical imaging and intra-cortical micro-stimulation of the motor system of two macaque monkeys promised to be a unique and highly interesting dataset. The experiments are carefully conducted. In the analysis and interpretation of the results, however, the paper was disappointing to me. The two main weaknesses in my mind were:
a) The alternative hypotheses depicted in Figure 1B are not subjected to any quantifiable test. When is an activity considered to be clustered and when is it distributed? The fact that the observed actions only activate a small portion of the forelimb area (Figure 5G, H) is utterly unconvincing, as this analysis is highly threshold-dependent. Furthermore, it could be the case that the non-activated regions simply do not give a good intrinsic signal, as they are close to microvasculature (something that you actually seem to argue in Figure 6b). Until the authors can show that the other parts of the forelimb area are clearly activated for other forelimb actions (as you suggest on line 625), I believe the claim of cluster neural activity stands unsupported.
We appreciate the reviewer’s concerns and we have made several revisions.
(1) The two panels in Fig 1B should have been presented as potential outcomes as opposed to hypotheses in need of quantifiable testing. We revised the Introduction (line 105-111) and the Results (line 149-152) accordingly.
(2) We agree that the thresholding procedure adopted in the original submission could have impacted the spatial measurements of cortical activity (i.e., Fig 5G-H in original submission). We have completely revised the thresholding procedure and it is now based on statistical comparisons that include all trials (instead of thresholding by number of sessions in the original submission). Thus, the thresholded maps in Fig 5G & 5J are now obtained from pixel-by-pixel comparisons (t-tests, p<1e-4) between frames acquired post-movement and frames acquired before movement. Nevertheless, even with this relatively relaxed threshold, the largest activity maps overlapped <40% of the forelimb representations.
It is important to note that major vessels were excluded from the thresholded map and from the motor map. Thus, uncertainty about imaging in and around vessels was likely not a factor in the calculated overlap between thresholded maps and the motor map.
(3) We agree that showing activation in other parts of the forelimb representations in response to action other than reach-to-grasp would have supported some of the arguments that we previously put forth. Unfortunately, we do not have the supporting data and obtaining it would take months/years. We have therefore expanded the Discussion to include limitations of the behavioral task (line 439-443).
b) The most interesting part of the study (which cannot be easily replicated with human fMRI studies) is the correspondence between the evoked activity and intra-cortical stimulation maps. However, this is impeded by the subjective and low-dimensional description of the evoked movement during stimulation (mainly classifying the moving body part), and the relatively low-dimensional nature (4 conditions) of the evoked activity.
We agree with the reviewer on all accounts. We expanded the Discussion to consider the low dimensionality of the motor maps and the behavioral task (line 439-449).
Measuring cortical activity in a variety of motor tasks would likely have provided additional insight about movement-related cortical activity. Nevertheless, including additional tasks, even if it were possible to do so in the same monkeys, would have delayed study completion by months/years. The hidden challenge of the experimental design is that each monkey is trained to not move for many seconds to minimize contamination of ISOI signals. For example, from trial initiation to Go Cue, the monkey must hold its hand in the start position for 5 seconds. Similarly, after movement completion, the monkey must hold its hand in the start position for another 5 seconds. In between successful trials, a monkey must wait for ~12 seconds before it can initiate a new trial. These durations are >1 order of magnitude longer than in electrophysiological studies in comparable tasks. Achieving consistent task performance with the long durations used here, took months of daily training. Moreover, our monkeys typically run out of steam after ~60-70 min of working on the task. This forces us to limit the overall number of task conditions tested in a session, to obtain a large enough number of trials from each condition.
c) Many details about the statistical analysis remain unclear and seem not well motivated.
We address the reviewer’s specific concerns.
Reviewer #2 (Public Review):
Chehade and Gharbawie investigated motor and premotor cortex in macaque monkeys performing grasping and reaching tasks. They used intrinsic signal optical imaging (ISOI) covering an exceedingly large field-of-view extending from the IPS to the PS. They compared reaching and fine/power-grip grasping ISOI maps with "motor" maps which they obtained using extensive intracranial microstimulation. The grasping/reaching-induced activity activated relatively isolated portions of M1 and PMd, and did not cover the entire ICM-induced 'motor' maps of the upper limbs. The authors suggest that small subzones exist in M1 and PMd that are preferentially activated by different types of forelimb actions. In general, the authors address an important topic. The results are not only highly relevant for increasing our basic understanding of the functional architecture of the motor-premotor cortex and how it represents different types of forelimb actions, but also for the development of brain-machine interfaces. These are challenging experiments to perform and add to the existing yet complementary electrophysiology, fMRI, and optical imaging experiments that have been performed on this topic - due to the high sensitivity and large coverage of the particular IOSI methods employed by the authors. The manuscript is generally well written and the analyses seem overall adequate - but see below for some additional analyses that should be done. Although I'm generally enthusiastic about this manuscript, there are two major issues that should be clarified. These major questions relate mainly to potential thresholding issues and clustering issues.
Major:
- The main claim of the authors is that specific forelimb actions activate only a small fraction of what they call the motor map (i.e., those parts of M1/PMd that evoke muscle contractions upon ICM). The action-related activity is measured by ISOI. When looking a the 'raw' reflectance maps, it is rather clear that relatively wide portions of the exposed cortex are activated by grasping/reaching, especially at later time points after the action. In fact, another reading of the results may be that there are two zones of 'deactivation' that split a large swath of motor-premotor cortex being activated by the grasping/reaching actions. (e.g. at 6 seconds after the cue in Fig 3A, 5A). At first sight, the 'deactivated' regions seem to be located in the cortex representing the trunk/shoulder/face - hence regions not necessarily activated (or only weakly) during the grasping/reaching actions. If true, this means that most of the relevant M1/PMd cortex IS activated during the latter actions - opposing the 'clustering' claims of the authors. This raises the question of whether the 'granularity' claimed by the authors is
a. threshold dependent. In this context, the authors should provide an analysis whereby 'granularity' is shown independent of statistical thresholds of the ISOI maps.
We appreciate the reviewer’s concerns and have completely revised the analyses central to Fig 5. We believe that the figure now contains evidence from both thresholded and unthresholded ISOI data in support of limited spatial extent of cortical activation (i.e., “granularity” in the reviewer’s comments).
For evidence from unthresholded ISOI data, we examined reflectance change time courses from different size ROIs (line 764-768). (A) Small circular ROIs (0.4 mm radius), which we placed in the M1 hand, M1 arm, and PMd arm, zones (Fig 5B). (B) Large ROI inclusive of the M1 and PMd forelimb representations (Fig 5B). We reasoned that if cortical activity is spatially widespread, then the small and large ROIs would report similar time courses. In contrast, if cortical activity is spatially focal, then activity would be detected in the small ROI time courses but would washed out in the large ROI time courses. Our results support the second possibility (Fig 5C-F). Thus, in the movement conditions, time courses from the small ROIs had a large negative peak after movement completion (Fig C-E). In contrast, the characteristic negative peak was absent in the time courses obtained from the large ROI (Fig 5F).
Separately, we revised our thresholding approach to make those results less sensitive to thresholding effects (more details in our response to the first major point from Reviewer 1). The revised results – thresholded/ binarized maps – are consistent with focal cortical activity. Fig 5G & 5J show activity maps thresholded (t-test, p<0.0001) without correction for multiple comparisons, and therefore represent the least restrictive estimate of the spatial extent of cortical activity. Measurements from these maps showed that significantly active pixels overlapped <40% of the M1 & PMd forelimb representations. We interpret the thresholded results as evidence in support of focal cortical activity.
This raises the question of whether the 'granularity' claimed by the authors is
b. dependent on the time-point one assesses the maps. Given the sluggish hemodynamic responses, it is unclear which part of the ISOI maps conveys the most information relative to the cue and arm/hand movements. I suspect that timepoints > 6 s will reveal even larger 'homogeneous' activations compared to the maps < 6s.
We agree with the reviewer that the lag in hemodynamic signals complicates frame selection. Nevertheless, it is unlikely that cortical activity maps would have been larger at time points >6s from Cue. We provide three supporting arguments.
(1) In the imaging sessions used in Fig 4, we acquired images for 9s per trial and systematically varied Cue onset time. The time courses in Fig 4A-B show that for all Cue onset conditions, the negative peak occurred <6s from Cue. This observation from unthresholded results does not support the notion of greater cortical activity at time points >6s from Cue.
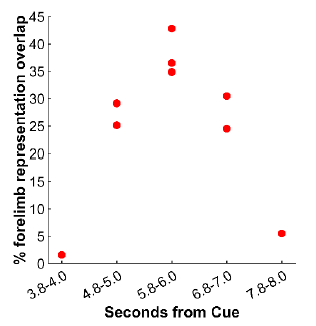
(2) From the same experiment, Fig 4C shows 9 thresholded/binarized maps generated from different time points in relation to Cue. We measured the size of each map (i.e., overlap with the M1/PMd forelimb representations). We present the results in Author response image 1. The largest maps came from an average frame captured +5.8-6.0s from Cue. Those maps are on the diagonal in Fig 4E (top left to bottom right). This result from thresholded data therefore does not support the notion of greater cortical activity at time points >6s from Cue.
Author response image 1.
(3) In all other sessions, we acquired images for 7s per trial (-1.0 to +6.0 s from Cue) without varying Cue onset time. At every time point (100 ms), we measured the size of the thresholded/binarized map in relation to the size of the M1 and PMd forelimb representations. The results are presented in Fig 5I & 5L and indicate that thresholded maps plateau in size by 5.0-5.5 s from Cue. At peak size, the maps overlapped <50% of the M1 and PMd forelimb representations. These result indicates that it is unlikely that we underreported the size of activity maps by not measuring map size beyond 6s from Cue.
In fact, Fig 5F (which is highly thresholded) shows a surprisingly good match between the different forelimb actions, which argues against the existence of small subzones that are preferentially activated by different types of forelimb actions -the main claim of the authors.
Our original proposal should have been more clearly stated. We were proposing that the thresholded maps, which had similar spatial organizations across conditions as the reviewer suggested, reported on subzones tuned for reach-to-grasp actions. Adjacent to those subzones could be other subzones that are preferentially active during other types of forelimb actions (e.g., pulling, pushing, grooming). We could not test this possibility in our study because the behavioral task examined a narrow range of arm and hand actions. We therefore revised the Discussion to state the limitations of our task and to lean more on published work that supports the present proposal (439-443 and 504-508).
- Related to the previous point, the ROI selections/definitions for the time course analyses seem highly arbitrary. As indicated in the introduction, the clustering hypothesis dictates that "an arm function would be concentrated in subzones of the motor arm zones. Neural activity in adjacent subzones would be tuned for other arm functions." To test this hypothesis directly in a straightforward manner, the authors could use the results from the ICM experiment to construct independent ROIs and to evaluate the ISOI responses for the different actions. In that case, the authors could do a straightforward ANOVA (if the data permits parametric analyses) with ROI, action, and time point (and possibly subject) as factors.
We agree with the reviewer, and we now leverage the ICMS map for guiding ROI placement. All time courses are now derived from 1 of 2 types of ROIs. (1) Small ROIs (0.4 mm radius) placed in zones defined from ICMS (e.g., M1 hand zone). (2) Large ROIs that include the entire forelimb representations in M1 or in PMd (Fig 5B).
-
eLife assessment
This paper measures the neural activity in reach-to-grasp and reach-only tasks using intrinsic optical imaging. The paper describes these in the relationship to the Intra-cortical micro stimulation maps of the same animals. The dataset is unique and potentially highly important. However, the claim of "clustered neural activity" is not tested against any quantifiable alternative hypothesis of non-clustered activity, and support for this idea is therefore currently incomplete.
-
Reviewer #1 (Public Review):
This paper describes the neural activity, measured by intrinsic optical imaging in reach-to-grasp, and reach-only conditions in relation to the Intra-cortical micro stimulation maps. The paper mostly describes a relatively unique and potentially useful data set. However, in the current version, no real hypotheses about the organization of M1 and PMd are tested convincingly. For example, the claim of "clustered neural activity" is not tested against any quantifiable alternative hypothesis of non-clustered activity, and support for this idea is therefore incomplete.
The combination of intrinsic optical imaging and intra-cortical micro-stimulation of the motor system of two macaque monkeys promised to be a unique and highly interesting dataset. The experiments are carefully conducted. In the analysis and …
Reviewer #1 (Public Review):
This paper describes the neural activity, measured by intrinsic optical imaging in reach-to-grasp, and reach-only conditions in relation to the Intra-cortical micro stimulation maps. The paper mostly describes a relatively unique and potentially useful data set. However, in the current version, no real hypotheses about the organization of M1 and PMd are tested convincingly. For example, the claim of "clustered neural activity" is not tested against any quantifiable alternative hypothesis of non-clustered activity, and support for this idea is therefore incomplete.
The combination of intrinsic optical imaging and intra-cortical micro-stimulation of the motor system of two macaque monkeys promised to be a unique and highly interesting dataset. The experiments are carefully conducted. In the analysis and interpretation of the results, however, the paper was disappointing to me. The two main weaknesses in my mind were:
a) The alternative hypotheses depicted in Figure 1B are not subjected to any quantifiable test. When is an activity considered to be clustered and when is it distributed? The fact that the observed actions only activate a small portion of the forelimb area (Figure 5G, H) is utterly unconvincing, as this analysis is highly threshold-dependent. Furthermore, it could be the case that the non-activated regions simply do not give a good intrinsic signal, as they are close to microvasculature (something that you actually seem to argue in Figure 6b). Until the authors can show that the other parts of the forelimb area are clearly activated for other forelimb actions (as you suggest on line 625), I believe the claim of cluster neural activity stands unsupported.
b) The most interesting part of the study (which cannot be easily replicated with human fMRI studies) is the correspondence between the evoked activity and intra-cortical stimulation maps. However, this is impeded by the subjective and low-dimensional description of the evoked movement during stimulation (mainly classifying the moving body part), and the relatively low-dimensional nature (4 conditions) of the evoked activity.
c) Many details about the statistical analysis remain unclear and seem not well motivated.
-
Reviewer #2 (Public Review):
Chehade and Gharbawie investigated motor and premotor cortex in macaque monkeys performing grasping and reaching tasks. They used intrinsic signal optical imaging (ISOI) covering an exceedingly large field-of-view extending from the IPS to the PS. They compared reaching and fine/power-grip grasping ISOI maps with "motor" maps which they obtained using extensive intracranial microstimulation. The grasping/reaching-induced activity activated relatively isolated portions of M1 and PMd, and did not cover the entire ICM-induced 'motor' maps of the upper limbs. The authors suggest that small subzones exist in M1 and PMd that are preferentially activated by different types of forelimb actions. In general, the authors address an important topic. The results are not only highly relevant for increasing our basic …
Reviewer #2 (Public Review):
Chehade and Gharbawie investigated motor and premotor cortex in macaque monkeys performing grasping and reaching tasks. They used intrinsic signal optical imaging (ISOI) covering an exceedingly large field-of-view extending from the IPS to the PS. They compared reaching and fine/power-grip grasping ISOI maps with "motor" maps which they obtained using extensive intracranial microstimulation. The grasping/reaching-induced activity activated relatively isolated portions of M1 and PMd, and did not cover the entire ICM-induced 'motor' maps of the upper limbs. The authors suggest that small subzones exist in M1 and PMd that are preferentially activated by different types of forelimb actions. In general, the authors address an important topic. The results are not only highly relevant for increasing our basic understanding of the functional architecture of the motor-premotor cortex and how it represents different types of forelimb actions, but also for the development of brain-machine interfaces. These are challenging experiments to perform and add to the existing yet complementary electrophysiology, fMRI, and optical imaging experiments that have been performed on this topic - due to the high sensitivity and large coverage of the particular IOSI methods employed by the authors. The manuscript is generally well written and the analyses seem overall adequate - but see below for some additional analyses that should be done. Although I'm generally enthusiastic about this manuscript, there are two major issues that should be clarified. These major questions relate mainly to potential thresholding issues and clustering issues.
Major:
The main claim of the authors is that specific forelimb actions activate only a small fraction of what they call the motor map (i.e., those parts of M1/PMd that evoke muscle contractions upon ICM). The action-related activity is measured by ISOI. When looking a the 'raw' reflectance maps, it is rather clear that relatively wide portions of the exposed cortex are activated by grasping/reaching, especially at later time points after the action. In fact, another reading of the results may be that there are two zones of 'deactivation' that split a large swath of motor-premotor cortex being activated by the grasping/reaching actions. (e.g. at 6 seconds after the cue in Fig 3A, 5A). At first sight, the 'deactivated' regions seem to be located in the cortex representing the trunk/shoulder/face - hence regions not necessarily activated (or only weakly) during the grasping/reaching actions. If true, this means that most of the relevant M1/PMd cortex IS activated during the latter actions - opposing the 'clustering' claims of the authors. This raises the question of whether the 'granularity' claimed by the authors is
a. threshold dependent. In this context, the authors should provide an analysis whereby 'granularity' is shown independent of statistical thresholds of the ISOI maps.
b. dependent on the time-point one assesses the maps. Given the sluggish hemodynamic responses, it is unclear which part of the ISOI maps conveys the most information relative to the cue and arm/hand movements. I suspect that timepoints > 6 s will reveal even larger 'homogeneous' activations compared to the maps < 6s.
In fact, Fig 5F (which is highly thresholded) shows a surprisingly good match between the different forelimb actions, which argues against the existence of small subzones that are preferentially activated by different types of forelimb actions -the main claim of the authors.Related to the previous point, the ROI selections/definitions for the time course analyses seem highly arbitrary. As indicated in the introduction, the clustering hypothesis dictates that "an arm function would be concentrated in subzones of the motor arm zones. Neural activity in adjacent subzones would be tuned for other arm functions." To test this hypothesis directly in a straightforward manner, the authors could use the results from the ICM experiment to construct independent ROIs and to evaluate the ISOI responses for the different actions. In that case, the authors could do a straightforward ANOVA (if the data permits parametric analyses) with ROI, action, and time point (and possibly subject) as factors.
-
