Nanoscale architecture and coordination of actin cores within the sealing zone of human osteoclasts
Curation statements for this article:-
Curated by eLife

Evaluation Summary:
In this manuscript, the authors studied, using different types of microscopy, the structure and function of podosomes in primary human osteoclasts, providing interesting new insights into the organization and dynamics of the osteoclast sealing zone. The authors describe the general structure of the actin rings of osteoclasts and explore the dynamics of actin and associated proteins in the actin ring, proposing a model in which the function of podosomes during bone resorption is accomplished through the coordination of islets of the actin core and not through the global coordination of all podosome subunits that form the sealing zone. This article has the potential to generate a significant impact in the field of osteoclast biology. Notably, this study could also expand the understanding of matrix degradation/invasion in other tissues.
(This preprint has been reviewed by eLife. We include the public reviews from the reviewers here; the authors also receive private feedback with suggested changes to the manuscript. Reviewer #1 agreed to share their name with the authors.)
This article has been Reviewed by the following groups
Discuss this preprint
Start a discussion What are Sciety discussions?Listed in
- Evaluated articles (eLife)
Abstract
Osteoclasts are unique in their capacity to degrade bone tissue. To achieve this process, osteoclasts form a specific structure called the sealing zone, which creates a close contact with bone and confines the release of protons and hydrolases for bone degradation. The sealing zone is composed of actin structures called podosomes nested in a dense actin network. The organization of these actin structures inside the sealing zone at the nano scale is still unknown. Here, we combine cutting-edge microscopy methods to reveal the nanoscale architecture and dynamics of the sealing zone formed by human osteoclasts on bone surface. Random illumination microscopy allowed the identification and live imaging of densely packed actin cores within the sealing zone. A cross-correlation analysis of the fluctuations of actin content at these cores indicates that they are locally synchronized. Further examination shows that the sealing zone is composed of groups of synchronized cores linked by α-actinin1 positive filaments, and encircled by adhesion complexes. Thus, we propose that the confinement of bone degradation mediators is achieved through the coordination of islets of actin cores and not by the global coordination of all podosomal subunits forming the sealing zone.
Article activity feed
-

-

Author Response
Reviewer #2 (Public Review):
Portes et al. investigated the nanoscale architecture and dynamics of the osteoclast sealing zone using high-end microscopy techniques. They first use DONALD 3D single molecule localization microscopy on osteoclasts seeded on glass to study the lateral and axial localization of key components of the sealing zone. They show that for some components (vinculin, talin Cterminus), the axial localization was higher when molecules were in close proximity to the actin core while for other components (cortactin, actinin, filamin, paxillin), there was no difference in height as a function of distance from the actin core. They next show that random illumination microscopy (RIM) is a suited microscopy technique to study the sealing zone of osteoclasts on a bone mimetic substrate. They continue to use …
Author Response
Reviewer #2 (Public Review):
Portes et al. investigated the nanoscale architecture and dynamics of the osteoclast sealing zone using high-end microscopy techniques. They first use DONALD 3D single molecule localization microscopy on osteoclasts seeded on glass to study the lateral and axial localization of key components of the sealing zone. They show that for some components (vinculin, talin Cterminus), the axial localization was higher when molecules were in close proximity to the actin core while for other components (cortactin, actinin, filamin, paxillin), there was no difference in height as a function of distance from the actin core. They next show that random illumination microscopy (RIM) is a suited microscopy technique to study the sealing zone of osteoclasts on a bone mimetic substrate. They continue to use RIM to show that the dynamics of neighbouring podosomes correlate up to a distance of about 1.5um. They next show that within the sealing zone, groups of podosomes are surrounded by the classical adhesion adaptor proteins such as vinculin, talin and paxillin while actinin is present at the periphery of all single cores. This suggests that the sealing zone has an "intermediate" level of organization and that groups of podosomes form a functional unit within the sealing zone. The authors lastly demonstrate that the fluorescence intensity of the cores within these groups correlate with the intensity of the adaptor proteins that surrounds the group and that also the fluorescence intensity of the cores within one group correlates with each other.
Strengths:
The authors use bone slices to evaluate the nanoscale organization of cytoskeletal components in the sealing zone. Podosome conformations in osteoclasts strongly depend on the substrate type and the usage of bone slices accurately mimics the physiological environment in which osteoclasts reside in vivo.
The authors use state-of-the-art imaging approaches to evaluation the nanoscale organization and dynamics of multiple podosome components in the sealing zone.
The identification of groups of podosomes that demonstrate correlated dynamics within the sealing zone is a novel finding that is convincingly demonstrated.
We thank the reviewer for these encouraging comments and the valuable suggestions below.
Weaknesses:
The rationale for the analysis performed on the DONALD super-resolution images (explained in Figure S1) is unclear. The analysis is also not properly explained and it is unclear how the data should be interpreted or put into context. Specific comments related to this analysis:
– The authors make a distinction between towards the internal or external part of the cell when it comes to the height of the investigated proteins but it is unclear why this is done. Also, while the authors make this distinction, no conclusions are derived from this distinction and only the height values from towards the internal part of the cell are mentioned in the text.
As the sealing zone is usually located near the cell periphery, we wondered whether the proximity of the peripheral plasma membrane could influence the molecular architecture of the structure, and a possible difference in tension between the inner and outer parts, and this is why we distinguished between the inner and outer side of the structures. However, our analyses revealed little difference between these two sides, the most striking being a closer proximity of the vinculin to the cores on the outer side of the belt. We now make this explicit in the manuscript (P3, L113116).
- It is very much unclear how the distance of the investigated proteins towards the actin core is calculated. From Figure S1, it seems like a rectangle is taken that is centered around a podosome but the rectangle in the example contains more than one core. It seems like this would influence a proper interpretation of the data presented in the figures than contain the height values. The authors should better explain how the analysis was performed and how the analysis deals with the presence of multiple podosome cores in the rectangle of interest.
We apologize for this omission. In order not to bias the analysis, the protein distance was calculated for all cores present, not just one. This is now specified in the legend of the figure.
- In the text, the distance of the proteins with respect to the actin core is given (350nm-710nm depending on the specific protein and localization towards the external or internal part of the cell). It is mentioned that the measurements are not shown but it should be better explained how these numbers were derived from the data and the measurements (average, SD/SEM) should be shown.
These values correspond to the maxima of the distributions of the different podosome markers shown in Figure 1G. Each of these proteins (vinculin, talin, filamin-A and paxillin) has a broad distribution marked by a depletion at the core, and not a peak as suggested by the first version of the manuscript. We propose not to indicate these values in the revised version in order to simplify the manuscript and not to confuse the reader.
- Related to the previous comment. While it is mentioned that vinculin for example is located at ~500nm from the actin core, the height values (Figure 1E) are binned within 50nm of the core. This does not seem to match. It would be very helpful if the authors would add how many localizations are found so close to the core. Since this is expected to be low it would also be valuable it the authors would discuss what this means for difference in height between the molecules found close by and away from the core.
Indeed, as shown in Figure 1G, vinculin is much less present in the center of actin cores than at 500 nm from these cores. The graph shown in Figure 1E, which shows the height of vinculin as a function of the distance to the core, without explaining the proportion of molecules detected, can indeed be confusing. This being said, a large number of molecules were detected, 197967 for the vinculin graph, including 5973 within 300 nm around the core, which is far from being negligible. To facilitate the understanding of this graph, as well as that of the graphs corresponding to the heights of the other proteins studied (Figures 1 and S2), we now superimpose on the height distributions, the frequency of the locations (new Figure 1E,F), still compiled in Figure 1G.
- For cortactin, filamin A and actinin it is found that they reside on average at a height of approximately 150nm, even up to a large distance from the podosome core. It is unclear how these values should be interpreted. 150nm is way above the location where actin is expected to be (and also way above the average actin height that is found by the authors, with approximately 80nm more distant from the cores). The authors should add a discussion of what type of structures cortactin, filamin A and actinin would associate to at this position or how this height can be explained. This should also be included in the final model of Figure 6. In the current cartoon, filamin A for example seems to be associated with the integrins but this does not match with the height position observed by the authors.
The average heights of cortactin, filamin-A and actinin are indeed around 150 nm, but are actually present over a wider range of heights (0-400nm), as shown in the histograms in Figure 1H. These values are therefore not inconsistent with the distribution of actin, which indeed has a lower average height, but is also present over this entire height (histogram now added in Figure 1H). These analyses suggest that there are different sets of actin filaments and that there is proportionally more cortactin, filamin-A and actinin on the high actin filaments, rather than on those close to the plasma membranes. To fully account for these results, we now point out the potential presence of different sets of actin filaments in the discussion (P7, L266-275) and corrected the model shown in the new Figure 6, placing a population of filamin A on the radial filaments, not just associated with integrins, and added filamin A and actinin in the side view of the model, to appreciate their likely localisation.
The authors mention that the RIM resolution is 100nm and 300nm in the lateral and axial direction, respectively. This should also be confirmed on the bone slices with beads. It is well conceivable that the optical properties of bone have an effect on the optimal RIM resolution.
In order to evaluate RIM resolution on osteoclast samples, as suggested by the reviewer, we did some experiments with beads and used the Fourier Ring Correlation Method (Nieuwenhuizen et al., Nat Methods 2013). This consists in making two RIM images with two different speckle illumination sequences, and comparing the correlations of the images in the Fourier space. The following figure shows the correlation curve as a function of spatial frequencies. The FIRE number, when the FRC curve reaches a correlation value of 1/7, gives an estimation of the resolution of the image.
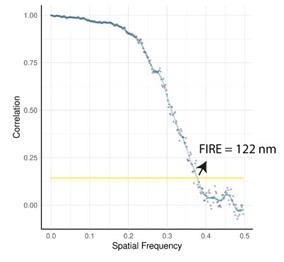
Using this approach, we evaluated the resolution to be of 125 nm, in average.
The authors find three specific fluctuation periods (100s/25s/7s) but it is unclear what these periods mean. The authors only very briefly mention that these periods correlate with similar observations in macrophages but they should also add the implications of this finding and suggested a possible molecular mechanism that underlies these different fluctuations.
We agree with this comment. So far, the mechanisms regulating these oscillations, whether purely mechanical or involving signaling, as well as and their importance for podosome and sealing zone function, are not yet understood. In van den Dries et al. Nat Commun 2013 and Labernadie et al. Nat Commun 2014, it was shown that these oscillations in macrophage podosomes depend on myosin IIA activity. It would thus be interesting to explore the effects of drugs interfering with actin polymerization on both the periodicity and the spatial synchrony properties of the sealing zone. We now discuss this point in the manuscript (P7, L296-300).
The authors find that actinin-1 is localized around the podosome cores while filamin and vinculin surround groups of podosomes. The current representative images, though, that are chosen to support this difference display a very different density in podosome cores. The filamin and vinculin images seems to have a much denser podosome content compare to the actinin and cortactin images. I would encourage the authors to select images that are more comparable to fully appreciate the difference in localization of the associated proteins.
This is a good point. Indeed, not all sealing zones are alike, especially with respect to the density of actin cores. This is why we have chosen to show a gallery of different cases (now in Figure S7), and not to intentionally select always the same patterns in the main figures in order not to mislead the reader. It is important to note that whatever the actin density, we find the same locations for the different proteins.
In Figure 4 and 5, the authors show that the sealing zone is subdivided in groups of podosomes and it is implied that these for functional units within the sealing zone. Yet, it is unclear how persistent these groups are. Considering the dynamic nature of podosomes in other cell types (and as also demonstrated in the supplementary movies) it is well conceivable that these groups continuously fuse and remodel. To better define the nature of these groups of podosomes, the authors should add an analysis on these podosome groups and measure parameters such as group stability, podosome number per group, group size etc. This would very much enhance the novel aspects of the findings in this paper.
Following the reviewer’s suggestion, we have quantified the number of podosomes per group and the group size. Measurements of these islets of clustered cores showed that they were 2.3 +/-2.1 µm² (average +/-SD) and contained in 7 +/-8 (average +/-SD) cores. These results are now included in the manuscript (P6, L213). Unfortunately, we could not accurately measure the stability of the clusters, as this would require a long, and challenging, time-lapse by RIM of osteoclasts expressing both paxillin-GFP and lifeact-mCherry, which we were able to achieve only on a few cells and on short timescales.
The authors mention in the discussion that their finding about the groups of podosomes is very different from the "double circle" distribution found in previous publications. Yet, it is unclear what explains these different observations. While the authors use RIM super-resolution in this paper to assess the localization of the adaptor proteins, it is very unlikely that this is the source of this difference since the groups of podosomes would have been easily identified by conventional or confocal microscopy as well. The authors should add an extended discussion on how these differences could be explained and what this means for bone resorption properties.
Indeed, our observation that the sealing zone is composed of islets of actin cores that are bordered by a network of adhesion complexes diverge from most of the previous studies describing a “double circle” organization. We believe that this difference may come, not only from the high resolution of our images, but mainly from the fact that most studies on the organization of sealing zones have been performed on mouse osteoclasts. We also believe that this particular organisation probably allows an efficient sealing of the osteoclast plasma membrane to the bone surface and maintains the resorption lacuna and the diffusion barrier. We now indicate this in the discussion (L7, P286-288).
-
Evaluation Summary:
In this manuscript, the authors studied, using different types of microscopy, the structure and function of podosomes in primary human osteoclasts, providing interesting new insights into the organization and dynamics of the osteoclast sealing zone. The authors describe the general structure of the actin rings of osteoclasts and explore the dynamics of actin and associated proteins in the actin ring, proposing a model in which the function of podosomes during bone resorption is accomplished through the coordination of islets of the actin core and not through the global coordination of all podosome subunits that form the sealing zone. This article has the potential to generate a significant impact in the field of osteoclast biology. Notably, this study could also expand the understanding of matrix degradation/invasion …
Evaluation Summary:
In this manuscript, the authors studied, using different types of microscopy, the structure and function of podosomes in primary human osteoclasts, providing interesting new insights into the organization and dynamics of the osteoclast sealing zone. The authors describe the general structure of the actin rings of osteoclasts and explore the dynamics of actin and associated proteins in the actin ring, proposing a model in which the function of podosomes during bone resorption is accomplished through the coordination of islets of the actin core and not through the global coordination of all podosome subunits that form the sealing zone. This article has the potential to generate a significant impact in the field of osteoclast biology. Notably, this study could also expand the understanding of matrix degradation/invasion in other tissues.
(This preprint has been reviewed by eLife. We include the public reviews from the reviewers here; the authors also receive private feedback with suggested changes to the manuscript. Reviewer #1 agreed to share their name with the authors.)
-
Reviewer #1 (Public Review):
In the manuscript, "Nanoscale architecture and coordination of actin cores within the sealing zone of human osteoclasts" by Portes and colleagues several types of static and dynamic microscopy are used to develop a better molecular picture of the podosomes and actin rings of osteoclasts.
A summary of what the authors were trying to achieve:
Describe the overall structure of actin rings of osteoclasts. Examine the dynamics of the actin and associated proteisn in the actin ring. Provide support for a model in which force is applied by the podosomes through actin polymerization and this is countered by attachments through integrins and associated proteins
An account of the major strengths and weaknesses of the methods and results:
Strengths, new and state of the art microscopy techniques are brought to bear. …
Reviewer #1 (Public Review):
In the manuscript, "Nanoscale architecture and coordination of actin cores within the sealing zone of human osteoclasts" by Portes and colleagues several types of static and dynamic microscopy are used to develop a better molecular picture of the podosomes and actin rings of osteoclasts.
A summary of what the authors were trying to achieve:
Describe the overall structure of actin rings of osteoclasts. Examine the dynamics of the actin and associated proteisn in the actin ring. Provide support for a model in which force is applied by the podosomes through actin polymerization and this is countered by attachments through integrins and associated proteins
An account of the major strengths and weaknesses of the methods and results:
Strengths, new and state of the art microscopy techniques are brought to bear. The anaysis is quantitative. Primary osteoclasts are studied. A quantitative data based model is presented.
Weaknesses, data is presented sometimes in a less than fully transparent manner in that certain deatils are omitted or not presented clearly. The underlying problem, that the podosome are undergoing rapid directed polymerization and depolymerization is not well described or integrated into models presented.An appraisal of whether the authors achieved their aims, and whether the results support their conclusions:
The authors achieve their goals in describing the actin rings using different techniques which gives a valuable different picture. Their data do support the protrusion/traction model they have presented previously. I think the model could better integrate the source of the protrusion, regulated directed actin polymerization pushing against the membrane.
A discussion of the likely impact of the work on the field, and the utility of the methods and data to the community:
This impacts the community of actin biologists ad osteoclast biologists by providing further data supporting the protrusion/traction idea. There are various predictions that come from this model.
Additional context:
Actin rings are a special adaptation of machinery cells use to invade matrix. With mineralized matrix, the osteoclasts has to take the basic structure of the podosome, and form a higher order structure, in order to form the sealing zone and segragated extracellular resorption compartment. Understanding of podosomes of osteoclasts likely translates to understanding matrix invasion in general.
-
Reviewer #2 (Public Review):
Portes et al. investigated the nanoscale architecture and dynamics of the osteoclast sealing zone using high-end microscopy techniques. They first use DONALD 3D single molecule localization microscopy on osteoclasts seeded on glass to study the lateral and axial localization of key components of the sealing zone. They show that for some components (vinculin, talin C-terminus), the axial localization was higher when molecules were in close proximity to the actin core while for other components (cortactin, actinin, filamin, paxillin), there was no difference in height as a function of distance from the actin core. They next show that random illumination microscopy (RIM) is a suited microscopy technique to study the sealing zone of osteoclasts on a bone mimetic substrate. They continue to use RIM to show that …
Reviewer #2 (Public Review):
Portes et al. investigated the nanoscale architecture and dynamics of the osteoclast sealing zone using high-end microscopy techniques. They first use DONALD 3D single molecule localization microscopy on osteoclasts seeded on glass to study the lateral and axial localization of key components of the sealing zone. They show that for some components (vinculin, talin C-terminus), the axial localization was higher when molecules were in close proximity to the actin core while for other components (cortactin, actinin, filamin, paxillin), there was no difference in height as a function of distance from the actin core. They next show that random illumination microscopy (RIM) is a suited microscopy technique to study the sealing zone of osteoclasts on a bone mimetic substrate. They continue to use RIM to show that the dynamics of neighbouring podosomes correlate up to a distance of about 1.5um. They next show that within the sealing zone, groups of podosomes are surrounded by the classical adhesion adaptor proteins such as vinculin, talin and paxillin while actinin is present at the periphery of all single cores. This suggests that the sealing zone has an "intermediate" level of organization and that groups of podosomes form a functional unit within the sealing zone. The authors lastly demonstrate that the fluorescence intensity of the cores within these groups correlate with the intensity of the adaptor proteins that surrounds the group and that also the fluorescence intensity of the cores within one group correlates with each other.
Strengths:
The authors use bone slices to evaluate the nanoscale organization of cytoskeletal components in the sealing zone. Podosome conformations in osteoclasts strongly depend on the substrate type and the usage of bone slices accurately mimics the physiological environment in which osteoclasts reside in vivo.
The authors use state-of-the-art imaging approaches to evaluation the nanoscale organization and dynamics of multiple podosome components in the sealing zone.
The identification of groups of podosomes that demonstrate correlated dynamics within the sealing zone is a novel finding that is convincingly demonstrated.
Weaknesses:
The rationale for the analysis performed on the DONALD super-resolution images (explained in Figure S1) is unclear. The analysis is also not properly explained and it is unclear how the data should be interpreted or put into context. Specific comments related to this analysis:
- The authors make a distinction between towards the internal or external part of the cell when it comes to the height of the investigated proteins but it is unclear why this is done. Also, while the authors make this distinction, no conclusions are derived from this distinction and only the height values from towards the internal part of the cell are mentioned in the text.
- It is very much unclear how the distance of the investigated proteins towards the actin core is calculated. From Figure S1, it seems like a rectangle is taken that is centered around a podosome but the rectangle in the example contains more than one core. It seems like this would influence a proper interpretation of the data presented in the figures than contain the height values. The authors should better explain how the analysis was performed and how the analysis deals with the presence of multiple podosome cores in the rectangle of interest.
- In the text, the distance of the proteins with respect to the actin core is given (350nm-710nm depending on the specific protein and localization towards the external or internal part of the cell). It is mentioned that the measurements are not shown but it should be better explained how these numbers were derived from the data and the measurements (average, SD/SEM) should be shown.
- Related to the previous comment. While it is mentioned that vinculin for example is located at ~500nm from the actin core, the height values (Figure 1E) are binned within 50nm of the core. This does not seem to match. It would be very helpful if the authors would add how many localizations are found so close to the core. Since this is expected to be low it would also be valuable it the authors would discuss what this means for difference in height between the molecules found close by and away from the core.
- For cortactin, filamin A and actinin it is found that they reside on average at a height of approximately 150nm, even up to a large distance from the podosome core. It is unclear how these values should be interpreted. 150nm is way above the location where actin is expected to be (and also way above the average actin height that is found by the authors, with approximately 80nm more distant from the cores). The authors should add a discussion of what type of structures cortactin, filamin A and actinin would associate to at this position or how this height can be explained. This should also be included in the final model of Figure 6. In the current cartoon, filamin A for example seems to be associated with the integrins but this does not match with the height position observed by the authors.
The authors mention that the RIM resolution is 100nm and 300nm in the lateral and axial direction, respectively. This should also be confirmed on the bone slices with beads. It is well conceivable that the optical properties of bone have an effect on the optimal RIM resolution.
The authors find three specific fluctuation periods (100s/25s/7s) but it is unclear what these periods mean. The authors only very briefly mention that these periods correlate with similar observations in macrophages but they should also add the implications of this finding and suggested a possible molecular mechanism that underlies these different fluctuations.
The authors find that actinin-1 is localized around the podosome cores while filamin and vinculin surround groups of podosomes. The current representative images, though, that are chosen to support this difference display a very different density in podosome cores. The filamin and vinculin images seems to have a much denser podosome content compare to the actinin and cortactin images. I would encourage the authors to select images that are more comparable to fully appreciate the difference in localization of the associated proteins.
In Figure 4 and 5, the authors show that the sealing zone is subdivided in groups of podosomes and it is implied that these for functional units within the sealing zone. Yet, it is unclear how persistent these groups are. Considering the dynamic nature of podosomes in other cell types (and as also demonstrated in the supplementary movies) it is well conceivable that these groups continuously fuse and remodel. To better define the nature of these groups of podosomes, the authors should add an analysis on these podosome groups and measure parameters such as group stability, podosome number per group, group size etc. This would very much enhance the novel aspects of the findings in this paper.
The authors mention in the discussion that their finding about the groups of podosomes is very different from the "double circle" distribution found in previous publications. Yet, it is unclear what explains these different observations. While the authors use RIM super-resolution in this paper to assess the localization of the adaptor proteins, it is very unlikely that this is the source of this difference since the groups of podosomes would have been easily identified by conventional or confocal microscopy as well. The authors should add an extended discussion on how these differences could be explained and what this means for bone resorption properties.
-
