Finger somatotopy is preserved after tetraplegia but deteriorates over time
Curation statements for this article:-
Curated by eLife

Evaluation Summary:
This paper investigates the stability of the somatotopic organization of somatosensory cortex after spinal cord injury that results in tetraplegia. The findings suggest that somatotopic maps are preserved, degrading very slowly over decades, but that the amount of spared function is a poor predictor of somatotopic stability. These findings contribute to a developing story on how sensory representations are formed and maintained and has implications for the development of brain-machine interfaces for individuals with tetraplegia. The study is interesting and the manuscript is well-written. There remain concerns about some choices taken in the analyses.
(This preprint has been reviewed by eLife. We include the public reviews from the reviewers here; the authors also receive private feedback with suggested changes to the manuscript. Reviewer #3 agreed to share their name with the authors.)
This article has been Reviewed by the following groups
Discuss this preprint
Start a discussion What are Sciety discussions?Listed in
- Evaluated articles (eLife)
Abstract
Previous studies showed reorganised and/or altered activity in the primary sensorimotor cortex after a spinal cord injury (SCI), suggested to reflect abnormal processing. However, little is known about whether somatotopically specific representations can be activated despite reduced or absent afferent hand inputs. In this observational study, we used functional MRI and a (attempted) finger movement task in tetraplegic patients to characterise the somatotopic hand layout in primary somatosensory cortex. We further used structural MRI to assess spared spinal tissue bridges. We found that somatotopic hand representations can be activated through attempted finger movements in the absence of sensory and motor hand functioning, and no spared spinal tissue bridges. Such preserved hand somatotopy could be exploited by rehabilitation approaches that aim to establish new hand-brain functional connections after SCI (e.g. neuroprosthetics). However, over years since SCI the hand representation somatotopy deteriorated, suggesting that somatotopic hand representations are more easily targeted within the first years after SCI.
Article activity feed
-

-

Author Response:
Reviewer #1:
This work provides insight into the effects of tetraplegia on the cortical representation of the body in S1. By using fMRI and an attempted finger movement task, the researchers were able to show preserved fine-grained digit maps - even in patients without sensory and motor hand function as well as no spared spinal tissue bridges. The authors also explored whether certain clinical and behavioral determinates may contribute to preserving S1 somatotopy after spinal cord injury.
Overall I found the manuscript to be well-written, the study to be interesting, and the analysis reasonable. I do, however, think the manuscript would benefit by considering and addressing two main suggestions.
- Provide additional context / rationale for some of the methods. Specific examples below:
a) The rationale behind …
Author Response:
Reviewer #1:
This work provides insight into the effects of tetraplegia on the cortical representation of the body in S1. By using fMRI and an attempted finger movement task, the researchers were able to show preserved fine-grained digit maps - even in patients without sensory and motor hand function as well as no spared spinal tissue bridges. The authors also explored whether certain clinical and behavioral determinates may contribute to preserving S1 somatotopy after spinal cord injury.
Overall I found the manuscript to be well-written, the study to be interesting, and the analysis reasonable. I do, however, think the manuscript would benefit by considering and addressing two main suggestions.
- Provide additional context / rationale for some of the methods. Specific examples below:
a) The rationale behind using the RSA analysis seemed to be predicated on the notion that the signals elicited via a phase-encoded design can only yield information about each voxel's preferred digit and little-to-no information about the degree of digit overlap (see lines 163-166 and 571-575). While this is the case for conventional analyses of these signals, there are more recently developed approaches that are now capable of estimating the degree of somatotopic overlap from phase-encoded data (see: Da Rocha Amaral et al., 2020; Puckett et al., 2020). Although I personally would be interested in seeing one of these types of analyses run on this data, I do not think it is necessary given the RSA data / analysis. Rather, I merely think it is important to add some context so that the reader is not misled into believing that there is no way to estimate this type of information from phase-encoded signals.
- Da Rocha Amaral S, Sanchez Panchuelo RM, Francis S (2020) A Data-Driven Multi-scale Technique for fMRI Mapping of the Human Somatosensory Cortex. Brain Topogr 33 (1):22-36. doi:10.1007/s10548-019-00728-6
- Puckett AM, Bollmann S, Junday K, Barth M, Cunnington R (2020) Bayesian population receptive field modeling in human somatosensory cortex. Neuroimage 208:116465. doi:10.1016/j.neuroimage.2019.116465
We did not intend to give the impression that inter-finger overlap can only be estimated using RSA. To clarify this, we included a sentence in our methods section stating that inter-finger overlap cannot be estimated using the traditional travelling wave approach, but new methods have estimated somatotopic overlap from travelling wave data. Since our RSA approach lends itself for estimating inter-finger overlap and is currently the gold standard in characterizing these representational patterns, we opt –in accordance with the reviewer’s comment– not to include this additional analysis.
Revised text Methods:
“While the traditional traveling wave approach is powerful to uncover the somatotopic finger arrangement, a fuller description of hand representation can be obtained by taking into account the entire fine-grained activity pattern of all fingers. RSA-based inter-finger overlap patterns have been shown to depict the invariant representational structure of fingers better than the size, shape, and exact location of the areas activated by finger movements (Ejaz et al., 2015). RSA-based measures are furthermore not prone to some of the problems of measurements of finger selectivity (e.g., dependence on map thresholds). The most common approach for investigating inter-finger overlap is RSA, as used here, though note that somatotopic overlap has recently been estimated from travelling wave data using an iterated Multigrid Priors (iMGP) method and population receptive field modelling (Da Rocha Amaral et al., 2020; Puckett et al., 2020).”
b. The rationale for using minimally thresholded (Z>2) data for the Dice overlap analysis as opposed to the threshold used in data visualization (q<0.05) was unclear. Providing the minimally thresholded maps (in Supplementary) would also aid interpretation of the Dice overlap results.
We followed previously published procedures for calculating the Dice overlap between the two split-halves of the data (Kikkert et al., 2016; J. Kolasinski et al., 2016; Sanders et al., 2019). We used minimally thresholded data to calculate the dice overlap to ensure that our analysis was sensitive to overlaps that would be missed when using high thresholds. We clarified this in the revised manuscript. We thank the reviewer for their suggestion to add a Figure displaying the minimally thresholded split-half hard-edged finger maps - we have added this to the revised manuscript as Figure 2-Figure supplement 1.
To ensure that our thresholding procedure did not change the results of the dice overlap analysis, we repeated this analysis using split-half maps that were thresholded using a q < 0.05 FDR criterion (as was used to create the travelling wave maps in Figures 2A-B). We found the same results as when using the Z >2 thresholding criterion: Overall, split-half consistency was not significantly different between patients and controls, as tested using a robust mixed ANOVA (F(1,17.69) = 0.08, p = 0.79). There was a significant difference in split- half consistency between pairs of same, neighbouring, and non-neighbouring fingers (F(2,14.77) = 38.80, p < 0.001). This neighbourhood relationship was not significantly different between the control and patient groups (i.e., there was no significant interaction; F(2,14.77) = 0.12, p = 0.89). We have included this analysis and the relating figure as Figure 2- Figure supplement 2 in the revised manuscript.
Revised text Methods:
“We followed previously described procedures for calculating the DOC between two halves of the travelling wave data (Kikkert et al., 2016; Kolasinski et al., 2016; Sanders et al., 2019). The averaged finger-specific maps of the first forward and backward runs formed the first data half. The averaged finger-specific maps of the second forward and backward runs formed the second data half. The finger-specific clusters were minimally thresholded (Z>2) on the cortical surface and masked using an S1 ROI, created based on Brodmann area parcellation using Freesurfer (see Figure 2– figure supplement 1 for a visualisation of the minimally thresholded split-half hard-edged finger maps used to calculate the DOC). We used minimally thresholded finger-specific clusters for the DOC analysis to ensure we were sensitive to overlaps that would be missed when using high thresholds. Note that results were unchanged when thresholding the finger-specific clusters using an FDR q < 0.05 criterion (see Figure 2 – figure supplement 2).”
- Provide a more thorough discussion - particularly with respect to the possible role of top-down processes (e.g., attention).
a) The authors discuss a few potential signal sources that may contribute to the maintenance of (and ability to measure) the somatotopic maps; however, the overall interpretation seems a bit "motor efferent heavy". That is, it seems the authors favor an explanation that the activity patterns measured in S1 were elicited by efference copies from the motor system and that occasional corollary discharges or attempted motor movements play a role in their maintenance over time. The authors consider other explanations, noting - for example - the potential role of attention in preserving the somatotopic representations given that attention has been shown to be able to activate S1 hand representations. The mention of this was, however, rather brief - and I believe the issue deserves a bit more of a balanced consideration.
When the authors consider the possible role of attention in maintaining the somatotopic representations (lines 329-333), they mention that observing others' fingers being touched or attending to others' finger movements may contribute. But there is no mention of attending to one's own fingers (which has been shown to elicit activity as cited). I realize that the patients lack sensorimotor function (and hence may find it difficult to "attend" to their fingers); however, they have all had prior experience with their fingers and therefore might still be able to attend to them (or at least the idea of their digits) such that activity is elicited. For example, it is not clear to me that it would be any more difficult for the patients to be asked to attend to their digits compared to being asked to attempt to move their digits. I would even suggest that attempting to move a digit (regardless of whether you can or not) requires that one attends to the digit before attempting to initiate the movement as well as throughout the attempted motor movement. Because of this, it seems possible that attention-related processes could be playing a role in or even driving the signals measured during the attempted movement task - as well as those involved in the ongoing maintenance of the maps after injury. I don't think this possibility can be dismissed given the data in hand, but perhaps the issue could be addressed by a bit more thorough of a discussion on the process of "attempting to move" a digit (even one that does not move) - and the various top-down processes that might be involved.
We thank the reviewer for their consideration and insights into the potential mechanisms underlying our results. We have now elaborated further on the possibility that attention- related processes might have contributed to the reported effects, also in consideration of comment 3.4.
Revised text Discussion:
“Spared spinal cord tissue bridges can be found in most patients with a clinically incomplete injury, their width being predictive of electrophysiological information flow, recovery of sensorimotor function, and neuropathic pain (Huber et al., 2017; Pfyffer et al., 2021, 2019; Vallotton et al., 2019). However, in this study, spared midsagittal spinal tissue bridges at the lesion level, motor function, and sensory function did not seem necessary to maintain and activate a somatotopic hand representation in S1. We found a highly typical hand representation in two patients (S01 and S03) who did not have any spared spinal tissue bridges at the lesion level, a complete (S01) or near complete (S03) hand paralysis, and a complete (S01) or near complete loss (S03) of hand sensory function. Our predictive modelling results were in line with this notion and showed that these behavioural and structural spinal cord determinants were not predictive of hand representation typicality. Note however that our sample size was limited, and it is challenging to draw definite conclusions from non-significant predictive modelling results.”
“How may these representations be preserved over time and activated through attempted movements in the absence of peripheral information? S1 is reciprocally connected with various brain areas, e.g., M1, lateral parietal cortex, poster parietal area 5, secondary somatosensory cortex, and supplementary motor cortex (Delhaye et al., 2019). After loss of sensory inputs and paralysis through SCI, S1 representations may be activated and preserved through its interconnections with these areas. Firstly, it is possible that cortico-cortical efference copies may keep a representation ‘alive’ through occasional corollary discharge (London and Miller, 2013). While motor and sensory signals no longer pass through the spinal cord in the absence of spinal tissue bridges, S1 and M1 remain intact. When a motor command is initiated (e.g., in the form of an attempted hand movement) an efference copy is thought to be sent to S1 in the form of corollary discharge. This corollary discharge resembles the expected somatosensory feedback activity pattern and may drive somatotopic S1 activity even in the absence of ascending afferent signals from the hand (Adams et al., 2013; London and Miller, 2013). It is possible that our patients occasionally performed attempted movements which would result in corollary discharge in S1. Second, it is likely that attempting individual finger movements poses high attentional demands on tetraplegic patients. Accordingly, attentional processes might have contributed to eliciting somatotopic S1 activity. Evidence for this account comes from studies showing that it is possible to activate somatotopic S1 hand representations through attending to individual fingers (Puckett et al., 2017) or through touch observation (Kuehn et al., 2018). Attending to fingers during our attempted finger movement task may have been sufficient to elicit somatotopic S1 activity through top-down processes in the tetraplegic patients who lacked hand motor and sensory function. Furthermore, one might speculate that observing others’ or one’s own fingers being touched or directing attention to others’ hand movements or one’s own fingers may help preserve somatotopic representations. Third, it is possible that these somatotopic maps are relatively hardwired and while they deteriorate over time, they never fully disappear. Indeed, somatotopic mapping of a sensory deprived body part has been shown to be resilient after dystonia (Ejaz et al., 2016; though see Burman et al., (2009) and Taub et al., (1998)) and arm amputation (Bruurmijn et al., 2017; Kikkert et al., 2016; Wesselink et al., 2019). Fourth, it is possible that even though a patient is clinically assessed to be complete and is unable to perceive sensory stimuli on the deprived body part, there is still some ascending information flow that contributes to preserving somatotopy (Wrigley et al., 2018). A recent study found that although complete paraplegic SCI patients were unable to perceive a brushing stimulus on their toe, 48% of patients activated the location appropriate S1 area (Wrigley et al., 2018). However, the authors of this study defined the completeness of patients’ injuries via behavioural testing, while we additionally assessed the retained connections passing through the SCI directly via quantification of spared spinal tissue bridges through structural MRI. It is unlikely that spinal tissue carrying somatotopically organised information would be missed by our assessment (Huber et al., 2017; Pfyffer et al., 2019). Our experiment did not allow us to tease apart these potential processes and it is likely that various processes simultaneously influence the preservation of S1 somatotopy and elicited the observed somatotopic S1 activity.”
Reviewer #2:
The authors investigate SCI patients and characterize the topographic representation of the hand in sensorimotor cortex when asked to move their hand (which controls could do but patients could not). The authors compare some parameters of topographic map organization and conclude that they do not differ between patients and controls, whereas they find changes in the typicality of the maps that decrease with years since disease onset in patients. Whereas these initial analyses are interesting, they are not clearly related to a mechanistic model of the disorder and the underlying pathophysiology that is expected in the patients. Furthermore, additional analyses on more fine-grained map changes are needed to support the authors' claims. Finally, the major result of changed typicality in the patients is in my view not valid.
- Concept 1. At present, there is no clear hypotheses about the (expected or hypothesized) mechanistic changes of the sensorimotor maps in the patients. The authors refer to "altered" maps and repeatedly say that "results are mixed" (3 times in the introduction).
We thank the reviewer for highlighting to us that our introduction and hypotheses were unclear and/or incomplete to them. We have restructured our Introduction to better highlight competing hypotheses on how SCI may change S1 hand representations, the reasons for our analytical approach, and elaborate on our hypotheses.
Revised text Introduction:
“Research in non-human primate models of chronic and complete cervical SCI has shown that the S1 hand area becomes largely unresponsive to tactile hand stimulation after the injury (Jain et al., 2008; Kambi et al., 2014; Liao et al., 2021). The surviving finger-related activity became disorganised such that a few somatotopically appropriate sites but also other somatotopically nonmatched sites were activated (Liao et al., 2021). Seminal nonhuman primate research has further demonstrated that SCI leads to extensive cortical reorganisation in S1, such that tactile stimulation of cortically adjacent body parts (e.g., of the face) activated the deprived brain territory (e.g., of the hand; Halder et al., 2018; Jain et al., 2008; Kambi et al., 2014). Although the physiological hand representation appears to largely be altered following a chronic cervical SCI in non-human primates, the anatomical isomorphs of individual fingers are unchanged (Jain et al., 1998). This suggests that while a hand representation can no longer be activated through tactile stimulation after the loss of afferent spinal pathways, a latent and somatotopic hand representation could be preserved regardless of large-scale physiological reorganisation.
A similar pattern of results has been reported for human SCI patients. Transcranial magnetic stimulation (TMS) studies induced current in localised areas of SCI patient’s M1 to induce a peripheral muscle response. They found that representations of more impaired muscles retract or are absent while representations of less impaired muscles shift and expand (Fassett et al., 2018; Freund et al., 2011a; Levy et al., 1990; Streletz et al., 1995; Topka et al., 1991; Urbin et al., 2019). Similarly, human fMRI studies have shown that cortically neighbouring body part representations can shift towards, though do not invade, the deprived M1 and S1 cortex (Freund et al., 2011b; Henderson et al., 2011; Jutzeler et al., 2015; Wrigley et al., 2018, 2009). Other human fMRI studies hint at the possibility of latent somatotopic hand representations following SCI by showing that attempted movements with the paralysed and sensory deprived body part can still evoke signals in the sensorimotor system (Cramer et al., 2005; Freund et al., 2011b; Kokotilo et al., 2009; Solstrand Dahlberg et al., 2018). This attempted ‘net’ movement activity was, however, shown to substantially differ from healthy controls: Activity levels have been shown to be increased (Freund et al., 2011b; Kokotilo et al., 2009; Solstrand Dahlberg et al., 2018) or decreased (Hotz- Boendermaker et al., 2008), volumes of activation have been shown to be reduced (Cramer et al., 2005; Hotz-Boendermaker et al., 2008), activation was found in somatotopically nonmatched cortical sites (Freund et al., 2011b), and activation was poorly modulated when patients switched from attempted to imagined movements (Cramer et al., 2005). These observations have therefore mostly been attributed to abnormal and/or disorganised processing induced by the SCI. It remains possible though that, despite certain aspects of sensorimotor activity being altered after SCI, somatotopically typical representations of the paralysed and sensory deprived body parts can be preserved (e.g., finger somatotopy of affected hand). Such preserved representations have the potential to be exploited in a functionally meaningful manner (e.g., via neuroprosthetics).
Case studies using intracortical stimulation in the S1 hand area to elicit finger sensations in SCI patients hint at such preserved somatotopic representations (Fifer et al., 2020; Flesher et al., 2016), with one exception (Armenta Salas et al., 2018). Negative results were suggested to be due to a loss of hand somatotopy and/or reorganisation in S1 of the implanted SCI patient or due to potential misplacement of the implant (Armenta Salas et al., 2018). Whether fine-grained somatotopy is generally preserved in the tetraplegic patient population remains unknown. It is also unclear what clinical, behavioural, and structural spinal cord determinants may influence such representations to be maintained. Here we used functional MRI (fMRI) and a visually cued (attempted) finger movement task in tetraplegic patients to examine whether hand somatotopy is preserved following a disconnection between the brain and the periphery. We instructed patients to perform the fMRI tasks with their most impaired upper limb and matched controls’ tested hands to patients’ tested hands. If a patient was unable to make overt finger movements due to their injury, then we carefully instructed them to make attempted (i.e., not imagined) finger movements. To see whether patient’s maps exhibited characteristics of somatotopy, we visualised finger selectivity in S1 using a travelling wave approach. To investigate whether fine-grained hand somatotopy was preserved and could be activated in S1 following SCI, we assessed inter-finger representational distance patterns using representational similarity analysis (RSA). These inter-finger distance patterns are thought to be shaped by daily life experience such that fingers used more frequently together in daily life have lower representational distances (Ejaz et al., 2015). RSA-based inter-finger distance patterns have been shown to depict the invariant representational structure of fingers in S1 and M1 better than the size, shape, and exact location of the areas activated by finger movements (Ejaz et al., 2015). Over the past years RSA has therefore regularly been used to investigate somatotopy of finger representations both in healthy (e.g., Akselrod et al., 2017; Ariani et al., 2020; Ejaz et al., 2015; Gooijers et al., 2021; Kieliba et al., 2021; Kolasinski et al., 2016; Liu et al., 2021; Sanders et al., 2019) and patient populations (e.g., Dempsey-Jones et al., 2019; Ejaz et al., 2016; Kikkert et al., 2016; Wesselink et al., 2019). We closely followed procedures that have previously been used to map preserved and typical somatotopic finger selectivity and inter-finger representational distance patterns of amputees’ missing hands in S1 using volitional phantom finger movements (Kikkert et al., 2016; Wesselink et al., 2019). However, in amputees, these movements generally recruit the residual arm muscles that used to control the missing limb via intact connections between the brain and spinal cord. Whether similar preserved somatotopic mapping can be observed in SCI patients with diminished or no connections between the brain and the periphery is unclear. If finger somatotopy is preserved in tetraplegic patients, then we should find typical inter-finger representational distance patterns in the S1 hand area of these patients. By measuring a group of fourteen chronic tetraplegic patients with varying amounts of spared spinal cord tissue at the lesion level (quantified by means of midsagittal tissue bridges based on sagittal T2w scans), we uniquely assessed whether preserved connections between the brain and periphery are necessary to preserve fine somatotopic mapping in S1 (Huber et al., 2017; Pfyffer et al., 2019). If spared connections between the periphery and the brain are not necessary for preserving hand somatotopy, then we would find typical inter-finger representational distance patterns even in patients without spared spinal tissue bridges. We also investigated what clinical and behavioural determinants may contribute to preserving S1 hand somatotopy after chronic SCI. If spared sensorimotor hand function is not necessary for preserving hand somatotopy, then we would find typical inter-finger representational distance patterns even in patients who suffer from full sensory loss and paralysis of the hand(s).”
They do not in detail report which results actually have been reported before, which is a major problem, because those prior results should have motivated the analyses the authors conducted. For instance, two of the cited studies found that in SCI patients, only ONE FINGER shifted towards the malfunctioning area (i.e., the small finger) whereas all other fingers were the same. However, the authors do NOT perform single finger analyses but always average their results ACROSS fingers. This is even true in spite of some patients indeed showing MISSING FINGERS as is clearly evident in the figure, and in spite of the clearly reduced distance of the thumb in the patients as is also visible in another figure. Nothing of this is seen in the results, because the ANOVA and analyses never have the factor of "finger". Instead, the authors always average the analyses across finger. The conclusion that the maps do not differ is therefore not justified at present. This severely reduces any conclusions that an be drawn from the data at present.
We apologise for the lack of clarity. We now added additional detail regarding studies showing altered sensorimotor processing following SCI. We also clarified that we based our analysis steps on previous studies investigating hand somatotopy following deafferentation (i.e., following arm amputation; Kikkert et al., 2016; Wesselink et al., 2019) and somatotopic reorganisation RSA- based inter-finger distance patterns have been shown to depict the invariant representational structure of fingers in S1 and M1 better than the size, shape, and exact location of the areas activated by finger movements (Ejaz et al., 2015). Over the past years RSA has therefore regularly been used to investigate somatotopy of finger representations both in healthy (e.g., Akselrod et al., 2017; Ariani et al., 2020; Ejaz et al., 2015; Gooijers et al., 2021; Kieliba et al., 2021; Kolasinski et al., 2016; Liu et al., 2021; Sanders et al., 2019) and patient populations (e.g. Dempsey-Jones et al., 2019; Ejaz et al., 2016; Kikkert et al., 2016; Wesselink et al., 2019). It is believed to be the most appropriate measure to reliably detect subtle changes in somatotopy. We adjusted the text in our revised Introduction section to better highlight this.
Please note that we do not average across fingers in our RSA typicality procedure. Instead, RSA considers how the (attempted) movement with one finger changes the activity pattern across the whole hand representation. Note that somatotopic reorganisation will change the inter-finger distance measured with this method as previously shown (Kieliba et al., 2021; Kolasinski et al., 2016; Wesselink et al., 2019).
Still, as per the reviewer’s suggestion, we conducted a robust mixed ANOVA on the RSA distance measures with a within-subjects factor for finger pair (10 levels) and a between- subjects factor for group (2 levels: controls and SCI patients). We did not find a significant group effect (F(1,21.66) = 1.50, p = 0.23). There was a significant difference in distance between finger pairs (F(9,15.38) = 27.22, p < 0.001), but this was not significantly different between groups (i.e., no significant finger pair by group interaction; F(9,15.38) = 1.05, p = 0.45). When testing for group differences per finger pair, the BF only revealed inconclusive evidence (BF > 0.37 and < 1.11; note that we could not run a Bayesian ANOVA due to normality violations). We have added this analysis to the revised manuscript.
Lastly, we would like to highlight that our argument is that the finger maps can be preserved in the absence of sensory and motor function, but over time they deteriorate and become less somatotopic. As such, we do not aim to state that they are unchanged overall – but rather that they can be unchanged even despite loss of sensory and motor function. We have clarified this in our abstract and manuscript to avoid confusion.
Revised abstract:
“Previous studies showed reorganised and/or altered activity in the primary sensorimotor cortex after a spinal cord injury (SCI), suggested to reflect abnormal processing. However,little is knownaboutwhether somatotopically-specific representations can be preserved despite alterations in net activity. In this observational study we used functional MRI and an (attempted) finger movement task in tetraplegic patients to characterise the somatotopic hand layout in primary somatosensory cortex. We further used structural MRI to assess spared spinal tissue bridges. We found that somatotopic hand representations can be preserved in absence of sensory and motor hand functioning, and no spared spinal tissue bridges. Such preserved hand somatotopy could be exploited by rehabilitation approaches that aim to establish new hand-brain functional connections after SCI (e.g., neuroprosthetics). However, over years since SCI the hand representation somatotopy deteriorated, suggesting that somatotopic hand representations are more easily targeted within the first years after SCI.”
Revised text Methods:
“Second, we tested whether the inter-finger distances were different between controls and patients using a robust mixed ANOVA with a within-participants factor for finger pair (10 levels) and a between-participants factor for group (2 levels: controls and patients).”
Revised text Results:
“We then tested whether the inter-finger distances were different across finger pairs between controls and SCI patients using a robust mixed ANOVA with a within-participants factor for finger pair (10 levels) and a between-participants factor for group (2 levels: controls and patients). We did not find a significant difference in inter-finger distances between patients and controls (F(1,21.66) = 1.50, p = 0.23). The inter-finger distances were significantly different across finger pairs, as would be expected based on somatotopic mapping (F(9,15.38) = 27.22, p < 0.001). This pattern of inter-finger distances was not significantly different between groups (i.e., no significant finger pair by group interaction; F(9,15.38) = 1.05, p = 0.45). When testing for group differences per finger pair, the BF only revealed inconclusive evidence (BF > 0.37 and < 1.11; note that we could not run a Bayesian ANOVA due to normality violations).”
Revised text Discussion:
“In this study we investigated whether hand somatotopy is preserved and can be activated through attempted movements following tetraplegia. We tested a heterogenous group of SCI patients to examine what clinical, behavioural, and structural spinal cord determinants contribute to preserving S1 somatotopy. Our results revealed that detailed hand somatotopy can be preserved following tetraplegia, even in the absence of sensory and motor function and a lack of spared spinal tissue bridges. However, over time since SCI these finger maps deteriorated such that the hand somatotopy became less typical.”
- Concept 2: This also relates to the fact that the most prominent and consistent finding of prior studies was to show changes in map AMPLITUDE in the maps of patients. It is not clear to me how amplitude was measured here, because the text says "average BOLD activity". What should be reported are standard measures of signal amplitude both across the map area and for individual fingers.
We apologise for the lack of clarity, “average BOLD activity” represented the average z- standardised activity within the S1 hand ROI. To comply with the reviewer’s comment, we adjusted this to the percent signal change underneath the S1 hand ROI and report this instead in our revised manuscript and in revised Figure 3A and revised Figure 3- Figure supplement 1. Note that results were unchanged.
As per the reviewer’s suggestion, we further extracted the activity levels for individual fingers under finger-specific ROIs. To create finger-specific ROIs, probability finger maps were created based on the travelling wave data of the control group, thresholded at 25% (i.e., meaning that at least 5 out of 18 control participants needed to significantly activate a vertex for this vertex to be included in the ROI), and binarised. We then used the separately acquired blocked design data to extract the corresponding finger movement activity levels underlying these finger-specific ROIs per participant. Per ROI, we then compared the activity level between groups. After correction for multiple comparisons, there was no significant difference between groups for the thumb (U = 93, p = 0.37), index (t(30) = -0.003, p = 0.99), middle (t(30) = 1.11, p = 0.35), ring (t(30) = 2.02, p = 0.13), or little finger (t(30) = 2.14, p = 0.20). We have added this analysis to Appendix 1.
Note that lower or higher BOLD amplitude levels do not influence our typicality scores per se. Indeed, typical inter-finger representational patterns have been shown to persist even in ipsilateral M1 that exhibited a negative BOLD response during finger movements (Berlot et al., 2019). As long as the typical inter-finger relationships are preserved, brain areas that have low amplitudes of activity can have a typical somatotopic representation.
Revised text in Methods:
"The percent signal change for overall task-related activity was then extracted for voxels underlying this S1 hand ROI per participant. A similar analysis was used to investigate overall task-related activity in an M1 hand ROI (see Figure 3- Figure supplement 1). We further compared activity levels in finger-specific ROIs in S1 between groups and conducted a geodesic distance analysis to assess whether the finger representations of the SCI patients were aligned differently and/or shifted compared to the control participants (see Appendix 1)."
Revised text in Results:
“Task-related activity was quantified by extracting the percent signal change for finger movement (across all fingers) versus baseline across within the contralateral S1 hand ROI (see Figure 3A). Overall, all patients were able to engage their S1 hand area by moving individual fingers (t(13)=7.46, p < 0.001; BF10=4.28e +3), as did controls (t(17)=9.92, p < 0.001; BF10=7.40e +5). Furthermore, patients’ task-related activity was not significantly different from controls (t(30)=-0.82, p=0.42; BF10=0.44), with the BF showing anecdotal evidence in favour of the null hypothesis.”
Revised Appendix 1:
“Percent signal change in finger-specific clusters To assess whether finger movement activity levels were different between patients and controls, we created finger-specific ROIs and extracted the activity level of the corresponding finger movement for each participant. To create the finger-specific ROIs, the probability finger surface maps that were created from the travelling wave data of the control group (see main manuscript) were thresholded at 25% (i.e., meaning that at least 5 out of 18 control participants needed to significantly activate a vertex for this vertex to be included in the ROI), and binarised. We then used the separately acquired blocked design data to extract the finger movement activity levels underlying these finger-specific ROIs. We first flipped the contrast images resulting from each participant’s fixed effects analysis (i.e., that was ran to average across the 4 blocked design runs) along the x-axis for the left-hand tested participants. Each participant’s contrast maps were then resampled to the Freesurfer 2D average atlas and the averaged z-standardised activity level was extracted for each finger movement vs rest contrast underlying the finger-specific ROIs. We compared the activity levels for each finger movement in the corresponding finger ROI (i.e., thumb movement activity in the thumb ROI, index finger movement activity in the index finger ROI, etc.) between groups. After correction for multiple comparisons, there was no significant difference between groups for the thumb (U = 93, p = 0.37), index (t(30) = -0.003, p = 0.99), middle (t(30) = 1.11, p = 0.35), ring (t(30) = 2.02, p = 0.13), or little finger (t(30) = 2.14, p = 0.20).”
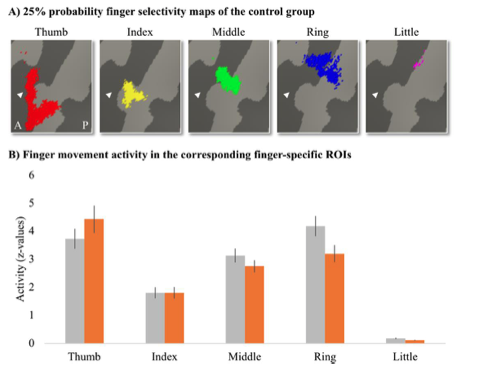
Appendix 1- Figure 1: Finger-specific activity levels in finger-specific regions of interest. A) Finger- specific ROIs were based on the control group’s binarised 25% probability travelling wave finger selectivity maps. B) Finger movement activity levels in the corresponding finger-specific ROIs. There were no significant differences in activity levels between the SCI patient and control groups. Controls are projected in grey; SCI patients are projected in orange. Error bars show the standard error of the mean. White arrows indicate the central sulcus. A = anterior; P = posterior.
- Concept 3: The authors present a hypothesis on the underlying mechanisms of SCI that does not seem to reflect prior data. The argument is that changes in map alignment relate to maladaptive changes and pain. However, the literature that the authors cite does not support this claim. In fact, Freund 2011 promotes the importance of map amplitude but not alignment, whereas other studies either show no relation of activation to pain, or they even show that map shift relates to LESS pain, i.e., the reverse argument than what the authors say. My impression is that the model that the authors present is mainly a model that is used for phantom pain but not for SCI. Taking this into consideration, the findings the authors present are not surprising anymore, because in fact none of these studies claimed that the affected area should be absent in SCI patients; these papers only say that the other body parts change in location or amplitude, which is something the authors did not measure. It is important to make this clear in the text.
As the reviewer states, the literature is debated regarding the relationship between reorganisation and pain in SCI patients. We did not highlight this clearly enough. To improve clarity and focus our message we have therefore removed the sentence regarding reorganisation and pain from the Introduction of our revised manuscript. Also taking comment 2.1 and 2.2 into consideration, we have restructured our Introduction.
We respectfully disagree with the reviewer that our results are not novel or surprising. Whether the full fine-grained hand somatotopy is preserved following a complete motor and sensory loss through tetraplegia has not been considered before. Furthermore, to our knowledge, there is no paper that has inspected the full somatotopic layout in a heterogenous sample of SCI patients and shown that over time since injury, hand somatotopy deteriorates. We indeed cannot make claims regarding the reorganization in S1 with regards to neighbouring cortical areas activating the hand area, as we have now clarified further in the revised Discussion. We now also clarify in our discussion that our result does not exclude the possibility of reorganisation occurring simultaneously and that this is topic for further investigation. As described in the Discussion, it is very possible that reorganisation and preserved somatotopy could co-occur.
Revised text Discussion:
“We did not probe body parts other than the hand and could therefore not investigate whether any remapping of other (neighbouring and/or intact) body part representations towards or into the deprived S1 hand cortex may have taken place. Whether reorganisation and preservation of the original function can simultaneously take place within the same cortical area therefore remains a topic for further investigation. It is possible that reorganisation and preservation of the original function could co-occur within cortical areas. Indeed, non-human primate studies demonstrated that remapping observed in S1 actually reflects reorganisation in subcortical areas of the somatosensory pathway, principally the brainstem (Chand and Jain, 2015; Kambi et al., 2014). As such, the deprived S1 area receives reorganised somatosensory inputs upon tactile stimulation of neighbouring intact body parts. This would simultaneously allow the original S1 representation of the deprived body part to be preserved, as observed in our results when we directly probed the deprived S1 hand area through attempted finger movements.”
- Concept 4: There is yet another more general point on the concept and related hypotheses: Why do the authors assume that immediately after SCI the finger map should disappear? This seems to me the more unlikely hypotheses compared to what the data seem to suggest: preservation and detoriation over time. In my view, there is no biological model that would suggest that a finger map suddenly disappears after input loss. How should this deterioration be mediated? By cellular loss? As already stated above, the finding is therefore much less surprising as the authors argue.
We did not expect that finger maps would disappear, especially given the case studies using S1 intracortical stimulation studies in SCI patients and the result of preserved somatotopy of the missing hand in amputees. We are not sure which part of the manuscript might have caused this misunderstanding.
With regards to the reviewer’s comment that there are no models to suggest that fingers maps would disappear: there is competing research on this as we now explain in our revised Introduction. Non-human primate research has shown that the S1 hand area becomes largely unresponsive to tactile hand stimulation after an SCI (Jain et al., 2008; Kambi et al., 2014; Liao et al., 2021). The surviving finger-related activity was shown to be disorganised such that a few somatotopically appropriate sites but also other somatotopically nonmatched sites were activated (Liao et al., 2021). These fingers areas in S1 became responsive to touch on the face. Furthermore, TMS studies that induce current in localised areas of M1 to induce a peripheral muscle response in SCI patients have shown that representations of more impaired muscles retract or are absent (Fassett et al., 2018; Freund et al., 2011a; Levy et al., 1990; Streletz et al., 1995; Topka et al., 1991; Urbin et al., 2019). We do not believe that this indicates that the S1 hand somatotopy is lost, but rather that tactile inputs and motor outputs no longer pass the level of injury. Indeed, non-human primate work showing immutable myelin borders between finger representations in S1 post SCI suggests that a latent hand representation may be preserved. Further hints for such preserved somatotopy comes from fMRI studies showing net sensorimotor activity during attempted movements with the paralysed body part, intracortical stimulation studies in SCI patients, and preserved somatotopic maps of the missing hand in amputees. We have restructured our Introduction accordingly, also taking into consideration comments 2.1, 2.2, and 2.4.
- Methods & Results. The authors refer to an analyses that they call "typicality" where they say that they assess how "typical" a finger map is. Given this is not a standard measure, I was wondering how the authors decided what a "typical" finger map is. In fact, there are a few papers published on this issue where the average location of each finger in a large number of subjects is detailed. Rather than referring to this literature, the authors use another dataset from another study of themselves that was conduced on n=8 individuals and using 7T MRI (note that in the present study, 3T MRI was used) to define what "typical" is. This approach is not valid. First, this "typical" dataset is not validated for being typical (i.e., it is not compared with standard atlases on hand and finger location), second, it was assessed using a different MRI field strength, third, it was too little subjects to say that this should be a typical dataset, forth, the group differed from the patients in terms of age and gender (i.e., non-matched group), and fifth, the authors even say that the design was different ("was defined similarly", i.e., not the same). This approach is therefore in my view not valid, particularly given the authors measured age- and gender-matched controls that should be used to compare the maps with the patients. This is a critical point because changes in typicality is the main result of the paper.
We respectfully disagree with the reviewer that the typicality measure is not standard, invalid, and inaccurate. RSA-based inter-finger overlap patterns have been shown to depict the invariant representational structure of fingers better than the size, shape, and exact location of the areas activated by finger movements (Ejaz et al., 2015). RSA-based inter- finger representation measures have been shown to have more within-subject stability (both within the same session and between sessions that were 6 months apart) and less inter-subject variability (Ejaz et al., 2015) than these other measures of somatotopy. RSA-based measures are furthermore not prone to some of the problems of measurements of finger selectivity (e.g., dependence on map thresholds). Indeed, over the past years RSA has become the golden standard to investigate somatotopy of finger representations both in healthy (e.g., Akselrod et al., 2017; Ariani et al., 2020; Ejaz et al., 2015; Gooijers et al., 2021; Kieliba et al., 2021; Kolasinski et al., 2016; Liu et al., 2021; Sanders et al., 2019) and patient populations (e.g. Dempsey-Jones et al., 2019; Ejaz et al., 2016; Kikkert et al., 2016; Wesselink et al., 2019). Moreover, various papers have been published in eLife and elsewhere that used the same RSA-based typicality criteria to assess plasticity in finger representations (Dempsey-Jones et al., 2019; Ejaz et al., 2015; Kieliba et al., 2021; Wesselink et al., 2019). We now highlight this in the revised Introduction.
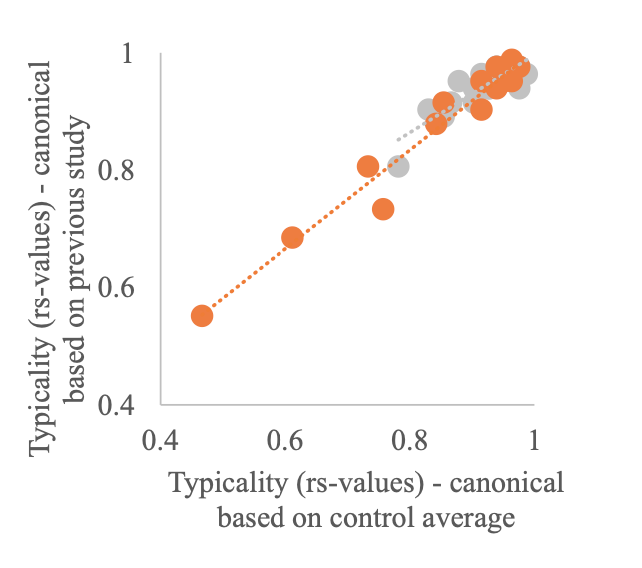
The canonical RDM used in our study has previously been used as a canonical RDM in a 3T study exploring finger somatotopy in amputees (Wesselink et al., 2019) and was made available to us (note that we did not collect this data ourselves). We aimed to use similar measures as in Wesselink et al (2019) and therefore felt it was most appropriate to use the same canonical RDM. One of the strengths of RSA is it can be used to quantitatively relate brain activity measures obtained using different modalities, across different species, brain areas, brain and behavioural measures etc. (Kriegeskorte et al., 2008). As such, the fact that this canonical RDM was constructed based on data collected using 7T fMRI using a digit tapping task should not influence our results. We however agree with the reviewer it is good to demonstrate that our results would not change when using a canonical RDM based on the average RDM of our age-, sex- and handedness matched control group. We therefore recalculated the typicality of all participants using the controls’ average RDM as the canonical RDM. We found a strong and highly significant correlation in typicality scores calculated using the canonical RDM from the independent dataset and the controls’ average RDM (see figure below). This was true for both the patient (rs = 0.92, p < 0.001; red dots) and control groups (rs = 0.78, p < 0.001; grey dots).
We then repeated all analysis using these newly calculated typicality scores. As expected, we found the same results as when using a canonical RDM based on the independent dataset (see below for details). This analysis has been added to the revised Appendix 1 and is referred to in the main manuscript.
Revised text Introduction:
“To investigate whether fine-grained hand somatotopy was preserved and could be activated in S1 following SCI, we assessed inter-finger representational distance patterns using representational similarity analysis (RSA). These inter-finger distance patterns are thought to be shaped by daily life experience such that fingers used more frequently together in daily life have lower representational distances (Ejaz et al., 2015). RSA-based inter-finger distance patterns have been shown to depict the invariant representational structure of fingers in S1 and M1 better than the size, shape, and exact location of the areas activated by finger movements (Ejaz et al., 2015). Over the past years RSA has therefore regularly been used to investigate somatotopy of finger representations both in healthy (e.g., Akselrod et al., 2017; Ariani et al., 2020; Ejaz et al., 2015; Gooijers et al., 2021; Kieliba et al., 2021; Kolasinski et al., 2016; Liu et al., 2021; Sanders et al., 2019) and patient populations (e.g., Dempsey- Jones et al., 2019; Ejaz et al., 2016; Kikkert et al., 2016; Wesselink et al., 2019). We closely followed procedures that have previously been used to map preserved and typical somatotopic finger selectivity and inter-finger representational distance patterns of amputees’ missing hands in S1 using volitional phantom finger movements (Kikkert et al., 2016; Wesselink et al., 2019).”
Revised text Results:
“This canonical RDM was based on 7T finger movement fMRI data in an independently acquired cohort of healthy controls (n = 8). The S1 hand ROI used to calculated this canonical RDM was defined similarly as in the current study (see Wesselink and Maimon- Mor, (2017b) for details). Note that results were unchanged when calculating typicality scores using a canonical RDM based on the averaged RDM of the age-, sex-, and handedness-matched control group tested in this study (see Appendix 1).”
Revised text Methods:
“While the traditional traveling wave approach is powerful to uncover the somatotopic finger arrangement, a fuller description of hand representation can be obtained by taking into account the entire fine-grained activity pattern of all fingers. RSA-based inter-finger overlap patterns have been shown to depict the invariant representational structure of fingers better than the size, shape, and exact location of the areas activated by finger movements (Ejaz et al., 2015). RSA-based measures are furthermore not prone to some of the problems of measurements of finger selectivity (e.g., dependence on map thresholds).”
“Third, we estimated the somatotopic typicality (or normality) of each participant’s RDM by calculating a Spearman correlation with a canonical RDM. We followed previously described procedures for calculating the typicality score (Dempsey-Jones et al., 2019; Ejaz et al., 2015; Kieliba et al., 2021; Wesselink et al., 2019). The canonical RDM was based on 7T finger movement fMRI data in an independently acquired cohort of healthy controls (n = 8). The S1 hand ROI used to calculated this canonical RDM was defined similarly as in the current study (see Wesselink and Maimon-Mor, (2017b) for details). Note that results were unchanged when calculating typicality scores using a canonical RDM based on the averaged RDM of the sex-, handedness-, and age matched control group tested in this study (see Appendix 1).”
Revised text Appendix 1:
“Typicality analysis using a canonical RDM based on the controls’ average RDM
To ensure that our typicality results did not change when using a canonical inter-finger RDM based on the age-, sex-, and handedness matched subjects tested in this study, we recalculated the typicality scores of all participants using the averaged inter-finger RDM of our control sample as the canonical RDM. We found a strong and highly significant correlation between the typicality scores calculated using the canonical inter-finger RDM from the independent dataset (reported in the main manuscript) and the typicality scores calculated using our controls’ average RDM. This was true for both the SCI patient (rs = 0.92, p < 0.001) and control groups (rs = 0.78, p < 0.001).
We then repeated all typicality analysis reported in the main manuscript. As expected, using the typicality scores calculated using our controls’ average RDM we found the same results as when using the canonical inter-finger RDM from the independent dataset: There was a significant difference in typicality between SCI patients, healthy controls, and congenital one-handers (H(2)=27.61, p < 0.001). We further found significantly higher typicality in controls compared to congenital one-handers (U=0, p < 0.001; BF10=76.11). Importantly, the typicality scores of the SCI patients were significantly higher than the congenital one-handers (U=2, p < 0.001; BF10=50.98), but not significantly different from the controls (U=94, p=0.24; BF10=0.55). Number of years since SCI significantly correlated with hand representation typicality (rs=-0.54, p=0.05) and patients with more retained GRASSP motor function of the tested upper limb had more typical hand representations in S1 (rs=0.58, p=0.03). There was no significant correlation between S1 hand representation typicality and GRASSP sensory function of the tested upper limb, spared midsagittal spinal tissue bridges at the lesion level, or cross-sectional spinal cord area (rs=0.40, p=0.15, rs=0.50, p=0.10, and rs=0.48, p=0.08, respectively). An exploratory stepwise linear regression analysis revealed that years since SCI significantly predicted hand representation typicality in S1 with R2=0.33 (F(1,10)=4.98, p=0.05). Motor function, sensory function, spared midsagittal spinal tissue bridges at the lesion level, and spinal cord area did not significantly add to the prediction (t=1.31, p=0.22, t=1.62, p=0.14, t=1.70, p=0.12, and t=1.09, p=0.30, respectively).”
- Methods & Results: The authors make a few unproven claims, such as saying "generally, the position, order of finger preference, and extent of the hand maps were qualitatively similar between patients and control". There are no data to support these claims.
As indicated in this sentence, this claim substantiated a qualitative inspection of the finger maps in Figure 2 and we indeed do not support this claim with quantitative analysis. We have therefore removed this sentence from the revised manuscript and instead say, as per the suggestion of reviewer 1, that overall, there were aspects of somatotopic finger selectivity in the SCI patients’ hand maps,
Revised text Results:
“Overall, we found aspects of somatotopic finger selectivity in the maps of SCI patients’ hands, in which neighbouring clusters showed selectivity for neighbouring fingers in contralateral S1, similar to those observed in eighteen age-, sex-, and handedness matched healthy controls (see Figure 2A&B). A characteristic hand map shows a gradient of finger preference, progressing from the thumb (red, laterally) to the little finger (pink, medially). Notably, a characteristic hand map was even found in a patient who suffered complete paralysis and sensory deprivation of the hands (Figure 2. patient map 1; patient S01). Despite most maps (Figure 2, except patient map 3) displaying aspects of characteristic finger selectivity, some finger representations were not visible in the thresholded patient and control maps.”
- Methods & Results: The authors argue that the map architecture is topographic as soon as the dissimilarity between two different fingers is above 0. First, what I am really wondering about is why the authors do not provide the exact dissimilarity values in the text but only give the stats for the difference to 0 (t-value, p-value, Bayes factor). Were the dissimilarity values perhaps very low? The values should be reported. Also, when this argument that maps are topographic as long as the value of two different fingers is above 0 should hold, then the authors have to show that the value for mapping the SAME finger is indeed 0. Otherwise, this argument is not convincing.
We would like to clarify that a representation is not per se topographic when the RSA dissimilarity is > 0. The dissimilarity value provided by RSA indicates the extent to which a pair of conditions is distinguished – it can be viewed as encapsulating the information content carried by the region (Kriegeskorte et al., 2008). Due to cross-validation across runs, the expected distance value would be zero (but can go below 0) if two conditions’ activity patterns are not statistically different from each other, and larger than zero if there is differentiation between the conditions (fingers’ activity patterns in the S1 hand area in our case; Kriegeskorte et al., 2008; Nili et al., 2014). The diagonal of the RDM reflect comparisons between the same fingers and therefore reflect distances between the exact same activity pattern in the same run and are thus 0 by definition (Kriegeskorte et al., 2008; Nili et al., 2014). This was also the case in our individual participant RDMs. Since this is not a meaningful value (a distance between 2 identical activity patterns will always be 0) we chose not to report this. We have clarified the meaning of the separability measure in the revised Methods section.
To investigate whether a representation is somatotopic, we have to take into account the full fine-grained inter-finger distance pattern. The full fine-grained inter-finger distance pattern is related to everyday use of our hand and has been shown to depict the invariant representational structure of fingers better than the size, shape, and exact location of the areas activated by finger movements (Ejaz et al., 2015). To determine whether a participant’s inter-finger distance pattern is somatotopic one should associate it to a canonical RDM – which is done in the typicality analysis (see also our response to comment 2.6).
What can be done to demonstrate the validity of an ROI, is to run RSA on a control ROI where one would not expect to find activity that is distinguishable between finger conditions. Rather than comparing your separability measure against 0, one can then compare the separability of your ROI that is expected to contain this information to that of your control ROI. We created a cerebral spinal fluid (CSF) ROI, repeated our RSA analysis in this ROI, and then compared the separability of the CSF and S1 hand area ROIs. As expected, there was a significant difference between separability (or representation strength) in the S1 hand area and CSF ROIs for both controls (W=171, p < 0.001; BF10=4059) and patients (W=105, p < 0.00; BF10=279). This analysis has been added to the revised manuscript.
Individual participant separability values (i.e., distances averaged across fingers) are visualised in Figure 3D. Following the reviewer’s suggestion, we have included individual participant inter-finger distance plots for both the controls and SCI patients as Figure 3- Figure supplement 2 and Figure 3- figure supplement 3, respectively. The inter-finger distances for each finger pair and subject can be extracted from this. We feel this is more readily readable and interpretable than a table containing the 10 inter-finger distance scores for all 32 participants. These values have instead been made available online, together with our other data, on https://osf.io/e8u95/.
Revised text Methods:
“If there is no information in the ROI that can statistically distinguish between the finger conditions, then due to cross-validation the expected distance measure would be 0. If there is differentiation between the finger conditions, the separability would be larger than 0 (Nili et al., 2014). Note that this does not directly indicate that this region contains topographic information, but rather that this ROI contains information that can distinguish between the finger conditions. To further ensure that our S1 hand ROI was activated distinctly for different fingers, we created a cerebral spinal fluid (CSF) ROI that would not contain finger specific information. We then repeated our RSA analysis in this ROI and statistically compared the separability of the CSF and S1 hand area ROIs.”
Revised text Results:
“We found that inter-finger separability in the S1 hand area was greater than 0 for patients (t(13) = 9.83, p < 0.001; BF10 = 6.77e +4) and controls (t(17) = 11.70, p < 0.001; BF10 = 6.92e +6), indicating that the S1 hand area in both groups contained information about individuated finger representations. Furthermore, for both controls (W = 171, p < 0.001; BF10 = 4059) and patients (W = 105, p < 0.001; BF10 = 279) there was significant greater separability (or representation strength) in the S1 hand area than in a control cerebral spinal fluid ROI that would not be expected to contain finger specific information. We did not find a significant group difference in inter-finger separability of the S1 hand area (t(30) = 1.52, p = 0.14; BF10 = 0.81), with the BF showing anecdotal evidence in favour of the null hypothesis.”
- Discussion. The authors argue that spared midsagittal spinal tissue bridges are not necessary because they were not predictive of hand representation typicality. First, the measure of typicality is questionable and should not be used to make general claims about the importance of structural differences. Second, given there were only n=14 patients included, one may question generally whether predictive modelling can be done with these data. This statement should therefore be removed.
We would like to clarify that, like the reviewer, we do not believe that spared midsagittal spinal tissue bridges are unimportant. Indeed, a large body of our own research focuses on the importance of spared spinal tissue bridges in recovery of sensorimotor function and pain (Huber et al., 2017; Pfyffer et al., 2021, 2019; Vallotton et al., 2019). We have added a clarification sentence regarding the importance of tissue bridges with regards to recovery of function. We agree with the reviewer that given our limited sample size, it is difficult to make conclusive claims based on non-significant predictive modelling and correlational results. In the revised manuscript we therefore focus this statement (i.e., that sensory and motor hand function and tissue bridges are not necessary to preserve hand somatotopy) on our finding that two patients without spared tissue bridges at the lesion level and with complete or near complete loss of sensory and motor hand function had a highly typical hand representation. We present our predictive modelling results as being in line with this notion and added a word of caution that it is challenging to draw definite conclusions from non-significant predictive modelling and correlation results in such a limited sample size.
With regards to the reviewer’s concern about the validity of the typicality measure – please see our detailed response to comment 2.6.
Revised text Discussion:
“Spared spinal cord tissue bridges can be found in most patients with a clinically incomplete injury, their width being predictive of electrophysiological information flow, recovery of sensorimotor function, and neuropathic pain (Huber et al., 2017; Pfyffer et al., 2021, 2019; Vallotton et al., 2019). However, in this study, spared midsagittal spinal tissue bridges at the lesion level and sensorimotor hand function did not seem necessary to maintain and activate a somatotopic hand representation in S1. We found a highly typical hand representation in two patients (S01 and S03) who did not have any spared spinal tissue bridges at the lesion level, a complete (S01) or near complete (S03) hand paralysis, and a complete (S01) or near complete loss (S03) of hand sensory function. Our predictive modelling results were in line with this notion and showed that these behavioural and structural spinal cord determinants were not predictive of hand representation typicality. Note however that our sample size was limited, and it is challenging to draw definite conclusions from non-significant predictive modelling results.”
- Discussion. The authors say that hand representation is "preserved" in SCI patients. Perhaps it is better to be precise and to say that they active during movement planning.
We thank the reviewer for their suggestion and revised the Discussion accordingly.
Revised text Discussion:
"In this study we investigated whether hand somatotopy is preserved and can be activated through attempted movements following tetraplegia."
"How may these representations be preserved over time and activated through attempted movements in the absence of peripheral information?"
"Together, our findings indicate that in the first years after a tetraplegia, the somatotopic S1 hand representation is preserved and can be activated through attempted movements even in the absence of retained sensory function, motor function, and spared spinal tissue bridges."
Reviewer #3:
The demonstration that cortex associated with an amputated limb can be activated by other body parts after amputation has been interpreted as evidence that the deafferented cortex "reorganizes" and assumes a new function. However, other studies suggest that the somatotopic organization of somatosensory cortex in amputees is relatively spared, even when probed long after amputation. One possibility is that the stability is due to residual peripheral input. In this study, Kikkert et al. examine the somatotopic organization of somatosensory cortex in patients whose spinal cord injury has led to tetraplegia. They find that the somatotopic organization of the hand representation of somatosensory cortex is relatively spared in these patients. Surprisingly, the amount of spared sensorimotor function is a poor predictor of the stability of the patients' hand somatotopy. Nonethless, the hand representation deteriorates over decades after the injury. These findings contribute to a developing story on how sensory representations are formed and maintained and provide a counterpoint to extreme interpretations of the "reorganization" hypothesis mentioned above. Furthermore, the stability of body maps in somatosensory cortex after spinal cord injury has implications for the development of brain-machine interfaces.
I have only minor comments:
- Given the controversy in the field, the use of the phrase "take over the deprived territory" (line 45) is muddled. Perhaps a more nuanced exposition of this phenomenon is in order?
We agree a more nuanced expression would be more appropriate. We have changed this sentence accordingly in the revised manuscript.
Revised text Introduction:
“Seminal research in nonhuman primate models of SCI has shown that this leads to extensive cortical reorganisation, such that tactile stimulation of cortically adjacent body parts (e.g. of the face) activated the deprived brain territory (e.g. of the hand; Halder et al., 2018; Jain et al., 2008; Kambi et al., 2014).”
- The statement that "results are mixed" regarding intracortical microstimulation of S1 is dubious. In only one case has the hand representation been mislocalized, out of many cases (several at CalTech, 3 at the University of Pittsburgh, one at Case Western, one at Hopkins/APL, and one at UChicago). Perhaps rephrase to "with one exception?"
We agree that this sentence may give a wrong outlook on the literature and have changed the text per the reviewer’s suggestion.
Revised text Introduction:
“Case studies using intracortical stimulation in the S1 hand area to elicit finger sensations in SCI patients hint at such preserved somatotopic representations (Fifer et al., 2020; Flesher et al., 2016), with one exception (Armenta Salas et al., 2018).”
- The phrase "tetraplegic sinal cord injury" seems awkward.
Thank you for highlighting this to us. We have corrected these instances in our revised manuscript to “tetraplegia”.
- The stability of the representation is attributed to efference copy from M1. While this is a fine speculation, somatosensory cortex is part of a circuit and is interconnected with many other brain areas, M1 being one. Perhaps the stability is maintained due to the position of somatosensory cortex within this circuit, and not solely by its relationship with M1? There seems to be an overemphasis of this hypothesis at the exclusion of others.
Thank you for this comment. We agree we overemphasized the efference copy theory. We have adjusted this and now provide a more balanced description of potential circuits and interconnections that could maintain somatotopic representations after tetraplegia.
-
Evaluation Summary:
This paper investigates the stability of the somatotopic organization of somatosensory cortex after spinal cord injury that results in tetraplegia. The findings suggest that somatotopic maps are preserved, degrading very slowly over decades, but that the amount of spared function is a poor predictor of somatotopic stability. These findings contribute to a developing story on how sensory representations are formed and maintained and has implications for the development of brain-machine interfaces for individuals with tetraplegia. The study is interesting and the manuscript is well-written. There remain concerns about some choices taken in the analyses.
(This preprint has been reviewed by eLife. We include the public reviews from the reviewers here; the authors also receive private feedback with suggested changes to …
Evaluation Summary:
This paper investigates the stability of the somatotopic organization of somatosensory cortex after spinal cord injury that results in tetraplegia. The findings suggest that somatotopic maps are preserved, degrading very slowly over decades, but that the amount of spared function is a poor predictor of somatotopic stability. These findings contribute to a developing story on how sensory representations are formed and maintained and has implications for the development of brain-machine interfaces for individuals with tetraplegia. The study is interesting and the manuscript is well-written. There remain concerns about some choices taken in the analyses.
(This preprint has been reviewed by eLife. We include the public reviews from the reviewers here; the authors also receive private feedback with suggested changes to the manuscript. Reviewer #3 agreed to share their name with the authors.)
-
Reviewer #1 (Public Review):
This work provides insight into the effects of tetraplegia on the cortical representation of the body in S1. By using fMRI and an attempted finger movement task, the researchers were able to show preserved fine-grained digit maps - even in patients without sensory and motor hand function as well as no spared spinal tissue bridges. The authors also explored whether certain clinical and behavioral determinates may contribute to preserving S1 somatotopy after spinal cord injury.
Overall I found the manuscript to be well-written, the study to be interesting, and the analysis reasonable. I do, however, think the manuscript would benefit by considering and addressing two main suggestions.
- Provide additional context / rationale for some of the methods. Specific examples below:
a) The rationale behind using the RSA …
Reviewer #1 (Public Review):
This work provides insight into the effects of tetraplegia on the cortical representation of the body in S1. By using fMRI and an attempted finger movement task, the researchers were able to show preserved fine-grained digit maps - even in patients without sensory and motor hand function as well as no spared spinal tissue bridges. The authors also explored whether certain clinical and behavioral determinates may contribute to preserving S1 somatotopy after spinal cord injury.
Overall I found the manuscript to be well-written, the study to be interesting, and the analysis reasonable. I do, however, think the manuscript would benefit by considering and addressing two main suggestions.
- Provide additional context / rationale for some of the methods. Specific examples below:
a) The rationale behind using the RSA analysis seemed to be predicated on the notion that the signals elicited via a phase-encoded design can only yield information about each voxel's preferred digit and little-to-no information about the degree of digit overlap (see lines 163-166 and 571-575). While this is the case for conventional analyses of these signals, there are more recently developed approaches that are now capable of estimating the degree of somatotopic overlap from phase-encoded data (see: Da Rocha Amaral et al., 2020; Puckett et al., 2020). Although I personally would be interested in seeing one of these types of analyses run on this data, I do not think it is necessary given the RSA data / analysis. Rather, I merely think it is important to add some context so that the reader is not misled into believing that there is no way to estimate this type of information from phase-encoded signals.
- Da Rocha Amaral S, Sanchez Panchuelo RM, Francis S (2020) A Data-Driven Multi-scale Technique for fMRI Mapping of the Human Somatosensory Cortex. Brain Topogr 33 (1):22-36. doi:10.1007/s10548-019-00728-6
- Puckett AM, Bollmann S, Junday K, Barth M, Cunnington R (2020) Bayesian population receptive field modeling in human somatosensory cortex. Neuroimage 208:116465. doi:10.1016/j.neuroimage.2019.116465b. The rationale for using minimally thresholded (Z>2) data for the Dice overlap analysis as opposed to the threshold used in data visualization (q<0.05) was unclear. Providing the minimally thresholded maps (in Supplementary) would also aid interpretation of the Dice overlap results.
- Provide a more thorough discussion - particularly with respect to the possible role of top-down processes (e.g., attention).
a) The authors discuss a few potential signal sources that may contribute to the maintenance of (and ability to measure) the somatotopic maps; however, the overall interpretation seems a bit "motor efferent heavy". That is, it seems the authors favor an explanation that the activity patterns measured in S1 were elicited by efference copies from the motor system and that occasional corollary discharges or attempted motor movements play a role in their maintenance over time. The authors consider other explanations, noting - for example - the potential role of attention in preserving the somatotopic representations given that attention has been shown to be able to activate S1 hand representations. The mention of this was, however, rather brief - and I believe the issue deserves a bit more of a balanced consideration.
When the authors consider the possible role of attention in maintaining the somatotopic representations (lines 329-333), they mention that observing others' fingers being touched or attending to others' finger movements may contribute. But there is no mention of attending to one's own fingers (which has been shown to elicit activity as cited). I realize that the patients lack sensorimotor function (and hence may find it difficult to "attend" to their fingers); however, they have all had prior experience with their fingers and therefore might still be able to attend to them (or at least the idea of their digits) such that activity is elicited. For example, it is not clear to me that it would be any more difficult for the patients to be asked to attend to their digits compared to being asked to attempt to move their digits. I would even suggest that attempting to move a digit (regardless of whether you can or not) requires that one attends to the digit before attempting to initiate the movement as well as throughout the attempted motor movement. Because of this, it seems possible that attention-related processes could be playing a role in or even driving the signals measured during the attempted movement task - as well as those involved in the ongoing maintenance of the maps after injury. I don't think this possibility can be dismissed given the data in hand, but perhaps the issue could be addressed by a bit more thorough of a discussion on the process of "attempting to move" a digit (even one that does not move) - and the various top-down processes that might be involved.
-
Reviewer #2 (Public Review):
The authors investigate SCI patients and characterize the topographic representation of the hand in sensorimotor cortex when asked to move their hand (which controls could do but patients could not). The authors compare some parameters of topographic map organization and conclude that they do not differ between patients and controls, whereas they find changes in the typicality of the maps that decrease with years since disease onset in patients. Whereas these initial analyses are interesting, they are not clearly related to a mechanistic model of the disorder and the underlying pathophysiology that is expected in the patients. Furthermore, additional analyses on more fine-grained map changes are needed to support the authors' claims. Finally, the major result of changed typicality in the patients is in my …
Reviewer #2 (Public Review):
The authors investigate SCI patients and characterize the topographic representation of the hand in sensorimotor cortex when asked to move their hand (which controls could do but patients could not). The authors compare some parameters of topographic map organization and conclude that they do not differ between patients and controls, whereas they find changes in the typicality of the maps that decrease with years since disease onset in patients. Whereas these initial analyses are interesting, they are not clearly related to a mechanistic model of the disorder and the underlying pathophysiology that is expected in the patients. Furthermore, additional analyses on more fine-grained map changes are needed to support the authors' claims. Finally, the major result of changed typicality in the patients is in my view not valid.
- Concept 1. At present, there is no clear hypotheses about the (expected or hypothesized) mechanistic changes of the sensorimotor maps in the patients. The authors refer to "altered" maps and repeatedly say that "results are mixed" (3 times in the introduction). They do not in detail report which results actually have been reported before, which is a major problem, because those prior results should have motivated the analyses the authors conducted. For instance, two of the cited studies found that in SCI patients, only ONE FINGER shifted towards the malfunctioning area (i.e., the small finger) whereas all other fingers were the same. However, the authors do NOT perform single finger analyses but always average their results ACROSS fingers. This is even true in spite of some patients indeed showing MISSING FINGERS as is clearly evident in the figure, and in spite of the clearly reduced distance of the thumb in the patients as is also visible in another figure. Nothing of this is seen in the results, because the ANOVA and analyses never have the factor of "finger". Instead, the authors always average the analyses across finger. The conclusion that the maps do not differ is therefore not justified at present. This severely reduces any conclusions that an be drawn from the data at present.
- Concept 2: This also relates to the fact that the most prominent and consistent finding of prior studies was to show changes in map AMPLITUDE in the maps of patients. It is not clear to me how amplitude was measured here, because the text says "average BOLD activity". What should be reported are standard measures of signal amplitude both across the map area and for individual fingers.
- Concept 3: The authors present a hypothesis on the underlying mechanisms of SCI that does not seem to reflect prior data. The argument is that changes in map alignment relate to maladaptive changes and pain. However, the literature that the authors cite does not support this claim. In fact, Freund 2011 promotes the importance of map amplitude but not alignment, whereas other studies either show no relation of activation to pain, or they even show that map shift relates to LESS pain, i.e., the reverse argument than what the authors say. My impression is that the model that the authors present is mainly a model that is used for phantom pain but not for SCI. Taking this into consideration, the findings the authors present are not surprising anymore, because in fact none of these studies claimed that the affected area should be absent in SCI patients; these papers only say that the other body parts change in location or amplitude, which is something the authors did not measure. It is important to make this clear in the text.
- Concept 4: There is yet another more general point on the concept and related hypotheses: Why do the authors assume that immediately after SCI the finger map should disappear? This seems to me the more unlikely hypotheses compared to what the data seem to suggest: preservation and detoriation over time. In my view, there is no biological model that would suggest that a finger map suddenly disappears after input loss. How should this deterioration be mediated? By cellular loss? As already stated above, the finding is therefore much less surprising as the authors argue.
- Methods & Results. The authors refer to an analyses that they call "typicality" where they say that they assess how "typical" a finger map is. Given this is not a standard measure, I was wondering how the authors decided what a "typical" finger map is. In fact, there are a few papers published on this issue where the average location of each finger in a large number of subjects is detailed. Rather than referring to this literature, the authors use another dataset from another study of themselves that was conduced on n=8 individuals and using 7T MRI (note that in the present study, 3T MRI was used) to define what "typical" is. This approach is not valid. First, this "typical" dataset is not validated for being typical (i.e., it is not compared with standard atlases on hand and finger location), second, it was assessed using a different MRI field strength, third, it was too little subjects to say that this should be a typical dataset, forth, the group differed from the patients in terms of age and gender (i.e., non-matched group), and fifth, the authors even say that the design was different ("was defined similarly", i.e., not the same). This approach is therefore in my view not valid, particularly given the authors measured age- and gender-matched controls that should be used to compare the maps with the patients. This is a critical point because changes in typicality is the main result of the paper.
- Methods & Results: The authors make a few unproven claims, such as saying "generally, the position, order of finger preference, and extent of the hand maps were qualitatively similar between patients and control". There are no data to support these claims.
- Methods & Results: The authors argue that the map architecture is topographic as soon as the dissimilarity between two different fingers is above 0. First, what I am really wondering about is why the authors do not provide the exact dissimilarity values in the text but only give the stats for the difference to 0 (t-value, p-value, Bayes factor). Were the dissimilarity values perhaps very low? The values should be reported. Also, when this argument that maps are topographic as long as the value of two different fingers is above 0 should hold, then the authors have to show that the value for mapping the SAME finger is indeed 0. Otherwise, this argument is not convincing.
- Discussion. The authors argue that spared midsagittal spinal tissue bridges are not necessary because they were not predictive of hand representation typicality. First, the measure of typicality is questionable and should not be used to make general claims about the importance of structural differences. Second, given there were only n=14 patients included, one may question generally whether predictive modelling can be done with these data. This statement should therefore be removed.
- Discussion. The authors say that hand representation is "preserved" in SCI patients. Perhaps it is better to be precise and to say that they active during movement planning.
-
Reviewer #3 (Public Review):
The demonstration that cortex associated with an amputated limb can be activated by other body parts after amputation has been interpreted as evidence that the deafferented cortex "reorganizes" and assumes a new function. However, other studies suggest that the somatotopic organization of somatosensory cortex in amputees is relatively spared, even when probed long after amputation. One possibility is that the stability is due to residual peripheral input. In this study, Kikkert et al. examine the somatotopic organization of somatosensory cortex in patients whose spinal cord injury has led to tetraplegia. They find that the somatotopic organization of the hand representation of somatosensory cortex is relatively spared in these patients. Surprisingly, the amount of spared sensorimotor function is a poor …
Reviewer #3 (Public Review):
The demonstration that cortex associated with an amputated limb can be activated by other body parts after amputation has been interpreted as evidence that the deafferented cortex "reorganizes" and assumes a new function. However, other studies suggest that the somatotopic organization of somatosensory cortex in amputees is relatively spared, even when probed long after amputation. One possibility is that the stability is due to residual peripheral input. In this study, Kikkert et al. examine the somatotopic organization of somatosensory cortex in patients whose spinal cord injury has led to tetraplegia. They find that the somatotopic organization of the hand representation of somatosensory cortex is relatively spared in these patients. Surprisingly, the amount of spared sensorimotor function is a poor predictor of the stability of the patients' hand somatotopy. Nonethless, the hand representation deteriorates over decades after the injury. These findings contribute to a developing story on how sensory representations are formed and maintained and provide a counterpoint to extreme interpretations of the "reorganization" hypothesis mentioned above. Furthermore, the stability of body maps in somatosensory cortex after spinal cord injury has implications for the development of brain-machine interfaces.
I have only minor comments:
Given the controversy in the field, the use of the phrase "take over the deprived territory" (line 45) is muddled. Perhaps a more nuanced exposition of this phenomenon is in order?
The statement that "results are mixed" regarding intracortical microstimulation of S1 is dubious. In only one case has the hand representation been mislocalized, out of many cases (several at CalTech, 3 at the University of Pittsburgh, one at Case Western, one at Hopkins/APL, and one at UChicago). Perhaps rephrase to "with one exception?"
The phrase "tetraplegic sinal cord injury" seems awkward.
The stability of the representation is attributed to efference copy from M1. While this is a fine speculation, somatosensory cortex is part of a circuit and is interconnected with many other brain areas, M1 being one. Perhaps the stability is maintained due to the position of somatosensory cortex within this circuit, and not solely by its relationship with M1? There seems to be an overemphasis of this hypothesis at the exclusion of others.
-
