Freshwater monitoring by nanopore sequencing
This article has been Reviewed by the following groups
Discuss this preprint
Start a discussion What are Sciety discussions?Listed in
- Evaluated articles (eLife)
Abstract
While traditional microbiological freshwater tests focus on the detection of specific bacterial indicator species, including pathogens, direct tracing of all aquatic DNA through metagenomics poses a profound alternative. Yet, in situ metagenomic water surveys face substantial challenges in cost and logistics. Here we present a simple, fast, cost-effective and remotely accessible freshwater diagnostics workflow centred around the portable nanopore sequencing technology. Using defined compositions and spatiotemporal microbiota from surface water of an example river in Cambridge (UK), we provide optimised experimental and bioinformatics guidelines, including a benchmark with twelve taxonomic classification tools for nanopore sequences. We find that nanopore metagenomics can depict the hydrological core microbiome and fine temporal gradients in line with complementary physicochemical measurements. In a public health context, these data feature relevant sewage signals and pathogen maps at species level resolution. We anticipate that this framework will gather momentum for new environmental monitoring initiatives using portable devices.
Article activity feed
-

Author Response
- Please comment on why many of the June samples failed to provide sufficient sequence information, especially since not all of them had low yields (supp table 2 and supp figure 5).
An extended paragraph about experimental intricacies of our study has been added to the Discussion. It has also been also slightly restructured to give a better and wider overview of how future freshwater monitoring studies using nanopore sequencing can be improved (page 18, lines 343-359).
We wish to highlight that all three MinION sequencing runs here analysed feature substantially higher data throughput than that of any other recent environmental 16S rRNA sequencing study with nanopore technology, as recently reviewed by Latorre-Pérez et al. (Biology Methods and Protocols 2020, doi:10.1093/biomethods/bpaa016). One of this work's sequencing …
Author Response
- Please comment on why many of the June samples failed to provide sufficient sequence information, especially since not all of them had low yields (supp table 2 and supp figure 5).
An extended paragraph about experimental intricacies of our study has been added to the Discussion. It has also been also slightly restructured to give a better and wider overview of how future freshwater monitoring studies using nanopore sequencing can be improved (page 18, lines 343-359).
We wish to highlight that all three MinION sequencing runs here analysed feature substantially higher data throughput than that of any other recent environmental 16S rRNA sequencing study with nanopore technology, as recently reviewed by Latorre-Pérez et al. (Biology Methods and Protocols 2020, doi:10.1093/biomethods/bpaa016). One of this work's sequencing runs has resulted in lower read numbers for water samples collected in June 2018 (~0.7 Million), in comparison to the ones collected in April and August 2018 (~2.1 and ~5.5 Million, respectively). While log-scale variabilities between MinION flow cell throughput have been widely reported for both 16S and shotgun metagenomics approaches (e.g. see Latorre-Pérez et al.), the count of barcode-specific 16S reads is nevertheless expected to be correlated with the barcode-specific amount of input DNA within a given sequencing run. As displayed in Supplementary Figure 7b, we see a positive, possibly logarithmic trend between the DNA concentration after 16S rDNA amplification and number of reads obtained. With few exceptions (April-6, April-9.1 and Apri-9.2), we find that sample pooling with original 16S rDNA concentrations of ≳4 ng/µl also results in the surpassing of the here-set (conservative) minimum read threshold of 37,000 for further analyses. Conversely, all June samples that failed to reach 37,000 reads did not pass the input concentration of 4 ng/µl, despite our attempt to balance their quantity during multiplexing.
We reason that such skews in the final barcode-specific read distribution would mainly arise from small concentration measurement errors, which undergo subsequent amplification during the upscaling with comparably large sample volume pipetting. While this can be compensated for by high overall flow cell throughput (e.g. see August-2, August-9.1, August-9.2), we think that future studies with much higher barcode numbers can circumvent this challenge by leveraging an exciting software solution: real-time selective sequencing via “Read Until”, as developed by Loose et al. (Nature Methods 2016, doi:10.1038/nmeth.3930). In the envisaged framework, incoming 16S read signals would be in situ screened for the sample-barcode which in our workflow is PCR-added to both the 5' and 3' end of each amplicon. Overrepresented barcodes would then be counterbalanced by targeted voltage inversion and pore "rejection" of such reads, until an even balance is reached. Lately, such methods have been computationally optimised, both through the usage of GPUs (Payne et al., bioRxiv 2020, https://doi.org/10.1101/2020.02.03.926956) and raw electrical signals (Kovaka et al., bioRxiv 2020, https://doi.org/10.1101/2020.02.03.931923).
- It would be helpful if the authors could mention the amount (or proportion) of their sequenced 16S amplicons that provided species-level identification, since this is one of the advantages of nanopore sequencing.
We wish to emphasize that we intentionally refrained from reporting the proportion of 16S rRNA reads that could be classified at species level, since we are wary of any automated species level assignments even if the full-length 16S rRNA gene is being sequenced. While we list the reasons for this below, we appreciate the interest in the theoretical proportion of reads at species level assignment. We therefore re-analyzed our dataset, and now also provide the ratio of reads that could be classified at species level using Minimap2 (pages 16-17, lines 308-314).
To this end, we classified reads at species level if the species entry of the respective SILVA v.132 taxonomic ID was either not empty, or neither uncultured bacterium nor metagenome. Therefore, many unspecified classifications such as uncultured species of some bacterial genus are counted as species-level classifications, rendering our approach lenient towards a higher ratio of species level classifications. Still, the species level classification ratios remain low, on average at 16.2 % across all included river samples (genus-level: 65.6 %, family level: 76.6 %). The mock community, on the other hand, had a much higher species classification rate (>80 % in all three replicates), which is expected for a well-defined, well-referenced and divergent composition of only eight bacterial taxa, and thus re-validates our overall classification workflow.
On a theoretical level, we mainly refrain from automated across-the-board species level assignments because: (1) many species might differ by very few nucleotide differences within the 16S amplicon; distinguishing these from nanopore sequencing errors (here ~8 %) remains challenging (2) reference databases are incomplete and biased with respect to species level resolution, especially regarding certain environmental contexts; it is likely that species assignments would be guided by references available from more thoroughly studied niches than freshwater
Other recent studies have also shown that across-the-board species-level classification is not yet feasible with 16S nanopore sequencing, for example in comparison with Illumina data (Acharya et al., Scientific Reports 2019, doi:10.25405/data.ncl.9693533) which showed that “more reliable information can be obtained at genus and family level”, or in comparison with longer 16S-ITS-23S amplicons (Cusco et al., F1000Research 2019, doi: 10.12688/f1000research.16817.2), which “remarkably improved the taxonomy assignment at the species level”.
- It is not entirely clear how the authors define their core microbiome. Are they reporting mainly the most abundant taxa (dominant core microbiome), and would this change if you look at a taxonomic rank below the family level? How does the core compare, for example, with other studies of this same river?
The here-presented core microbiome indeed represents the most abundant taxa, with relatively consistent profiles between samples. We used hierarchical clustering (Figure 4a, C2 and C4) on the bacterial family level, together with relative abundance to identify candidate taxa. Filtering these for median abundance > 0.1% across all samples resulted in 27 core microbiome families. To clarify this for the reader, we have added a new paragraph to the Material and Methods (section 2.7; page 29, lines 653-658).
We have also performed the same analysis on the bacterial genus level and now display the top 27 most abundant genera (median abundance > 0.2%), together with their corresponding families and hierarchical clustering analysis in a new Supplementary Figure 4. Overall, high robustness is observed with respect to the families of the core microbiome: out of the top 16 core families (Figure 4b), only the NS11-12 marine group family is not represented by the top 27 most abundant genera (Supplementary Figure 4b). We reason that this is likely because its corresponding genera are composed of relatively poorly resolved references of uncultured bacteria, which could thus not be further classified.
To the best of our knowledge, there are only two other reports that feature metagenomic data of the River Cam and its wastewater influx sources (Rowe et al., Water Science & Technology 2016, doi:10.2166/wst.2015.634; Rowe et al., Journal of Antimicrobial Chemotherapy 2017, doi:10.1093/jac/dkx017). While both of these primarily focus on the diversity and abundance of antimicrobial resistance genes using Illumina shotgun sequencing, they only provide limited taxonomic resolution on the river's core microbiome. Nonetheless, Rowe et al. (2016) specifically highlighted Sphingobium as the most abundant genus in a source location of the river (Ashwell, Hertfordshire). This genus belongs to the family of Sphingomonadaceae, which is also among the five most dominant families identified in our dataset. It thus forms part of what we define as the core microbiome of the River Cam (Figure 4b), and we have therefore highlighted this consistency in our manuscript's Discussion (page 17, lines 316-319).
- Please consider revising the amount of information in some of the figures (such as figure 2 and figure 3). The resulting images are tiny, the legends become lengthy and the overall impact is reduced. Consider splitting these or moving some information to the supplements.
To follow this advice, we have split Figure 2 into two less compact figures. We have moved more detailed analyses of our classification tool benchmark to the supplement (now Supplementary Figure 1). Supplementary Figure 1 notably also contains a new summary of the systematic computational performance measurements of each classification tool (see minor suggestions).
Moreover, we here suggest that the original Figure 3 may be divided into two figures: one to visualise the sequencing output, data downsampling and distribution of the most abundant families (now Figure 3), and the other featuring the clustering of bacterial families and associated core microbiome (now Figure 4). We think that both the data summary and clustering/core microbiome analyses are of particular interest to the reader, and that they should be kept as part of the main analyses rather than the supplement – however, we are certainly happy to discuss alternative ideas with the reviewers and editors.
- Given that the authors claim to provide a simple, fast and optimized workflow it would be good to mention how this workflow differs or provides faster and better analysis than previous work using amplicon sequencing with a MinION sequencer.
Data throughput, sequencing error rates and flow cell stability have seen rapid improvements since the commercial release of MinION in 2015. In consequence, bioinformatics community standards regarding raw data processing and integration steps are still lacking, as illustrated by a thorough recent benchmark of fast5 to fastq format "basecalling" methods (Wick et al., Genome Biology 2019, doi: 10.1186/s13059-019-1727-y).
Early on during our analyses, we noticed that a plethora of bespoke pipelines have been reported in recent 16S environmental surveys using MinION (e.g. Kerkhof et al., Microbiome 2017, 10.1186/s40168-017-0336-9; Cusco et al., F1000 Research 2018, 10.12688/f1000research.16817.2; Acharya et al., Scientific Reports 2019, 10.1038/s41598-019-51997-x; Nygaard et al., Scientific Reports 2020, doi: 10.1038/s41598-020-59771-0). This underlines a need for more unified bioinformatics standards of (full-length) 16S amplicon data treatment, while similar benchmarks exist for short-read 16S metagenomics approaches, as well as for nanopore shotgun sequencing (e.g. Ye et al., Cell 2019, doi: 10.1016/j.cell.2019.07.010; Latorre-Pérez et al., Scientific Reports 2020, doi:10.1038/s41598-020-70491-3).
By adding a thorough speed and memory usage summary (new Supplementary Figure 1b), in addition to our (mis)classification performance tests based on both mock and complex microbial community analyses, we provide the reader with a broad overview of existing options. While the widely used Kraken 2 and Centrifuge methods provide exceptional speed, we find that this comes with a noticeable tradeoff in taxonomic assignment accuracy. We reason that Minimap2 alignments provide a solid compromise between speed and classification performance, with the MAPseq software offering a viable alternative should memory usage limitation apply to users.
We intend to extend this benchmarking process to future tools, and to update it on our GitHub page (https://github.com/d-j-k/puntseq). This page notably also hosts a range of easy-to-use scripts for employing downstream 16S analysis and visualization approaches, including ordination, clustering and alignment tests.
The revised Discussion now emphasises the specific advancements of our study with respect to freshwater analysis and more general standardisation of nanopore 16S sequencing, also in contrast to previous amplicon nanopore sequencing approaches in which only one or two bioinformatics workflows were tested (page 16, lines 297-306).
They also mention that nanopore sequencing is an "inexpensive, easily adaptable and scalable framework" The term "inexpensive" doesn't seem appropriate since it is relative. In addition, they should also discuss that although it is technically convenient in some aspects compared to other sequencers, there are still protocol steps that need certain reagents and equipment that is similar or the same to those needed for other sequencing platforms. Common bottlenecks such as DNA extraction methods, sample preservation and the presence of inhibitory compounds should be mentioned.
We agree with the reviewers that “inexpensive” is indeed a relative term, which needs further clarification. We therefore now state that this approach is “cost-effective” and discuss future developments such as the 96-sample barcoding kits and Flongle flow cells for small-scale water diagnostics applications, which will arguably render lower per-sample analysis costs in the future (page 18, lines 361-365).
Other investigators (e.g. Boykin et al., Genes 2019, doi:10.3390/genes10090632; Acharya et al., Water Technology 2020, doi:10.1016/j.watres.2020.116112) have recently shown that the full application of DNA extraction and in-field nanopore sequencing can be achieved at comparably low expense: Boykin et al. studied cassava plant pathogens using barcoded nanopore shotgun sequencing, and estimated costs of ~45 USD per sample, while we calculate ~100 USD per sample in this study. Acharya et al. undertook in situ water monitoring between Birtley, UK and Addis Ababa, Ethiopia, estimated ~75-150 USD per sample and purchased all necessary equipment for ~10,000 GBP – again, we think that this lies roughly within a similar range as our (local) study's total cost of ~3,670 GBP (Supplementary Table 6).
The revised manuscript now mentions the possibility of increasing sequencing yield by improving DNA extraction methods, by taking sample storage and potential inhibitory compounds into account in the planning phase (page 18, lines 348-352).
Minor points:
-Please include a reference to the statement saying that the river Cam is notorious for the "infections such as leptospirosis".
There are indeed several media reports that link leptospirosis risk to the local River Cam (e.g. https://www.cambridge-news.co.uk/news/cambridge-news/weils-disease-river-cam-leptosirosis-14919008 or https://www.bbc.com/news/uk-england-cambridgeshire-29060018). As we, however, did not find a scientific source for this information, we have slightly adjusted the statement in our manuscript from referring to Cambridge to instead referring to the entire United Kingdom. Accordingly, we now cite two reports from Public Health England (PHE) about serial leptospirosis prevalence in the United Kingdom (page 13, lines 226-227).
-Please check figure 7 for consistency across panels, such as shading in violet and labels on the figures that do not seem to correspond with what is stated in the legend. Please mention what the numbers correspond to in outer ring. Check legend, where it says genes is probably genus.
Thank you for pointing this out. We have revised (now labelled) Figure 8 and removed all inconsistencies between the panels. The legend has also been updated, which now includes a description of the number labelling of the tree, and a clearer differentiation between the colour coding of the tree nodes and the background highlighting of individual nanopore reads.
-Page 6. There is a "data not shown" comment in the text: "Benchmarking of the classification tools on one aquatic sample further confirmed Minimap2's reliable performance in a complex bacterial community, although other tools such as SPINGO (Allard, Ryan, Jeffery, & Claesson, 2015), MAPseq (Matias Rodrigues, Schmidt, Tackmann, & von Mering, 2017), or IDTAXA (Murali et al., 2018) also produced highly concordant results despite variations in speed and memory usage (data not shown)." There appears to be no good reason that this data is not shown. In case the speed and memory usage was not recorded, is advisable to rerun the analysis and quantify these variables, rather than mentioning them and not reporting them. Otherwise, provide an explanation for not showing the data please.
This is a valid point, and we agree with the reviewers that it is worth properly following up on this initial observation. To this end, our revised manuscript now entails a systematic characterisation of the twelve tools' runtime and memory usage performance. This has been added as Supplementary Figure 1b and under the new Materials and Methods section 2.2.4 (page 26, lines 556-562), while the corresponding results and their implications are discussed on page 16, lines 301-306. Particularly with respect to the runtime measurements, it is worth noting that these can differ by several orders of magnitude between the classifiers, thus providing an additional clarification on our choice of the - relatively fast - Minimap2 alignments.
-In Figure 4, it would be important to calculate if the family PCA component contribution differences in time are differentially significant. In Panel B, depicted is the most evident variance difference but what about other taxa which might not be very abundant but differ in time? One can use the fitFeatureModel function from the metagenomeSeq R library and a P-adjusted threshold value of 0.05, to validate abundance differences in addition to your analysis.
To assess if the PC component contribution of Figure 5 (previously Figure 4) significantly differed between the three time points, we have applied non-parametric tests to all season-grouped samples except for the mock community controls. We first applied Kruskal-Wallis H-test for independent samples, followed by post-hoc comparisons using two-sided Mann-Whitney U rank tests.
The Kruskal-Wallis test established a significant difference in PC component contributions between the three time points (p = 0.0049), with most of the difference stemming from divergence between April and August samples according to the post-hoc tests (p = 0.0022). The June sampled seemed to be more similar to the August ones (p = 0.66) than to the ones from April (p = 0.11), recapitulating the results of our hierarchical clustering analysis (Figure 4a).
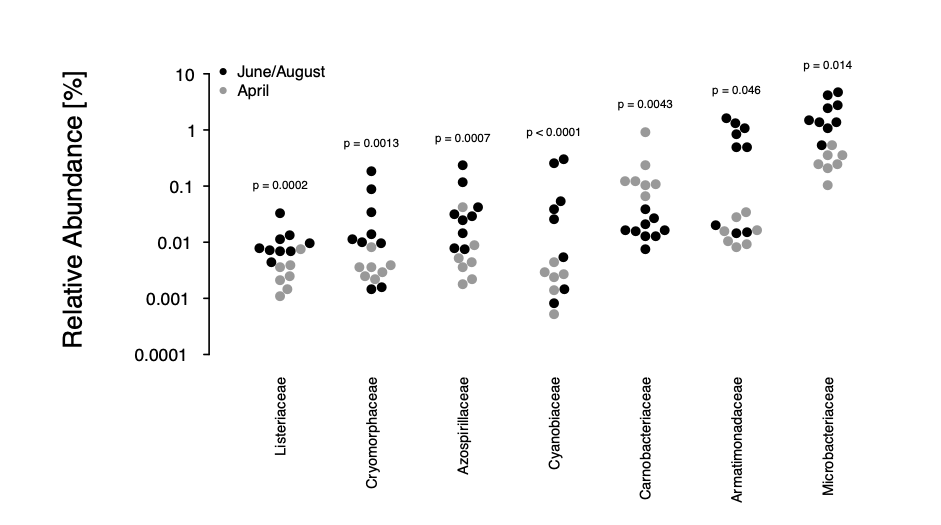
We have followed the reviewers' advice and applied a complementary approach, using the fitFeatureModel of metagenomeSeq to fit a zero-inflated log-normal mixture model of each bacterial taxon against the time points. As only three independent variables can be accounted for by the model (including the intercept), we have chosen to investigate the difference between the spring (April) and summer (June, August) months to capture the previously identified difference between these months. At a nominal P-value threshold of 0.05, this analysis identifies seven families to significantly differ in their relative composition between spring and summer, namely Cyanobiaceae, Armatimonadaceae, Listeriaceae, Carnobacteriaceae, Azospirillaceae, Cryomorphaceae, and Microbacteriaceae. Three out of these seven families were also detected by the PCA component analysis (Carnobacteriacaea, Azospirillaceae, Microbacteriaceae) and two more (Listeriacaea, Armatimonadaceae) occured in the top 15 % of that analysis (out of 357 families).
This approach represents a useful validation of our principal component analysis' capture of likely seasonal divergence, but moreover allows for a direct assessment of differential bacterial composition across time points. We have therefore integrated the analysis into our manuscript (page 10, lines 184-186; Materials and Methods section 2.6, page 29, lines 641-647) – thank you again for this suggestion.
-Page 12-13. In the paragraph: "Using multiple sequence alignments between nanopore reads and pathogenic species references, we further resolved the phylogenies of three common potentially pathogenic genera occurring in our river samples, Legionella, Salmonella and Pseudomonas (Figure 7a-c; Material and Methods). While Legionella and Salmonella diversities presented negligible levels of known harmful species, a cluster of reads in downstream sections indicated a low abundance of the opportunistic, environmental pathogen Pseudomonas aeruginosa (Figure 7c). We also found significant variations in relative abundances of the Leptospira genus, which was recently described to be enriched in wastewater effluents in Germany (Numberger et al., 2019) (Figure 7d)."
Here it is important to mention the relative abundance in the sample. While no further experiments are needed, the authors should mention and discuss that the presence of DNA from pathogens in the sample has to be confirmed by other microbiology methodologies, to validate if there are viable organisms. Definitively, it is a big warning finding pathogen's DNA but also, since it is characterized only at genus level, further investigation using whole metagenome shotgun sequencing or isolation, would be important.
We agree that further microbiological assays, particularly target-specific species isolation and culturing, would be essential to validate the presence of living pathogenic bacteria. Accordingly, our revised Discussion now contains a paragraph that encourages such experiments as part of the design of future studies (with a fully-equipped laboratory infrastructure); page 17, 338-341.
-Page 15: "This might help to establish this family as an indicator for bacterial community shifts along with water temperature fluctuations."
Temperature might not be the main factor for the shift. There could be other factors that were not measured that could contribute to this shift. There are several parameters that are not measured and are related to water quality (COD, organic matter, PO4, etc).
We agree that this was a simplified statement, given our currently limited number of samples, and have therefore slightly expanded on this point (page 17, lines 323-325). It is indeed possible that differential Carnobacteriaceae abundances between the time point measurements may have arisen not as a consequence of temperature fluctuations (alone), but instead as a consequence of the observed hydrochemical changes like e.g. Ca2+, Mg2+, HCO3- (Figure 6b-c) or possible even water flow speed reductions (Supplementary Figure 6d).
-"A number of experimental intricacies should be addressed towards future nanopore freshwater sequencing studies with our approach, mostly by scrutinising water DNA extraction yields, PCR biases and molar imbalances in barcode multiplexing (Figure 3a; Supplementary Figure 5)."
Here you could elaborate more on the challenges, as mentioned previously.
We realise that we had not discussed the challenges in enough detail, and the Discussion now contains a substantially more detailed description of these intricacies (page 18, lines 343-359).
-
Reviewer #2:
The authors present a work related to the survey of the bacterial community in the Cam River (Cambridgeshire, UK) using one of the latest DNA sequencing technologies using a target sequencing approach (Oxford Nanopore). The work consisted in a test for the sequencing and analysis method, benchmarking some programs using mock data, to decide which one was the best for their analysis.
After selecting the best tool, they provide a family level taxonomy profiling for the microbial community along the Cam river through a 4-month window of time. In addition to the general and local snapshots of the bacterial composition, they correlate some physicochemical parameters with the abundance shift of some taxa.
Finally, they report the presence of 55 potentially pathogenic bacterial genera that were further studied using a phylogenetic …
Reviewer #2:
The authors present a work related to the survey of the bacterial community in the Cam River (Cambridgeshire, UK) using one of the latest DNA sequencing technologies using a target sequencing approach (Oxford Nanopore). The work consisted in a test for the sequencing and analysis method, benchmarking some programs using mock data, to decide which one was the best for their analysis.
After selecting the best tool, they provide a family level taxonomy profiling for the microbial community along the Cam river through a 4-month window of time. In addition to the general and local snapshots of the bacterial composition, they correlate some physicochemical parameters with the abundance shift of some taxa.
Finally, they report the presence of 55 potentially pathogenic bacterial genera that were further studied using a phylogenetic analysis.
Comments:
Page 6. There is a "data not shown" comment in the text:
"Benchmarking of the classification tools on one aquatic sample further confirmed Minimap2's reliable performance in a complex bacterial community, although other tools such as SPINGO (Allard, Ryan, Jeffery, & Claesson, 2015), MAPseq (Matias Rodrigues, Schmidt, Tackmann, & von Mering, 2017), or IDTAXA (Murali et al., 2018) also produced highly concordant results despite variations in speed and memory usage (data not shown)."
Nowadays, there is no reason for not showing data. In case the speed and memory usage was not recorded, it is advisable to rerun the analysis and quantify these variables, rather than mentioning them and not report them.
Or what are the reasons for not showing the results?
Figure 2 is too dense and crowded. In the end, all figures are too tiny and the message they should deliver is lost. That also makes the footnote very long. I would suggest moving some of the figure panels, maybe b), c) and d), as separate supp. figures.
Figure 3 has the same problem. I think there is too much information that could be moved as supp. mat.
In addition to Figure 4, it would be important to calculate if the family PCA component contribution differences in time are differentially significant. In Panel B, is depicted the most evident variance difference but what about other taxa which might not be very abundant but differ in time? you can use the fitFeatureModel function from the metagenomeSeq R library and a P-adjusted threshold value of 0.05, to validate abundance differences in addition to your analysis.
Page 12-13. In the paragraph:
"Using multiple sequence alignments between nanopore reads and pathogenic species references, we further resolved the phylogenies of three common potentially pathogenic genera occurring in our river samples, Legionella, Salmonella and Pseudomonas (Figure 7a-c; Material and Methods). While Legionella and Salmonella diversities presented negligible levels of known harmful species, a cluster of reads in downstream sections indicated a low abundance of the opportunistic, environmental pathogen Pseudomonas aeruginosa (Figure 7c). We also found significant variations in relative abundances of the Leptospira genus, which was recently described to be enriched in wastewater effluents in Germany (Numberger et al., 2019) (Figure 7d)."
Here it is important to mention the relative abundance in the sample. Please, discuss that the presence of DNA from pathogens in the sample, has to be confirmed by other microbiology methodologies, to validate if there are viable organisms. Definitively, it is a big warning finding pathogen's DNA but also, since it is characterized only at genus level, further investigation using whole metagenome shotgun sequencing or isolation, would be important.
This phrase is used in the abstract , introduction and discussion, although not exactly written the same:
"Using an inexpensive, easily adaptable and scalable framework based on nanopore sequencing..."
I wouldn't use the term "inexpensive" since it is relative. Also, it should be discussed that although is technically convenient in some aspects compared to other sequencers, there are still protocol steps that need certain reagents and equipment that are similar or the same to those needed for other sequencing platforms. Probably, common bottlenecks such as DNA extraction methods, sample preservation and the presence of inhibitory compounds should be mentioned and stressed out.
Page 15: "This might help to establish this family as an indicator for bacterial community shifts along with water temperature fluctuations."
Temperature might not be the main factor for the shift. There could be other factors that were not measured that could contribute to this shift. There are several parameters that are not measured and are related to water quality (COD, organic matter, PO4, etc).
"A number of experimental intricacies should be addressed towards future nanopore freshwater sequencing studies with our approach, mostly by scrutinising water DNA extraction yields, PCR biases and molar imbalances in barcode multiplexing (Figure 3a; Supplementary Figure 5)."
Here you could elaborate more on the challenges like those mentioned in my previous comment.
-
Reviewer #1:
The authors present a workflow based on targeted Nanopore DNA sequencing, in which they amplify and sequence nearly full-length 16S rRNA genes, to analyze surface water samples from the Cam river in Cambridge. They first identify a taxonomic classification tool, out of twelve studied, that performs best with their data. They detect a core microbiome and temporal gradients in their samples and analyze the presence of potential pathogens, obtaining species level resolution and sewage signals. The manuscript is well written and contains sufficient information for others to carry out a similar analysis with a strategy that the authors claim will be more accessible to users around the world, and particularly useful for freshwater surveillance and tracing of potential pathogens.
The work is sufficiently well-documented and timely …
Reviewer #1:
The authors present a workflow based on targeted Nanopore DNA sequencing, in which they amplify and sequence nearly full-length 16S rRNA genes, to analyze surface water samples from the Cam river in Cambridge. They first identify a taxonomic classification tool, out of twelve studied, that performs best with their data. They detect a core microbiome and temporal gradients in their samples and analyze the presence of potential pathogens, obtaining species level resolution and sewage signals. The manuscript is well written and contains sufficient information for others to carry out a similar analysis with a strategy that the authors claim will be more accessible to users around the world, and particularly useful for freshwater surveillance and tracing of potential pathogens.
The work is sufficiently well-documented and timely in its use of nanopore sequencing to profile environmental microbial communities. However, given that the authors claim to provide a simple, fast and optimized workflow it would be good to mention how this workflow differs or provides faster and better analysis than previous work using amplicon sequencing with a MinION sequencer.
Many of the June samples failed to provide sufficient sequence information. Could the authors comment on why these samples failed? While some samples did indeed have low yields, this was not the case for all (supp table 2 and supp figure 5) and it could be interesting to know if they think additional water parameters or extraction conditions could have affected yields and subsequent sequencing depth.
One of the advantages of nanopore sequencing is that you can obtain species-level information. It would therefore be helpful if the authors could include information on how many of their sequenced 16S amplicons provided species-level identification.
While the overall analysis of microbial communities is well done, it is not entirely clear how the authors define their core microbiome. Are they reporting mainly the most abundant taxa (dominant core microbiome), and would this change if you look at a taxonomic rank below the family level? How does the core compare, for example, with other studies of this same river?
-
Summary: The authors present a survey of the bacterial community in the Cam River in Cambridge, UK, using Nanopore DNA sequencing, one of the latest DNA sequencing technologies. They profile microbial communities along the river, correlate with physicochemical parameters and identify potential pathogens and sewage signals. The work provides standardized protocols and bioinformatics tools for analysis of bacteria in freshwater samples, with the aim of providing a low-cost and optimized workflow that can be applied for the monitoring of complex aquatic microbiomes.
-
