Mapping vascular network architecture in primate brain using ferumoxytol-weighted laminar MRI
Curation statements for this article:-
Curated by eLife

eLife Assessment
This study presents valuable findings on the relative cerebral blood volume of non-human primates that move us closer to uncovering the functional and architectonic principles that govern the interplay between neuronal and vascular networks. The evidence of areal variations and of vessel counting and laminar analysis is solid. The lack of a direct comparison of their approach against better-established MRI-based methods for measuring hemodynamics and vascular structure somewhat weakens the evidence provided in the current paper version, but the current work is an significant step forward. The work will be of interest to NHP imaging scientists.
This article has been Reviewed by the following groups
Discuss this preprint
Start a discussion What are Sciety discussions?Listed in
- Evaluated articles (eLife)
Abstract
Mapping the vascular organization of the brain is of great importance across various domains of basic neuroimaging research, diagnostic radiology, and neurology. However, the intricate task of precisely mapping vasculature across brain regions and cortical layers presents formidable challenges, resulting in a limited understanding of neurometabolic factors influencing the brain’s microvasculature. Addressing this gap, our study investigates whole-brain vascular volume using ferumoxytol-weighted laminar-resolution multi-echo gradient-echo imaging in macaque monkeys. We validate the results with published data for vascular densities and compare them with cytoarchitecture, neuron and synaptic densities. The ferumoxytol-induced change in transverse relaxation rate (ΔR 2 *), an indirect proxy measure of cerebral blood volume (CBV), was mapped onto 12 equivolumetric laminar cortical surfaces. Our findings reveal that CBV varies threefold across the brain, with the highest vascular volume observed in the inferior colliculus and lowest in the corpus callosum. In the cerebral cortex, CBV is notably high in early primary sensory areas and low in association areas responsible for higher cognitive functions. Classification of CBV into distinct groups unveils extensive replication of translaminar vascular network motifs, suggesting distinct computational energy supply requirements in areas with varying cytoarchitecture types. Regionally, baseline R 2 * and CBV exhibit positive correlations with neuron density and negative correlations with receptor densities. Adjusting image resolution based on the critical sampling frequency of penetrating cortical vessels allows us to delineate approximately 30% of the arterial–venous vessels. Collectively, these results mark significant methodological and conceptual advancements, contributing to the refinement of cerebrovascular MRI. Furthermore, our study establishes a linkage between neurometabolic factors and the vascular network architecture in the primate brain.
Article activity feed
-

-
-
-

eLife Assessment
This study presents valuable findings on the relative cerebral blood volume of non-human primates that move us closer to uncovering the functional and architectonic principles that govern the interplay between neuronal and vascular networks. The evidence of areal variations and of vessel counting and laminar analysis is solid. The lack of a direct comparison of their approach against better-established MRI-based methods for measuring hemodynamics and vascular structure somewhat weakens the evidence provided in the current paper version, but the current work is an significant step forward. The work will be of interest to NHP imaging scientists.
-
Reviewer #1 (Public review):
Summary:
Audio et al. present an interesting study examining cerebral blood volume (CBV) across cortical areas and layers in non-human primates (NHPs) using high-resolution MRI. While with contrast agents are frequently employed to improve fMRI sensitivity in NHP research, its application for characterizing baseline CBV distribution is less common. This study quantifies large-vessel distribution as well as regional and laminar CBV variations, comparing them with other metrics.
Strengths:
(1) Noninvasive mapping of relative cerebral blood volume is novel for non-human primates.
(2) A key finding was the observation of variations in CBV across regions; primary sensory cortices had high CBV, whereas other higher areas had low CBV.
(3) The measured relative CBV values correlated with previously reported neuronal …Reviewer #1 (Public review):
Summary:
Audio et al. present an interesting study examining cerebral blood volume (CBV) across cortical areas and layers in non-human primates (NHPs) using high-resolution MRI. While with contrast agents are frequently employed to improve fMRI sensitivity in NHP research, its application for characterizing baseline CBV distribution is less common. This study quantifies large-vessel distribution as well as regional and laminar CBV variations, comparing them with other metrics.
Strengths:
(1) Noninvasive mapping of relative cerebral blood volume is novel for non-human primates.
(2) A key finding was the observation of variations in CBV across regions; primary sensory cortices had high CBV, whereas other higher areas had low CBV.
(3) The measured relative CBV values correlated with previously reported neuronal and receptor densities, potentially providing valuable physiological insights.Weaknesses:
(1) A weakness of this manuscript is that the quantification of CBV with postprocessing approaches to remove susceptibility effects from pial and penetrating vessels is not fully validated, especially on a laminar scale.
(2) High-resolution MRI with a critical sampling frequency estimated from previous studies (Weber 2008, Zheng 1991) was performed to separate penetrating vessels. However, this approach depends on multiple factors, including spatial resolution, contrast agent dosage, and data processing methods. This raises concerns about the generalizability of these findings to other experimental setups or populations.
(3) Baseline R2* is sensitive to baseline R2, vascular volume, iron content, and susceptibility gradients. Additionally, it is sensitive to imaging parameters; higher spatial resolution tends to result in lower R2* values (closer to the R2 value). Although baseline R2* correlates with several physiological parameters, drawing direct physiological inferences from it remains challenging.
(4) CBV-weighted deltaR2*, which depends on both CBV and contrast agent dose, correlates with various metrics (cytoarchitectural parcellation, myelin/receptor density, cortical thickness, CO, cell-type specificity, etc.). While such correlations may be useful for exploratory analyses, all comparisons depend on measurement accuracy. A fundamental question remains whether CBV-weighted ΔR2* can provide reliable and biologically meaningful insights into these metrics, particularly in diseased or abnormal brain states. -
Reviewer #2 (Public review):
Summary:
This manuscript presents a new approach for non-invasive, MRI-based, measurements of cerebral blood volume (CBV). Here, the authors use ferumoxytol, a high-contrast agent and apply specific sequences to infer CBV. The authors then move to statistically compare measured regional CBV with known distribution of different types of neurons, markers of metabolic load and others. While the presented methodology captures and estimated 30% of the vasculature, the authors corroborated previous findings regarding lack of vascular compartmentalization around functional neuronal units in the primary visual cortex.
Strengths:
Non-invasive methodology geared to map vascular properties in vivo.
Implementation of a highly sensitive approach for measuring blood volume.
Ability to map vascular structural and …
Reviewer #2 (Public review):
Summary:
This manuscript presents a new approach for non-invasive, MRI-based, measurements of cerebral blood volume (CBV). Here, the authors use ferumoxytol, a high-contrast agent and apply specific sequences to infer CBV. The authors then move to statistically compare measured regional CBV with known distribution of different types of neurons, markers of metabolic load and others. While the presented methodology captures and estimated 30% of the vasculature, the authors corroborated previous findings regarding lack of vascular compartmentalization around functional neuronal units in the primary visual cortex.
Strengths:
Non-invasive methodology geared to map vascular properties in vivo.
Implementation of a highly sensitive approach for measuring blood volume.
Ability to map vascular structural and functional vascular metrics to other types of published data.
Weaknesses:
The key issue here is the underlying assumption about the appropriate spatial sampling frequency needed to captures the architecture of the brain vasculature. Namely, ~7 penetrating vessels / mm2 as derived from Weber et al 2008 (Cer Cor). The cited work, begins by characterizing the spacing of penetrating arteries and ascending veins using vascular cast of 7 monkeys (Macaca mulatta, same as in the current paper). The ~7 penetrating vessels / mm2 is computed by dividing the total number of identified vessels by the area imaged. The problem here is that all measurements were made in a "non-volumetric" manner and only in V1. Extrapolating from here to other brain areas is therefore not possible without further exploration with independent methodologies.
Please note that these are comments on the revised version.
-
Author response:
The following is the authors’ response to the previous reviews
Reviewer #1 (Public review):
Summary:
Audio et al. measured cerebral blood volume (CBV) across cortical areas and layers using high-resolution MRI with contrast agents in non-human primates. While the non-invasive CBV MRI methodology is often used to enhance fMRI sensitivity in NHPs, its application for baseline CBV measurement is rare due to the complexities of susceptibility contrast mechanisms. The authors determined the number of large vessels and the areal and laminar variations of CBV in NHP, and compared those with various other metrics.
Strengths:
Noninvasive mapping of relative cerebral blood volume is novel for non-human primates. A key finding was the observation of variations in CBV across regions; primary sensory cortices had high CBV, …
Author response:
The following is the authors’ response to the previous reviews
Reviewer #1 (Public review):
Summary:
Audio et al. measured cerebral blood volume (CBV) across cortical areas and layers using high-resolution MRI with contrast agents in non-human primates. While the non-invasive CBV MRI methodology is often used to enhance fMRI sensitivity in NHPs, its application for baseline CBV measurement is rare due to the complexities of susceptibility contrast mechanisms. The authors determined the number of large vessels and the areal and laminar variations of CBV in NHP, and compared those with various other metrics.
Strengths:
Noninvasive mapping of relative cerebral blood volume is novel for non-human primates. A key finding was the observation of variations in CBV across regions; primary sensory cortices had high CBV, whereas other higher areas had low CBV. The measured CBV values correlated with previously reported neuronal and receptor densities.
We appreciate your recognition of the novelty of our non-invasive relative cerebral blood volume (CBV) mapping in non-human primates, as well as the observed areal variations and their correlations with neuronal and receptor densities. However, we are concerned that key contributions of our work—such as cortical layer-specific vasculature mapping and benchmarking surface vessel density estimations against anatomical ground truth—are being framed as limitations rather than significant advances in the field pushing the boundaries of current neuroimaging capabilities and providing a valuable foundation for future research. Additionally, we would like to clarify that dynamic susceptibility contrast (DSC) MRI using gadolinium is the gold standard for CBV measurement in clinical settings and the argument that “baseline CBV measurements are rare due to the complexities of susceptibility contrast” is simply not true. The limited use of ferumoxytol for CBV imaging is primarily due to previous FDA regulatory restrictions, rather than inherent methodological shortcomings.
Changes in text:
Compared to clinically used gadolinium-based agents, ferumoxytol's substantially longer half-life and stronger R2* effect allows for higher-resolution and more sensitive vascular volume measurements (Buch et al., 2022), albeit these methodologies are hampered by confounding factors such as vessel orientation relative to the magnetic field (B0) direction (Ogawa et al., 1993).
Weaknesses:
A weakness of this manuscript is that the quantification of CBV with postprocessing approaches to remove susceptibility effects from pial and penetrating vessels is not fully validated, especially on a laminar scale. Further specific comments follow.
(1) Baseline CBV indices were determined using contrast agent-enhanced MRI (deltaR2*). Although this approach is suitable for areal comparisons, its application at a laminar scale poses challenges due to significant contributions from large vessels including pial vessels. The primary concern is whether large-vessel contributions can be removed from the measured deltaR2* through processing techniques.
Eliminating the contribution of large vessels completely is unlikely, and we agree with the reviewer that ΔR2* results likely reflect a weighted combination of signals from both large vessels and capillaries. However, the distribution of ΔR2* more closely aligns with capillary density in areas V1–V5 than with large vessel distributions (Weber et al., 2008), suggesting that our ΔR2* results are more weighted toward capillaries. Moreover, we demonstrated that the pial vessel induced signal-intensity drop-outs are clearly limited to the superficial layers and exhibit smaller spatial extent than generally thought (Supp. Figs. 2 and 4).
(2) High-resolution MRI with a critical sampling frequency estimated from previous studies (Weber 2008, Zheng 1991) was performed to separate penetrating vessels. However, this approach is still insufficient to accurately identify the number of vessels due to the blooming effects of susceptibility and insufficient spatial resolution. The reported number of penetrating vessels is only applicable to the experimental and processing conditions used in this study, which cannot be generalized.
Our intention was not to suggest that our measurements provide a general estimate of vessel density across the macaque cerebral cortex. At 0.23 mm isotropic resolution, we successfully delineated approximately 30% of the penetrating vessels in V1. Our primary objective was to demonstrate a proof-of-concept quantifiable measurement rather than to establish a generalized vessel density metric for all brain regions. We have consistently emphasized this throughout the manuscript, but if there is a specific point of misunderstanding, we would be happy to consider revisions for clarity.
(3) Baseline R2* is sensitive to baseline R2, vascular volume, iron content, and susceptibility gradients. Additionally, it is sensitive to imaging parameters; higher spatial resolution tends to result in lower R2* values (closer to the R2 value). Thus, it is difficult to correlate baseline R2* with physiological parameters.
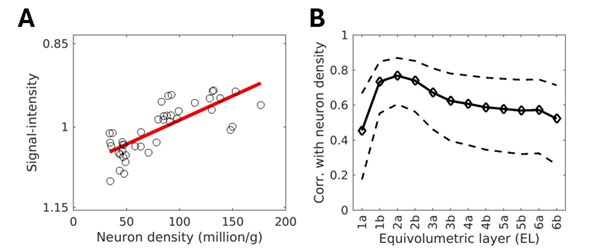
The observed correlation between R2* and neuron density is likely indirect, as R2* is strongly influenced by iron, myelin, and deoxyhemoglobin densities. However, the robust correlation between R2* and neuron density, peaking in the superficial layers (R = 0.86, p < 10-10), is striking and difficult to ignore (revised Supp. Fig. 6D-E). Upon revision, we identified an error in Supp. Fig. 6D-E, where the previous version used single-subject R2* and ΔR2* maps instead of the group-averaged maps. The revised correlations are slightly stronger than in the earlier version.
Given that the correlation between neuron density and R2* is strongest in the superficial layers, we suggest this relationship reflects an underlying association with tissue cytochrome oxidase (CO) activity and cumulative effect of deoxygenated venous blood drainage toward the pial network. The superficial cortical layers are also less influenced by myelin and iron densities, which are more concentrated in the deeper cortical layers. Additional factors may contribute to this relationship, including the iron dependence of mitochondrial CO activity, as iron is an essential component of CO’s heme groups. Moreover, myelin maintenance depends on iron, which is predominantly stored in oligodendrocytes. The presence of myelinated thin axons and a higher axonal surface density may, in turn, be a prerequisite for high neuron density.
In this context, it is also valuable to note the absolute range of superficial R2* values (≈ 6 s-1; Supp. Fig. 6D). This variation in cortical surface R2* is about 12-30 times larger compared to the signal changes observed during task-based fMRI (6 vs. 0.2-0.5 s-1). This relation seems reasonable because regional increases in absolute blood flow associated with imaging signals, as measured by PET, typically do not exceed 5%–10% of the brain's resting blood flow (Raichle and Mintum 2016; Brain work and brain imaging). The venous oxygenation level is typically 60%, with task-induced activation increasing it by only a few percent. We suggest that this is ~40% oxygen extraction is reflected in the superficial R2*. Finally, the large intercept (≈ 14.5 1/s; Supp. Fig. 6D), which is not equivalent to the water R2* (≈ 1 1/s), suggests that R2* is influenced by substantial non-neuron density factors, such as receptor, myelin, iron, susceptibility gradients and spatial resolution.
The R2* values are well known to be influenced by intra-voxel phase coherence and thus spatial resolution. However, our view is that the proposed methodology of acquiring cortical-layer thickness adjusted high-resolution (spin-echo) R2 maps poses more methodological limitations and is less practical. Notwithstanding, to further corroborate the relationship between R2* and neuron density, we investigated whether a similar correlation exists in non-quantitative T2w SPACE-FLAIR images (0.32 mm isotropic) signal-intensity and neuron density. Using B1 bias-field and B0 orientation bias corrected T2w SPACE-FLAIR images (N=7), we parcellated the equivolumetric surface maps using Vanderbilt sections. Our findings showed that signal intensity—where regions with high signal intensity correspond to low R2 values, and areas with low signal intensity correspond to high R2 values—was positively correlated with neuron density, particularly in the superficial layers (R = 0.77, p = 10-11; Author response image 1).This analysis confirmed the correlation with neuron density and R2 peaks at superficial layers. However, this correlation was slightly weaker compared to quantitative R2* (Supp. Fig. 6D), suggesting the variable flip-angle spin-echo train refocused signal-phase coherence loss from large draining vessels or that non-quantitative T2w-FLAIR images may be confounded by other factors such as B1 transmission field biases (Glasser et al., 2022). Notwithstanding, this non-quantitative fast spin-echo with variable flip-angles approach, which is in principle less dependent on image resolution and closer to R2,intrinsic than R2*, yields similar findings in comparison to quantitative gradient-echo.
Author response image 1.
(A) T2w-FLAIR SPACE normalized signal-intensity plotted vs neuron density. Note that low signal-intensity corresponds to high R2 and high neuron density, consistent with findings using ME-GRE. (B) Correlation between T2w-FLAIR SPACE and neuron density across equivolumetric layers. Notably, a similar relationship with neuron density was observed using a variable spin-echo pulse sequence as with quantitative gradient-echo-based imaging.
Changes in text:
Results:
“Because the Julich cortical area atlas covers only a section of the cerebral cortex, and the neuron density estimates are interpolated maps, we extended our analysis using the original Collins sample borders encompassing the entire cerebral cortex (Supp. Fig. 6A-C). This analysis reaffirmed the positive correlation with ΔR2* (peak at EL2, R = 0.80, p < 10-11) and baseline R2* (peak at EL2a, R = 0.86, p < 10-13), yielding linear coefficients of ΔR2* = 102 × 103 neurons/s and R2* = 41 × 103 neurons/s (Supp. Fig. 6D-G). This suggests that the sensitivity of quantitative layer R2* MRI in detecting neuronal loss is relatively weak, and the introduction of the Ferumoxytol contrast agent has the potential to enhance this sensitivity by a factor of 2.5.”
A new paragraph was added into discussion section 4.3 corroborating the relation between R2* and neuron density:
“Another key finding of this study was the strong correlation between baseline R2* and neuron density (Supp. Fig. 6D, E). While R2* is well known to be influenced by iron, myelin, and deoxyhemoglobin densities, this correlation peaks in the superficial layers (Supp. Fig. 6E), suggesting a link to CO activity and the accumulation of deoxygenated venous blood draining from all cortical layers toward the pial network. Notably, the absolute range of superficial R2* values (max - min ≈ 6 s-1; Supp. Fig. 6D) is approximately 12-30 times larger than the ΔR2* observed during task-based BOLD fMRI at 3T (0.2-0.5 1/s) (Yablonskiy and Haacke 1994). Since venous oxygenation is around 60% and task-induced changes in blood flow account for only 5%–10% of the brain's resting blood flow (Raichle & Mintun, 2006), these results suggest that superficial R2* (Fig. 1D) may serve as a more accurate proxy for total deoxyhemoglobin content (and thus total oxygen consumption), which scales with the neuron density of the underlying cortical gray matter. Importantly, superficial layers may also provide a more specific measure of deoxyhemoglobin, as they are less influenced by myelin and iron, which are more concentrated in deeper cortical layers. Additionally, smaller but direct contributors, such as mitochondrial CO density—an iron-dependent factor—may also play a role in this relationship.”
References:
Raichle, M.E., Mintun, M.A., 2006. BRAIN WORK AND BRAIN IMAGING. Annu. Rev. Neurosci. 29, 449–476. https://doi.org/10.1146/annurev.neuro.29.051605.112819
(4) CBV-weighted deltaR2* is correlated with various other metrics (cytoarchitectural parcellation, myelin/receptor density, cortical thickness, CO, cell-type specificity, etc.). While testing the correlation between deltaR2* and these other metrics may be acceptable as an exploratory analysis, it is challenging for readers to discern a causal relationship between them. A critical question is whether CBV-weighted deltaR2* can provide insights into other metrics in diseased or abnormal brain states.
We acknowledge that having multivariate analysis using dense histological maps would be valuable to establish causality among these several metrics:
“To comprehensively understand the factors contributing to the vascular organization of the brain, experimental disentanglement through multivariate analysis of laminar cell types and receptor densities is needed (Hayashi et al., 2021, Froudist-Walsh et al., 2023). Moreover, employing more advanced statistical modeling, including considerations for synapse-neuron interactions, may be important for refined evaluations.”
We think the primary contributors to the brain's energy budget are neurons and receptors, as shown in several references and stated in the manuscript. To investigate relationship between neuron density and CBV, we estimated the energy budget allocated to neurons and extrapolated the remaining CBV to other contributing factors:
Changes in text:
“However, this is a simplified estimation, and a more comprehensive assessment would need to account for an aggregate of biophysical factors such as neuron types, neuron membrane surface area, firing rates, dendritic and synaptic densities (Fig. 6F-G), neurotransmitter recycling, and other cell types (Kageyama 1982; Elston and Rose 1997; Perge et al., 2009; Harris et al., 2012). Indeed, the majority of the mitochondria reside in the dendrites and synaptic transmission is widely acknowledged to drive the majority of the energy consumption and blood flow (Wong-Riley, 1989; Attwell et al., 2001).
Extrapolating cortical ΔR2* to zero neuron density results in a large intercept (~35 1/s), corresponding to 60% of the maximum cortical CBV (57 1/s; Supp. Fig. 6F). This supports the view that the majority of energy consumption occurs in the neuropil—comprising dendrites, synapses, and axons—which accounts for ~80–90% of cortical gray matter volume, whereas neuronal somata constitute only ~10–20% (Wong-Riley, 1989). Although neuronal cell bodies exhibit higher CO activity per unit volume due to their dense mitochondrial content, these results suggest their overall contribution to the total CBV per mm3 tissue remains lower than that of the neuropil, given the latter's substantially larger volume fraction in cortical tissue.
Contrary to our initial expectations, we observed a relatively smaller CBV in regions and layers with high receptor density (Fig. 6B, D, F). This relationship extends to other factors, such as number of spines (putative excitatory inputs) and dendrite tree size across the entire cerebral cortex (Supp. Fig. 7) (Froudist-Walsh et al., 2023, Elston 2007). These results align with the work of Weber and colleagues, who reported a similar negative correlation between vascular length density and synaptic density, as well as a positive correlation with neuron density in macaque V1 across cortical layers (Weber et al., 2008).”
Variations in neurons and receptors are reflected in cytoarchitecture, myelin (axon density likely scales with neuron density and myelin inhibits synaptic connections), and cell-type composition. For example, fast-spiking parvalbumin interneurons, which target the soma or axon hillock, are well-suited for regulating activity in regions with high neuron density, whereas bursting calretinin interneurons, which target distal dendrites, are more adapted to areas with high synaptic density. These factors in turn, gradually change along the cortical hierarchy level (higher levels have thinner cortical layer IV, more complex dendrite trees and more numerous inter-areal connectivity patterns). In our view, these factors are tightly interlinked and explain the strong correlations and metabolic demands observed across different metrics.
We also agree that cortical layer imaging of vasculature in diseased or abnormal brain states is an intriguing direction for future research; however, it falls beyond the scope of the present study.
Reviewer #2 (Public review):
Summary:
This manuscript presents a new approach for non-invasive, MRI-based, measurements of cerebral blood volume (CBV). Here, the authors use ferumoxytol, a high-contrast agent and apply specific sequences to infer CBV. The authors then move to statistically compare measured regional CBV with known distribution of different types of neurons, markers of metabolic load and others. While the presented methodology captures and estimated 30% of the vasculature, the authors corroborated previous findings regarding lack of vascular compartmentalization around functional neuronal units in the primary visual cortex.
Strengths:
Non invasive methodology geared to map vascular properties in vivo.
Implementation of a highly sensitive approach for measuring blood volume.
Ability to map vascular structural and functional vascular metrics to other types of published data.
Weaknesses:
The key issue here is the underlying assumption about the appropriate spatial sampling frequency needed to captures the architecture of the brain vasculature. Namely, ~7 penetrating vessels / mm2 as derived from Weber et al 2008 (Cer Cor). The cited work, begins by characterizing the spacing of penetrating arteries and ascending veins using vascular cast of 7 monkeys (Macaca mulatta, same as in the current paper). The ~7 penetrating vessels / mm2 is computed by dividing the total number of identified vessels by the area imaged. The problem here is that all measurements were made in a "non-volumetric" manner and only in V1. Extrapolating from here to the entire brain seems like an over-assumption, particularly given the region-dependent heterogeneity that the current paper reports.
We appreciate the reviewer’s concerns regarding spatial sampling frequency and its implications for characterizing brain vasculature, which we investigated in this study. To clarify, our analysis of surface vessel density was explicitly restricted to V1 precisely due to the limitations of our experimental precision. While we reported the total number of vessels identified in the cortex, we intentionally chose not to present density values across regions in this manuscript. Although these calculations are feasible, we focused on the data directly analyzed and avoided extrapolating density values beyond the scope of our findings. Thus, we are uncertain about the suggestion that we extrapolated vessel density values across the entire brain, as we have taken care to limit our conclusions of our vessel density precision to V1.
Regarding methodology, we conducted two independent analyses of vessel density specifically in V1. The first involved volumetric analysis using the Frangi filter, while the second used surface-based analysis of local signal-intensity gradients (as illustrated in Fig. 2E and Supp. Figs. 3 and 4), albeit the final surface density analysis is performed using the ultra-high resolution equivolumetric layers. Notably, these two approaches produced consistent and comparable vessel density estimates, supporting the reliability of our findings within the scope of V1 (we found 30% of the vessels relative to the ground-truth).
Comments on revisions:
I appreciate the effort made to improve the manuscript. That said, the direct validation of the underlying assumption about spatial resolution sampling remains unaddressed in the final version of this manuscript. With the only intention to further strengthen the methodology presented here, I would encourage again the authors to seek a direct validation of this assumption for other brain areas.
In their reply, the authors stated "... line scanning or single-plane sequences, at least on first impression, seem inadequate for whole-brain coverage and cortical surface mapping. ". This seems to emanate for a misunderstanding as the method could be used to validate the mapping, not to map per-se.
We apologize for any misunderstanding in our previous response and appreciate your clarification. We now understand that you were suggesting the use of line-scanning or single-plane sequences as a method to validate, rather than map, our spatial sampling assumptions.
We agree that single-plane sequences at very high in-plane resolution (e.g., 50 × 50 × 1000 µm) have great potential to detect penetrating vessels and even vessel branching patterns. These techniques could indeed provide valuable insights into region-specific vessel density variations which could then be used to validate whole brain 3D acquisitions. However, as noted above, we have refrained from reporting vessel densities outside V1 precisely due to sampling limitations (we only found 30% of the penetrating vessels in V1, or only 2 mm2/30mm2 ≈ 7% of branching vessel ground-truth, see discussion).
We acknowledge the merit of incorporating such methods to validate regional vessel densities and agree that this would be an important avenue for future research. Thank you for suggesting this point, we have briefly mentioned the advantage of single-plane EPI at discussion.
Changes in text:
“4.1 Methodological considerations - vessel density informed MRI
…anatomical studies accounting for branching patterns have reported much higher vessel densities up to 30 vessels/mm2 (Keller et al., 2011; Adams et al., 2015). Further investigations are warranted, taking into account critical sampling frequencies associated with vessel branching patterns (Duverney 1981), and achieving higher SNR through ultra-high B0 MRI (Bolan et al., 2006; Harel et al., 2010; Kim et al., 2013) and utilize high-resolution single-plane sequences and prospective motion correction schemes to accurately characterize regional vessel densities. Such advancements hold promise for improving vessel quantification, classifications for veins and arteries and constructing detailed cortical surface maps of the vascular networks which may have diagnostic and neurosurgical utilities (Fig. 2A, B) (Iadecola, 2013; Qi and Roper, 2021; Sweeney et al., 2018).”
During the revision we found a typo and corrected it in Supp. Fig. 8: Dosal -> Dorsal.
-
-
eLife Assessment
This study presents valuable findings on the relative cerebral blood volume of non-human primates that move us closer to uncovering the functional and architectonic principles that govern the interplay between neuronal and vascular networks. The evidence of areal variations is solid, but that of vessel counting and laminar analysis is incomplete. The lack of a direct comparison of their approach against better-established MRI-based methods for measuring hemodynamics and vascular structure weakens the evidence provided in the current paper version. The work will be of interest to NHP imaging scientists.
-
Reviewer #1 (Public review):
Summary:
Audio et al. measured cerebral blood volume (CBV) across cortical areas and layers using high-resolution MRI with contrast agents in non-human primates. While the non-invasive CBV MRI methodology is often used to enhance fMRI sensitivity in NHPs, its application for baseline CBV measurement is rare due to the complexities of susceptibility contrast mechanisms. The authors determined the number of large vessels and the areal and laminar variations of CBV in NHP, and compared those with various other metrics.
Strengths:
Noninvasive mapping of relative cerebral blood volume is novel for non-human primates. A key finding was the observation of variations in CBV across regions; primary sensory cortices had high CBV, whereas other higher areas had low CBV. The measured CBV values correlated with …
Reviewer #1 (Public review):
Summary:
Audio et al. measured cerebral blood volume (CBV) across cortical areas and layers using high-resolution MRI with contrast agents in non-human primates. While the non-invasive CBV MRI methodology is often used to enhance fMRI sensitivity in NHPs, its application for baseline CBV measurement is rare due to the complexities of susceptibility contrast mechanisms. The authors determined the number of large vessels and the areal and laminar variations of CBV in NHP, and compared those with various other metrics.
Strengths:
Noninvasive mapping of relative cerebral blood volume is novel for non-human primates. A key finding was the observation of variations in CBV across regions; primary sensory cortices had high CBV, whereas other higher areas had low CBV. The measured CBV values correlated with previously reported neuronal and receptor densities.
Weaknesses:
A weakness of this manuscript is that the quantification of CBV with postprocessing approaches to remove susceptibility effects from pial and penetrating vessels is not fully validated, especially on a laminar scale. Further specific comments follow.
(1) Baseline CBV indices were determined using contrast agent-enhanced MRI (deltaR2*). Although this approach is suitable for areal comparisons, its application at a laminar scale poses challenges due to significant contributions from large vessels including pial vessels. The primary concern is whether large-vessel contributions can be removed from the measured deltaR2* through processing techniques.
(2) High-resolution MRI with a critical sampling frequency estimated from previous studies (Weber 2008, Zheng 1991) was performed to separate penetrating vessels. However, this approach is still insufficient to accurately identify the number of vessels due to the blooming effects of susceptibility and insufficient spatial resolution. The reported number of penetrating vessels is only applicable to the experimental and processing conditions used in this study, which cannot be generalized.
(3) Baseline R2* is sensitive to baseline R2, vascular volume, iron content, and susceptibility gradients. Additionally, it is sensitive to imaging parameters; higher spatial resolution tends to result in lower R2* values (closer to the R2 value). Thus, it is difficult to correlate baseline R2* with physiological parameters.
(4) CBV-weighted deltaR2* is correlated with various other metrics (cytoarchitectural parcellation, myelin/receptor density, cortical thickness, CO, cell-type specificity, etc.). While testing the correlation between deltaR2* and these other metrics may be acceptable as an exploratory analysis, it is challenging for readers to discern a causal relationship between them. A critical question is whether CBV-weighted deltaR2* can provide insights into other metrics in diseased or abnormal brain states.
-
Reviewer #2 (Public review):
Summary:
This manuscript presents a new approach for non-invasive, MRI-based, measurements of cerebral blood volume (CBV). Here, the authors use ferumoxytol, a high-contrast agent and apply specific sequences to infer CBV. The authors then move to statistically compare measured regional CBV with known distribution of different types of neurons, markers of metabolic load and others. While the presented methodology captures and estimated 30% of the vasculature, the authors corroborated previous findings regarding lack of vascular compartmentalization around functional neuronal units in the primary visual cortex.
Strengths:
Non invasive methodology geared to map vascular properties in vivo.
Implementation of a highly sensitive approach for measuring blood volume.
Ability to map vascular structural and …
Reviewer #2 (Public review):
Summary:
This manuscript presents a new approach for non-invasive, MRI-based, measurements of cerebral blood volume (CBV). Here, the authors use ferumoxytol, a high-contrast agent and apply specific sequences to infer CBV. The authors then move to statistically compare measured regional CBV with known distribution of different types of neurons, markers of metabolic load and others. While the presented methodology captures and estimated 30% of the vasculature, the authors corroborated previous findings regarding lack of vascular compartmentalization around functional neuronal units in the primary visual cortex.
Strengths:
Non invasive methodology geared to map vascular properties in vivo.
Implementation of a highly sensitive approach for measuring blood volume.
Ability to map vascular structural and functional vascular metrics to other types of published data.
Weaknesses:
The key issue here is the underlying assumption about the appropriate spatial sampling frequency needed to captures the architecture of the brain vasculature. Namely, ~7 penetrating vessels / mm2 as derived from Weber et al 2008 (Cer Cor). The cited work, begins by characterizing the spacing of penetrating arteries and ascending veins using vascular cast of 7 monkeys (Macaca mulatta, same as in the current paper). The ~7 penetrating vessels / mm2 is computed by dividing the total number of identified vessels by the area imaged. The problem here is that all measurements were made in a "non-volumetric" manner and only in V1. Extrapolating from here to the entire brain seems like an over-assumption, particularly given the region-dependent heterogeneity that the current paper reports.
Comments on revisions:
I appreciate the effort made to improve the manuscript. That said, the direct validation of the underlying assumption about spatial resolution sampling remains unaddressed in the final version of this manuscript. With the only intention to further strengthen the methodology presented here, I would encourage again the authors to seek a direct validation of this assumption for other brain areas.
In their reply, the authors stated "... line scanning or single-plane sequences, at least on first impression, seem inadequate for whole-brain coverage and cortical surface mapping. ". This seems to emanate for a misunderstanding as the method could be used to validate the mapping, not to map per-se.
-
Author response:
The following is the authors’ response to the original reviews.
Public Reviews:
Reviewer #1 (Public review):
Summary:
Audio et al. measured cerebral blood volume (CBV) across cortical areas and layers using high-resolution MRI with contrast agents in non-human primates. While the non-invasive CBV MRI methodology is often used to enhance fMRI sensitivity in NHPs, its application for baseline CBV measurement is rare due to the complexities of susceptibility contrast mechanisms. The authors determined the number of large vessels and the areal and laminar variations of CBV in NHP and compared those with various other metrics.
Strengths:
Non-invasive mapping of relative cerebral blood volume is novel for non-human primates. A key finding was the observation of variations in CBV across regions; primary sensory cortices had …
Author response:
The following is the authors’ response to the original reviews.
Public Reviews:
Reviewer #1 (Public review):
Summary:
Audio et al. measured cerebral blood volume (CBV) across cortical areas and layers using high-resolution MRI with contrast agents in non-human primates. While the non-invasive CBV MRI methodology is often used to enhance fMRI sensitivity in NHPs, its application for baseline CBV measurement is rare due to the complexities of susceptibility contrast mechanisms. The authors determined the number of large vessels and the areal and laminar variations of CBV in NHP and compared those with various other metrics.
Strengths:
Non-invasive mapping of relative cerebral blood volume is novel for non-human primates. A key finding was the observation of variations in CBV across regions; primary sensory cortices had high CBV, whereas other higher areas had low CBV. The measured CBV values correlated with previously reported neuronal and receptor densities.
Weaknesses:
A weakness of this manuscript is that the quantification of CBV with postprocessing approaches to remove susceptibility effects from pial and penetrating vessels, as well as orientation dependency, is not fully validated, especially on a laminar scale. Further specific comments follow.
We suspect that the comment regarding the lack of validation on laminar level stems from an error made by the corresponding author in the original bioRxiv submission (v1, May 17th https://www.biorxiv.org/content/10.1101/2024.05.16.594068v1?versioned=true), where Figure 3 which contains laminar validation was lost during pdf conversion. After submitting to E-Life, this mistake was quickly identified, and a corrected manuscript was re-uploaded to the bioRxiv (v2, June 5th, https://doi.org/10.1101/2024.05.16.594068). Although we informed the eLife staff about the update, it appears that the revised manuscript may not have reached reviewer #1 in time. We sincerely apologize for any confusion or inconvenience this may have caused.
(1) Baseline CBV indices were determined using contrast agent-enhanced MRI (deltaR2*). Although this approach is suitable for areal comparisons, its application on a laminar scale has not been validated in the literature or in this study. By comparing with histological vascular information of V1, the authors attempted to validate their approach. However, the generalization of their method is questionable. The main issue is whether the large vessel contribution is minimized by processing approaches properly in various cortical areas (such as clusters 1-3 in Figure 5). It would be beneficial to compare deltaR2* with deltaR2 induced by contrast agents in a few selected slices, as deltaR2 is supposed to be sensitive to microvessels, not macrovessels. Please discuss this issue.
The requested validation is presented in Figure 3F, which compares our deltaR2* measurements with previously invasive estimates of large vessel, capillary and cytochrome oxidase (CO) levels in V1 (Weber et al., 2008; doi.org/10.1093/cercor/bhm259). Our deltaR2* values show a stronger correspondence with microvascularity and CO levels than large vessels. Moreover, Figure 3D illustrates relative differences between V1 and V2, which closely align with the relative vascular volume differences reported by Zheng et al., 1991. It is important to note that Weber and colleagues averaged across V2-V5 due to similar vascularity across these areas. In our material, we also observed similar vascularity in these areas, though V5 (e.g., MT) has slightly denser vascularity, in agreement with reports of CO staining.
Additionally, we report similar GM/WM vascular density, and high vascular density in primary sensory areas. Unfortunately, available ground-truth data on vascularity does not provide further (general) validation data for laminar vasculature in macaques (such as those in cluster 1-3; Fig. 5). That said, we have provided substantial evidence linking whole-brain vascular measures with variations in neuron (for data distribution, see Supp. Fig. 6F) and receptor densities, which we believe provides strong support for our approach.
We would like to clarify that the authors do not assert that gradient-echo MRI is exclusively sensitive to microvessels and not macrovessels. This is not stated anywhere in the manuscript. If any sentence appears misleading, please let us know, and we will consider revising it. It is well-established that large vessels contribute to ΔR2* (Ogawa et al., 1993; Boxerman et al., 1995), and this is clearly stated in the manuscript (introduction, methods, results and discussion) and demonstrated in Figures 2A, B, and Supp. Figs. 2, 3, and 4. The primary concern, as the reviewer also noted, is whether we have sufficiently minimized the contribution of large vessels in our parcellated data analysis.
At the parcellated level, we used the median value to avoid skewness in the data distribution, which primarily arises from large vessels, as regions near these vessels exhibit higher ΔR2*. The skewness of ΔR2* is also visible in Figure 1F, G. While this approach mitigates this large-small vessel issue, it does not entirely resolve it, as a slight linear increase toward the cortical surface remains (in all parcels). This is likely due to our inability to delineate all penetrating vessels as shown in Figure 2E and because contrast agents cumulatively accumulate toward superficial layers where blood originates and returns to the pial surface. To mitigate this issue, we detrended across layers the parcellated profiles, obtaining results similar to the ground-truth measures of vascularity in V1-V5 and CO histology in V1.
(2) High-resolution MRI with a critical sampling frequency estimated from previous studies (Weber 2008, Zheng 1991) was performed to separate penetrating vessels, which is considered one of the major advancements in this study. However, this approach is still insufficient to accurately identify the number of vessels due to the blooming effects of susceptibility and insufficient spatial resolution. There was no detailed description of the detection criteria. More importantly, the number of observable penetrating vessels is dependent on imaging parameters and the dose of the contrast agent. If imaging slices were obtained in parallel to the cortex with higher in-plane resolution, it would likely improve the detection of penetrating vessels. Using higher-field MRI would further enhance the detection of penetrating vessels. Therefore, the reported value is only applicable to the experimental and processing conditions used in this study. Detailed selection criteria should be mentioned, and all potential pitfalls should be discussed.
We believe that Figure 2 represents a significant conceptual and data analysis advancement in the field of vascular imaging. To the best of our knowledge, this is the first MRI study attempting to assess vessel density across cortical layers and compare the number of vessels to the known ground-truth. While we do not claim to have achieved a perfect solution (as shown in Figure 2), we offer a robust challenge to the imaging community by introducing this novel benchmarking approach. Our hope is that this conceptual framework will inspire the MR imaging community to tackle this challenge.
Regarding imaging parameters, TE did not have much effect on our results, with a slight effect observed in the superficial layers due to the presence of large pial vessels (blooming effect; Fig. 2C). This also suggests that similar results could be achieved by changing the contrast agent dose, though there are, of course, CNR requirements and limitations at either end of the spectrum.
We completely agree with the reviewer that spatial resolution is critical in resolving the arterio-venous networks, and we have dedicated significant attention to this topic in the introduction, results and discussion sections. We also agree with the reviewer that if imaging slices were obtained in parallel to the cortex with higher in-plane resolution, it would improve the detection of vessels. However, while this approach is ideal for counting vessels in a single plane and isolated region of cortex, it is less suited to the surface mapping of vessels, which is the focus of our study.
Regarding the exclusion of vessels, based on visual comparison of vessels in volume space, Frangi-filter detection of vessels in volume space, and surface detection of vessels, we found no evidence to develop additional exclusion criteria (Supp. Fig. 3). On the contrary, we identified a number of false negatives in both the surface maps and volume maps. Notable exceptions to this rule seemed to occur at premotor areas F2 and F3 (Matelli et al., 1984; Patterns of cytochrome oxidase activity in the frontal agranular cortex of the macaque monkey). In these regions, we observed peculiar “pockets” of signal drop-out in equivolumetric layers 4-5. It is unclear what these signal-voids represent but it is interesting to note that these cortical areas F1-F5 were originally delineated by distinct CO+ positive large cells (Matelli et al., 1984).
(3) Attempts to obtain pial vascular structures were made (Figure 2). As mentioned in this manuscript, the blooming effect of susceptibility contrasts is problematic. In the MRI community, T1-based Gd contrast agents have been used for mapping large vasculature, which is a better approach for obtaining pial vascular structures. Alternatively, computer tomography with a blood contrast agent can be used for mapping blood vasculature noninvasively. This issue should be discussed.
We agree with the reviewer that T1-based contrast agents may offer more precise direct localization of large vessels in pial vasculature. However, the primary focus of our study was not on visualizing pial vascular structures, but rather on measuring vascular volume across cortical layers. For this purpose, we opted to use ferumoxytol, which provides superior T2*-contrast and about ten times longer plasma half-life compared to gadolinium. While we anticipated artifacts from the pial network, we developed a novel method to indirectly map these long-distance susceptibility artifacts arising from large vessels onto the cortical surface (Fig. 2A). If the goal would be to specifically visualize pial vessels, we applaud the high-resolution TOF angiography developed for direct vessel visualization (Bollman et al., 2022; https://doi.org/10.7554/eLife.71186)
Changes in text:
“4.1 Methodological considerations - vessel density informed MRI
While the pial vessels can be directly visualized using high-resolution time-of-flight MRI (Bollmann et al., 2022), and computed tomography (Starosolski et al., 2015), imaging of the dense vascularity within the large and highly convoluted primate gray matter presents other formidable challenges. Here, we used a combination of ferumoxytol contrast agent and cortical layer resolution 3D gradient-echo MRI to map cerebrovascular architecture in macaque monkeys. These methods allowed us to indirectly delineate large vessels and indirectly estimate translaminar variations in cortical microvasculature.”
(4) Since baseline R2* is related to baseline R2, vascular volume, iron content, and susceptibility gradients, it is difficult to correlate it with physiological parameters. Baseline R2* is also sensitive to imaging parameters; higher spatial resolution tends to result in lower R2* values (closer to the R2 value). Therefore, baseline R2* findings need to be emphasized.
We agree with the reviewer's comment on the complexity of correlating baseline R2* with vasculature, given its sensitivity to multiple factors such as venous oxygenation, iron content, and imaging parameters such as image resolution. While our study focuses on vascular measurements, one could also highlight iron’s role in brain energy metabolism. Deoxygenated blood affects R2*, iron in oligodendrocytes supports myelination and neuronal signaling, and iron’s role in cytochrome c oxidase during electron transport impacts mitochondrial energy production. These metabolic factors collectively affect baseline R2* and link it to vasculature. Though quantitative susceptibility mapping (QSM) could help differentiate these different factors, it is beyond the scope of this study.
(5) CBV-weighted deltaR2* is correlated with various other metrics (cytoarchitectural parcellation, myelin/receptor density, cortical thickness, CO, cell-type specificity, etc.). While testing the correlation between deltaR2* and these other metrics may be acceptable as an exploratory analysis, it is challenging for readers to discern a causal relationship between them. A critical question is whether CBV-weighted deltaR2* can provide insights into other metrics in diseased or abnormal brain states. If this is the case, then high-resolution deltaR2* will be useful. Please comment on this possibility.
We agree with the reviewer that correlation deltaR2* with other metrics, such as myelin and cortical thickness, receptors and interneuron types, remains exploratory. Establishing causal relationships requires advanced multivariate analysis across cortical layers, but mapping histological stains to cortical layers is still under development. While this exploratory approach is promising, the ability to apply these insights to diseased or abnormal brain states is not yet clear. Layer-specific analysis of vasculature and function in disease is a future goal, and ongoing work aims to expand this line of inquiry. For now, while high-resolution deltaR2* may indeed offer diagnostic potential, we prefer to refrain from overstating its clinical utility at this stage. We agree that multimodal studies integrating neuroanatomy, function, and vascular metrics will be valuable for deeper insights into brain abnormalities.
Changes in text:
“4.3 The vascular network architecture is intricately connected to the neuroanatomical organization within cerebral cortex
…To comprehensively understand the factors contributing to the vascular organization of the brain, experimental disentanglement through multivariate analysis of laminar cell types and receptor densities is needed (Hayashi et al., 2021, Froudist-Walsh et al., 2023).”
(6) There is no discussion about the deltaR2* difference across subcortical areas (Figure 1). This finding is intriguing and warrants a thorough discussion in the context of the cortical findings.
We thank the reviewer for this comment. We have expanded discussion on subcortical structures:
Section 4.3, 1st paragraph:
“In the cerebral cortex, neurons account for a significant portion (≈80-90%) of energy demand, with most of this energy allocated to signaling (≈80%) and maintaining membrane resting potentials (≈20%) (Attwell and Laughlin, 2001; Howarth et al., 2012). Since firing frequency is modulatory and the neural networks utilize distributed coding, the maintenance of resting-state membrane potential determines the minimal energy budget and the lower-limit for cerebral perfusion. Based on neuronal variability and energy dedicated to maintaining surface potential, this suggest an approximate (4 × 20% ≈) 80% variation in CBF and a resultant 25% variation in CBV across the cortex, in line with Grubbs' law (CBV = 0.80 × CBF0.38) (Grubb et al., 1974). In the cerebellar cortex, neuron density is higher, and the resting potentials are thought to account for more than 50% of energy usage (Howarth et al., 2012), aligning with its higher vascular volume compared to the cerebral cortex (Fig. 1F). However, this is a simplified estimation, and a more comprehensive assessment would need to account for consider an aggregate of biophysical factors such as…”
Section 4.3, 4th paragraph:
“When viewed in terms of information flow, CBV appear to decrease along the canonical circuit pathway (e.g., L4→L2/3→L5) in the primary visual cortex (Douglas and Martin, 2007) and as one ascends the hierarchy (e.g., V1→V2→V3&4→MT→7A) from primary sensory areas (Fig. 3F, Supp. Fig. 8) (Felleman and Van Essen et al., 1991, Markov et al., 2014). A similar pattern is observed in the auditory hierarchy, where the inferior colliculus, an early processing hub, exhibits the highest vascular volume, followed by a gradual reduction along cortical auditory ‘where’ and ‘what’ pathways (Fig. 1F, Fig. 3B).”
(7) Figure 3 is missing. Several statements in the manuscript require statistics (e.g., bimodality in Figure 2D, Figure 3F).
We apologize to the reviewer for the absence of Figure 3 in the initial submission.
As for statistical testing of bimodality, we respectfully disagree and feel that this would not add much value to the manuscript. We think a descriptive, rather than rigorous, approach is sufficient in this context.
Reviewer #2 (Public review):
Summary:
This manuscript presents a new approach for non-invasive, MRI-based measurements of cerebral blood volume (CBV). Here, the authors use ferumoxytol, a high-contrast agent, and apply specific sequences to infer CBV. The authors then move to statistically compare measured regional CBV with the known distribution of different types of neurons, markers of metabolic load, and others. While the presented methodology captures an estimated 30% of the vasculature, the authors corroborated previous findings regarding the lack of vascular compartmentalization around functional neuronal units in the primary visual cortex.
Strengths:
Non-invasive methodology geared to map vascular properties in vivo.
Implementation of a highly sensitive approach for measuring blood volume.
Ability to map vascular structural and functional vascular metrics to other types of published data.
Weaknesses:
The key issue here is the underlying assumption about the appropriate spatial sampling frequency needed to capture the architecture of the brain vasculature. Namely, ~7 penetrating vessels / mm2 as derived from Weber et al 2008 (Cer Cor). The cited work begins by characterizing the spacing of penetrating arteries and ascending veins using a vascular cast of 7 monkeys (Macaca mulatta, same as in the current paper). The ~7 penetrating vessels / mm2 are computed by dividing the total number of identified vessels by the area imaged. The problem here is that all measurements were made in a "non-volumetric" manner and only in V1. Extrapolating from here to the entire brain seems like an over-assumption, particularly given the region-dependent heterogeneity that the current paper reports.
Recommendations for the authors:
Reviewer #1 (Recommendations for the authors):
- For broader readership, it would be beneficial to provide a guide on how to interpret baseline R2* versus ΔR2*.
The text was edited as follows:
“…For quantitative assessment, R2* values were estimated from multi-echo gradient-echo images acquired both before and after the administration of ferumoxytol contrast agent (Table 1). Subsequently, the baseline R2* and ΔR2*, an indirect proxy measure of CBV (Boxerman et al., 1995), volume maps for each subject were mapped onto the twelve native equivolumetric layers (ELs) (Fig. 1C). Each vertex was then corrected for normal of the cortex relative to B0 direction (Supp. Fig. 1). Surface maps for each subject were registered onto a Mac25Rhesus average surface using cortical curvature landmarks and then averaged across the subjects (Fig. 1D, E). Around cortical midthickness, the distribution of R2*, an aggregate measure for ferritin-bound iron, myelin content and venous oxygenation levels (Langkammer et al., 2012), resembled the spatial pattern of ΔR2* vascular volume. However, across cortical layers, these measures exhibited reversed patterns: R2* increased toward the white matter surface, whereas ΔR2 decreased (Fig. 1E, G).”
- The legends in Figure 1 describe green/cyan arrows, which are not visible in the figure itself.
We thank the reviewer for noting this discrepancy. The reference to green/cyan arrows was removed from the Figure 1 legend.
- There are typos in Section 3.3: "(Figure 4A, E)" and "(cluster 3; Figure 3)" should be corrected to Figure 5.
We thank the reviewer for noting this error. The references to the Figures were corrected.
Reviewer #2 (Recommendations for the authors):
The work is elegantly presented and very easy to follow. The figures and the data presented there are compelling and well-organized. I have enjoyed reading the paper, despite my disagreement with the validity of the methodology presented.
Validation against MRA methods (high resolution needed here, Bolan et al 2006, cited also by the authors). Certainly, that work used a much higher magnetic field. This could be done through collaboration if such a magnet is not available. In my humble opinion, the current arguments provided in the paper as validation fall short in convincing future readers. Other TOF approaches might be better suited (in combination with line scanning or single plane sequences) for the 3T used in this work.
We appreciate the reviewer’s suggestion regarding time-of-flight (TOF) angiography at ultra-high magnetic fields, such as 9.4T for improved visualization of fast-flowing blood in arterial vessels, as elegantly demonstrated in Bolan et al., 2006. However, our focus was on mapping vasculature across cortical layers and TOF is not optimal for imaging slow capillary blood inflow. To enhance CNR also at capillary level, we used ferumoxytol-contrast agent to create quantitative CBV-weighted cortical layer maps (Boxerman et al., 1995).
We are open to collaborative opportunities to revisit this work using ultra-high magnetic field strengths and more detailed neuroanatomical ground-truth measures. However, the recommended line scanning or single-plane sequences, at least on first impression, seem inadequate for whole-brain coverage and cortical surface mapping.
Some of the methodology can be made more accessible to non-MRI readers. For example, a more elaborate explanation of R2* and ΔR2 could benefit future readers.
Elaborated as requested (see above reply).
A more detailed discussion of the limitations of the methodology could also be beneficial here. Explain the potential implications of under-sampling denser vascular areas (i.e. with potentially more than 7 penetrating vessels per mm2).
V1, with its highest neuronal density, likely also has the highest feeding/draining vessel density. Based on this, we hypothesized that a 0.23 mm isotropic image resolution would sufficiently capture cortical arterio-venous networks, but we did not achieve the expected detection of 7 penetrating vessels per mm2. Consequently, we refrained from quantifying vessel density in other areas, albeit we did report the total vessel count.
This under-sampling likely biases our ΔR2* estimates, skewing them toward larger vessels. To address this, we used median parcel values to avoid over-representing large vessels (the long-tail in ΔR2 parcels data distribution represents large vessels) and corrected for the cortical surface bias where blood originates from and returns to the pial network. These steps helped mitigate large vessel bias as described in the methods, results and discussion (see also our response to Reviewer #1, question #1).
To improve clarity for readers, we further clarified:
Methods:
“The effect of blood accumulation in large feeding arteries and draining veins toward in the superficial layers was estimated using linear model and regressed out from the parcellated ΔR2* maps.”
Results:
“To mitigate bias resulting from undersampling the large-caliber vessels (Fig. 2A, B), median parcel values were obtained and M132 parcellated ΔR2* profiles were then detrended across ELs in each subject and then averaged.”
Discussion:
“This methodology, however, has known limitations. First, gradient-echo imaging is more sensitized toward large pial vessels running along the cortical surface and large penetrating vessels, which could differentially bias the estimation of Δ R2* across cortical layers (Fig. 2A, 2B) (Boxermann et al., 1995; Zhao et al., 2006). Additionally, vessel orientation relative to the B0 direction introduce strong layer-specific biases in quantitative ΔR2* measurements (Supp. Fig. 1C) (Ogawa et al., 1993; Viessmann et al., 2019; Lauwers et al., 2008). To address these concerns, we conducted necessary corrections for B0-orientation, obtained parcel median values and regressed linear-trend thereby mitigating the effect of undersampling large-caliber vessels across ELs (Fig. 2C, Supp. Fig. 1).”
Please note, we are currently unable to create BALSA links to the figures due to maintenance issues at the data repository. As a result, we have opted to remove the links:
-
eLife assessment
This study presents valuable findings on the relative cerebral blood volume of non-human primates that move us closer to uncovering the functional and architectonic principles that govern the interplay between neuronal and vascular networks. The evidence of areal variations is solid, but that of vessel counting and laminar analysis is incomplete. The lack of a direct comparison of their approach against better-established MRI-based methods for measuring hemodynamics and vascular structure weakens the evidence provided in the current paper version. The work will be of interest to NHP imaging scientists.
-
Reviewer #1 (Public review):
Summary:
Audio et al. measured cerebral blood volume (CBV) across cortical areas and layers using high-resolution MRI with contrast agents in non-human primates. While the non-invasive CBV MRI methodology is often used to enhance fMRI sensitivity in NHPs, its application for baseline CBV measurement is rare due to the complexities of susceptibility contrast mechanisms. The authors determined the number of large vessels and the areal and laminar variations of CBV in NHP and compared those with various other metrics.
Strengths:
Non-invasive mapping of relative cerebral blood volume is novel for non-human primates. A key finding was the observation of variations in CBV across regions; primary sensory cortices had high CBV, whereas other higher areas had low CBV. The measured CBV values correlated with …
Reviewer #1 (Public review):
Summary:
Audio et al. measured cerebral blood volume (CBV) across cortical areas and layers using high-resolution MRI with contrast agents in non-human primates. While the non-invasive CBV MRI methodology is often used to enhance fMRI sensitivity in NHPs, its application for baseline CBV measurement is rare due to the complexities of susceptibility contrast mechanisms. The authors determined the number of large vessels and the areal and laminar variations of CBV in NHP and compared those with various other metrics.
Strengths:
Non-invasive mapping of relative cerebral blood volume is novel for non-human primates. A key finding was the observation of variations in CBV across regions; primary sensory cortices had high CBV, whereas other higher areas had low CBV. The measured CBV values correlated with previously reported neuronal and receptor densities.
Weaknesses:
A weakness of this manuscript is that the quantification of CBV with postprocessing approaches to remove susceptibility effects from pial and penetrating vessels, as well as orientation dependency, is not fully validated, especially on a laminar scale. Further specific comments follow.
(1) Baseline CBV indices were determined using contrast agent-enhanced MRI (deltaR2*). Although this approach is suitable for areal comparisons, its application on a laminar scale has not been validated in the literature or in this study. By comparing with histological vascular information of V1, the authors attempted to validate their approach. However, the generalization of their method is questionable. The main issue is whether the large vessel contribution is minimized by processing approaches properly in various cortical areas (such as clusters 1-3 in Figure 5). It would be beneficial to compare deltaR2* with deltaR2 induced by contrast agents in a few selected slices, as deltaR2 is supposed to be sensitive to microvessels, not macrovessels. Please discuss this issue.
(2) High-resolution MRI with a critical sampling frequency estimated from previous studies (Weber 2008, Zheng 1991) was performed to separate penetrating vessels, which is considered one of the major advancements in this study. However, this approach is still insufficient to accurately identify the number of vessels due to the blooming effects of susceptibility and insufficient spatial resolution. There was no detailed description of the detection criteria. More importantly, the number of observable penetrating vessels is dependent on imaging parameters and the dose of the contrast agent. If imaging slices were obtained in parallel to the cortex with higher in-plane resolution, it would likely improve the detection of penetrating vessels. Using higher-field MRI would further enhance the detection of penetrating vessels. Therefore, the reported value is only applicable to the experimental and processing conditions used in this study. Detailed selection criteria should be mentioned, and all potential pitfalls should be discussed.
(3) Attempts to obtain pial vascular structures were made (Figure 2). As mentioned in this manuscript, the blooming effect of susceptibility contrasts is problematic. In the MRI community, T1-based Gd contrast agents have been used for mapping large vasculature, which is a better approach for obtaining pial vascular structures. Alternatively, computer tomography with a blood contrast agent can be used for mapping blood vasculature noninvasively. This issue should be discussed.
(4) Since baseline R2* is related to baseline R2, vascular volume, iron content, and susceptibility gradients, it is difficult to correlate it with physiological parameters. Baseline R2* is also sensitive to imaging parameters; higher spatial resolution tends to result in lower R2* values (closer to the R2 value). Therefore, baseline R2* findings need to be emphasized.
(5) CBV-weighted deltaR2* is correlated with various other metrics (cytoarchitectural parcellation, myelin/receptor density, cortical thickness, CO, cell-type specificity, etc.). While testing the correlation between deltaR2* and these other metrics may be acceptable as an exploratory analysis, it is challenging for readers to discern a causal relationship between them. A critical question is whether CBV-weighted deltaR2* can provide insights into other metrics in diseased or abnormal brain states. If this is the case, then high-resolution deltaR2* will be useful. Please comment on this possibility.
(6) There is no discussion about the deltaR2* difference across subcortical areas (Figure 1). This finding is intriguing and warrants a thorough discussion in the context of the cortical findings.
(7) Figure 3 is missing. Several statements in the manuscript require statistics (e.g., bimodality in Figure 2D, Figure 3F).
-
Reviewer #2 (Public review):
Summary:
This manuscript presents a new approach for non-invasive, MRI-based measurements of cerebral blood volume (CBV). Here, the authors use ferumoxytol, a high-contrast agent, and apply specific sequences to infer CBV. The authors then move to statistically compare measured regional CBV with the known distribution of different types of neurons, markers of metabolic load, and others. While the presented methodology captures an estimated 30% of the vasculature, the authors corroborated previous findings regarding the lack of vascular compartmentalization around functional neuronal units in the primary visual cortex.
Strengths:
Non-invasive methodology geared to map vascular properties in vivo.
Implementation of a highly sensitive approach for measuring blood volume.
Ability to map vascular structural and …
Reviewer #2 (Public review):
Summary:
This manuscript presents a new approach for non-invasive, MRI-based measurements of cerebral blood volume (CBV). Here, the authors use ferumoxytol, a high-contrast agent, and apply specific sequences to infer CBV. The authors then move to statistically compare measured regional CBV with the known distribution of different types of neurons, markers of metabolic load, and others. While the presented methodology captures an estimated 30% of the vasculature, the authors corroborated previous findings regarding the lack of vascular compartmentalization around functional neuronal units in the primary visual cortex.
Strengths:
Non-invasive methodology geared to map vascular properties in vivo.
Implementation of a highly sensitive approach for measuring blood volume.
Ability to map vascular structural and functional vascular metrics to other types of published data.
Weaknesses:
The key issue here is the underlying assumption about the appropriate spatial sampling frequency needed to capture the architecture of the brain vasculature. Namely, ~7 penetrating vessels / mm2 as derived from Weber et al 2008 (Cer Cor). The cited work begins by characterizing the spacing of penetrating arteries and ascending veins using a vascular cast of 7 monkeys (Macaca mulatta, same as in the current paper). The ~7 penetrating vessels / mm2 are computed by dividing the total number of identified vessels by the area imaged. The problem here is that all measurements were made in a "non-volumetric" manner and only in V1. Extrapolating from here to the entire brain seems like an over-assumption, particularly given the region-dependent heterogeneity that the current paper reports.
-
-
