Major nuclear locales define nuclear genome organization and function beyond A and B compartments
Curation statements for this article:-
Curated by eLife

eLife Assessment
In this valuable study, the authors integrate several datasets to describe how the genome interacts with nuclear bodies across distinct cell types and in Lamin A and LBR knockout cells. They provide convincing evidence to support their claims and particularly find that specific genomic regions segregate relative to the equatorial plane of the cell when considering their interaction with various nuclear bodies.
This article has been Reviewed by the following groups
Discuss this preprint
Start a discussion What are Sciety discussions?Listed in
- Evaluated articles (eLife)
Abstract
Models of nuclear genome organization often propose a binary division into active versus inactive compartments yet typically overlook nuclear bodies. Here, we integrated analysis of sequencing and image-based data to compare genome organization in four human cell types relative to three different nuclear locales: the nuclear lamina, nuclear speckles, and nucleoli. Although gene expression correlates mostly with nuclear speckle proximity, DNA replication timing correlates with proximity to multiple nuclear locales. Speckle attachment regions emerge as DNA replication initiation zones whose replication timing and gene composition vary with their attachment frequency. Most facultative LADs retain a partially repressed state as iLADs, despite their positioning in the nuclear interior. Knock out of two lamina proteins, Lamin A and LBR, causes a shift of H3K9me3-enriched LADs from lamina to nucleolus, and a reciprocal relocation of H3K27me3-enriched partially repressed iLADs from nucleolus to lamina. Thus, these partially repressed iLADs appear to compete with LADs for nuclear lamina attachment with consequences for replication timing. The nuclear organization in adherent cells is polarized with nuclear bodies and genomic regions segregating both radially and relative to the equatorial plane. Together, our results underscore the importance of considering genome organization relative to nuclear locales for a more complete understanding of the spatial and functional organization of the human genome.
Article activity feed
-

-

eLife Assessment
In this valuable study, the authors integrate several datasets to describe how the genome interacts with nuclear bodies across distinct cell types and in Lamin A and LBR knockout cells. They provide convincing evidence to support their claims and particularly find that specific genomic regions segregate relative to the equatorial plane of the cell when considering their interaction with various nuclear bodies.
-
Reviewer #3 (Public review):
Summary:
Golamalamdari, van Schaik, Wang, Kumar Zhang, Zhang and colleagues study interactions between the speckle, nucleolus and lamina in multiple cell types (K562, H1, HCT116 and HFF). Their datasets define how interactions between the genome and the different nuclear landmarks relate to each other and change across cell types. They also identify how these relationships change in K562 cells in which LBR and LMNA are knocked out.
Strengths:
Overall, there are a number of datasets that are provided, and several "integrative" analyses performed. This is a major strength of the paper, and I imagine the datasets will be of use to the community to further probed and the relationships elucidated here further studied. An especially interesting result was that specific genomic regions (relative to their …
Reviewer #3 (Public review):
Summary:
Golamalamdari, van Schaik, Wang, Kumar Zhang, Zhang and colleagues study interactions between the speckle, nucleolus and lamina in multiple cell types (K562, H1, HCT116 and HFF). Their datasets define how interactions between the genome and the different nuclear landmarks relate to each other and change across cell types. They also identify how these relationships change in K562 cells in which LBR and LMNA are knocked out.
Strengths:
Overall, there are a number of datasets that are provided, and several "integrative" analyses performed. This is a major strength of the paper, and I imagine the datasets will be of use to the community to further probed and the relationships elucidated here further studied. An especially interesting result was that specific genomic regions (relative to their association with the speckle, lamina, and other molecular characteristics) segregate relative to the equatorial plane of the cell.
Weaknesses:
The experiments are primarily descriptive, and the cause-and-effect relationships are limited (though the authors do study the role of LMNA/LBR knockdown with their technologies).
Comments on revisions:
I have no additional comments. I appreciate the authors responding to my previous comments. I anticipate the datasets and concepts raised will be helpful to many investigators in the field.
-
Author response:
The following is the authors’ response to the previous reviews
Response to Public Reviews:
We would like to thank the reviewers and editors once more for their time and effort in reviewing our manuscript. Below we discuss specifically our response to the recommendations of Reviewer 2, which were the only substantial changes we made to the manuscript.
Reviewer 2 recommendation:
"My only remaining suggestion is that the authors acknowledge and cite the work of other groups which have similarly found different subsets of LADs based on various molecular/epigenetic features:
(1) doi.org/10.1101/2024.12.20.629719
(2) PMID: 25995381
(3) PMID: 36691074
(4) PMID: 23124521 (fLADs versus cLADs, as described by the authors themselves) The exact subtypes of LADs might be different based on the features examined, but others have …
Author response:
The following is the authors’ response to the previous reviews
Response to Public Reviews:
We would like to thank the reviewers and editors once more for their time and effort in reviewing our manuscript. Below we discuss specifically our response to the recommendations of Reviewer 2, which were the only substantial changes we made to the manuscript.
Reviewer 2 recommendation:
"My only remaining suggestion is that the authors acknowledge and cite the work of other groups which have similarly found different subsets of LADs based on various molecular/epigenetic features:
(1) doi.org/10.1101/2024.12.20.629719
(2) PMID: 25995381
(3) PMID: 36691074
(4) PMID: 23124521 (fLADs versus cLADs, as described by the authors themselves) The exact subtypes of LADs might be different based on the features examined, but others have found/implicated the existence of different types of LADs. Hence, the pwv-LAD should be contextualized within these findings (which they do relative to v-fiLADs)."
We thank the reviewer for this suggestion and for these references. We think that the best place to go into depth about how our work relates to these references would be in an appropriate review article.
However, we did read these references carefully and responded, as described below, by adding additional clarifying text in the manuscript as well as mention of articles specifically relevant to our description of our results.
(1) Reviewer 2 wrote specifically, "Hence, the pwv-LAD should be contextualized within these findings (which they do relative to v-fiLADs)"
We are not sure exactly what Reviewer 2 means here. In this manuscript we defined p-w-v iLADs, not LADs. So, it would be inappropriate to compare a subset of iLAD regions with different types of LADs.
If this was the meaning of Reviewer 2, then other readers might have similar confusion. Therefore, we added the following clarifying text in red:
"Several previous studies have used varying approaches to subdivide LADs further into distinct subsets of LADs with different biochemical and/or functional properties (Martin et al., 2024; Meuleman et al., 2013; Shah et al., 2023; Zheng et al., 2015). However, in this Section we focused instead on asking whether regions specifically within iLADs might show differential localization relative to the lamina and/or nucleoli and, if so, whether these regions would show different levels of gene expression. More specifically, analogously to how gene expression hot-zones appeared as local maxima in speckle TSA-seq with early DNA replication timing, we asked whether iLAD regions that appeared as local maxima in lamina proximity mapping signals would correspond to iLAD regions with locally reduced gene expression levels and later DNA replication timing relative to their flanking iLAD sequences. Our rationale was that these iLAD regions might represent chromatin domains that together with their flanking iLAD regions would typically localize well within the nuclear interior but in a fraction of the cell population would loop back and attach at the nuclear periphery."
(2) We also added the following text near the end of the section about p-w-v iLADs to place them in the context of one class of "LADs" identified by ChIP-seq rather than DamID. We use quotation marks since the approach used produced a segmentation that included a nearly 50/50 mix of iLAD and LAD regions, as identified by DamID, for this class of domains.
"We note that in a previous study a three-state Hidden Markov Model (HMM) segmented lamin B ChIP-seq data into two chromatin domain states with extensive overlap with LADs defined by lamina DamID (Shah et al., 2023). Whereas the late replicating, low gene density/expression "T1 LAD" state showed very high overlap (98%) with LADs defined by DamID, the intermediate replicating, intermediate gene expression "T2 LAD" state showed only 47% overlap with LADs defined by DamID. This was partly a result of the HMM segmentation algorithm but also due to substantial differences between the lamina ChIPseq versus DamID signals for reasons that remain unclear. The subset of p-w-v iLADs included in T2 comprise only a small percentage of the total T2 LAD coverage, which includes both other iLAD and LAD regions. Thus, the p-w-v iLADs we identified here represent a novel and distinct class of iLAD chromatin domains, not previously described."
(3) Alternatively, what Reviewer 2 might be suggesting implicitly is that we should start with the regions identified as p-w-v iLADs in one cell type and then identify all of those p-w-v iLADs which instead exist as LADs in a second cell type. Once we have identified their LAD equivalents in a second cell type we could then ask whether they possess special characteristics such that they correspond to a specific type of LAD subset. Finally, we could then ask how that specific type of LAD subset compared to the different subtypes of LADs identified by other groups and, in particular, the references Reviewer 2 provided.
We agree that would be an interesting future direction, but we consider that as outside the scope of this current manuscript. We note that we did no such analysis of the characteristics of LADs which existed as p-w-v iLADs in a different cell line. We save that for a possible future analysis, ideally in the same cell types as used in the cited references to allow a more direct comparison.
(4) Finally, we added text in the Discussion that relates our analysis of the differential SON and LMNB1 TSA-seq signals for different LAD regions, and how these correlate with different histone modifications, with results from the recent preprint cited by Reviewer 2. Note that we could not directly correlate our results from human cells with the three classes of LADs described in MEFs by this preprint.
"Fourth, we show how LAD regions showing different histone marks- either enriched in H3K9me3, H3K9me2 plus H2A.Z, H3K27me3, or none of these marks- can differentially segregate within nuclei. These results support the previous suggestion of different "flavors" of LAD regions, based on the sensitivity of the autonomous targeting of BAC transgenes to the lamina to different histone methyltransferases (Bian et al., 2013). Differential nuclear localization also was recently inferred by the appearance of different Hi-C Bsubcompartments, which similarly were differentially enriched in either H3K9m3, H3K27me3, or the combination of H3K9me2 and H2A.Z (Spracklin et al., 2023). More recently, and while this paper was in revision, a new study described segmenting mouse embryonic fibroblast LADs into three clusters using histone modification profiling (Martin et al., 2024). Interestingly, these three LAD clusters also most notably differed by their dominant enrichment of either H3K9me3, H3K9me2, or H3K27me3. Thus, three orthogonal approaches have converged on identifying different LAD regions showing differential enrichment either of H3K9me3, H3K9me2, or H3K27me3. Here, our use of TSA-seq directly measures and assigns the intranuclear localization of these different LAD regions to different nuclear locales."
-
-
-
eLife Assessment
In this valuable study, the authors integrate several datasets to describe how the genome interacts with nuclear bodies across distinct cell types and in Lamin A and LBR knockout cells. They provide convincing evidence to support their claims and particularly find that specific genomic regions segregate relative to the equatorial plane of the cell when considering their interaction with various nuclear bodies. The authors are encouraged to consider citing the relevant work of other labs who have shown the presence of different types of Lamin Associated Domains (LADs).
-
Reviewer #2 (Public review):
Summary:
Golamalamdari, van Schaik, Wang, Kumar Zhang, Zhang and colleagues study interactions between the speckle, nucleolus and lamina in multiple cell types (K562, H1, HCT116 and HFF). Their datasets define how interactions between the genome and the different nuclear landmarks relate to each other and change across cell types. They also identify how these relationships change in K562 cells in which LBR and LMNA are knocked out.
Strengths:
Overall, there are a number of datasets that are provided, and several "integrative" analyses performed. This is a major strength of the paper, and I imagine the datasets will be of use to the community to further probed and the relationships elucidated here further studied. An especially interesting result was that specific genomic regions (relative to their …
Reviewer #2 (Public review):
Summary:
Golamalamdari, van Schaik, Wang, Kumar Zhang, Zhang and colleagues study interactions between the speckle, nucleolus and lamina in multiple cell types (K562, H1, HCT116 and HFF). Their datasets define how interactions between the genome and the different nuclear landmarks relate to each other and change across cell types. They also identify how these relationships change in K562 cells in which LBR and LMNA are knocked out.
Strengths:
Overall, there are a number of datasets that are provided, and several "integrative" analyses performed. This is a major strength of the paper, and I imagine the datasets will be of use to the community to further probed and the relationships elucidated here further studied. An especially interesting result was that specific genomic regions (relative to their association with the speckle, lamina, and other molecular characteristics) segregate relative to the equatorial plane of the cell.
Weaknesses:
The experiments are primarily descriptive, and the cause-and-effect relationships are limited (though the authors do study the role of LMNA/LBR knockdown with their technologies).
-
Author response:
The following is the authors’ response to the original reviews.
eLife Assessment
(1) This is a valuable manuscript that successfully integrates several data sets to determine genomic interactions with nuclear bodies.
In this paper we both challenge and/or revise multiple long-standing “textbook” models of nuclear genome organization while also revealing new features of nuclear genome organization. Therefore, we argue that the contributions of this paper extend well beyond “valuable”. Specifically, these contributions include:
a. We challenge a several decades focus on the correlation of gene positioning relative to the nuclear lamina. Instead, through comparison of cell lines, we show a strong correlation of di4erences in gene activity with di4erences in relative distance to nuclear speckles in contrast to a very weak …
Author response:
The following is the authors’ response to the original reviews.
eLife Assessment
(1) This is a valuable manuscript that successfully integrates several data sets to determine genomic interactions with nuclear bodies.
In this paper we both challenge and/or revise multiple long-standing “textbook” models of nuclear genome organization while also revealing new features of nuclear genome organization. Therefore, we argue that the contributions of this paper extend well beyond “valuable”. Specifically, these contributions include:
a. We challenge a several decades focus on the correlation of gene positioning relative to the nuclear lamina. Instead, through comparison of cell lines, we show a strong correlation of di4erences in gene activity with di4erences in relative distance to nuclear speckles in contrast to a very weak correlation with di4erences in relative distance to the nuclear lamina. This inference of little correlation of gene expression with nuclear lamina association was supported by direct experimental manipulation of genome positioning relative to the nuclear lamina. Despite pronounced changes in relative distances to the nuclear lamina there was little change relative to nuclear speckles and little change in gene expression.
b. We similarly challenge the long-standing proposed functional correlation between the radial positioning of genes and gene expression. Here, and in a now published companion paper (doi.org/10.1038/s42003-024-06838-7), we demonstrate how nuclear speckle positioning relative to nucleoli and the nuclear lamina varies among cell types, as does the inverse relationship between genome positioning relative to nuclear speckles and the nuclear lamina. Again, this is consistent with the primary correlation of gene activity being the positioning of genes relative to nuclear speckles and also explains previous observations showing a strong relationship between radial position and gene expression only in some cell types.
c. We identified a new partially repressed, middle to late DNA replicating type of chromosome domain- “p-w-v fILADs”- by their weak interaction with the nuclear lamina, which, based on our LMNA/LBR KO experimental results, compete with LADs for nuclear lamina association. Moreover, we show that when fLADs convert to iLADs, most conversions are to this p-w-v fiLAD state, although ~ one third are to a normal, active, early replicating iLAD state. Thus, fLADs can convert between repressed, partially repressed, and active states, challenging the prevailing assumption of the division of the genome into two states – active, early replicating A compartment/iLAD regions versus inactive, late replicating, B compartment/LAD regions.
d. We identified nuclear speckle associated domains as DNA replication initiation zones, with the domains showing strongest nuclear speckle attachment initiating DNA replication earliest in S-phase.
e. We describe for the first time an overall polarization of nuclear genome organization in adherent cells with the most active, earliest replicating genomic regions located towards the equatorial plane and less expressed genomic regions towards the nuclear top or bottom surfaces. This includes polarization of some LAD regions to the nuclear lamina at the equatorial plane and other LAD regions to the top or bottom nuclear surfaces.
We have now rewritten the text to make the significance of these new findings clearer.
(2) Strength of evidence: The evidence supporting the central claims is varied in its strength ranging from solid to incomplete. Orthogonal evidence validating the novel methodologies with alternative approaches would better support the central claims.
We argue that our work exploited methods, data, and analyses equal to or more rigorous than the current state-of-the-art. This indeed includes orthogonal evidence using alternative methods which both supported our novel methodologies as well as demonstrating their robustness relative to more conventional approaches. This explains how we were able to challenge/revise long-standing models and discover new features of nuclear genome organization. More specifically:
a. Unlike most previous analyses, we have integrated both genomic and imaging approaches to examine the nuclear genome organization relative to not one, but several di4erent nuclear locales and we have done this across several cell types. To our knowledge, this is the first such integrated approach and has been key to our success in appreciating new features of nuclear genome organization.
b. The 16-fraction DNA replication Repli-seq data we developed and applied to this project represents the highest temporal mapping of DNA replication timing to date.
c. The TSA-seq approach that we used remains the most accurate sequence-based method for estimating microscopic distance of chromosome regions to di4erent nuclear locales. As implemented, this method is unusually robust and direct as it exploits the exponential micron-scale gradient established by the di4usion of the free-radicals generated by peroxidase labeling to measure relative distances of chromosome regions to labeled nuclear locales. We had previously demonstrated that TSA-seq was able to estimate the average distances of genomic regions to nuclear speckles with an accuracy of ~50 nm, as validated by light microscopy. The TSA-seq 2.0 protocol we developed and applied to this project maintained the original resolution of TSA-seq to estimate to an accuracy of ~50 nm the average distances of genomic regions from nuclear speckles, as validated by light microscopy, while achieving more than a 10-fold reduction in the required number of cells.
We have rewritten the text to address the reviewer concerns that led them to their initial characterization of the TSA-seq as novel and not yet validated.
First, we have added a discussion of how the use of nuclear speckle TSA-seq as a “cytological ruler” was based on an extensive initial characterization of TSA-seq as described in previous published literature. In that previous literature we showed how the conventional molecular proximity method, ChIP-seq, instead showed local accumulation of the same marker proteins over short DNA regions unrelated to speckle distances. Second, we reference our companion paper, now published, and describe how the extension of TSA-seq to measure relative distances to nucleoli was further validated and shown to be robust by comparison to NAD-seq and extensive multiplexed immuno-FISH data. We further discuss how in the same companion paper we show how nucleolar DamID instead was inconsistent with both the NAD-seq and multiplexed immuno-FISH data as well as the nucleolar TSA-seq.
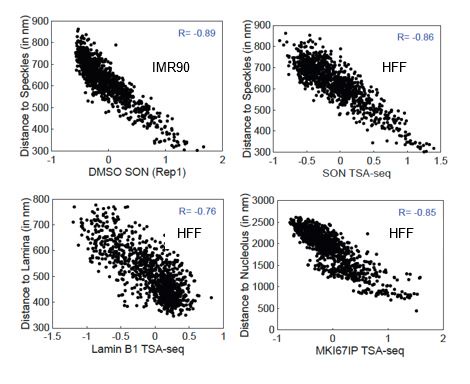
Third, we have added scatterplots showing exactly how highly the estimated microscopic distances to all three nuclear locales, measured in IMR90 fibroblasts, correlate with the TSA-seq measurements in HFF fibroblasts. This addresses the concern that we were not using the exact same fibroblast cell line for the TSA-seq versus microscopic measurements. The strong correlation already observed would only be expected to become even stronger with use of the exact same fibroblast cell lines for both measurements.
Fourth, we have addressed the reviewer concern that the nuclear lamin TSA-seq was not properly validated because it did not match nuclear lamin Dam-ID. We have now added to the text a more complete explanation of how microscopic proximity assays such as TSA-seq measure something di4erent from molecular proximity assays such as DamID or NAD-seq. We have added further explanation of how TSA-seq complements molecular proximity assays such as DamID and NAD-seq, allowing us to extract further information than either measurement alone. We also briefly discuss why TSA-seq succeeds for certain nuclear locales using multiple independent markers whereas molecular proximity assays may fail against the same nuclear locales using the same markers. This includes brief discussion from our own experience attempting unsuccessfully to use DamID against nucleoli and nuclear speckles.
Reviewer #1 (Public Review):
(1) The weakness of this study lies in the fact that many of the genomic datasets originated from novel methods that were not validated with orthogonal approaches, such as DNAFISH. Therefore, the detailed correlations described in this work are based on methodologies whose efficacy is not clearly established. Specifically, the authors utilized two modified protocols of TSA-seq for the detection of NADs (MKI67IP TSA-seq) and LADs (LMNB1-TSA-seq).
We disagree with the statement that the TSA-seq approach and data has not been validated by orthogonal approaches. We have now addressed this point in the revised manuscript text:
a) We added text to describe how previously FISH was used to validate speckle TSA-seq by demonstrating a residual of ~50 nm between the TSA-seq predicted distance to speckles and the distance measured by light microscopy using FISH:
"In contrast, TSA-seq measures relative distances to targets on a microscopic scale corresponding to 100s of nm to ~ 1 micron based on the measured diffusion radius of tyramide-biotin free-radicals (Chen et al., 2018). Exploiting the measured exponential decay of the tyramide-biotin free-radical concentration, we showed how the mean distance of chromosomes to nuclear speckles could be estimated from the TSA-seq data to an accuracy of ~50 nm, as validated by FISH (Chen et al., 2018)."
b) We note that we also previously have validated lamina (Chen et al, JCB 2018) and nucleolar (Kumar et al, 2024) TSA-seq and further validated speckle TSA-seq (Zhang et al, Genome Research 2021) by traditional immuno-FISH and/or immunostaining. The overall high correlation between lamina TSA-seq and the orthogonal lamina DamID method was also extensively discussed in the first TSA-seq paper (Chen et al, JCB 2018). Included in this discussion was description of how the di4erences between lamina TSA-seq and DamID were expected, given that DamID produces a signal more proportional to contact frequency, and independent of distance from the nuclear lamina, whereas TSA-seq produces a signal that is a function of microscopic distance from the lamina, as validated by traditional FISH.
c) We added text to describe how the nucleolar TSA-seq previously was validated by two orthogonal methods- NAD-seq and multiplexed DNA immuno-FISH:
"We successfully developed nucleolar TSA-seq, which we extensively validated using comparisons with two different orthogonal genome-wide approaches (Kumar et al., 2024)- NAD-seq, based on the biochemical isolation of nucleoli, and previously published direct microscopic measurements using highly multiplexed immuno-FISH (Su et al., 2020)."
d) We have now added panels A&B to Fig. 7 and a new Supplementary Fig. 7 demonstrating further validation of TSA-seq based on showing the high correlation between the microscopically measured distances of many hundreds of genomic sites across the genome from di4erent nuclear locales and TSA-seq scores. As discussed in response #2 below, we have used comparison of distances measured in IMR90 fibroblasts with TSA-seq scores measured in HFF fibroblasts. We would argue therefore that these correlations are a lower estimate and therefore the correlation between microscopic distances and TSAseq scores would likely have been still higher if we had performed both assays in the exact same cell line.
(2) Although these methods have been described in a bioRxiv manuscript by Kumar et al., they have not yet been published. Moreover, and surprisingly, Kumar et al., work is not cited in the current manuscript, despite its use of all TSA-seq data for NADs and LADs across the four cell lines.
The Kumar et al, Communications Biology, 2024 paper is now published and is cited properly in our revision. We apologize for this oversight and confusion our initial omission of this citation may have created. We had been writing this manuscript and the Kumar et al manuscript in parallel and had intended to co-submit. We planned to cross-reference the two at the time we co-submitted, adding the Kumar et al reference to the first version of this manuscript once we obtained a doi from bioRxiv. But we then submitted the Kumar et al manuscript several months earlier, but meanwhile forgot that we had not added the reference to our first manuscript version.
(3) Moreover, Kumar et al. did not provide any DNA-FISH validation for their methods.
As we described in our response to Reviewer 1's comment #1, we had previously provided traditional FISH validation of lamina TSA-seq in our first TSA- seq paper as well as validation by comparison with lamina DamID (Chen et al, 2018).
We also described how the nucleolar TSA-seq was extensively cross-validated in the Kumar et al, 2024 paper by both NAD-seq and the highly multiplexed immuno-FISH data from Su et al, 2020).
We note additionally that in the Kumar et al, 2024 paper the nucleolar TSA-seq was additionally validated by correlating the predicted variations in centromeric association with nucleoli across the four cell lines predicted by nucleolar TSA-seq with the variations observed by traditional immunofluorescence microscopy.
(4) Therefore, the interesting correlations described in this work are not based on robust technologies.
This comment was made in reference to the Kumar et al paper not having been published, and, as noted in responses to points #2 and #3, the paper is now published.
But we wanted to specifically note, however, that our experience is that TSA-seq has proven remarkably robust in comparison to molecular proximity assays. We've described in our responses to the previous points how TSA-seq has been cross-validated by both microscopy and by comparison with lamina DamID and nucleolar NAD-seq. We note also that in every application of TSA-seq to date, all antibodies that produced good immunostaining showed good TSA-seq results. Moreover, we obtained nearly identical results in every case in which we performed TSA-seq with different antibodies against the same target. Thus anti-SON and antiSC35 staining produced very similar speckle TSA-seq data (Chen et al, 2018), anti-lamin A and anti-lamin B staining produced very similar lamina TSA-seq data (Chen et al, 2018), antinucleolin and anti-POL1RE staining produced very similar DFC/FC nucleolar TSA-seq data (Kumar et al, 2024), and anti-MKI67IP and anti-DDX18 staining produced very similar GC nucleolar TSA-seq data (Kumar et al, 2024).
This independence of results with TSA-seq to the particular antibody chosen to label a target differs from experience with methods such as ChIP, DamID, and Cut and Run/Tag in which results can differ or be skewed based on variable distance and therefore reactivity of target proteins from the DNA or due to other factors such as non-specific binding during pulldown (ChIP) or differential extraction by salt washes (Cut and Tag).
Our experience in every case to date is that antibodies that produce similar immunofluorescence staining produce similar TSA-seq results. We attribute this robustness to the fact that TSA-seq is based only on the original immunostaining specificity provided by the primary and secondary antibodies plus the diffusion properties of the tyramide-free radical.
We've now added the following text to our revised manuscript:
"As previously demonstrated for both SON and lamin TSA-seq (Chen et al., 2018), nucleolar TSA-seq was also robust in the sense that multiple target proteins showing similar nucleolar staining showed similar TSA-seq results (Kumar et al., 2024); this robustness is intrinsic to TSA-seq being a microscopic rather than molecular proximity assay, and therefore not sensitive to the exact molecular binding partners and molecular distance of the target proteins to the DNA."
(5) An attempt to validate the data was made for SON-TSA-seq of human foreskin fibroblasts (HFF) using multiplexed FISH data from IMR90 fibroblasts (from the lung) by the Zhuang lab (Su et al., 2020). However, the comparability of these datasets is questionable. It might have been more reasonable for the authors to conduct their analyses in IMR90 cells, thereby allowing them to utilize MERFISH data for validating the TSA-seq method and also for mapping NADs and LADs.
We disagree with the reviewer's overall assessment that that the use of the IMR90 data to further validate the TSA-seq is questionable because the TSA-seq data from HFF fibroblasts is not necessarily comparable with multiplexed immuno-FISH microscopic distances measured in IMR90 fibroblasts.
In response we have now added panels to Fig. 7 and Supplementary Fig. 7, showing:
a) There is very little di4erence in correlation between speckle TSA-seq and measured distances from speckles in IMR90 cells whether we use IMR90 or HFF cells SON TSA-seq data (R2 = 0.81 versus 0.76) (new Fig. 7A).
b) There is also a high correlation between lamina (R2 = 0.62) and nucleolar (R2 = 0.73) HFF TSA-seq and measured distances in IMR90 cells. Thus, we conclude that this high correlation shows that the multiplexed data from ~1000 genomic locations does validate the TSA-seq. These correlations should be considered lower bounds on what we would have measured using IMR90 TSA-seq data. Thus, the true correlation between distances of loci from nuclear locales and TSA-seq would be expected to be either comparable or even stronger than what we are seeing with the IMR90 versus HFF fibroblast comparisons.
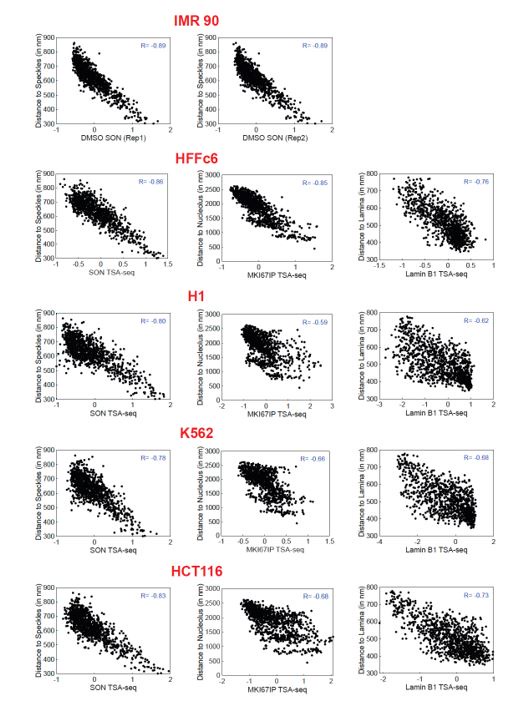
c) This correlation is cell-type specific (Fig. 7B, new SFig. 7). Thus, even for speckle TSAseq, highly conserved between cell types, the highest correlation of IMR90 distances with speckle TSA-seq is with IMR90 and HFF fibroblast data. For lamina and nucleolar TSA-seq, which show much lower conservation between cell types, the correlation of IMR90 distances is high for HFF data but much lower for data from the other cell types. This further justifies the use of IMR90 fibroblast distance measurements as a proxy for HFF fibroblast measurements.
Thus, we have added the following text to the revised manuscript:
"We reasoned that the nuclear genome organization in the two human fibroblast cell lines would be sufficiently similar to justify using IMR90 multiplexed FISH data [43] as a proxy for our analysis of HFF TSA-seq data. Indeed, the high inverse correlation (R= -0.86) of distances to speckles measured by MERFISH in IMR90 cells with HFF SON TSA-seq scores is nearly identical to the inverse correlation (R= -0.89) measured instead using IMR90 SON TSA-seq scores (Fig. 7A). Similarly, distances to the nuclear lamina and nucleoli show high inverse correlations with lamina and nucleolar TSA-seq, respectively (Fig. 7A). These correlations were cell type specific, particularly for the lamina and nucleolar distance correlations, as these correlations were reduced if we used TSA-seq data from other cell types (SFig. 7A). Therefore, the high correlation between IMR90 microscopic distances and HFF TSA-seq scores can be considered a lower bound on the likely true correlation, justifying the use of IMR90 as a proxy for HFF for testing our predictions."
Reviewer #2 (Public Review):
Weaknesses:
(1) The experiments are largely descriptive, and it is difficult to draw many cause-andeffect relationships...The study would benefit from a clear and specific hypothesis.
This study was hypothesis-generating rather than hypothesis-testing in its goal. Our research was funded through the NIH 4D-Nucleome Consortium, which had as its initial goal the development, benchmarking, and validation of new genomic technologies. Our Center focused on the mapping of the genome relative to different nuclear locales and the correlation of this intranuclear positioning of the genome with functions- specifically gene expression and DNA replication timing. By its very nature, this project took a discovery-driven versus hypothesis-driven scientific approach. Our question fundamentally was whether we could gain new insights into nuclear genome organization through the integration of genomic and microscopic measurements of chromosome positioning relative to multiple different nuclear compartments/bodies and their correlation with functional assays such as RNA-seq and Repliseq.
Indeed, this study resulted in multiple new insights into nuclear genome organization as summarized in our last main figure. We believe our work and conclusions will be of general interest to scientists working in the fields of 3D genome organization and nuclear cell biology. We anticipate that each of these new insights will prompt future hypothesis-driven science focused on specific questions and the testing of cause-and-effect relationships.
However, we do want to point out that our comparison of wild-type K562 cells with the LMNA/LBR double knockout was designed to test the long-standing model that nuclear lamina association of genomic loci contributes to gene silencing. This experiment was motivated by our surprising result that gene expression differences between cell lines correlated strongly with differences in positioning relative to nuclear speckles rather than the nuclear lamina. Despite documenting in these double knockout cells a decreased nuclear lamina association of most LADs, and an increased nuclear lamina association of the “p-w-v” fiLADs identified in this manuscript, we saw no significant change in gene expression in any of these regions as compared to wild-type K562 cells. Meanwhile, distances to nuclear speckles as measured by TSA-seq remained nearly constant.
We would argue that this represents a specific example in which new insights generated by our genomics comparison of cell lines led to a clear and specific hypothesis and the experimental testing of this hypothesis.
(2) Similarly, the paper would be very much strengthened if the authors provided additional summary statements and interpretation of their results (especially for those not as familiar with 3D genome organization).
We appreciate this feedback and agree with the reviewer that this would be useful, especially for those not familiar with previous work in the field of 3D genome organization. In an earlier draft, we had included additional summary and interpretation statements in both the Introduction and Results sections. At the start of each Results section, we had also previously included brief discussion of what was known before and the context for the subsequent analysis contained in that section. However, we had thought we might be submitting to a journal with specific word limits and had significantly cut out that text.
We have now restored this text and, in certain cases, added additional explanations and context.
Recommendations for the authors:
Reviewer #1 (Recommendations For The Authors):
Figures 1C and D. Please add the units at the values of each y-axis.
We have done that.
The representation of Figure 2C lacks clarity and is diJicult to understand. The x-axis labeling regarding the gene fraction number needs clarification.
We've modified the text to the Fig. 2C legend: "Fraction of genes showing significant di=erence in relative positioning to nuclear speckles (gene fraction, x-axis) versus log2 (HFF FKPM / H1 FKPM) (y-axis);"
"We next used live-cell imaging to corroborate that chromosome regions close to nuclear speckles, primarily Type I peaks, would show the earliest DNA replication timing." This sentence requires modification as Supplementary Figure 3F does not demonstrate that Type I peaks exhibit the earliest DNA replication timing; it only indicates that the first PCNA foci in S-phase are in proximity to nuclear speckles.
We've modified the text to: "We next used live-cell imaging to show that chromosome regions close to nuclear speckles show the earliest DNA replication timing; this is consistent with the earliest firing DNA replication IZs, as determined by Repli-seq, aligning with Type 1 peaks that are closely associated with nuclear speckles."
In Figure 5, the authors employed LaminB1-DamID to quantify LADs in LBR-KO and LMNA/LBR-DKO K562 cells. These are interesting results. However, for these experiments, it is crucial to assess LMNB1 signal at the nuclear periphery via immunofluorescence (IF) to confirm the absence of changes, ensuring that the DamID signal solely reflects contacts with the nuclear lamina. Furthermore, in this instance, their findings should be validated through DNA-FISH.
Immunostaining of LMNB1 was performed and showed a normal staining pattern as a ring adjacent to the nuclear periphery. Images of this staining were included in the metadata tied to the sequencing data sets deposited on the 4D Nucleome Data portal. We thank the reviewer for bringing up this point, and have added a sentence mentioning this result in the Results Section:
"Immunostaining against LMNB1 revealed the normal ring of staining around the nuclear periphery seen in wt cells (images deposited as metadata in the deposited sequencing data sets)."
Because both TSA-seq and DamID have been extensively validated by FISH, as detailed in our previous responses to the public reviewer comments, we feel it is unnecessary to validate these findings by FISH.
p-w-v-fiLADs should be labelled in Figure 5B.
We've added labeling as suggested.
"The consistent trend of slightly later DNA replication timing for regions (primarily p-w-v fiLADs) moving closer to the lamina" is not visible in the representation of the data of Figure 5G.
We did not make a change as we believed this trend was apparent in the Figure.
To reduce the descriptive nature of the data, it would be pertinent to conduct H3K9me3 and H3K27me3 ChIP-seq analyses in both the parental and DKO mutant cells. This would elucidate whether p-w-v-fiLADs and NADs anchoring to the nuclear lamina undergo changes in their histone modification profile.
We believe further analysis of the reasons underlying these shifts in positioning, including such ChIP-seq or equivalent analysis, is of interest but beyond the scope of this publication. We see such measurements as the beginning of a new story but insuJicient alone to determine mechanism. Therefore we believe such experiments should be part of that future study.
The description of Figure 7 lacks clarity. Additionally, it appears that TSA-seq for NADs and LADs may not be universally applicable across all cell types, particularly in flat cells, whereas DamID scores demonstrate less variation across cell lines, as also stated by the authors.
TSA-seq is a complement to rather than a replacement for either DamID or NAD-seq. TSAseq reports on microscopic distances whereas both DamID and NAD-seq instead are more proportional to contact frequency with the nuclear lamina or nucleoli, respectively, and insensitive to distances of loci away from the lamina or nucleoli. Thus, TSA-seq provides additional information based on the intrinsic diJerences in what TSA-seq measures relative to molecular proximity methods such as DamID or NAD-seq. The entire point is that the convolution of the exponential point-spread-function of the TSA-seq with the shape of the nuclear periphery allows us to distinguish genomic regions in the equatorial plane versus the top and bottom of the nuclei. The TSA-seq is therefore highly "applicable" when properly interpreted in discerning new features of genome organization. As we stated in the revised manuscript, the lamina DamID and TSA-seq are complementary and provide more information together then either method along. The same is true for the NAD-seq and nucleolar TSA-seq comparison, as described in more detail in the Kumar, et al, 2024 paper.
Introduction:
The list of methodologies for mapping genomic contacts with nucleoli (NADs) should also include recent technologies, such as Nucleolar-DamID (Bersaglieri et al., PMID: 35304483), which has been validated through DNA-FISH.
We did not include nucleolar DamID in the mention in the Introduction of methods for identifying diJerential lamina versus nucleolar interactions of heterochromatin- either from our own collaborative group or from the cited reference- because we did not have confidence in the accuracy of this method in identifying NADs. In the case of the published nucleolar DamID from our collaborative group, published in Wang et al, 2021, we later discovered that despite apparent agreement of the nucleolar DamID with a small number of published FISH localization the overall correlation of the nucleolar DamID with nucleolar localization was poor. As described in detail in the Kumar et al, 2024 publication, this poor correlation of the nucleolar DamID was established using three orthogonal methods- nucleolar TSA-seq, NAD-seq, and multiplexed immuno-FISH measurements from ~1000 genomic locations. Instead, we found that this nucleolar DamID showed high correlation with lamina DamID. We note that many strong NADs are also LADs, which we think is why validation with only several FISH probes is inadequate to demonstrate overall validation of the approach.
We could not compare our nucleolar-DamID data in human cells with the alternative nucleolar-DamID results cited by the reviewer which were performed in mouse cells. We note that in this paper the nucleolar DamID FISH validation only included several putative NAD chromosome regions and, I believe, one LAD region. However, our initial comparison of the nucleolar DamID cited by the reviewer with unpublished TSA-seq data from mouse ESCs produced by the Belmont laboratory and with NAD-seq data from the Kaufman laboratory shows a similar lack of correlation of the nucleolar DamID signal with nucleolar TSA-seq and NAD-seq, as well as multiplexed immuno-FISH data from the Long Cai laboratory, as we saw in our analysis of own nucleolar DamID data in human cells.
We have added explanation concerning the lack of correlation of our nucleolar DamID with orthogonal measurements of nucleolar proximity in the added text (below) to our revised manuscript:
"Nucleolar DamID instead showed broad positive peaks over large chromatin domains, largely overlapping with LADs mapped by LMNB1 DamID (Wang et al., 2021). However, this nucleolar DamID signal, while strongly correlated with lamin DamID, showed poor correlation with either NAD-seq or nucleolar distances mapped by multiplexed immunoFISH (Kumar et al., 2024). We suspect the problem is that with molecular proximity assays the output signals are disproportionally dominated by the small fraction of target proteins juxtaposed in su=icient proximity to the DNA to produce a signal rather than the amount of protein concentrated in the target nuclear body. "
Our mention of nucleolar TSA-seq was in the context of why we focused on nucleolar TSAseq and excluded our own nucleolar DamID. We chose not to discuss the second nucleolar DamID method cited above 1) because it was not appropriate to our discussion of our own experimental approach and 2) also because we cannot yet make a definitive statement of its accuracy for nucleolar mapping.
Reviewer #2 (Recommendations For The Authors):
(1) The authors start the manuscript by describing the 'radial genome organization' model and contrast it with the 'binary model' of genome organization. It would be helpful for the authors to contextualize their results a bit more with regard to these two diJerent models in the discussion.
We have added several sentences in the first paragraph of the Discussion to accomplish this contextualization. The new paragraph reads:
"Here we integrated imaging with both spatial (DamID, TSA-seq) and functional (Repli-seq, RNA-seq) genomic readouts across four human cell lines. Overall, our results significantly extend previous nuclear genome organization models, while also demonstrating a cell-type dependent complexity of nuclear genome organization. Briefly, in contrast to the previous radial model of genome organization, we reveal a primary correlation of gene expression with relative distances to nuclear speckles rather than radial position. Additionally, beyond a correlation of nuclear genome organization with radial position, in cells with flat nuclei we show a pronounced correlation of nuclear genome organization with distance from the equatorial plane. In contrast to previous binary models of genome organization, we describe how both iLAD / A compartment and LAD / B compartment contain within them smaller chromosome regions with distinct biochemical and/or functional properties that segregate di=erentially with respect to relative distances to nuclear locales and geometry."
(2) Data should be provided demonstrating KO of LBR and LMNA - immunoblotting for both proteins would be one approach. In addition, it would be helpful to provide additional nuclear morphology measurements of the DKO cells (volume, surface area, volume of speckles/nucleoli, number of speckles/nucleoli).
We've added additional description describing the generation and validation of the KO lines:
"To create LMNA and LBR knockout (KO) lines and the LMNA/LBR double knockout (DKO) line, we started with a parental "wt" K562 cell line, clone #17, expressing an inducible form of Cas9 (Brinkman et al., 2018). The single KO and DKO were generated by CRISPR-mediated frameshift mutation according to the procedure described previously (Schep et al., 2021). The "wt" K562 clone #17 was used for comparison with the KO clones.
The LBR KO clone, K562 LBR-KO #19, was generated, using the LBR2 oligonucleotide GCCGATGGTGAAGTGGTAAG to produce the gRNA, and validated previously, using TIDE (Brinkman et al., 2014) to check for frameshifts in all alleles as described elsewhere (Schep et al., 2021). The LMNA/LBR DKO, K562 LBR-LMNA DKO #14, was made similarly, starting with the LBR KO line and using the combination of two oligonucleotides to produce gRNAs:
LMNA-KO1: ACTGAGAGCAGTGCTCAGTG, LMNA-KO2: TCTCAGTGAGAAGCGCACGC.
Additionally, the LMNA KO line, K562 LMNA-KO #14, was made the same way but starting with the "wt" K562 cell line. Validation was as described above; additionally, for the new LMNA KO and LMNA/LBR DKO lines, immunostaining showed the absence of anti-LMNA antibody signal under confocal imaging conditions used to visualize the wt LMNA staining while the RNA-seq from these clones revealed an ~20-fold reduction in LMNA RNA reads relative to the wt K562 clone."
As suggested, we also added morphological data for the DKO line in a modified SFig.5.
(3) The rationale for using LMNB1 TSA-seq and LMNB1 DAMID is not immediately clear. The LMNB1 TSA-seq is more variable across cell types and replicates than the DAMID. Could the authors please compare the datasets a bit more to understand the diJerences? For example, the authors demonstrate that "40-70% of the genome shows statistically significant diJerences in Lamina TSA-seq over regions 100 kb or larger, with most of these regions showing little or no diJerences in speckle TSA-seq scores." If the LMNB1 DAMID data is used for this analysis or Figure 2D, is the same conclusion reached? Also, in Figure 6, the authors conclude that C1 and C3 LAD regions are enriched for constitutive LADs, while C2 and C4 LAD regions are fLADs. This is a bit surprising because the authors and others have previously shown that constitutive LADs have higher LMNB1 contact frequency than facultative LADs (Kind, et al Cell 2015, Figure 3C).
Indeed, in the first TSA-seq paper (Chen et al, 2018) we did observe that cLADs had the highest LMNB TSA-seq scores; this was for K562 cells with round nuclei in which there is therefore no diJerence in lamina TSA-seq scores produced by nuclear shape over the entire nucleus.
However, there are diJerences between TSA-seq and DamID in terms of what they measure and we refer the reviewer to the first TSA-seq paper (Chen et al, 2018) that explains in greater depth these diJerences. This first paper explains how DamID is indeed related to contact frequency but how the TSA-seq instead estimates mean distances from the target, in this case the nuclear lamina. This is because the diJusion of tyramide free radicals from the site of their constant HRP production produces an exponential decay gradient of tyramide free radical concentration at steady state.
We have summarized these diJerences in in text we have added to introduce both DamID and TSA-seq in the second Results section:
"DamID is a well-established molecular proximity assay; DamID applied to the nuclear lamina divides the genome into lamina-associated domains (LADs) versus nonassociated “inter-LADs” or “iLADs” (Guelen et al., 2008; van Steensel and Belmont, 2017). In contrast, TSA-seq measures relative distances to targets on a microscopic scale corresponding to 100s of nm to ~ 1 micron based on the measured diJusion radius of tyramide-biotin free-radicals (Chen et al., 2018)... While LMNB1 DamID segments LADs most accurately, lamin TSA-seq provides distance information not provided by DamID- for example, variations in relative distances to the nuclear lamina of diJerent iLADs and iLAD regions. These diJerences between the LMNB1 DamID and LMNB TSA-seq signals are also crucial to a computational approach, SPIN, that segments the genome into multiple states based on their varying nuclear localization, including biochemically and functionally distinct lamina-associated versus near-lamina states (Consortium et al., 2024; Wang et al., 2021).
Thus, lamin DamID and TSA-seq complement each other, providing more information together than either one separately."
We note that these diJerences in lamina DamID and TSA-seq are crucial to being able to gain additional information by comparing variations in the lamina TSA-seq for LADs in Figs. 6&7. See our response to point (4) below, for further explanation.
(4) In 7B/C, the authors show that the highest LMNB1 regions in HFF are equator of IMR90s. However, in Figure 7G, their cLAD score indicates that constitutive LADs are not at the equator. This is a bit surprising given the point above and raises the possibility that SON signals (as opposed to LMNB1 signals) might be more responsible for correlation to localization relative to the equator. Hence, it might be helpful if the authors repeat the analyses in Figures 7B/C in regions with diJering LMNB1 signals but similar SON signals (and vice versa).
Again, this is based on the apparent assumption by the reviewer that DamID and TSA-seq work the same way and measure the same thing. But as explained above in the previous point, this is not true.
In our first TSA-seq paper (Chen et al, 2018) we showed how we could use the exponential decay point-spread-function produced by TSA, measured directly by light microscopy, to convert sequencing reads from the TSA-seq into a predicted mean distance from nuclear speckles, approximated as point sources. These mean distances predicted from the SON TSA-seq data agreed with measured FISH distances to nuclear speckles to within ~50 nm for a set of DNA probes from diJerent chromosome regions. Moreover, varying TSA staining conditions changed the decay constants of this exponential decay, thus producing diJerences in the SON TSA-seq signals. By using these diJerent exponential decay functions to convert the TSA-seq scores from these independent data sets to estimated distances from nuclear speckles, we again observed a distance residual of ~50 nm; in this case though this distance residual of ~50 nm represented the mean residual observed genome-wide. This gives us great confidence that the TSA-seq is working as we have modeled it.
As we mentioned in our response to point 3 above, we did see the highest LMNB TSA-seq signal for cLADs in K562 cells with round nuclei (Chen et al, 2018).
But as we now show in our simulation performed in this paper for Fig. 7, the observed tyramide free radical exponential decay gradient convolved with the flat nuclear lamina shape produces a higher equatorial LMNB1 TSA-seq signal for LADs at the equatorial plane. We confirmed that LADs with this higher TSA-seq signal were enriched at the equatorial plane by mining the multiplexed IMR90 imaging data. Similar mining of the multiplexed FISH IMR90 data showed localization of cLADs away from the equatorial plane.
We are not clear about the rationale for what the reviewer is suggesting about SON signals "being more responsible for correlation to localization to the equator". We have provided an explanation for the higher lamina TSA-seq scores for LADs near the equator based on the measured spreading of the tyramide free radicals convolved with the eJect of the nuclear shape. This makes a prediction that the observed variation in lamina TSA-seq scores for LADs with similar DamID scores is related to their positioning relative to the equatorial plane as we then validated through our mining of the IMR90 multiplexed FISH data.
(5) FISH of individual LADs, v-fiLADs, and p-w-v-fiLADs relative to the lamina and speckle would be helpful to understand their relative positioning in control and LBR/LMNA double KO cells. This would significantly bolster the claim that "histone mark enrichments..more precisely revealed the diJerential spatial distribution of LAD regions...".
Adequately testing these predictions made from the lamina/SON TSA-seq scatterplots by direct FISH measurements would require measurements from large numbers of diJerent chromosome regions through a highly multiplexed immuno-FISH approach. We are not equipped currently in any of our laboratories to do such measurements and we leave this therefore for future studies.
Rather our statement is based on our use of TSA-seq analyzed through these 2D scatterplots and should be valid to the degree that our TSA-seq measurements do indeed correlate with microscopy derived distances.
However, we do now include demonstration of a high correlation of speckle, lamina, and nucleolar TSA-seq with highly multiplexed immuno-FISH measurement of distances to these locales in a revised Fig. 7. The high correlation shown between the TSA-seq scores and measured distances does therefore add additional support to our claim that the reviewer is discussing, even without our own multiplexed FISH validation.
(6) "In contrast, genes within genomic regions which in pair-wise comparisons of cell lines show a statistically significant diJerence in lamina TSA-seq show no obvious trend in their expression diJerences (Figure 2C).". This appears to be an overstatement based on the left panel of 2D.
We do not follow the reviewer's point. In Fig. 2C we show little bias in the diJerences in gene expression between the two cell types for regions that showed diJerences in lamina TSA-seq. The reviewer is suggesting something otherwise based on their impression, not explicitly stated, of the left panel of Fig. 2D. But we see similar shades of blue extending vertically at low SON values and similar shades of red extending vertically at high SON values, suggesting a correlation of gene expression only with the SON TSA-seq score but not with the LMNB1 TSA-seq score displayed on the y-axis. This is also consistent with the very small and/or insignificant correlation coeJicients measured in our linear model relating diJerences in LMNB1 TSA-seq to diJerences in expression but the large correlation coeJicient observed for SON TSA-seq (Fig. 2E). Thus, we see Fig. 2C-E as self-consistent.
(7) In the section on "Polarity of Nuclear Genome Organization" - "....Using the IMR90 multiplexed FISH data set [43]...." - The references are not numbered.
We thank the reviewer for this correction.
(8) I believe there is an error in the Figure 7B legend. The descriptions of Cluster 1 and 2 do not match those indicated in the figure.
We again thank the reviewer for this correction.
-
Author response:
Reviewer #1 (Public Review):
Weaknesses:
The weakness of this study lies in the fact that many of the genomic datasets originated from novel methods that were not validated with orthogonal approaches, such as DNA-FISH. Therefore, the detailed correlations described in this work are based on methodologies whose efficacy is not clearly established. Specifically, the authors utilized two modified protocols of TSA-seq for the detection of NADs (MKI67IP TSA-seq) and LADs (LMNB1-TSA-seq). Although these methods have been described in a bioRxiv manuscript by Kumar et al., they have not yet been published. Moreover, and surprisingly, Kumar et al., work is not cited in the current manuscript, despite its use of all TSA-seq data for NADs and LADs across the four cell lines. Moreover, Kumar et al. did not provide any DNA-FISH …
Author response:
Reviewer #1 (Public Review):
Weaknesses:
The weakness of this study lies in the fact that many of the genomic datasets originated from novel methods that were not validated with orthogonal approaches, such as DNA-FISH. Therefore, the detailed correlations described in this work are based on methodologies whose efficacy is not clearly established. Specifically, the authors utilized two modified protocols of TSA-seq for the detection of NADs (MKI67IP TSA-seq) and LADs (LMNB1-TSA-seq). Although these methods have been described in a bioRxiv manuscript by Kumar et al., they have not yet been published. Moreover, and surprisingly, Kumar et al., work is not cited in the current manuscript, despite its use of all TSA-seq data for NADs and LADs across the four cell lines. Moreover, Kumar et al. did not provide any DNA-FISH validation for their methods. Therefore, the interesting correlations described in this work are not based on robust technologies.
An attempt to validate the data was made for SON-TSA-seq of human foreskin fibroblasts (HFF) using multiplexed FISH data from IMR90 fibroblasts (from the lung) by the Zhuang lab (Su et al., 2020). However, the comparability of these datasets is questionable. It might have been more reasonable for the authors to conduct their analyses in IMR90 cells, thereby allowing them to utilize MERFISH data for validating the TSA-seq method and also for mapping NADs and LADs.
We disagree with the statement that the TSA-seq approach and data has not been validated by orthogonal approaches and with the conclusion that the TSA-seq approach is not robust as summarized here and detailed below in “Specific Comments”. TSA-seq is robust because it is based only on the original immunostaining specificity provided by the primary and secondary antibodies plus the diffusion properties of the tyramide-free radical. TSA-seq has been extensively validated by microscopy and by the orthogonal genomic measurements provided by LMNB1 DamID and NAD-seq. This includes: a) the initial validation by FISH of both nuclear speckle (to an accuracy of ~50 nm) and nuclear lamina TSA-seq and the cross-validation of nuclear lamina TSA-seq with lamin B1 DamID in a first publication (Chen et al, JCB 2018, doi: 10.1083/jcb.201807108); b) the further validation of SON TSA-seq by FISH in a second publication ((Zhang et al, Genome Research 2021, doi:10.1101/gr.266239.120); c) the cross-validation of nucleolar TSA-seq using NAD-seq and the validation by light microscopy of the predictions of differences in the relative distributions of centromeres, nuclear speckles, and nucleoli made from nuclear speckle, nucleolar, and pericentric heterochromatin TSA-seq in the Kumar et al, bioRxiv preprint (which is in a last revision stage involving additional formatting for the journal requirements) doi:https://doi.org/10.1101/2023.10.29.564613; d) the extensive validation of nuclear speckle, LMNB1, and nucleolar TSA-seq generated in HFF human fibroblasts using published light microscopy distance measurements of hundreds of probes generated by multiplexed immuno-FISH MERFISH data (Su et al, Cell 2020, https://doi.org/10.1016/j.cell.2020.07.032), as we described for nucleolar TSA-seq in the Kumar et al, bioRxiv preprint and to some extent for LMNB1 and SON TSA-seq in the current manuscript version (see Specific Comments with attached Author response image 2).
Reviewer 1 raised concerns regarding this FISH validation given that the HFF TSA-seq and DamID data was compared to IMR90 MERFISH measurements. The Su et al, Cell 2020 MERFISH paper came out well after the 4D Nucleome Consortium settled on HFF as one of the two main “Tier 1” cell lines. We reasoned that the nuclear genome organization in a second fibroblast cell line would be sufficiently similar to justify using IMR90 FISH data as a proxy for our analysis of our HFF data. Indeed, there is a high correlation between the HFF TSA-seq and distances measured by MERFISH to nuclear lamina, nucleoli, and nuclear speckles (Author response image 1). Comparing HFF SON-TSA-seq data with published IMR90 SON TSA-seq data (Alexander et al, Mol Cell 2021, doi.org/10.1016/j.molcel.2021.03.006), the HFF SON TSA-seq versus MERFISH scatterplot is very similar to the IMR90 SON TSA-seq versus MERFISH scatterplot. We acknowledge the validation provided by the IMR90 MERFISH is limited by the degree to which genome organization relative to nuclear locales is similar in IMR90 and HFF fibroblasts. However, the correlation between measured microscopic distances from nuclear lamina, nucleoli, and nuclear speckles and TSA-seq scores is already quite high. We anticipate the conclusions drawn from such comparisons are solid and will only become that much stronger with future comparisons within the same cell line.
Author response image 1.
Scatterplots showing the correlation between TSA-seq and MERFISH microscopic distances. Top: IMR90 SON TSA-seq (from Alexander et al, Mol Cell 2021) (left) and HFF SON TSA-seq (right) (x-axis) versus distance to nuclear speckles (y-axis). Bottom: HFF Lamin B1 TSA-seq (x-axis) versus distance to nuclear lamina (y-axis) (left) and HFF MKI67IP (nucleolar) TSA-seq (x-axis) versus distance to nucleolus (y-axis) (right).
In our revision, we will add justification of the use of IMR90 fibroblasts as a proxy for HFF fibroblasts through comparison of available data sets.
Reviewer #2 (Public Review):
Weaknesses:
The experiments are largely descriptive, and it is difficult to draw many cause-and-effect relationships. Similarly, the paper would be very much strengthened if the authors provided additional summary statements and interpretation of their results (especially for those not as familiar with 3D genome organization). The study would benefit from a clear and specific hypothesis.
We acknowledge that this study was hypothesis-generating rather than hypothesis-testing in its goal. This research was funded through the NIH 4D-Nucleome Consortium, which had as its initial goal the development, benchmarking, and validation of new genomic technologies. Our Center focused on the mapping of the genome relative to different nuclear locales and the correlation of this intranuclear positioning of the genome with functions- specifically gene expression and DNA replication timing. By its very nature, this project has taken a discovery-driven versus hypothesis-driven scientific approach. Our question fundamentally was whether we could gain new insights into nuclear genome organization through the integration of genomic and microscopic measurements of chromosome positioning relative to multiple different nuclear compartments/bodies and their correlation with functional assays such as RNA-seq and Repli-seq.
Indeed, as described in this manuscript, this study resulted in multiple new insights into nuclear genome organization as summarized in our last main figure. We believe our work and conclusions will be of general interest to scientists working in the fields of 3D genome organization and nuclear cell biology. We anticipate that each of these new insights will prompt future hypothesis-driven science focused on specific questions and the testing of cause-and-effect relationships.
Given the extensive scope of this manuscript, we were limited in the extent that we could describe and summarize the background, data, analysis, and significance for every new insight. In our editing to reach the eLife recommended word count, we removed some of the explanations and summaries that we had originally included.
As suggested by Reviewer 2, in our revision we will add back additional summary and interpretation statements to help readers unfamiliar with 3D genome organization.
Specific Comments in response to Reviewer 1:
(1) We disagree with the comment that TSA-seq has not been cross-validated by other orthogonal genomic methods. In the first TSA-seq paper (Chen et al, JCB 2018, doi: 10.1083/jcb.201807108), we showed a good correlation between the identification of iLADs and LADs by nuclear lamin and nuclear speckle TSA-seq and the orthogonal genomic method of lamin B1 DamID, which is reproduced using our new TSA-seq 2.0 protocol in this manuscript. Similarly, in the Kumar et al, bioRxiv preprint (doi:https://doi.org/10.1101/2023.10.29.564613), we showed a general agreement between the identification of NADs by nucleolar TSA-seq and the orthogonal genomic method of NAD-seq. (We expect this preprint to be in press soon; it is now undergoing a last revision involving only reformatting for journal requirements.) Additionally, we also showed a high correlation between Hi-C compartments and subcompartments and TSA-seq in the Chen et al, JCB 2018 paper. Specifically, there is an excellent correlation between the A1 Hi-C subcompartment and Speckle Associated Domains as detected by nuclear speckle TSA-seq. Additionally, the A2 Hi-C subcompartment correlated well with iLAD regions with intermediate nuclear speckle TSA-seq scores, and the B2 and B3 Hi-C subcompartments with LADs detected by both LMNB TSA-seq and LMNB1 DamID. More generally, Hi-C A and B compartment identity correlated well with predictions of iLADs versus LADs from nuclear speckle and nuclear lamina TSA-seq.
(2) In the Chen et al, JCB 2018 paper we also qualitatively and quantitatively validated TSA-seq using FISH. Qualitatively, we showed that both nuclear speckle and nuclear lamin TSA-seq correlated well with distances to nuclear speckles versus the nuclear lamina, respectively, measured by immuno-FISH.
Quantitatively, we showed that SON TSA-seq could be used to estimate the microscopic mean distance to nuclear speckles with mean and median residuals of ~50 nm. First, we used light microscopy to show that the spreading of tyramide-biotin signal from a point-source of TSA staining fits well with the exponential decay predicted theoretically by reaction-diffusion equations assuming a steady rate of tyramide-biotin free radical generation by the HRP enzyme and a constant probability throughout the nucleus of free-radical quenching (through reaction with protein tyrosine residues and nucleic acids). Second, we used the exponential decay constant measured by light microscopy together with FISH measurements of mean speckle distance for several genomic regions to fit an exponential function and to predict distance to nuclear speckles genome-wide directly from SON TSA-seq sequencing reads. Third, we used this approach to test the predictions against a new set of FISH measurements, demonstrating an accuracy of these predictions of ~50 nm.
(3) The importance of the quantitative validation by immuno-FISH of using TSA-seq to estimate mean distance to nuclear speckles is that it demonstrates the robustness of the TSA-seq approach. Specifically, it shows how the TSA-seq signal is predicted to depend only on the specificity of the primary and secondary antibody staining and the diffusion properties of the tyramide-biotin free radicals produced by the HRP peroxidase. This is fundamentally different from the significant dependence on antibodies and choice of marker proteins for molecular proximity assays such as DamID, ChIP-seq, and Cut and Run/Tag which depend on molecular proximity for labeling and/or pulldown of DNA.
This robustness leads to specific predictions. First, it predicts similar TSA-seq signals will be produced using antibodies against different marker proteins against the same nuclear compartment. This is because the exponential decay constant (distance at which the signal drops by one half) for the spreading of the TSA is in the range of several hundred nm, as measured by light microscopy for several TSA staining conditions. Indeed, we showed in the Chen et al, JCB 2018 paper that antibodies against two different nuclear speckle proteins produced very similar TSA-seq signals while antibodies against LMNB versus LMNA also produced very similar TSA-seq signals. Similarly, we showed in the Kumar et al preprint that antibodies against four different nucleolar proteins showed similar TSA-seq signals, with the highest correlation coefficients for the TSA-seq signals produced by the antibodies against two GC nucleolar marker proteins and the TSA-seq signals produced by the antibodies against two FC/DFC nucleolar marker proteins.
Author response image 2.
Comparison of TSA-seq data from different cell lines versus IMR90 MERFISH. The observed correlation between SON (nuclear speckle) TSA-seq versus MERFISH is nearly as high for TSA-seq data from HFF as it is for TSA-seq data from the IMR90 cell line (Alexander et al, Mol Cell 2021) in which the MERFISH was performed. The correlations for SON, LMNB1 (nuclear lamina) and MKI67IP (nucleolus) versus MERFISH are highest for HFF TSA-seq data as compared to TSA-seq data from other cell lines (H1, K562, HCT116). Comparison of measured distances to nuclear locale (y-axis) versus TSA-seq scores (x-axis) from different cell lines labeled in red. Left to right: SON, LMNB1, and MKI67IP. Top to bottom: SON TSA-seq versus MERFISH for two TSA-seq replicates; TSA-seq from HFF, H1, K562, and HCT116 versus MERFISH.
Second, it predicts that the quantitative relationship between TSA-seq signal and mean distance from a nuclear compartment will depend on the convolution of the predicted exponential decay of spreading of the TSA signal produced by a point source with the more complicated staining distribution of nuclear compartments such as the nuclear lamina or nucleoli. We successfully used this concept to explain the differences emerging between LMNB1 DamID and TSA-seq signals for flat nuclei and to recognize the polarized distribution of different LADs over the nuclear periphery.
(4) After our genomic data production and during our data analysis, a valuable resource from the Zhuang lab was published, using MERFISH to visualize hundreds of genomic loci in IMR90 cells. We acknowledge that the much more extensive validation of TSA-seq by the multiplexed immuno-FISH MERFISH data is dependent on the degree to which the nuclear genome organization is similar between IMR90 and HFF fibroblasts. However, the correlation between distances to nuclear speckles, nucleoli, and the nuclear lamina measured in IMR90 fibroblasts and the nuclear speckle, nucleolar, and nuclear lamina TSA-seq measured in HFF fibroblasts is already striking (See Author response image 1). With regard to SON TSA-seq, the MERFISH versus HFF TSA-seq correlation is close to what we observe using published IMR90 SON TSA-seq data (correlation coefficients of 0.89 (IMR90 TSA-seq) versus 0.86 (HFF TSA-seq). Moreover, this correlation is highest using TSA-seq data from HFF cells as compared to the three other cell lines. (see Author response image 2). We believe these correlations can be considered a lower bound on the actual correlations between the FISH distances and TSA-seq that we would have observed if we had performed both assays on the same cell line.
(5) Currently, we still require tens of millions of cells to perform each TSA-seq assay. This requires significant expansion of cells and a resulting increase in passage numbers of the IMR90 cells before we can perform the TSA-seq. During this expansion we observe a noticeable slowing of the IMR90 cell growth as expected for secondary cell lines as we approach the Hayflick limit. We still do not know to what degree nuclear organization relative to nuclear locales may change as a function of cell cycle composition (ie percentage of cycling versus quiescent cells) and cell age. Thus, even if we performed TSA-seq on IMR90 cells we would be comparing MERFISH from lower passages with a higher percentage of actively proliferating cells with TSA-seq from higher passages with a higher percentage of quiescent cells.
We are currently working on a new TSA-seq protocol that will work with thousands of cells. We believe it is better investment of time and resources to wait until this new protocol is optimized before we repeat TSA-seq in IMR90 cells for a better comparison with multiplexed FISH data.
Specific Comments in response to Reviewer 2:
(1) As we acknowledge in our Response summary, we were limited in the degree to which we could actually follow-up our findings with experiments designed to test specific hypotheses generated by our data. However, we do want to point out that our comparison of wild-type K562 cells with the LMNA/LBR double knockout was designed to test the long-standing model that nuclear lamina association of genomic loci contributes to gene silencing. This experiment was motivated by our surprising result that gene expression differences between cell lines correlated strongly with differences in positioning relative to nuclear speckles rather than the nuclear lamina. Despite documenting in these double knockout cells a decreased nuclear lamina association of most LADs, and an increased nuclear lamina association of the “p-w-v” fiLADs identified in this manuscript, we saw no significant change in gene expression in any of these regions as compared to wild-type K562 cells. Meanwhile, distances to nuclear speckles as measured by TSA-seq remained nearly constant.
We would argue that this represents a specific example in which new insights generated by our genomics comparison of cell lines led to a clear and specific hypothesis and the experimental testing of this hypothesis.
In response to Reviewer 2, we are modifying the text to make this clearer and to explicitly describe how we were testing the hypothesis that distance to nuclear lamina is correlated with but not causally linked to gene expression and how to test this hypothesis we used a DKO of LMNA and LBR to change distances relative to the nuclear lamina and to test the effect on gene expression.
-
eLife assessment
This is a valuable manuscript that successfully integrates several datasets to determine genome interactions with several nuclear bodies. The integrative datasets are a major strength of the manuscript. The evidence supporting the central claims is varied in its strength ranging from solid to incomplete. Orthogonal evidence validating the novel methodologies with alternative approaches would better support the central claims. We encourage the authors to consider a revised manuscript which addresses these points.
-
Reviewer #1 (Public Review):
Summary:
In this study, Gholamalamdari et al. described various aspects of genome organization in relation to nuclear speckles, the nuclear lamina, and nucleoli. Their findings were drawn from the analysis of genomic data sourced from four distinct human cell types. The authors observed significant variation in genome positioning at the lamina and nucleoli across different cell types, whereas contacts with nuclear speckles showed less variability. The data revealed a correlation between gene expression levels and proximity to nuclear speckles, with regions in contact with these speckles coinciding with DNA replication initiation zones. Additionally, the results indicated that the loss of Lamin A and LBR leads to a redistribution of H3K9me3-enriched LADs from the lamina to the nucleolus. Furthermore, a …
Reviewer #1 (Public Review):
Summary:
In this study, Gholamalamdari et al. described various aspects of genome organization in relation to nuclear speckles, the nuclear lamina, and nucleoli. Their findings were drawn from the analysis of genomic data sourced from four distinct human cell types. The authors observed significant variation in genome positioning at the lamina and nucleoli across different cell types, whereas contacts with nuclear speckles showed less variability. The data revealed a correlation between gene expression levels and proximity to nuclear speckles, with regions in contact with these speckles coinciding with DNA replication initiation zones. Additionally, the results indicated that the loss of Lamin A and LBR leads to a redistribution of H3K9me3-enriched LADs from the lamina to the nucleolus. Furthermore, a portion of H3K27me3-enriched, partially repressed intergenic LADs (iLADs) was observed to relocate from the nucleolus to the lamina. The study also proposed that these repressed iLADs may compete with LADs for attachment to the nuclear lamina.
Strengths:
The datasets have been thoroughly integrated and exhibit various features of genomic domains interacting with nuclear speckles, the nuclear lamina, and nucleoli, which will be of interest to the field.
Weaknesses:
The weakness of this study lies in the fact that many of the genomic datasets originated from novel methods that were not validated with orthogonal approaches, such as DNA-FISH. Therefore, the detailed correlations described in this work are based on methodologies whose efficacy is not clearly established. Specifically, the authors utilized two modified protocols of TSA-seq for the detection of NADs (MKI67IP TSA-seq) and LADs (LMNB1-TSA-seq). Although these methods have been described in a bioRxiv manuscript by Kumar et al., they have not yet been published. Moreover, and surprisingly, Kumar et al., work is not cited in the current manuscript, despite its use of all TSA-seq data for NADs and LADs across the four cell lines. Moreover, Kumar et al. did not provide any DNA-FISH validation for their methods. Therefore, the interesting correlations described in this work are not based on robust technologies.
An attempt to validate the data was made for SON-TSA-seq of human foreskin fibroblasts (HFF) using multiplexed FISH data from IMR90 fibroblasts (from the lung) by the Zhuang lab (Su et al., 2020). However, the comparability of these datasets is questionable. It might have been more reasonable for the authors to conduct their analyses in IMR90 cells, thereby allowing them to utilize MERFISH data for validating the TSA-seq method and also for mapping NADs and LADs. -
Reviewer #2 (Public Review):
Summary:
Golamalamdari, van Schaik, Wang, Kumar Zhang, Zhang, and colleagues study interactions between the speckle, nucleolus, and lamina in multiple cell types (K562, H1, HCT116, and HFF). Their datasets define how interactions between the genome and the different nuclear landmarks relate to each other and change across cell types. They also identify how these relationships change in K562 cells in which LBR and LMNA are knocked out.
Strengths:
Overall, there are a number of datasets that are provided, and several "integrative" analyses are performed. This is a major strength of the paper, and I imagine the datasets will be of use to the community to further probed and the relationships elucidated here further studied. An especially interesting result was that specific genomic regions (relative to their …
Reviewer #2 (Public Review):
Summary:
Golamalamdari, van Schaik, Wang, Kumar Zhang, Zhang, and colleagues study interactions between the speckle, nucleolus, and lamina in multiple cell types (K562, H1, HCT116, and HFF). Their datasets define how interactions between the genome and the different nuclear landmarks relate to each other and change across cell types. They also identify how these relationships change in K562 cells in which LBR and LMNA are knocked out.
Strengths:
Overall, there are a number of datasets that are provided, and several "integrative" analyses are performed. This is a major strength of the paper, and I imagine the datasets will be of use to the community to further probed and the relationships elucidated here further studied. An especially interesting result was that specific genomic regions (relative to their association with the speckle, lamina, and other molecular characteristics) segregate relative to the equatorial plane of the cell.
Weaknesses:
The experiments are largely descriptive, and it is difficult to draw many cause-and-effect relationships. Similarly, the paper would be very much strengthened if the authors provided additional summary statements and interpretation of their results (especially for those not as familiar with 3D genome organization). The study would benefit from a clear and specific hypothesis.
-
-
