Natural variation in salt-induced changes in root:shoot ratio reveals SR3G as a negative regulator of root suberization and salt resilience in Arabidopsis
Curation statements for this article:-
Curated by eLife

eLife Assessment
Through cellular, developmental, and physiological analysis, this valuable study identifies a gene that regulates the relative growth of roots and shoots under salt stress. The holistic approach taken provides convincing evidence that this member of a larger tandemly duplicated gene family together with an upstream regulator contributes to salt tolerance. The manuscript will be of interest to plant biologists studying mechanisms of abiotic stress tolerance and gene family evolution.
This article has been Reviewed by the following groups
Discuss this preprint
Start a discussion What are Sciety discussions?Listed in
- Evaluated articles (eLife)
Abstract
Soil salinity is one of the major threats to agricultural productivity worldwide. Salt stress exposure alters root and shoots growth rates, thereby affecting overall plant performance. While past studies have extensively documented the effect of salt stress on root elongation and shoot development separately, here we take an innovative approach by examining the coordination of root and shoot growth under salt stress conditions. Utilizing a newly developed tool for quantifying the root:shoot ratio in agar-grown Arabidopsis seedlings, we found that salt stress results in a loss of coordination between root and shoot growth rates. We identify a specific gene cluster encoding domain-of-unknown-function 247 (DUF247), and characterize one of these genes as S alt R oot:shoot R atio R egulator G ene (SR3G). Further analysis elucidates the role of SR3G as a negative regulator of salt stress tolerance, revealing its function in regulating shoot growth, root suberization, and sodium accumulation. We further characterize that SR3G expression is modulated by WRKY75 transcription factor, known as a positive regulator of salt stress tolerance. Finally, we show that the salt stress sensitivity of wrky75 mutant is completely diminished when it is combined with sr3g mutation. Together, our results demonstrate that utilizing root:shoot ratio as an architectural feature leads to the discovery of a new stress resilience gene. The study’s innovative approach and findings not only contribute to our understanding of plant stress tolerance mechanisms but also open new avenues for genetic and agronomic strategies to enhance crop environmental resilience.
Article activity feed
-

-
-

eLife Assessment
Through cellular, developmental, and physiological analysis, this valuable study identifies a gene that regulates the relative growth of roots and shoots under salt stress. The holistic approach taken provides convincing evidence that this member of a larger tandemly duplicated gene family together with an upstream regulator contributes to salt tolerance. The manuscript will be of interest to plant biologists studying mechanisms of abiotic stress tolerance and gene family evolution.
-
Reviewer #1 (Public review):
The authors aim to assess the effect of salt stress on root:shoot ratio, identify the underlying genetic mechanisms, and evaluate their contribution to salt tolerance. To this end, the authors systematically quantified natural variations in salt-induced changes in root: shoot ratio. This innovative approach considers the coordination of root and shoot growth rather than exploring biomass and development of each organ separately. Using this approach, the authors identified a gene cluster encoding eight paralog genes with a domain-of-unknown-function 247 (DUF247), with the majority of SNPs clustering into SR3G (At3g50160). In the manuscript, the authors utilized an integrative approach that includes genomic, genetic, evolutionary, histological, and physiological assays to functionally assess the contribution …
Reviewer #1 (Public review):
The authors aim to assess the effect of salt stress on root:shoot ratio, identify the underlying genetic mechanisms, and evaluate their contribution to salt tolerance. To this end, the authors systematically quantified natural variations in salt-induced changes in root: shoot ratio. This innovative approach considers the coordination of root and shoot growth rather than exploring biomass and development of each organ separately. Using this approach, the authors identified a gene cluster encoding eight paralog genes with a domain-of-unknown-function 247 (DUF247), with the majority of SNPs clustering into SR3G (At3g50160). In the manuscript, the authors utilized an integrative approach that includes genomic, genetic, evolutionary, histological, and physiological assays to functionally assess the contribution of their genes of interest to salt tolerance and root development.
Comments on latest version:
The authors have largely addressed my concerns and comments. I have no additional comments for this round of review.
-
Reviewer #2 (Public review):
Summary:
Salt stress is a significant and growing concern for agriculture in some parts of the world. While the effects of sodium excess have been studied in Arabidopsis and (many) crop species, most studies have focused on Na uptake, toxicity and overall effects on yield, rather than on developmental responses to excess Na, per se. The work by Ishka and colleagues aims to fill this gap.
Working from an existing dataset that exposed a diverse panel of A. thaliana accessions to control, moderate, and severe salt stress, the authors identify candidate loci associated with altering the root:shoot ratio under salt stress. Following a series of molecular assays, they characterize a DUF247 protein which they dub SR3G, which appears to be a negative regulator of root growth under salt stress.
Overall, this is a …
Reviewer #2 (Public review):
Summary:
Salt stress is a significant and growing concern for agriculture in some parts of the world. While the effects of sodium excess have been studied in Arabidopsis and (many) crop species, most studies have focused on Na uptake, toxicity and overall effects on yield, rather than on developmental responses to excess Na, per se. The work by Ishka and colleagues aims to fill this gap.
Working from an existing dataset that exposed a diverse panel of A. thaliana accessions to control, moderate, and severe salt stress, the authors identify candidate loci associated with altering the root:shoot ratio under salt stress. Following a series of molecular assays, they characterize a DUF247 protein which they dub SR3G, which appears to be a negative regulator of root growth under salt stress.
Overall, this is a well-executed study which demonstrates the functional role played by a single gene in plant response to salt stress in Arabidopsis.
Comments on latest version:
All of the issues that I raised in previous reviews have been addressed by the authors. That said, there are several points that I see have come up in subsequent reviews that remain unresolved.
In response to Reviewer 1, comment 2, regarding changes in expression differences, the authors are misinterpreting simple statistical results. They say that they performed Tukey tests for differences of means, finding, for example, that two means have the same group assignments (in this case, both "c,d") but then argue that "we still observed a clear reduction in WRKY75 transcript abundance." This is not how statistical tests work - we cannot perform a formal test for means and then just do an eyeball test. They also misinterpret the result in which one mean is assigned "b,c,d" results and a second "c,d" - these are statistically overlapping means.
Having said this, I do think that the subtle differences in expression between these different alleles is not critical to the central message of the study. It can be difficult to recapitulate results between labs, much less between different synthetic alleles. I think, in this case, we can let readers decide for themselves whether the reported differences - or lack thereof - is important for follow-up work.
-
Author response:
The following is the authors’ response to the previous reviews.
Public Reviews:
Reviewer #1 (Public review):
Summary:
The authors aim to assess the effect of salt stress on root:shoot ratio, identify the underlying genetic mechanisms, and evaluate their contribution to salt tolerance. To this end, the authors systematically quantified natural variations in salt-induced changes in root:shoot ratio. This innovative approach considers the coordination of root and shoot growth rather than exploring biomass and the development of each organ separately. Using this approach, the authors identified a gene cluster encoding eight paralog genes with a domain-of-unknown-function 247 (DUF247), with the majority of SNPs clustering into SR3G (At3g50160). In the manuscript, the authors utilized an integrative approach that includes …
Author response:
The following is the authors’ response to the previous reviews.
Public Reviews:
Reviewer #1 (Public review):
Summary:
The authors aim to assess the effect of salt stress on root:shoot ratio, identify the underlying genetic mechanisms, and evaluate their contribution to salt tolerance. To this end, the authors systematically quantified natural variations in salt-induced changes in root:shoot ratio. This innovative approach considers the coordination of root and shoot growth rather than exploring biomass and the development of each organ separately. Using this approach, the authors identified a gene cluster encoding eight paralog genes with a domain-of-unknown-function 247 (DUF247), with the majority of SNPs clustering into SR3G (At3g50160). In the manuscript, the authors utilized an integrative approach that includes genomic, genetic, evolutionary, histological, and physiological assays to functionally assess the contribution of their genes of interest to salt tolerance and root development.
Comments on revisions:
As the authors correctly noted, variations across samples, genotypes, or experiments make achieving statistical significance challenging. Should the authors choose to emphasize trends across experiments to draw biological conclusions, careful revisions of the text, including titles and figure legends, will be necessary to address some of the inconsistencies between figures (see examples below). However, I would caution that this approach may dilute the overall impact of the work on SR3G function and regulation. Therefore, I strongly recommend pursuing additional experimental evidence wherever possible to strengthen the conclusions.
(1) Given the phenotypic differences shown in Figures S17A-B, 10A-C, and 6A, the statement that "SR3G does not play a role in plant development under non-stress conditions" (lines 680-681) requires revision to better reflect the observed data.
Thank you to the reviewer for the comment. We appreciate the acknowledgment that variations among experiments are inherent to biological studies. Figures 6A and S17 represent the same experiment, which initially indicated a phenotype for the sr3g mutant under salt stress. To ensure that growth changes were specifically normalized for stress conditions, we calculated the Stress Tolerance Index (Fig. 6B). In Figure 10, we repeated the experiment including all five genotypes, which supported our original observation that the sr3g mutant exhibited a trend toward reduced lateral root number under 75 mM NaCl compared to Col-0, although this difference was not significant (Fig. 10B). Additionally, we confirmed that the wrky75 mutant showed a significant reduction in main root growth under salt stress compared to Col-0, consistent with findings reported in The Plant Cell by Lu et al. 2023. For both main root length and lateral root number, we demonstrated that the double mutants of wrky75/sr3g displayed growth comparable to wild-type Col-0. This result suggests that the sr3g mutation compensates for the salt sensitivity of the wrky75 mutant.
We completely agree with the reviewer that there is a variation in our results regarding the sr3g phenotype under control conditions, as presented in Fig. 6A/Fig. S17 and Fig. 10A-C. In Fig. 6A/Fig. S17, we did not observe any consistent trends in main root or lateral root length for the sr3g mutant compared to Col-0 under control conditions. However, in Fig. 10A-C, we observed a significant reduction in main root length, lateral root number, and lateral root length for the sr3g mutant under control conditions. We believe this may align with SR3G’s role as a negative regulator of salt stress responses. While loss of this gene benefits plants in coping with salt stress, it might negatively impact overall plant growth under non-stress conditions. This interpretation is further supported by our findings on the root suberization pattern in sr3g mutants under control conditions (Fig. 8B), where increased suberization in root sections 1 to 3, compared to Col-0, could inhibit root growth. While SR3G's role in overall plant fitness is intriguing, it is beyond the scope of this study. We cannot rule out the possibility that SR3G contributes positively to plant growth, particularly root growth. That said, we observed no differences in shoot growth between Col-0 and the sr3g mutant under control conditions (Fig. 7). Additionally, we calculated the Stress Tolerance Index for all aspects of root growth shown in Fig. 10 and presented it in Fig. S25.
To address the reviewer request on rephrasing the lines 680-681 from"SR3G does not play a role in plant development under non-stress conditions" (lines 680-681) statement, this statement is found in lines 652-653 and corresponds to Fig. 7, where we evaluated rosette growth in the WT and sr3g mutant under both control and salt stress conditions. We did not observe any significant differences or even trends between the two genotypes under control conditions, confirming the accuracy of the statement. To clarify further, we have added “SR3G does not play a role in rosette growth and development under non-stress conditions”.
(2) I agree with the authors that detecting expression differences in lowly expressed genes can be challenging. However, as demonstrated in the reference provided (Lu et al., 2023), a significant reduction in WRKY75 expression is observed in T-DNA insertion mutant alleles of WRKY75. In contrast, Fig. 9B in the current manuscript shows no reduction in WRKY75 expression in the two mutant alleles selected by the authors, which suggests that these alleles cannot be classified as loss-of-function mutants (line 745). Additionally, the authors note that the wrky75 mutant exhibits reduced main root length under salt stress, consistent with the phenotype reported by Lu et al. (2023). However, other phenotypic discrepancies exist between the two studies. For example, 1) Lu et al. (2023) report that w¬rky75 root length is comparable to WT under control conditions, whereas the current manuscript shows that wrky75 root growth is significantly lower than WT; 2) under salt stress, Lu et al. (2023) show that wrky75 accumulates higher levels of Na+, whereas the current study finds Na+ levels in wrky75 indistinguishable from WT. To confirm the loss of WRKY75 function in these T-DNA insertion alleles the authors should provide additional evidence (e.g., Western blot analysis).
We sincerely appreciate the reviewer acknowledging the challenge of detecting expression differences in lowly expressed genes, such as transcription factors. Transcription factors are typically expressed at lower levels compared to structural or enzymatic proteins, as they function as regulators where small quantities can have substantial effects on downstream gene expression.
That said, we respectfully disagree with the reviewer’s interpretation that there is no reduction in WRKY75 expression in the two mutant lines tested in Fig. 9C. Among the two independent alleles examined, wrky75-3 showed a clear reduction in expression compared to WT Col-0 under both control and salt stress conditions. Using the Tukey test to compare all groups, we observed distinct changes in the assigned significance letters for each case:
Col/root/control (cd) vs wrky75-3/root/control (cd): Although the same significance letter was assigned, we still observed a clear reduction in WRKY75 transcript abundance. More importantly, the variation in expression is notably lower compared to Col-0.
Col/shoot/control (bcd) vs wrky75-3/shoot/control (a): This is significant reduction compared to Col
Col/root/salt (cd) vs wrky75-3/root/salt (bcd): Once again, the reduction in WRKY75 transcript levels corresponds to changes in the assigned significance letters.
Col/shoot/salt (bc) vs wrky75-3/shoot/salt (ab): Once again, the reduction in WRKY75 transcript levels corresponds to changes in the assigned significance letters.
To address the reviewer’s comment regarding the significant reduction in WRKY75 expression observed in T-DNA insertion mutant alleles of WRKY75 in the reference by Lu et al., 2023, we would like to draw the reviewer’s attention to the following points:
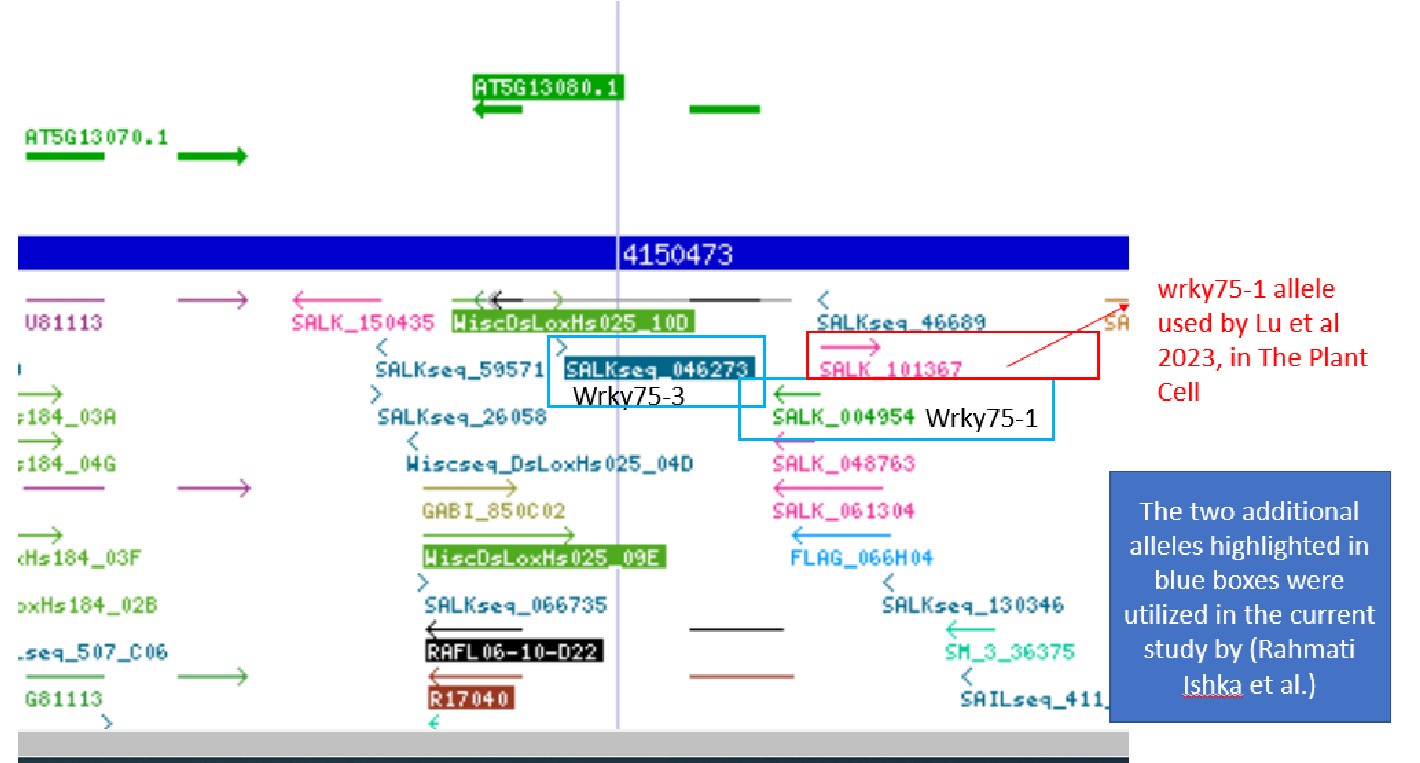
a) Different alleles: The authors in The Plant Cell used different alleles than those used in our study, with one of their alleles targeting regions upstream of the WRKY75 gene. While we identified one of their described alleles (WRKY75-1, SALK_101367) on the T-DNA express website, which targets upstream of WRKY75, the other allele (wrky75-25) appears to have been generated through a different mechanism (possibly an RNAi line) that is not defined in the Plant Cell paper and does not appear on the T-DNA express website. The authors mentioned they have received these seeds as gifts from other labs in the acknowledgement ”We thank Prof. Hongwei Guo (Southern University of Science and Technology, China) and Prof. Diqiu Yu (Yunnan University, China) for kindly providing the WRKY75pro:GUS, 35Spro:WRKY75-GFP, wrky75-1, and wrky75-25 seeds. We thank Man-cang Zhang (Electrophysiology platform, Henan University) for performing the NMT experiment”.
However, in our study, we selected two different T-DNAs that target the coding regions. While this may explain slight differences in the observed responses, both studies independently link WRKY75 to salt stress, regardless of the alleles used. For your reference, we have included a screenshot of the different alleles used.
Author response image 1.
b) Different developmental stages: They measured WRKY75 expression in 5-day-old seedlings. In our experiment, we used seedlings grown on 1/2x MS for 4 days, followed by transfer to treatment plates with or without 75 mM NaCl for one week. As a result, we analyzed older plants (12 days old) for gene expression analysis. Despite the difference in developmental stage, we were still able to observe a reduction in gene expression.
c) Different tissues: The authors of The Plant Cell used whole seedlings for gene expression analysis, whereas we separated the roots and shoots and measured gene expression in each tissue type individually. This approach is logical, as WRKY75 is a root cell-specific transcription factor with higher expression in the roots compared to the shoots, as demonstrated in our analysis (Fig. 9C).
Based on the reasoning above, we did work with loss-of-function mutants of WRKY75, particularly wrky75-3. To more accurately reflect the nature of the mutation, we have changed the term "loss-of-function" to "knock-down" in line 717.
The reviewer mentioned phenotypic discrepancies between the two studies. We agree that there are some differences, particularly in the magnitude of responses or expression levels. However, despite variations in the alleles used, developmental stages, and tissue types, both studies reached the same conclusion: WRKY75 is involved in the salt stress response and acts as a positive regulator. We have discussed the differences between our study and The Plant Cell in the section above, summarizing them into three main points: different alleles, different developmental stages, and different tissue types.
To address the reviewer’s comment regarding "Lu et al. (2023) report that wrky75 root length is comparable to WT under control conditions, whereas the current manuscript shows that wrky75 root growth is significantly lower than WT": We evaluated root growth differently than The Plant Cell study. In The Plant Cell (Fig. 5, H-J), root elongation was measured in 10-day-old plants with a single time point measurement. They transferred five-day-old wild-type, wrky75-1, wrky75-25, and WRKY75-OE plants to 1/2× MS medium supplemented with 0 mM or 125 mM NaCl for further growth and photographed them 5 days after transfer. In contrast, our study used 4-day-old seedlings, which were transferred to 1/2 MS with or without 0, 75, or 125 mM salt for additional growth (9 days). Rather than measuring root growth only at the end, we scanned the roots every other day, up to five times, to assess root growth rates. Essentially, the precision of our method is higher as we captured growth changes throughout the developmental process, compared to the approach used in The Plant Cell. We do not underestimate the significance of the work conducted by other colleagues in the field, but we also recognize that each laboratory has its own approach and specific practices. This variation in experimental setup is intrinsic to biology, and we believe it is important to study biological phenomena in different ways. Especially as the common or contrasting conclusions reached by different studies, performed by different labs and using different experimental setups are shedding more light on reproducibility and gene contribution across different conditions, which is intrinsic to phenotypic plasticity, and GxE interactions.
The Plant Cell used a very high salt concentration, starting at 125 mM, while we were more cautious in our approach, as such a high concentration can inhibit and obscure more subtle phenotypic changes.
To address the reviewer’s comment on "Lu et al. (2023) show that wrky75 accumulates higher levels of Na+, whereas the current study finds Na+ levels in wrky75 indistinguishable from WT," we would like to highlight the differences in the methodologies used in both studies. The Plant Cell measured Na+ accumulation in the wrky75 mutant using xylem sap (Supplemental Figure S10), which appears to be a convenient and practical approach in their laboratory. In their experiment, wild-type and wrky75 mutant plants were grown in soil for 3 weeks, watered with either a mock solution or 100 mM NaCl solution for 1 day, and then xylem sap was collected for Na+ content analysis. In contrast, our study employed a different method to measure Na+ and K+ ion content, using Inductively Coupled Plasma Atomic Emission Spectroscopy (ICP-AES) for root and shoot Na+ and K+ measurements. Additionally, we collected samples after two weeks on treatment plates and focused on the Na+/K+ ratio, which we consider more relevant than net Na+ or K+ levels, as the ratio of these ions is a critical determinant of plant salt tolerance. With this in mind, we observed a considerable non-significant increase in the Na+/K+ ratio in the shoots of the wrky75-3 mutant (assigned Tukey’s letter c) compared to the Col-0 WT (assigned Tukey’s letters abc) under 125 mM salt, suggesting that this mutant is salt-sensitive. Importantly, the Na+/K+ ratio in the double wrky75/sr3g mutants was reduced to the WT level under the same salt conditions, further indicating that the salt sensitivity of wrky75 is mitigated by the sr3g mutation.
Based on the reasons mentioned above, we believe that conducting additional experiments, such as Western blot analysis, is unnecessary and would not contribute new insights or alter the context of our findings.
Reviewer #2 (Public review):
Summary:
Salt stress is a significant and growing concern for agriculture in some parts of the world. While the effects of sodium excess have been studied in Arabidopsis and (many) crop species, most studies have focused on Na uptake, toxicity and overall effects on yield, rather than on developmental responses to excess Na, per se. The work by Ishka and colleagues aims to fill this gap.
Working from an existing dataset that exposed a diverse panel of A. thaliana accessions to control, moderate, and severe salt stress, the authors identify candidate loci associated with altering the root:shoot ratio under salt stress. Following a series of molecular assays, they characterize a DUF247 protein which they dub SR3G, which appears to be a negative regulator of root growth under salt stress.
Overall, this is a well-executed study which demonstrates the functional role played by a single gene in plant response to salt stress in Arabidopsis.
Review of revised manuscript:
The authors have addressed my point-by-point comments to my satisfaction. In the cases where they have changed their manuscript language, clarified figures, or added analyses I have no further comment. In some cases, there is a fruitful back-and-forth discussion of methodology which I think will be of interest to readers.
I have nothing to add during this round of review. I think that the paper and associated discussion will make a nice contribution to the field.
We sincerely appreciate the reviewer’s recognition of the significance of our work to the field.
Recommendations for the authors:
Reviewer #1 (Recommendations for the authors):
Lines 518-519: The statement that other DUF247s exhibit similar expression patterns to SR3G, suggesting their responsiveness to salt stress, is not fully supported by Fig. S14. Please clarify the specific similarities (and differences) in the expression patterns of the DUF247s shown in Fig. S14, as their expression appears to be spatially and temporally diverse. Additionally, the scale is missing in Fig. S14.
We thank the reviewer. We fixed the text and added expression scales to Figure S14.
Line 684, Fig. 6A should be 7A.
Thanks. It is fixed.
Line 686, Fig. 7A should be 7B.
Thanks. It is fixed.
Lines 721-723: The signal quantification in Fig. 8B does not support the claim that "in section one,..., sr3g-5 showed more suberization compared to Col-0." Given the variability and noise often associated with histological dyes such as Fluorol Yellow staining, conclusions should be cautiously grounded in robust signal quantification. Additionally, please specify the number of biological replicates used in both Fig. 8B and C.
We thank the reviewer for their comments. We believe the statement in the text accurately reflects our results presented in Figure 8B, where we stated “non-significant, but substantially higher levels of root suberization in sr3g-5 compared to Col-0 in sections one to three of the root under control condition (Fig. 8B).” Therefore, we kept the statement and have included the number of biological replicates in the figure legend.
Lines 731-732: Please provide a more detailed explanation of how the significant changes in suberin monomer levels align with the Fluorol Yellow staining results, and clarify how these findings support the proposed negative role of SR3G in root suberization.
Fluorol Yellow is a lipophilic dye widely used to label suberin in plant tissues, specifically in roots in this study. Given the inherent variability in histological assays, we confirmed the increase in suberization using an alternative method, Gas Chromatography–Mass Spectrometry (GC-MS). Both approaches revealed elevated suberin levels in the sr3g mutant compared to Col-0. Since the overall suberin content was higher in the mutant under both control and salt stress conditions, we proposed that SR3G acts as a negative regulator of root suberization.
Lines 686-688 and Figure S24: The authors calculated water mass as FW-DW. A more standard approach for calculating water content is (FW-DW)/FW x 100. Please update the text or adjust the calculation accordingly. Additionally, if the goal is to test differences between WT and the mutant within each condition, a t-test would be a more appropriate statistical method.
We thank the reviewer. We added water content % to the figure S24. We kept the statistical test as it is as we wanted to be able to observe changes across conditions and genotypes.
Lines 633-635 states that "No significant difference was observed between sr3g-4 and Col-0 (Fig. S18), except for the Stress Tolerance Index (STI) calculated using growth rates of lateral root length and number." However, based on the Figure S18 legend and statistical analysis (i.e., ns), it appears that the sr3g-4 mutant shows no alterations in root system architecture compared to Col-0. Please revise the text to accurately reflect the results of the statistical analysis.
We thank the reviewer. We now fixed the text to reflect the result.
Lines 698-707: The statistical analysis does not support the reported differences in the Na+/K+ ratio for the single and double mutants of sr3g-5 and wrky75-3 (Fig. 10D, where levels connected by the same letters indicate they are not significantly different). Furthermore, the conclusion that "the SR3G mutation indeed compensated for the increased Na+ accumulation observed in the wrky75 mutant under salt stress" is also based on non-significant differences (Fig. S25B). Please revise the text to accurately reflect the results of the statistical analysis. Additionally, since each mutant is compared to the WT, I recommend using Dunnett's test for statistical analysis.
We thank the reviewer for their feedback. We have carefully revised the text to better support our findings. As previously mentioned, variations among samples are evident and are well-reflected across all our datasets. We have presented all data and focused on identifying trends within our samples to guide interpretation.
We observed that the SR3G mutation effectively compensated for the increased Na+ accumulation observed in the wrky75 mutant under salt stress. A closer examination of the shoot Na+/K+ ratio under 125 mM salt shows that the wrky75 single mutant has a higher Na+/K+ ratio (indicated by the letter "c") compared to Col-0 (indicated by "abc") and the two double mutants (also indicated by "abc"). Therefore, we have retained the statistical analysis as originally conducted, and maintain our conclusions as is.
Figure 6: data in panel C present the Na/K ratio, not Na+ content. Based on the statistical analysis of root Na+ levels presented in Fig. S17C, there is no significant difference between sr3g-5 and WT. Please update the title of Fig. 6. In addition, in panel A, the title of the Y-axis and figure legend should be "Lateral root growth rate" without the word length, and in panel C, the statistical analysis is missing.
We thank the reviewer. We updated Fig. 6 title and fixed the Y-axis in panel A, and added statistical letters to panel C. Legend was updated to reflect the changes.
Figure 7: Please clearly label the time points where significant differences between genotypes are observed for both early and late salt treatments. Was there a significant difference recorded between WT and sr3g-5 on day 0 under early salt stress? Such differences may arise from initial variations in plant size within this experiment, as indicated by Fig. 7B, where significant differences in rosette area are evident starting from day 0. Additionally, please indicate the statistical analysis in panel E.
We thank the reviewer for this suggestion. We updated the figure with a statistical test added to the panel E. Although the difference between sr3g mutant and Col-0 is indeed significant in its growth rate at day 0, we would like to draw the attention of the reviewer that this growth rate was calculated over the 24 hours after adding salt stress. Therefore, this difference in growth rate is related to exposure to salt stress. Moreover, the growth rate between Col-0 and sr3g mutant does not differ in two other treatments (Control and Late Salt Stress) further supporting the conclusion that sr3g is affecting rosette size and growth rate only under early salt stress conditions.
We have also added the Salt Tolerance Index calculation to Figure S24 as additional evidence, controlling for potential differences in size between Col-0 and sr3g mutant.
Figure S17: statistical analysis is not indicated in panels A, B, and D.
We thank the reviewer for spotting that. We updated the figure with a statistical test.
Figures S21-23: The quality of these figures is insufficient, hindering the ability to effectively interpret the authors' results and main message. Furthermore, a Dunnett's test, rather than a t-test, is the appropriate statistical method for this analysis.
We thank the reviewer for this observation. We have now added a high resolution figures for all supplemental figures, which should increase the resolution of the figures. As we are comparing all of the genotypes to Col-0 one-by-one - the results of individual t-tests are sufficient for this analysis.
-
-
-
eLife Assessment
Through cellular, developmental, and physiological analysis, this valuable study identifies a gene that regulates the relative growth of roots and shoots under salt stress. The holistic approach taken provides solid evidence that this member of a larger tandemly duplicated gene family together with an upstream regulator contributes to salt tolerance, although the statistical or biological support for some conclusions could be more robust. The manuscript will be of interest to plant biologists studying mechanisms of abiotic stress tolerance and gene family evolution.
-
Reviewer #1 (Public review):
Summary:
The authors aim to assess the effect of salt stress on root:shoot ratio, identify the underlying genetic mechanisms, and evaluate their contribution to salt tolerance. To this end, the authors systematically quantified natural variations in salt-induced changes in root:shoot ratio. This innovative approach considers the coordination of root and shoot growth rather than exploring biomass and the development of each organ separately. Using this approach, the authors identified a gene cluster encoding eight paralog genes with a domain-of-unknown-function 247 (DUF247), with the majority of SNPs clustering into SR3G (At3g50160). In the manuscript, the authors utilized an integrative approach that includes genomic, genetic, evolutionary, histological, and physiological assays to functionally assess the …
Reviewer #1 (Public review):
Summary:
The authors aim to assess the effect of salt stress on root:shoot ratio, identify the underlying genetic mechanisms, and evaluate their contribution to salt tolerance. To this end, the authors systematically quantified natural variations in salt-induced changes in root:shoot ratio. This innovative approach considers the coordination of root and shoot growth rather than exploring biomass and the development of each organ separately. Using this approach, the authors identified a gene cluster encoding eight paralog genes with a domain-of-unknown-function 247 (DUF247), with the majority of SNPs clustering into SR3G (At3g50160). In the manuscript, the authors utilized an integrative approach that includes genomic, genetic, evolutionary, histological, and physiological assays to functionally assess the contribution of their genes of interest to salt tolerance and root development.
Comments on revisions:
As the authors correctly noted, variations across samples, genotypes, or experiments make achieving statistical significance challenging. Should the authors choose to emphasize trends across experiments to draw biological conclusions, careful revisions of the text, including titles and figure legends, will be necessary to address some of the inconsistencies between figures (see examples below). However, I would caution that this approach may dilute the overall impact of the work on SR3G function and regulation. Therefore, I strongly recommend pursuing additional experimental evidence wherever possible to strengthen the conclusions.
(1) Given the phenotypic differences shown in Figures S17A-B, 10A-C, and 6A, the statement that "SR3G does not play a role in plant development under non-stress conditions" (lines 680-681) requires revision to better reflect the observed data.
(2) I agree with the authors that detecting expression differences in lowly expressed genes can be challenging. However, as demonstrated in the reference provided (Lu et al., 2023), a significant reduction in WRKY75 expression is observed in T-DNA insertion mutant alleles of WRKY75. In contrast, Fig. 9B in the current manuscript shows no reduction in WRKY75 expression in the two mutant alleles selected by the authors, which suggests that these alleles cannot be classified as loss-of-function mutants (line 745). Additionally, the authors note that the wrky75 mutant exhibits reduced main root length under salt stress, consistent with the phenotype reported by Lu et al. (2023). However, other phenotypic discrepancies exist between the two studies. For example, 1) Lu et al. (2023) report that w¬rky75 root length is comparable to WT under control conditions, whereas the current manuscript shows that wrky75 root growth is significantly lower than WT; 2) under salt stress, Lu et al. (2023) show that wrky75 accumulates higher levels of Na+, whereas the current study finds Na+ levels in wrky75 indistinguishable from WT. To confirm the loss of WRKY75 function in these T-DNA insertion alleles the authors should provide additional evidence (e.g., Western blot analysis). -
Reviewer #2 (Public review):
Summary:
Salt stress is a significant and growing concern for agriculture in some parts of the world. While the effects of sodium excess have been studied in Arabidopsis and (many) crop species, most studies have focused on Na uptake, toxicity and overall effects on yield, rather than on developmental responses to excess Na, per se. The work by Ishka and colleagues aims to fill this gap.
Working from an existing dataset that exposed a diverse panel of A. thaliana accessions to control, moderate, and severe salt stress, the authors identify candidate loci associated with altering the root:shoot ratio under salt stress. Following a series of molecular assays, they characterize a DUF247 protein which they dub SR3G, which appears to be a negative regulator of root growth under salt stress.
Overall, this is a …
Reviewer #2 (Public review):
Summary:
Salt stress is a significant and growing concern for agriculture in some parts of the world. While the effects of sodium excess have been studied in Arabidopsis and (many) crop species, most studies have focused on Na uptake, toxicity and overall effects on yield, rather than on developmental responses to excess Na, per se. The work by Ishka and colleagues aims to fill this gap.
Working from an existing dataset that exposed a diverse panel of A. thaliana accessions to control, moderate, and severe salt stress, the authors identify candidate loci associated with altering the root:shoot ratio under salt stress. Following a series of molecular assays, they characterize a DUF247 protein which they dub SR3G, which appears to be a negative regulator of root growth under salt stress.
Overall, this is a well-executed study which demonstrates the functional role played by a single gene in plant response to salt stress in Arabidopsis.
Review of revised manuscript:
The authors have addressed my point-by-point comments to my satisfaction. In the cases where they have changed their manuscript language, clarified figures, or added analyses I have no further comment. In some cases, there is a fruitful back-and-forth discussion of methodology which I think will be of interest to readers.
I have nothing to add during this round of review. I think that the paper and associated discussion will make a nice contribution to the field
-
Author response:
The following is the authors’ response to the original reviews.
Public Reviews:
Reviewer #1 (Public Review):
Summary:
The authors aim to assess the effect of salt stress on root:shoot ratio, identify the underlying genetic mechanisms, and evaluate their contribution to salt tolerance. To this end, the authors systematically quantified natural variations in salt-induced changes in root:shoot ratio. This innovative approach considers the coordination of root and shoot growth rather than exploring biomass and the development of each organ separately. Using this approach, the authors identified a gene cluster encoding eight paralog genes with a domain-of-unknown-function 247 (DUF247), with the majority of SNPs clustering into SR3G (At3g50160). In the manuscript, the authors utilized an integrative approach that includes …
Author response:
The following is the authors’ response to the original reviews.
Public Reviews:
Reviewer #1 (Public Review):
Summary:
The authors aim to assess the effect of salt stress on root:shoot ratio, identify the underlying genetic mechanisms, and evaluate their contribution to salt tolerance. To this end, the authors systematically quantified natural variations in salt-induced changes in root:shoot ratio. This innovative approach considers the coordination of root and shoot growth rather than exploring biomass and the development of each organ separately. Using this approach, the authors identified a gene cluster encoding eight paralog genes with a domain-of-unknown-function 247 (DUF247), with the majority of SNPs clustering into SR3G (At3g50160). In the manuscript, the authors utilized an integrative approach that includes genomic, genetic, evolutionary, histological, and physiological assays to functionally assess the contribution of their genes of interest to salt tolerance and root development.
Strengths:
The holistic approach and integrative methodologies presented in the manuscript are essential for gaining a mechanistic understanding of a complex trait such as salt tolerance. The authors focused on At3g50160 but included in their analyses additional DUF247 paralogs, which further contributes to the strength of their approach. In addition, the authors considered the developmental stage (young seedlings, early or late vegetative stages) and growth conditions of the plants (agar plates or soil) when investigating the role of SR3G in salt tolerance and root or shoot development.
Weaknesses:
The authors' claims and interpretation of the results are not fully supported by the data and analyses. In several cases, the authors report differences that are not statistically significant (e.g., Figures 4A, 7C, 8B, S14, S16B, S17C), use inappropriate statistical tests (e.g., t-test instead of Dunnett Test/ANOVA as in Figures 10B-C, S19-23), present standard errors that do not seem to be consistent with the post-hoc Tukey HSD Test (e.g., Figures 4, 9B-C, S16B), or lack controls (e.g., Figure 5C-E, staining of the truncated versions with FM4-64 is missing).
We thank the reviewer for their critical thoughts on the presented data. We have revised our data interpretation in the main text to more accurately reflect the results. Given the nature of our experimental setup, where we trace the roots of individual Arabidopsis seedlings grown on plates, there is considerable biological variation, which makes achieving strong statistical significance between samples or genotypes challenging. However, we think that the representation of the data as transparently as possible is necessary to provide the readers and reviewers a true picture of the variability that we are observing. Consequently, we have centered our data interpretation around observable trends that facilitate drawing conclusions.
The choice of statistical test is closely tied to the specific biological question being addressed. In Figures 10A-C, as in Figures 6A-B, we compared all genotypes to the wild-type Col-0 within each condition, and thus ANOVA analysis, testing the general effect of the genotype across both mutants and Col-0 wild-type is not appropriate. Similarly, in Figures S19-S23, we compared each mutant line to the wild-type Col-0 under each condition.
We repeated the post-hoc Tukey HSD Test for Figures 4, 9B-C, and S16B and made adjustments where necessary (see tracked changes manuscript).
The truncated versions do not localize to the plasma membrane; instead, they are targeted to the nucleus and cytosol, mimicking the localization pattern of free GFP, which was used as a control in Panel F. Therefore, we believe that having FM4-64 as a control for these specific images is not informative, but instead using free GFP is serving as a better control in that particular construct.
In other cases, traits of root system architecture and expression patterns are inconsistent between different assays despite similar growth conditions (e.g., Figures S17A-B vs. 10A-C vs. 6A, and Figures S16B vs. 4A/9B), or T-DNA insertion alleles of WRKY75 that are claimed to be loss-of-function show comparable expression of WRKY75 as WT plants. Additionally, several supplemental figures are mislabeled (Figures S6-9), and some figure panels are missing (e.g., Figures S16C and S17E).
We thank the reviewer for raising these points and noticing the inconsistency between different assays (e.g., Figures S17A-B vs. 10A-C vs. 6A, and Figures S16B vs. 4A/9B). As mentioned above, considerable biological variation makes achieving strong statistical significance between samples, genotypes, or experiments challenging. Thus, we have centered our data interpretation around observable “trends” between experiments to facilitate drawing conclusions. Considering Figures S17A-B, 10A-C, and 6A, we acknowledge the reviewer's concern about inconsistencies in root system architecture across experiments. Initially, we observed that the sr3g mutant had reduced lateral root length compared to Col-0 under salt stress. This led us to focus on this specific phenotypic trait rather than the overall root system architecture. Despite some variation, the sr3g mutant consistently showed a similar trend/phenotype when compared to Col-0 under salt stress. We believe the variation in main root length and lateral root number between experiments is due to inherent differences between biological replicates.
Regarding gene expression patterns between Figures S16B and 4A/9B, we included part of Figure 9B (SR3G gene expression in Col-0) in Figure 4A. Figure S16B represents a completely different assay. Despite variations between assays, the overall message remains consistent: SR3G gene expression is induced under salt stress in the root but not in the shoot.
Both SR3G and WRKY75 are expressed at very low levels, even under the 75 mM salt stress condition we tested. When gene expression is so low, detecting changes is challenging due to inherent variations. Nonetheless, we observed a reduction in WRKY75 expression in the mutant lines compared to wild-type Col-0, though this reduction was not statistically significant. More importantly, we observed a similar phenotype in the wrky75 mutant, specifically reduced main root length under salt stress, consistent with the findings of the published paper in The Plant Cell by Lu et al. (2023) “Lu, K.K., Song, R.F., Guo, J.X., Zhang, Y., Zuo, J.X., Chen, H.H., Liao, C.Y., Hu, X.Y., Ren, F., Lu, Y.T. and Liu, W.C., 2023. CycC1; 1–WRKY75 complex-mediated transcriptional regulation of SOS1 controls salt stress tolerance in Arabidopsis. The Plant Cell, 35(7), pp.2570-2591”.
We appreciate the reviewer for spotting the missing labels for Figures S6-9. We corrected them at the main text, figures, and legends. We added panel C to Figure S16 and removed panel E from Figure S17 legend, now they match to actual figures and legends.
Consequently, the authors' decisions regarding subsequent functional assays, as well as major conclusions about gene function, including SR3G function in root system architecture, involvement in root suberization, and regulation of cellular damage are incomplete.
We greatly appreciate the reviewer's thorough review of our manuscript and their critical comments. We have carefully addressed all comments and concerns.
Reviewer #2 (Public Review):
Salt stress is a significant and growing concern for agriculture in some parts of the world. While the effects of sodium excess have been studied in Arabidopsis and (many) crop species, most studies have focused on Na uptake, toxicity, and overall effects on yield, rather than on developmental responses to excess Na, per se. The work by Ishka and colleagues aims to fill this gap.
Working from an existing dataset that exposed a diverse panel of A. thaliana accessions to control, moderate, and severe salt stress, the authors identify candidate loci associated with altering the root:shoot ratio under salt stress. Following a series of molecular assays, they characterize a DUF247 protein which they dub SR3G, which appears to be a negative regulator of root growth under salt stress.
Overall, this is a well-executed study that demonstrates the functional role played by a single gene in plant response to salt stress in Arabidopsis.
The abstract and beginning of the Discussion section highlight the "new tool" developed here for measuring biomass accumulation. I feel that this distracts from the central aims of the study, which is really about the role of a specific gene in root development under salt stress. I would suggest moving the tool description to less prominent parts of the manuscript.
We appreciate the reviewer's suggestion. We believe that the innovative tool used to extract shoot-to-root ratio data from previous experiments underscores the value of reutilizing previously acquired data for new discoveries and demonstrates how reanalyzing the same data can provide fresh insights, such as identification of new allelic variation. Therefore, we decided to retain this section, as our discovery of the SR3G gene originated from this innovative tool.
Recommendations for the authors:
Reviewer #3 (Recommendations For The Authors):
Line 58 (opening sentence) - salt accumulation in the soil is not caused by evaporation exceeding input; that scenario results in soil water deficit. The issue is when the input water has dissolved ions.
We thank the reviewer for raising this important point. While this point is theoretically true, all of the water that is found in natural environments contains some dissolved ions. Therefore, drought conditions will lead, over time, to increased soil salinization. We have amended this sentence to represent our point better.
“Salt stress is predominant in the dryland areas where evaporation rate exceeds water input. As all water contains dissolved ions, the prolonged exposure to drought stress results in increased accumulation of salts in the upper soil layers 1–3.”
I feel that it would be helpful, for replication and for interpretation, if the authors could provide water potentials for the growing media used throughout. What water potentials are the plants experiencing when grown in 1/2 MS + agar at 0, 75, and 150mM NaCl? Juenger and Verslues present a great recent discussion of the importance of reporting these values (Juenger, T. E. and P. E. Verslues (2023). "Time for a drought experiment: Do you know your plants' water status?" Plant Cell 35(1): 10-23.)
Critically, how do the water potentials experienced by agar-grown plants compare to those experienced in soil-grown plants? As a stated aim of this study is to allow translation to crops these data are very important to convince physiologists of the relevance of the results.
We thank the reviewer for raising this important point. We completely agree that growing plants on agar plates is an artificial setup and knowing the water potential of the plants within this setup would be highly informative. However, as indicated in review by Juenger and Verslues 2023, the agar plate setup is much more reproducible compared to various soil conditions, and we report the media composition in sufficient detail for it to be reproduced in other laboratory conditions.
Furthermore, while investigating the water status of plants and soil is indeed intriguing, it is beyond the scope of this study and would require us to redo the experiments with specific tools listed within the Juennger and Verslues review, which are currently not within our laboratory equipment list.
Importantly, any changes reported in this manuscript apply equally to both wild-type and mutant lines under all conditions. We provide extensive report on the soil type used, as well as soil quantity. We are using the gravimetric method to determine the water content, and salt stress application, as described in previous works from our lab (Yu and Sussman et al., 2024 Plant Physiology and Awlia et al., 2016 Frontiers in Plant Science).
Nonetheless, we have now included water content measurements for soil-grown plants under different conditions, calculated by subtracting dry weight from fresh weight (new Fig. S24). Although plant water content may not fully capture the water status of the media or soil, our measurements did not reveal any significant differences in water content between genotypes across the various conditions tested.
Line 69- missing an "and" after "(ABA)."
Thanks. We added the missing “and”.
Line 79 - I think the association being made is between natural variation in root and shoot growth and genetic variants, not "underlying genes."
We thank the reviewer for this suggestion. The cause for the identified association indeed relies on allelic variation within the genetic region. We have re-phrased this sentence within the manuscript.
“Many forward genetic studies were highly successful in associating natural variation in root and shoot growth with allelic variation in gene coding and promoter regions, thereby identifying potential new target traits for improved stress resilience 18,20,21.”
Figure 1 - what do "seGF" and "reGF" stand for? Shoot and root growth rate, respectively, but there are extra letters in there…
The abbreviations stand for shoot exponential Growth Factor and root exponential Growth factor. An explanation of the acronym has been added to the text.
“The increase in the projected area of shoot and root (Fig. S2) was used to estimate (A) shoot and (B) root exponential growth rate (seGR and reGR respectively).”
Figure 1 legend - there's an "s" missing in "across." And two "additionally" in the penultimate sentence.
Thanks for spotting the errors. We fixed these errors.
Line 109 - how was the white balance estimated for the images on the flatbed scanner?
Within the developed tool, we have not adjusted or controlled for white balance in any way, as the white balance from the flatbed scanner is kept at one value. The tool transforms the imaged pixels into bins consisting of white (root), green (shoot), and blue (place) pixels based on the closest distance in the RGB scale to the particular color, which makes correcting for white balance obsolete. We have provided an additional explanation for this within the M&M section.
“A Matlab-based tool was developed to simplify and speed up the segmentation and analysis pipeline. For automatic segmentation, the tool uses a combination of image operations (histogram equalization), thresholding on different color spaces (e.g., RGB, YCbCr, Lab, HSV), and binary image processing (boundary and islands removal). As the tool is digitalizing various color scales and classifies pixels into either white (root), green (shoot) or blue (background) categories, the adjustment for white balance is obsolete. ”
GWAS was performed separately on traits measured at control, 75mM, and 150mM NaCl treatments. Would it also be informative to map the STI measurement (i.e. plasticity) introduced here?
We thank the reviewer for this important point. We have performed GWAS on both “raw” and STI traits, however, we found that the identified associations were not as abundant as the ones identified with “raw traits”. This makes sense, as we are compounding the root or shoot growth under both conditions, and plastic responses to the environment are expected to be genetically more complex, as they involve more genetic regulators compared to phenotypes that have low plasticity. We have added this as a part of the result description, as we acknowledge that this might be an interesting observation for the field to build upon, and might provide fodder for new methods to deconvolute the complexity in mapping the plastic traits.
“To identify genetic components underlying salt-induced changes in root:shoot ratio, we used the collected data as an input for GWAS. The associations were evaluated based on the p-value, the number of SNPs within the locus, and the number of traits associated with individual loci. As Bonferroni threshold differs depending on the minor allele count (MAC) considered, we identified significant associations based on a Bonferroni threshold for each subpopulation of SNPs based on MAC (Table S3). While we conducted a GWAS on directly measured traits, as well as their Salt Tolerance Index (STI) values, however the amount of associations with STI was much lower compared to directly measured traits (Table S3). This observation aligns with the understanding that plastic responses to environmental conditions tend to be genetically more complex. This complexity likely stems from the involvement of more genetic regulators compared to low-plasticity phenotypes.”
Line 167 - how was LD incorporated into this analysis? Did you use a genome average? Or was LD allowed to vary (as it does) across the genome?
Initially, we have used genome average LD for this purpose (10 kbp for Arabidopsis), and extended the region of interest based on the number of coding genes within the window. We have added this as a part of description to our manuscript.
“For the most promising candidate loci (Table S4), we have identified the gene open reading frames that were located within the genome-wide linkage-disequilibrium (LD) of the associated SNPs. The LD was expanded if multiple SNPs were identified within the region, and the region of interest was expanded based on the number of coding genes within the LD window. ”
Line 291 - I think the water potentials are essential, here. What does 50% of soil water holding capacity equal in these soils? In the substrate that we use in our lab, that would represent a considerable soil water deficit even without any salts in the soil.
We thank the reviewer for this comment. As Arabidopsis is occurring naturally in low soil water holding capacity soils (i.e. sandy soils), it is typically growing better in soils that are not very saturated with the water. Throughout many experiments, performed within this study, and other studies performed in our lab (results reported in Awlia et al., 2016 Frontiers in Plant Science and Yu & Sussman et al., 2024 Plant Physiology), we have not observed any drought like symptoms at 50% soil water holding capacity. The fact that this is reproducible across similar soil types across two laboratories (one in Saudi Arabia and one in the USA) is not to be dismissed. Again - we are currently not equipped to measure water potentials for these plants, as this is not a standard practice (yet) for stress experiments, but we are taking these comments on board for all of our future experiments.
Moreover, our control plants are also “dried down” to 50% of SWHC, and soaked in non-saline water during the “salt stress treatment” to make sure that the soil water saturation is accounted for within the experimental setup. This “dry down” of soil is necessary to ensure equal and effective salt penetration into the soil particles. More details on this method can be found in Awlia et al., 2016.
Again - We have added a new dataset measuring water content in individually soil-grown plants under different conditions as a proxy for soil water status (see new Fig. S24). While we did not observe any significant differences in water content between genotypes under the various conditions, the sr3g mutant showed a slightly higher, though non-significant, water content compared to wild-type Col-0 under control conditions.
We have provided additional information and comments to warn the readers about this method:
“The seeds were germinated in ½ MS media for one week, as described for the agar-based plate experiments. One week after germination, the seedlings were transplanted to the pot (12 x 4 cm insert) containing the Cornell Mix soil (per batch combine: 0.16 m3 of peat moss, 20.84 kg of vermiculite, 0.59 kg of Uni-Mix fertilizer, and 2.27 kg of lime) watered to 100% water holding capacity and placed in the walk-in growth chamber with the 16 h light / 8 h dark period, 22°C and 60% relative humidity throughout the growth period. When all of the pots dried down to the weight corresponding to 50% of their water holding capacity, they were soaked for 1 h in tap water or a 200 mM NaCl solution, resulting in an effective concentration of 100 mM NaCl based on the 50% soil water holding capacity, which corresponded to a moderate level of salt stress (Awlia et al., 2016). The control pots were soaked for the same length of time in 0 mM NaCl solution, to account for the soil saturation effect. We then allowed the pots to be drained for 2-3 h to eliminate excess moisture. The pots were placed under phenotyping rigs equipped with an automated imaging system (Yu et al., 2023) and the pot weight was measured daily to maintain the reference weight corresponding to 50% of the soil water holding capacity throughout the experiment. We would like to note that this gravimetric based method for application of salt stress has been developed for soils typically used for pot-grown plants, with relatively high water holding capacity (Awlia et al. 2016). Within these specific conditions, no drought stress symptoms were observed.”
Lines 415-416 - are these contrasts significant? Figure S3 likewise does not have any notation for significant differences in the means.
We have previously not tested the stronger effect of 125 mM vs 75 mM on relative root and shoot growth, and thus these test results were initially not included in Fig. S3. We have now added the tests and included them within Fig. S3, and added description of their significance into the main body of the manuscript:
“In comparison, the growth rates of the shoot were significantly reduced to 0.71 and 0.43 of the control in 75 and 125 mM NaCl treatments, respectively (Fig. S3). While the mean value of root:shoot growth rate did not change upon salt stress treatment, the variance in the root:shoot ratio significantly expanded with the increasing concentrations of salt (Fig. 1C). These results suggest that while root and shoot growth are well coordinated under non-stress conditions, salt stress exposure results in loss of coordination of organ growth across Arabidopsis accessions.”
Line 418 - same comment as preceding. Is this change in variance significant?
We have previously not tested this. We have now added the ANOVA tests and included them within each figure, and added description of their significance into the main body of the manuscript. (see text above)
Line 421 - why would we expect there to be a correlation between root:shoot growth ratio and seedling size?
We were trying to use the seedling size as a proxy for “fitness” - or how well the plants can survive under these specific conditions. We were testing here whether any simple and directional strategy - such as increase or decrease in root:shoot ratio under salt stress - is resulting in better salt tolerance - which would translate into larger overall seedlings. We have rephrased this within the manuscript, to better explain the hypothesis being tested within this specific figure:
“To test whether there is a clear directional correlation between the change in root:shoot ratio and overall salt stress tolerance, we have used the overall seedling size as a proxy for plant salt tolerance (Fig. S4, S5). No significant correlation was found between the root:shoot growth ratio and total seedling size (Fig. S4, S5), indicating that the relationship between coordination of root and shoot growth and salt tolerance during the early seedling establishment is complex.”
Line 438 - I think a stable web link would be more appropriate than listing Dr. Nordborg's email address.
Sorry about this. There is a glitch with our reference citing software. We agree, and thank the reviewer for noticing this! We assigned reference number 43 to it.
Line 439 - I expect that many of your readers may not be experienced with GWAS. Can you provide an explanation as to why only one locus was detected with both the 250K SNP panel and the 4M SNP panel?
We thank the reviewer for raising this point. We have added additional explanation to this observation:
“Increased SNP density can provide more potential associations, highlighting the associated loci with more confidence, due to more SNPs being detected within specific region. The different panels could capture different LD blocks across the genome. If the locus detected by both panels is in a region of strong LD or under selection, it could be detected consistently. In contrast, other loci may not be captured well by the lower-density 250K SNP panel. The new GWAS revealed 32 additional loci, with only one significantly associated locus being picked up by both 250k and 4M SNPs GWAS (locus 30, Table S3). The detection of only one common locus between the two SNP panels is likely due to differences in resolution, statistical power, and how well each panel captures the genomic regions associated with the trait. ”
Figure 2A and B - I suggest adding the p-value cutoff to the y-axis of the Manhattan Plots
We thank the reviewer for this suggestion, however this is not appropriate. The genome wide p-value cutoffs for GWAS studies are arbitrary, and we have not used a genome-wide cutoff for our SNPs, but rather used cutoffs depending on the minor allele frequency. Therefore, we think adding a straight line to the graphs in Fig. 2A-B representing the overall cutoff, would be misleading. Please see below the text where we explain how the threshold was calculated for individual groups of SNPs with varying MAF:
“The GWAS associations were evaluated for minor allele count (MAC) and association strength above the Bonferroni threshold with -log10(p-value/#SNPs), calculated for each sub-population of SNPs above threshold MAC (Table S3, Bonf.threshold.MAC.specific)”
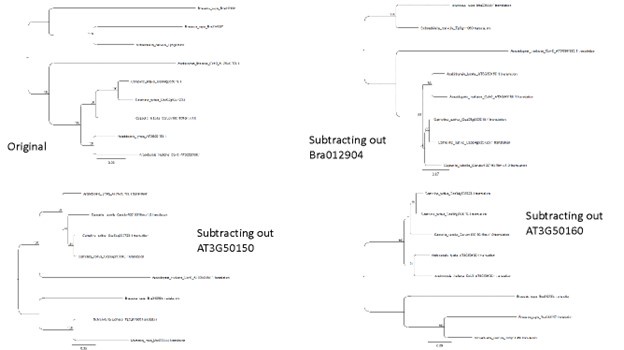
Line 490-492 - Presents the results of the gene tree to support a model in which SR3G diverged from AT3G50150 prior to the speciation events leading to Capsella and Arabidopsis. But this topology requires at least two independent losses of SR3G - can you rule out the hypothesis that the position of SR3G on the gene tree is a result of long branch attraction? Given the syntenic orientation of AT3G50150 and SR3G, and apparent directional selection experienced by the latter lineage, it seems more parsimonious that AT3G50150 and SR3G arose from a very recent duplication event.
We agree with the reviewer that it seemed most parsimonious for AT3G50160 (SR3G) to be a recent tandem duplication of AT3G50150 – and this was certainly our expectation given the other tandem duplications that have occurred in this genomic region. However, irrespective of the type of alignment from which we built the phylogeny (nucleotide vs AA; sometimes nucleotide is noisier but provides more information) we were never able to recapitulate a tree where AT3G50160 was immediately sister to AT3G50150 – even with a long branch for AT3G50160 indicating a rapid pace of nucleotide/AA change relative to AT3G50150. In regards to long branch attraction, it is our interpretation that long branch attraction typically requires multiple long branches that get placed together at a poorly supported node where sampling is sparse (https://www.nature.com/articles/s41576-020-0233-0), whereas we have the single long branch for AT3G50160, and all other A/C clade (Arabidopsis/Camelina/Capsella) members forming a lineage with a much shorter branch. To test the possibility of long branch attraction we subtracted out individual members of the AT3G50150/160 clade to see if there was algorithmic uncertainty in the placement of AT3G50160. We did not observe this in any of the branch subtractions that we performed (see below). Thus, it appears that we must stick with our original interpretation. If the reviewer would like us to soften this interpretation, we would be more than happy to do so, as it does not impact the overall conclusions for AT3G50160 being a rapidly evolving member of this clade.
Author response image 1.
Line 494 (and throughout) - I expect that all of the genes being studied herein are "experiencing selection," even if it's boring-old purifying selection on functionally conserved proteins. I think you mean to say "directional selection."
We thank the reviewer for this comment and completely agree that we lacked precision on our statement. We have corrected this throughout the manuscript.
Line 497 - state the background and foreground values of omega, here.
We apologize for not including these values and have added them at this point in the manuscript (new Table S6).
Line 511 and Line 673 - Inspection of Figure S13B suggests that SR3G is not "predominantly" expressed nor does it have the "highest enrichment" in the root stele. Certainly, among root cell types, this is predominant. But it appears to be quite highly expressed in late-stage seeds and some floral organs, as well.
We appreciate the reviewer for recognizing that SR3G is not a highly expressed gene. In root cell types, its expression is enriched in the root stele. Overall, SR3G is expressed at both early and later developmental stages. Our investigation of later developmental stages related to seed production did not reveal any significant phenotypic differences in fertility.
Line 514 - "54-folds" should be "54-fold."
Thanks. We made corrections.
Figure 7 - For symmetry, I suggest adding the "Beginning of salt stress" arrow to the "Early Stress" panel as well (even if it's right at day 0).
Thanks. We added the arrow to Early Stress in both Panels A and B.
Figure S2 - both graphs should have the same scale on the y-axis
Thanks - we have now re-plotted the graph with the matching y-axis scales.
Line 531 - I feel that this is a significant overstatement. The strongest statement supported by the results presented here is that SR3G is the most prominent DUF247 studied herein in root development under salt stress.
Thanks for the comments. We rephrase the statement.
“These results suggest that SR3G is the most prominent DUF247 studied within our study to affect root development under salt stress.”
Lines 583-605 - These data seem to me to be tangential to the central aims of the study. I suggest removing them for clarity/brevity.
We greatly appreciate the reviewer's suggestion. Our study primarily focused on characterizing the main GWAS candidate, SR3G. Since SR3G is located within a cluster of other DUF247 genes on chromosome 3, we believe that screening the neighboring DUF247 genes could provide further insights into SR3G’s role in root development. Additionally, we believe that the generated data and lines will serve as a valuable resource for other researchers interested in studying these genes. For these reasons, we have decided to retain these datasets in the manuscript.
Lines 650-652 - these sections 1-3 differences in suberization between SR3G and Col-0 under control conditions are not significant. At best, this may be described as a "trend" and not "higher levels." In section 4, it is VERY marginally significant (and probably not at all after the large number of tests performed, here.)
We appreciate the reviewer's feedback and have revised the wording accordingly.
Line 660 - this statement is only true for Section 1. I suggest adding this caveat.
We appreciate the reviewer's comments on this matter. We quantified four suberin monomers in whole root seedlings rather than in individual root sections due to the technical challenges of separating the sections without microscopy and the limited availability of samples for GS-MS analysis.
-
-
eLife assessment
Through cellular, developmental, and physiological analysis, this valuable study identifies a gene that functions to regulate the relative growth of roots and shoots under salt stress. The holistic approach taken provides solid evidence that this gene, a member of a larger tandemly duplicated gene family initially highlighted by association mapping, as well as an upstream regulator contribute to salt tolerance. More robust statistical or biological support for some conclusions could further strengthen this manuscript. The manuscript will be of interest to plant biologists studying mechanisms of abiotic stress tolerance and gene family evolution.
-
Reviewer #1 (Public Review):
Summary:
The authors aim to assess the effect of salt stress on root:shoot ratio, identify the underlying genetic mechanisms, and evaluate their contribution to salt tolerance. To this end, the authors systematically quantified natural variations in salt-induced changes in root:shoot ratio. This innovative approach considers the coordination of root and shoot growth rather than exploring biomass and the development of each organ separately. Using this approach, the authors identified a gene cluster encoding eight paralog genes with a domain-of-unknown-function 247 (DUF247), with the majority of SNPs clustering into SR3G (At3g50160). In the manuscript, the authors utilized an integrative approach that includes genomic, genetic, evolutionary, histological, and physiological assays to functionally assess the …
Reviewer #1 (Public Review):
Summary:
The authors aim to assess the effect of salt stress on root:shoot ratio, identify the underlying genetic mechanisms, and evaluate their contribution to salt tolerance. To this end, the authors systematically quantified natural variations in salt-induced changes in root:shoot ratio. This innovative approach considers the coordination of root and shoot growth rather than exploring biomass and the development of each organ separately. Using this approach, the authors identified a gene cluster encoding eight paralog genes with a domain-of-unknown-function 247 (DUF247), with the majority of SNPs clustering into SR3G (At3g50160). In the manuscript, the authors utilized an integrative approach that includes genomic, genetic, evolutionary, histological, and physiological assays to functionally assess the contribution of their genes of interest to salt tolerance and root development.
Strengths:
The holistic approach and integrative methodologies presented in the manuscript are essential for gaining a mechanistic understanding of a complex trait such as salt tolerance. The authors focused on At3g50160 but included in their analyses additional DUF247 paralogs, which further contributes to the strength of their approach. In addition, the authors considered the developmental stage (young seedlings, early or late vegetative stages) and growth conditions of the plants (agar plates or soil) when investigating the role of SR3G in salt tolerance and root or shoot development.
Weaknesses:
The authors' claims and interpretation of the results are not fully supported by the data and analyses. In several cases, the authors report differences that are not statistically significant (e.g., Figures 4A, 7C, 8B, S14, S16B, S17C), use inappropriate statistical tests (e.g., t-test instead of Dunnett Test/ANOVA as in Figures 10B-C, S19-23), present standard errors that do not seem to be consistent with the post-hoc Tukey HSD Test (e.g., Figures 4, 9B-C, S16B), or lack controls (e.g., Figure 5C-E, staining of the truncated versions with FM4-64 is missing).
In other cases, traits of root system architecture and expression patterns are inconsistent between different assays despite similar growth conditions (e.g., Figures S17A-B vs. 10A-C vs. 6A, and Figures S16B vs. 4A/9B), or T-DNA insertion alleles of WRKY75 that are claimed to be loss-of-function show comparable expression of WRKY75 as WT plants. Additionally, several supplemental figures are mislabeled (Figures S6-9), and some figure panels are missing (e.g., Figures S16C and S17E).
Consequently, the authors' decisions regarding subsequent functional assays, as well as major conclusions about gene function, including SR3G function in root system architecture, involvement in root suberization, and regulation of cellular damage are incomplete.
-
Reviewer #2 (Public Review):
Salt stress is a significant and growing concern for agriculture in some parts of the world. While the effects of sodium excess have been studied in Arabidopsis and (many) crop species, most studies have focused on Na uptake, toxicity, and overall effects on yield, rather than on developmental responses to excess Na, per se. The work by Ishka and colleagues aims to fill this gap.
Working from an existing dataset that exposed a diverse panel of A. thaliana accessions to control, moderate, and severe salt stress, the authors identify candidate loci associated with altering the root:shoot ratio under salt stress. Following a series of molecular assays, they characterize a DUF247 protein which they dub SR3G, which appears to be a negative regulator of root growth under salt stress.
Overall, this is a …
Reviewer #2 (Public Review):
Salt stress is a significant and growing concern for agriculture in some parts of the world. While the effects of sodium excess have been studied in Arabidopsis and (many) crop species, most studies have focused on Na uptake, toxicity, and overall effects on yield, rather than on developmental responses to excess Na, per se. The work by Ishka and colleagues aims to fill this gap.
Working from an existing dataset that exposed a diverse panel of A. thaliana accessions to control, moderate, and severe salt stress, the authors identify candidate loci associated with altering the root:shoot ratio under salt stress. Following a series of molecular assays, they characterize a DUF247 protein which they dub SR3G, which appears to be a negative regulator of root growth under salt stress.
Overall, this is a well-executed study that demonstrates the functional role played by a single gene in plant response to salt stress in Arabidopsis.
The abstract and beginning of the Discussion section highlight the "new tool" developed here for measuring biomass accumulation. I feel that this distracts from the central aims of the study, which is really about the role of a specific gene in root development under salt stress. I would suggest moving the tool description to less prominent parts of the manuscript.
-
