A shade-responsive microprotein in ATHB2 regulates Arabidopsis growth and root development
Curation statements for this article:-
Curated by eLife

eLife Assessment
Through a genome-wide screen for functional alternative transcription start sites (TSS) in Arabidopsis, the authors provide evidence for widespread transcription of potential microproteins from previously annotated protein-coding genes. Functional analysis of AtHB2-miP, derived from the C-terminal region of transcription factor AtHB2 and predicted to form non-productive dimers with ATHB2, suggested that this microprotein could affect AtHB2 functions in shade responses, root growth, and iron homeostasis. The work is valuable as a case study of how new microproteins could act to modulate gene regulation in response to environmental change, and the strength of evidence presented is solid. Overall genetic evidence largely supports this model thereby identifying a novel negative feedback loop operating during shade-regulated growth. This paper also suggests a new unsuspected link between ATHB2 function and iron uptake.
This article has been Reviewed by the following groups
Listed in
- Evaluated articles (eLife)
Abstract
Shade triggers widespread changes in transcript isoform production in Arabidopsis thaliana. Using 5’ PEAT sequencing, we identified 377 candidate microprotein-encoding transcripts arising from alternative transcription start sites, including one located within the third exon of ATHB2, a class II HD-ZIP transcription factor central to shade avoidance. The encoded microprotein, ATHB2miP, lacks the DNA-binding homeodomain but retains the leucine zipper domain, through which it forms heterodimers with full-length ATHB2, inhibits its DNA-binding activity, and disrupts its localization to nuclear photobodies. Ectopic expression of ATHB2miP phenocopies loss of ATHB2, deregulating genes involved in auxin signaling, root development, and iron homeostasis. Complementation of the athb2 mutant with a construct carrying a silent mutation at the ATHB2miP start codon results in exaggerated hypocotyl elongation under both white light and shade, demonstrating that ATHB2miP is required to restrain excessive elongation growth. Immunoprecipitation mass spectrometry confirmed that this mutation redirects translation to alternative initiation sites, producing distinct proteoforms absent from wild-type plants. Additionally, ATHB2 suppresses iron uptake genes, and iron availability modulates shade growth responses in an ATHB2-dependent manner. Together, these findings establish ATHB2miP as a regulator of an ATHB2 feedback circuit that integrates light and nutritional signals to coordinate shoot elongation and root development.
Article activity feed
-

eLife Assessment
Through a genome-wide screen for functional alternative transcription start sites (TSS) in Arabidopsis, the authors provide evidence for widespread transcription of potential microproteins from previously annotated protein-coding genes. Functional analysis of AtHB2-miP, derived from the C-terminal region of transcription factor AtHB2 and predicted to form non-productive dimers with ATHB2, suggested that this microprotein could affect AtHB2 functions in shade responses, root growth, and iron homeostasis. The work is valuable as a case study of how new microproteins could act to modulate gene regulation in response to environmental change, and the strength of evidence presented is solid. Overall genetic evidence largely supports this model thereby identifying a novel negative feedback loop operating during shade-regulated …
eLife Assessment
Through a genome-wide screen for functional alternative transcription start sites (TSS) in Arabidopsis, the authors provide evidence for widespread transcription of potential microproteins from previously annotated protein-coding genes. Functional analysis of AtHB2-miP, derived from the C-terminal region of transcription factor AtHB2 and predicted to form non-productive dimers with ATHB2, suggested that this microprotein could affect AtHB2 functions in shade responses, root growth, and iron homeostasis. The work is valuable as a case study of how new microproteins could act to modulate gene regulation in response to environmental change, and the strength of evidence presented is solid. Overall genetic evidence largely supports this model thereby identifying a novel negative feedback loop operating during shade-regulated growth. This paper also suggests a new unsuspected link between ATHB2 function and iron uptake.
-
Reviewer #2 (Public review):
The authors have addressed some of my concerns and made more transgenic lines to verify the pattern and function of ATHB2-miP produced from the alternative TSS. However, I'm still not convinced by the new data and have questions about their interpretations.
(1) I find it hard to understand the data shown in Figure 5.
a. Figure 5B: It's reasonable that the peptide I was detected exclusively in ATHB2-WT because it was at a position before the alternative TSS. It's hard to evaluate peptide II because it could be included in ATHB2miP depending on the exact position; the authors should clearly label it and clarify. However, I had a hard time understanding why peptides III and IV were detected only in ATHB2-WT and peptide V only in ATHB2-alt-all three peptide regions should be included in both ATHB2-WT and …
Reviewer #2 (Public review):
The authors have addressed some of my concerns and made more transgenic lines to verify the pattern and function of ATHB2-miP produced from the alternative TSS. However, I'm still not convinced by the new data and have questions about their interpretations.
(1) I find it hard to understand the data shown in Figure 5.
a. Figure 5B: It's reasonable that the peptide I was detected exclusively in ATHB2-WT because it was at a position before the alternative TSS. It's hard to evaluate peptide II because it could be included in ATHB2miP depending on the exact position; the authors should clearly label it and clarify. However, I had a hard time understanding why peptides III and IV were detected only in ATHB2-WT and peptide V only in ATHB2-alt-all three peptide regions should be included in both ATHB2-WT and ATHB2-alt proteins. The silent mutation that disrupted the alternative TSS should not change the full-length ATHB2 protein (Figure 5C)! Please share your insights on this strange observation.
b. Figure 5C: Please indicate which ATHB2-WT and ATHB2-alt lines were used in this assay. Please provide a marker for the anti-FLAG immunoblot and indicate protein band sizes in both the Coomassie staining and the anti-FLAG immunoblot. It's unclear to me whether 2 and 3 are two bands-they are too close on the immunoblot to be viewed as two separate bands. It seems to me that both bands 1 and 2 are larger in ATHB2-alt than in ATHB2-WT-is this true, or is it due to a tilted image?
c. Figure 5D: I'm wondering whether both ATHB2-alt lines showed constitutively longer hypocotyl length was caused by higher expression levels of ATHB2 full-length proteins than in ATHB2-WT lines. The authors didn't compare the protein levels in ATHB2-WT and ATHB2-alt lines. Figure 5C was a pulldown assay, in which the total input of immunoprecipitated proteins was normalized, and thus could not tell us whether the ATHB2-alt line had a higher ATHB2 protein level than the ATHB2-WT line.
(2) Regarding my previous comment #4, I understand that the authors may want to study this in the future. However, since the exact position of the alternative TSS has been released in the manuscript, it's not a problem for readers to find the promoter sequences of ATHB2 and ATHB2miP. I suggest that the authors provide a little more analysis of these two promoters because it's natural for readers to ask about the mechanism by which both promoters drive expression specifically in the SAM and hypocotyl. Do they share cis-elements such as WUS-binding sites, ARR-B elements, or AuxRE?
(3) Regarding my previous comment #7, the authors didn't answer part of my question. I wrote, "The authors claimed that ATHB2 acts as a growth repressor in deep shade but a growth promoter in the canopy and proximity shade (Lines 366-368). However, it appears that regardless of the shade conditions, most mutant and transgenic lines were not significantly different from WT (Figure 4C)." No explanations were provided. Based on Kunihiro et al., 2011 (DOI: 10.1093/pcp/pcr076), overexpressing ATHB2 full-length CDS led to constitutively long hypocotyls. If ATHB2-miP inhibits the function of the full-length ATHB2, one would expect that overexpressing ATHB2-miP might inhibit hypocotyl growth. Interestingly, the performance of 35S::miP was opposite to the prediction and showed different responses in the three WL conditions in Figure 4C-35S::miP was significantly longer in the deep-shade WL control (PAR 13 µmol m-2 s-1) but was the same as WT in the canopy and proximity shade WL controls (45 µmol m-2 s-1). Please provide a reasonable explanation. Besides, one issue remains-the authors only provided one transgenic line each for 35S::miP and t-athb2 35S::miP, and the miP protein levels were not shown in these lines.
-
Reviewer #3 (Public review):
The authors provide an extensively revised version of this manuscript in which they addressed many of the comments. I find their additional work and effort to address the reviewers' suggestions commendable. However, my first concern from the previous round of reviewing remains and I urge the authors to address it.
My concern relates to the shade treatments and the consistency with which they are described. Although the authors added details in the main text, the conditions remain insufficiently defined in the Materials and Methods, in some figure legends and the figures themselves (e.g., Fig. 4).
More importantly, the terms canopy shade and proximity shade are still used incorrectly (in figure 4), please make sure to check this throughout the ms.
In nature, canopy shade combines reduced PAR and reduced R:FR, …
Reviewer #3 (Public review):
The authors provide an extensively revised version of this manuscript in which they addressed many of the comments. I find their additional work and effort to address the reviewers' suggestions commendable. However, my first concern from the previous round of reviewing remains and I urge the authors to address it.
My concern relates to the shade treatments and the consistency with which they are described. Although the authors added details in the main text, the conditions remain insufficiently defined in the Materials and Methods, in some figure legends and the figures themselves (e.g., Fig. 4).
More importantly, the terms canopy shade and proximity shade are still used incorrectly (in figure 4), please make sure to check this throughout the ms.
In nature, canopy shade combines reduced PAR and reduced R:FR, whereas proximity shade primarily involves a reduction in R:FR without reduced PAR. Here, both treatments have the same PAR (45 μmol m⁻² s⁻¹), while the condition termed proximity shade actually has a lower R:FR (0.06) than the condition termed canopy shade (0.15) (see lines 405-407 of the text), while in natural conditions the R/FR ratio is lower under canopy shade than proximity shade. Thus, these designations are inconsistent with their accepted meaning in the field and are likely to confuse readers, particularly non-specialists.
I therefore recommend replacing them (in the figure itself, the legends and text) with terminology that reflects the actual light conditions used (PAR and R/FR), without giving it a name that is confusing. Alternatively, one could imagine that what the authors call canopy and proximity shade are two proximity shade conditions (because compared to WL of the same PAR) with increasing density of neighbouring plants (leading to a reduction of R/FR).
Whatever the authors decide to do, please change the name of the conditions corresponding to PAR 45 microE R/FR 0.06 and PAR 45 microE R/FR 0.15. As suggested above, the latter could be called neighbour shade (PAR 45 microE R/FR 0.15), which would be consistent with the literature and natural conditions (considering that it is compared to WL PAR 45 microE with a high R/FR). The former could then be "strong neighbour competition shade"? Because R/FR is further reduced to 0.06.
-
Author response:
The following is the authors’ response to the original reviews.
We would like to express our sincere gratitude for accepting our manuscript for public review. We are encouraged by the generally positive reception of our work and trust that the revisions we have made adequately address the concerns that were raised.
The revised manuscript reflects this work. The complementation experiment, in which a silent mutation at the ATHB2miP start codon produces a constitutive shade-response phenotype despite an unchanged full-length ATHB2 sequence, provides direct genetic evidence for endogenous ATHB2miP function. Immunoprecipitation mass spectrometry from the same complementation lines further demonstrates that the TTG-to-CTC substitution redirects translation to alternative initiation sites, altering the repertoire of ATHB2 …
Author response:
The following is the authors’ response to the original reviews.
We would like to express our sincere gratitude for accepting our manuscript for public review. We are encouraged by the generally positive reception of our work and trust that the revisions we have made adequately address the concerns that were raised.
The revised manuscript reflects this work. The complementation experiment, in which a silent mutation at the ATHB2miP start codon produces a constitutive shade-response phenotype despite an unchanged full-length ATHB2 sequence, provides direct genetic evidence for endogenous ATHB2miP function. Immunoprecipitation mass spectrometry from the same complementation lines further demonstrates that the TTG-to-CTC substitution redirects translation to alternative initiation sites, altering the repertoire of ATHB2 proteoforms. Together with the FRET-FLIM, EMSA, and transcriptomics data, we believe the revised manuscript makes a compelling and internally consistent case for the proposed regulatory mechanism.
Reviewer #1 (Public review):
Summary:
The authors report evidence for a microprotein of AtHB2-miP. The authors came across HB2 in a screen for alternative transcription start sites in Arabidopsis in response to white light or a white light followed by a far-red light representative of shade. Out of 337 potential microproteins, authors selected AtHB2. At the beginning of the manuscript, it is investigated that an alternative transcription start site of HB2 gene can be used in response to far-red light. The resulting shorter protein form seems to interact with HB2 protein forms, altering the localization of HB2 in transient expression assays. The functionality of HB2-miP overexpression has been addressed in transgenic Arabidopsis lines using a 35S promoter. The responses and phenotypes were compared with either WT or various types of athb2 mutant lines with disrupted HB2 gene. Such mutants and the 35S promoter-driven AtHB2-miP line showed various types of phenotypes versus each other that can be classified as mild or none, e.g. small effects on root growth, iron homeostasis gene expression, and iron contents.
Strengths:
The authors performed an interesting screen for alternative transcription start sites which resulted in 337 candidates (Figure 1A). Principally, it can be interesting to find that plants may use alternative start sites for HB2 in response to shading light. The authors provide evidence that alternative transcription start sites of HB2 can be present and used in response to FR. The possibility that potentially resulting small protein may have effects under FR light, causing alteration of root growth and physiology, is an interesting idea.
We thank Reviewer 1 for this summary and for the constructive criticisms that helped us improve the manuscript considerably.
Weaknesses:
(1) The transient expression experiments are not conducted with much detail to demonstrate that HB2miP is produced and can interact with the regular protein. The localization of HB2 was found to be linked with condensates, but perhaps not in the presence of HB2miP. Clearly, the lack of quantitative and qualitative analysis hampers a clear assessment of this point.
We have addressed this concern at multiple levels. The revised manuscript includes quantified FRET-FLIM lifetime measurements from multiple nuclei, demonstrating a statistically significant reduction in eGFP-ATHB2 fluorescence lifetime when co-expressed with mCherry-ATHB2miP relative to the mCherry control (Fig. 2C, D). This reduction is diagnostic of direct protein-protein interaction and confirms physical interaction in planta. We have also added electrophoretic mobility shift assays (EMSA) using purified recombinant proteins (Fig. 2E). ATHB2 forms a clear retarded complex with a biotin-labeled ATHB2 binding site (CAATGATTG). Titrating increasing amounts of ATHB2miP progressively abolishes complex formation, directly demonstrating that ATHB2miP sequesters ATHB2 into a non-DNA-binding complex. The majority of nuclei expressing eGFP-ATHB2 show distinct photobody or speckle formation, while nuclei expressing eGFP-ATHB2miP show predominantly diffuse nuclear localization. Co-expression of both proteins results in disruption of the speckle pattern, indicating that heterodimer formation prevents ATHB2 from assembling into higher-order condensates.
(2) The authors unfortunately did not provide the data of the screen to demonstrate which concrete candidates may have microProteins and whether there is enrichment of certain functions. There is no supplemental table accompanying Figure 1A.
We apologize for the oversight. The full list of 377 microProtein candidates, including read counts per condition and functional annotation, is now provided in Supplementary Dataset 1.
(3) One of the major unclear points that is also not addressed in the discussion is that the function of miR is studied in overexpression plants (35S promoter::miP). The effects are only compared to wild type and various lines of HB2 knockouts or knockdowns, partly with fairly uncharacterized phenotypes. It can now not be clearly determined whether the miP effects are due to a regular function of miP or due to overexpression of it. A needed control would be a 35S::AtHB2 line, or better at least two different lines (only a single miP overexpression line investigated). Since it has not been assessed by deletion mutant analysis to determine which protein parts of miP are involved in the protein regulation, it cannot be ruled out that the observed miP effects are not naturally occurring but the result of ectopic expression of a protein. Clearly, the effect of miP would be ideally studied in an environment where the levels can be controlled and the resulting phenotypes and protein levels quantified.
This concern has been addressed by three complementary approaches. First, we included here two independent 35S::ATHB2miP lines, both showing elongated hypocotyls consistent with reduced ATHB2 activity, and two independent 35S::ATHB2 full-length lines, which show the opposite phenotype. This rules out T-DNA insertion artifacts and confirms that the direction of the overexpression effects is specific to the protein being overexpressed.
Author response image 1.
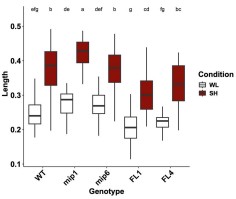
We acknowledge that both overexpression systems are subject to autoregulatory feedback: 35S::ATHB2miP plants sequester ATHB2, thereby relieving its autorepressive loop, which leads to increased endogenous ATHB2 transcription, as confirmed by our RNA-seq data showing elevated reads across ATHB2 exons 1 and 2 in these plants (Fig. S2). Conversely, excess ATHB2 protein in 35S::ATHB2 plants strengthens autorepression of the endogenous locus. We also recognize that overexpressed ATHB2miP can form ATHB2miP: ATHB2miP homodimers, reducing the fraction available to sequester ATHB2. These feedback loops complicate quantitative interpretation but do not alter the qualitative direction of the phenotypes: in both overexpression systems, the data are internally consistent with the proposed model.
Most decisively, the complementation experiment resolves all of these concerns. The ATHB2 WT and ATHB2 alt constructs are driven by the endogenous ATHB2 promoter, produce full-length ATHB2 protein with an identical amino acid sequence, and differ only in the capacity to initiate translation of ATHB2miP from the TTG near-cognate start codon. There is no exogenous overexpression, no homodimerization artifact, and no perturbation of the autoregulatory circuit beyond what ATHB2miP itself normally exerts. Plants carrying ATHB2 alt display constitutively enhanced hypocotyl elongation under both white light and shade. This phenotype cannot be explained by overexpression artifacts or autoregulatory side effects, and directly demonstrates that endogenous ATHB2miP produced from the TTG codon is required to restrain ATHB2 activity in planta. The overexpression data and the complementation data thus converge on the same conclusion through independent and mechanistically distinct approaches.
(4) It is not shown that the microprotein is generated in Arabidopsis in response to shade, e.g. through Western or fluorescence protein detection. The main idea that the authors want to claim has not been addressed in Arabidopsis. There are no localization experiments of HB2 protein data in the presence of miP in Arabidopsis.
We provide three independent lines of evidence supporting in planta production of ATHB2miP. First, ribosome profiling (Ribo-seq) reveals significantly elevated translational activity across the second half of the ATHB2 locus specifically after 45 minutes of shade treatment (see Author response image 2), consistent with preferential translation of the ATHB2miP isoform under shade. This dataset is part of a separate study currently in preparation; however, given its direct relevance to the question of ATHB2miP translation, we include the ATHB2 locus data here.
Author response image 2.
Ribo-seq coverage across the ATHB2 locus. Coverage from seedlings grown under white light is shown in blue, after 45 min of shade in red, and after 90 min of shade in green. Notably, translation appears to increase under shade specifically in the second half of the gene.
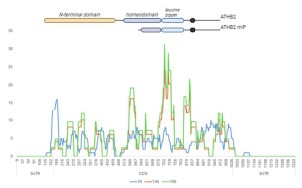
Secondly, the pATHB2miP::GUS reporter drives GUS expression in the shoot apical meristem and hypocotyl, demonstrating that sequences within the ATHB2 gene body are sufficient to promote transcription and translation in these tissues (Fig. 1E, G). Third, the ATHB2 alt complementation lines produce wild-type ATHB2 protein but cannot produce ATHB2miP, and they display constitutively enhanced elongation growth precisely as predicted by the model (Fig. 5D). Fourth, immunoprecipitation mass spectrometry from ATHB2 WT and ATHB2 alt complementation lines reveals distinct sets of ATHB2-related peptides in each genotype, demonstrating that the TTG-to-CTC substitution fundamentally alters ATHB2 proteoform composition (Fig. 5B). Collectively, these data provide robust genetic and biochemical support for endogenous ATHB2miP function even without direct protein visualization.
(5) The plants with altered HB2 forms seem to grow well and the recorded phenotypes are rather minor. Photos are not shown. At some point, the authors discuss that there could be redundancy or that HB2miP might interact with other HB proteins. However, such protein interactions have not been experimentally investigated.
The complementation experiment (ATHB2 alt lines) reveals a strong and reproducible phenotype: exaggerated hypocotyl elongation under both white light and deep shade, exceeding all other genotypes tested. This demonstrates that, when examined in the appropriate genetic context, loss of ATHB2miP has a clear consequence for growth. Regarding interactions with other HD-ZIPII proteins: the Arabidopsis Interactome Initiative (Science, 2011) provides experimental evidence that ATHB2 heterodimerizes with HAT2, HAT3, and HAT14. Since the leucine zipper domain mediates dimerization within the HD-ZIPII class and ATHB2miP retains this domain, heterodimer formation with additional family members is structurally expected. The stronger phenotype of 35S::miP plants relative to t-athb2 single mutants under certain conditions is consistent with this interpretation and is now discussed explicitly in the revised Discussion.
Reviewer #1 (Recommendations for the authors):
The authors unfortunately did not provide the data of the screen. There is no supplemental table accompanying Figure 1A.
The full list of 377 microProtein candidates is now provided in Supplementary Dataset 1. We apologize for not making this available in the original submission.
(1) Title: seems repetitive: "elongation growth and root development"
The title has been shortened to remove redundancy.
(2) Introduction: (a) It seems very long and does not always address the central open questions. There is also previously published work on AtHB protein involvement in relation to growth and iron homeostasis (e.g. Capella et al. 2015). Perhaps the authors will suggest in the discussion a certain model of action. That could be better introduced to understand the importance of the findings. Hence, it would appear necessary to provide the current state of knowledge on AtHB proteins, their functions, and open questions to allow readers to better understand the connection between plant growth and iron homeostasis. This point did not come across in the Discussion, either.
(b) Line 134-135: is this a general definition of microproteins?
(a) The Introduction has been revised for focus and concision. A paragraph on the known functions of HD-ZIPII proteins beyond shade avoidance has been added, including roles in seed germination (Tognacca et al., 2021) and leaf cell proliferation (Carabelli et al., 2018).
(b) We amended the text.
(3a) Line 171ff: Would be helpful to explain the procedure briefly and explain what has been expected, also with respect to the shade experiment.
Shade avoidance is well characterized at the transcriptional level, but whether shade also reshapes the proteome through alternative transcription start site usage had not been explored. We reasoned that shade-induced changes in TSS selection could generate truncated protein isoforms lacking specific functional domains, which could modulate the activity of their full-length counterparts. The 5'PEAT-seq approach enriches for capped transcript 5' ends, allowing genome-wide identification of active TSSs at single-nucleotide resolution and direct comparison between white light and shade conditions. A brief explanation of the rationale has been added to the Results section.
(3b) Line 176ff: Would be helpful to explain how the findings fit with expectations, e.g. in the context of shade experiments.
Among the 377 microProtein candidates, ATHB2 stood out as the only well-characterized shade avoidance regulator, and the alternative protein it encodes retains the leucine zipper domain, suggesting it could interfere with the dimerisation-dependent DNA-binding activity of full-length ATHB2. This combination of biological relevance and a clear mechanistic hypothesis made ATHB2miP the natural choice for functional characterization. This context has been added to the Results.
(3c) Line 190: 377 potential microProteins candidates were identified. However, this finding is not further explained. What kind of microProteins were there? Were enrichment studies conducted and what did they show? How related were proteins to the shade response? Was the approach successful? Finally, only a single candidate was picked and studied. What were the criteria? There is no list of 377 microproteins provided, although this is a result mentioned in Figure 1A.
The full list of candidates with functional annotations is provided in Supplementary Dataset 1. Among the candidates, ATHB2 was selected based on its status as a well-characterized shade avoidance regulator and its structural similarity to the LITTLE ZIPPER microProteins, which regulate HD-ZIPIII factors through the same competitive dimerization mechanism. The rationale for candidate selection has been expanded in the Results section and directed readers to Supplementary Dataset 1.
(3d) Line 220: Would be helpful to explain why this control is chosen, and what aspect of the experiment it should control.
The pATHB2control::GUS construct is identical to pATHB2miP::GUS except that GUS is fused out of frame with the alternative protein sequence. Its lack of signal confirms that the expression observed in pATHB2miP::GUS requires the correct reading frame and cannot be explained by transcriptional read-through or leaky expression from the ATHB2 gene body. This explanation has been added to the Results.
(3e) Line 228: Is this typical for a microprotein regulation?
There is no established precedent for what is "typical" in this context, as genome-wide studies of alternative TSS-derived microProteins remain scarce. Our study is among the first to show systematically that environmental signals can induce alternative TSS usage to produce regulatory microProteins from within existing gene loci, which is itself a novel finding. This point has been made explicit in the text.
(3f) Figure 1A-C: Would be helpful to explain abbreviations.
All abbreviations in Figure 1 have been defined in the figure legend.
(3g) Figure 1A-C: There is no quantification of miP formation in response to FR; hence the data is not yet convincing.
The figure title has been revised to remove the implication that microProtein production has been directly quantified at the protein level. The 5'PEAT-seq data in Figure 1B are inherently quantitative, with read counts at the alternative TSS showing a clear peak at 45 minutes of shade. The pATHB2miP::GUS reporter requires both transcription from the alternative promoter region and translation in the correct reading frame, as demonstrated by the out-of-frame control (Fig. 1F), making it a functional readout of the capacity of this locus to produce protein from the alternative TSS.
(3h) Figure 1E-G: GUS staining should be done with and without the FR treatments used in Figures 1A-C.
All seedlings shown in Figures 1E-G were subjected to deep shade treatment prior to sampling, as now stated explicitly in the figure legend.
(3i) Line 232/233: Would be helpful to explain why the authors expected that.
The LITTLE ZIPPER proteins are short leucine zipper-containing proteins related to the HD-ZIPIII family. They inactivate HD-ZIPIII transcription factors by forming non-productive heterodimers through their shared leucine zipper domain. Since ATHB2miP likewise retains only the leucine zipper of ATHB2 while lacking the homeodomain, we predicted by direct analogy that it would inhibit ATHB2 through the same competitive dimerization mechanism. This reasoning has been made explicit in the text.
(3j) Figure 2: A, The different localization patterns are not quantified. C, The images seem to indicate different localization. Real co-localization and its quantification between ATHB2 and AtHB2miP or AtHB2HD is lacking, especially pointing out in better detail whether there are changes over time of microprotein expression. Explanations of statistics are lacking.
Localization patterns have been quantified and the counts added to Figure 2A. The majority of nuclei expressing eGFP-ATHB2 showed distinct photobody or speckle formation, consistent with ATHB2 homodimerization driving higher-order nuclear condensate assembly. Nuclei expressing eGFP-ATHB2miP showed predominantly diffuse nuclear localization. Co-expression of ATHB2 and ATHB2miP (Fig. 2C) disrupted the speckle pattern, indicating that heterodimers are incompetent to form or maintain condensates. The FRET-FLIM data in Figure 2D provide the most rigorous measure of spatial proximity, demonstrating physical interaction at the nanometer scale. Statistical details are now described in the figure legend.
(3k) Are protein interactions affected by light treatments?
This is a well-framed question. The FRET-FLIM experiments were performed under standard light conditions. Testing whether the interaction strength is light-dependent would require stable transgenic lines expressing both fusion proteins in Arabidopsis, which are beyond the scope of this revision. The genetic complementation data indicate that the functional consequence of the interaction is most pronounced under shade, even if the interaction itself may not be light-regulated. We note this as a direction for future work.
(3l) Line 270: It would be helpful to explain whether it is structurally expected that the different proteins interact.
Yes, interaction is structurally predicted. Both ATHB2 and ATHB2miP contain a leucine zipper domain, a well-characterized coiled-coil dimerization motif. It has been established that the leucine zipper is both necessary and sufficient for dimerization among HD-ZIP proteins (Sessa et al., 1993). Heterodimer formation between ATHB2 and ATHB2miP is therefore a direct structural prediction. This has been stated explicitly in the revised text.
(3m) Line 292ff: The g, e gxe effects have not been studied nor the true effects of miP since the proper genetic effects cannot be compared in the setup. Is the background of 35S::miP wild type? If so, what is the effect of endogenous miP? In any case, a control of 35S::Full-length protein would be important for comparison, since it cannot be ruled out that effects are due to ectopic overexpression rather than miP. The proper controls are needed to not draw any misleading conclusions.
The experimental design compares three genotypes (Col-0, t-athb2, and 35S::ATHB2miP) under three light conditions, allowing identification of genes whose expression depends on genotype, environment, and their interaction. A 35S::ATHB2 full-length line has now been included in the growth assays (see above). Its inclusion in the RNA-seq experiment would require an additional sequencing run beyond the scope of this revision; however, the convergence of the t-athb2 and 35S::ATHB2miP transcriptomes on the same set of differentially expressed genes, achieved through two mechanistically independent perturbations of ATHB2 activity, provides strong evidence that the observed transcriptional changes reflect genuine loss of ATHB2 function rather than overexpression artifacts.
(3n) Line 310: "Having established" must be carefully rephrased. It has not been shown that ectopic miP expression perturbs AtHB2 function.
We respectfully disagree. The convergence of the t-athb2 and 35S::ATHB2miP transcriptomes on the same set of differentially expressed genes, through two mechanistically independent perturbations of ATHB2 activity, demonstrates that ectopic ATHB2miP expression perturbs ATHB2 function. Furthermore, the ATHB2 alt complementation data provide direct genetic evidence that endogenous ATHB2miP restrains ATHB2 activity in planta. The phrase "having established" is therefore accurate in context and has been retained.
(3o) Line 310ff: Would be helpful to explain the outcome of differential expression in response to light treatments. Were the responses expected? How did they compare to the experiment described in Figure 1?
Differential gene expression under increasing shade duration revealed progressive induction of auxin biosynthetic genes and known shade-avoidance targets in wild-type plants, consistent with established shade transcriptomics. In t-athb2 and 35S::ATHB2miP plants, this response was amplified and accompanied by constitutive upregulation of iron homeostasis and root development genes, even in white light. These findings are consistent with ATHB2 acting as a transcriptional repressor of these programs, and with ATHB2miP relieving this repression at the onset of shade. A brief discussion of this interpretation has been added to the Results.
(3p) Figure 3A-C: More information should be added to the figures or the data representation should be improved. What do these expression patterns mean? The relevant information cannot be grasped.
Figure 3 presents the statistical output of the differential expression analysis and cluster analysis. The heatmap in panel A displays expression levels of the 95 genes whose expression shows a significant genotype-by-environment interaction, with the color scale indicating CPM values. Panel B shows the expression trajectories of genes within three selected clusters across genotypes and shade conditions; the y-axis reflects expression change and the x-axis the genotype-condition combinations. The biological interpretation of these patterns is provided in the Results section, where we discuss the gene ontology enrichments associated with each cluster. The complete gene lists for all 17 clusters, including annotations, are provided in Supplementary Dataset 3, which allows readers to examine the data in full detail. Given the number of genes involved, a figure of this type necessarily presents a statistical overview rather than a gene-by-gene interpretation, and we believe the combination of the figure and the accompanying text and supplementary data provides sufficient context for readers to evaluate the findings.
(3q) The tables are not labeled and it is not written what is represented.
Table legends have been added to both tables. Table 1 lists DEGs related to auxin biology and hypocotyl elongation that are upregulated in both 35S::ATHB2miP and t-athb2 plants relative to wild type, with columns for gene identifier, annotation, log2 fold change in 35S::ATHB2miP, and log2 fold change in t-athb2. Table 2 lists the equivalent information for DEGs related to root development.
(3r) Figure 4: Same comment as above in comment l, it is hard to assign effects properly to miP if there is no control on full-length proteins expressed behind the 35S promoter. There should be a clear scheme, depicting which athb2 mutant has which exact genomic structure.
A schematic depicting the genomic structure and predicted protein product of each allele is provided in Figure 4A. Regarding the 35S::ATHB2 full-length control: we include data from two independent 35S::ATHB2 lines in this response letter (see our response to Reviewer 1, point 3), but have not added them to the main figures as we feel the ATHB2 alt complementation experiment addresses this concern more directly and cleanly. In those lines, full-length ATHB2 protein is produced from the endogenous promoter with an identical amino acid sequence, but ATHB2miP cannot be translated. The resulting phenotype is unambiguous and cannot be attributed to overexpression artifacts.
(3s) Line 366ff: Based on which comparisons did authors get to this conclusion? Perhaps it is overstated.
We agree the original statement was overstated. The text has been revised to reflect only what the data support: ATHB2 acts as a growth repressor in deep shade and promotes elongation growth in canopy shade. Under proximity shade, no significant differences in hypocotyl elongation were detected between wild-type and athb2 mutant plants, and this is now stated accordingly.
(3t) Line 372: Do the authors mean really "complemented"?
The reviewer is correct. The 35S::miP construct is not a complementation but an ectopic overexpression in the t-athb2 background. The wording has been changed to "we expressed ATHB2miP in the t-athb2 mutant background."
(3u) Line 405ff: This section should be moved to the Discussion. It is highly speculative and not experimentally addressed.
The speculative passage at lines 405ff has been rewritten.
(3v) Supplementary Figure 2 and line 417: Can you please point out what are the relevant data to look at in Supplementary Figure 2?
We apologize for the confusion. The data referenced at this point in the text are presented in Supplementary Dataset 2, not Supplementary Figure 2. The text has been corrected accordingly.
(3w) Line 445: Why should HB2 be a negative regulator for iron uptake?
The evidence for ATHB2 as a negative regulator of iron uptake comes from two independent loss-of-function contexts: iron levels are elevated in t-athb2 mutants and significantly so in 35S::ATHB2miP plants, where inhibition extends to additional HD-ZIPII family members. The stronger effect in 35S::ATHB2miP suggests that ATHB2 and related HD-ZIPII factors act collectively as repressors of iron uptake gene expression.
(3x) The authors did not show photos of any of the plants. What about shoot growth?
The phenotypes described in this study are quantitative in nature, specifically differences in hypocotyl and root length across multiple genotypes and shade conditions. We believe the quantifications presented in Figures 4 and 6 capture these differences more accurately and informatively than photographs would. Showing representative images for all genotype-condition combinations would add considerable length to the manuscript without providing additional insight beyond what the measurements already convey.
(4a) Line 492: Is the result shown somewhere?
The results are presented in Supplementary Dataset 1. A reference to this dataset has been added to the text at line 492.
(4b) Line 509: Considering that quantitative analysis has not yet been performed, please formulate this carefully.
Quantification has been added to the figure and the statement at line 509 is now supported by the data shown.
(4c) Line 520ff: It is not discussed how to interpret the comparison of HB knockout and miP lines, especially considering that 35S::HB2 is missing.
As described in our response to Reviewer 1 (point 3), the ATHB2 alt complementation experiment addresses this concern more directly than a full-length overexpressor. The distinct phenotype of ATHB2 alt plants, which produce wild-type ATHB2 but no ATHB2miP, provides a clean genetic separation of the two isoforms' functions. This is now discussed in the revised manuscript.
(4d) Line 566/567: "might have stopped growing because of better nutrient supply." Is there any evidence for such assumptions?
This statement appears in the Discussion and is clearly framed as speculative with the use of "might." We consider this appropriate for a discussion section where alternative interpretations are explored, and have retained the wording accordingly.
(4e) Line 572ff: Very far-fetched hypotheses to link immunity, shade, and iron, without showing any precise data on the regulation under such circumstances.
We respectfully disagree that this passage is far-fetched. The connection between shade, iron homeostasis, and immune signaling is grounded in two published findings: shade weakens pathogen defense through hormone homeostasis changes (de Wit et al., 2013), and IRONMAN peptides, which we show are regulated by ATHB2, respond to flagellin perception (Cao et al., 2024). The passage raises this as an open question rather than making a mechanistic claim, which we consider appropriate for a Discussion section. We have therefore retained the text as written.
Reviewer #2 (Public review):
The first portion of the manuscript centered on identifying and confirming the ATHB2 microprotein (ATHB2miP), which constitutes the core message of this study. Overall, I find no issue with the selection criteria employed for identifying alternative microprotein mRNA transcripts. However, I do have some queries that I hope the authors can address for clarity.
We thank Reviewer 2 for the thorough and constructive assessment.
(1) Upon reviewing the supplemental dataset where the authors listed the 377 unique novel miPs, along with those specifically in WL or shade treatments, I sought to comprehend the rationale behind focusing on ATHB2. Have the authors examined the shade response of all 377 potential microprotein candidates? Readers may be intrigued to learn how many of these candidates exhibit induction or repression under shade conditions, and whether such changes correlate positively or negatively with alterations in the full-length TSSs in response to shade. Essentially, I aim to discern the prevalence of microprotein production during shade responses and any shared characteristics among these microprotein transcripts. This inquiry also aims to uncover the existence of a common mechanism regulating microprotein transcription.
Supplementary Dataset 1 provides the full list of 377 microProtein candidates, including read counts, which allows readers to inspect the data themselves. We did not perform a systematic analysis of shade responsiveness across all 377 candidates, nor did we examine correlations between alternative and full-length TSS changes genome-wide. We agree this would be informative and note it as a direction for future work.
ATHB2 was selected from the candidate list on the basis of two criteria. First, the alternative protein it encodes retains a leucine zipper domain and thereby resembles the LITTLE ZIPPER microProteins, which regulate HD-ZIPIII transcription factors through competitive dimerization, providing a clear mechanistic hypothesis. Second, ATHB2 is one of the best-characterized shade avoidance regulators in Arabidopsis, making it possible to evaluate the biological consequences of ATHB2miP production in a well-defined molecular framework.
(2) To confirm that ATHB2miP stems from an independent transcription event, the authors sequenced full-length cDNAs using PacBio IsoSeq. However, I find the information regarding isoseq missing from the manuscript. My assumption is that the full-length cDNAs were reverse transcribed from mRNAs isolated from whole seedlings, where mature mRNAs in the cytoplasm predominate, making it challenging to evaluate whether a specific mRNA undergoes post-transcriptional processing. One approach to confirming ATHB2miP as a product of independent transcription involves examining nascent mRNA produced in the nucleus. The authors may need to isolate nascent mRNAs associated with RNA Polymerase II in the nucleus from seedlings treated with shade for 45 min, and then perform reverse transcription and PacBio Iso-Seq.
We acknowledge this limitation. The full PacBio Iso-Seq dataset has been deposited to GEO. We have avoided placing the main weight of the argument on transcript origin. Instead, we focus on independent functional evidence. The pATHB2miP::GUS reporter demonstrates that the region upstream of the TTG near-cognate start codon within the ATHB2 gene body contains promoter activity sufficient to drive expression in the shoot apical meristem and hypocotyl. The absence of signal in the out-of-frame control (pATHB2control::GUS) confirms that this expression requires translation initiation at the correct reading frame, consistent with the predicted Kozak context of the TTG codon identified by TISpredictor. Together with the ATHB2 alt complementation data, which demonstrate that mutating this TTG codon abolishes the microProtein's regulatory function in vivo, these results establish that the TTG codon serves as a functional translation initiation site regardless of whether the shorter transcript arises from independent transcription or post-transcriptional processing.
(3) The authors noted the identification of two potential start codons, TTG and CTG, in the alternative TSS of ATHB2 using TISpredictor. Yet, it's imperative to identify the actual translation initiation site and the full-length sequence of ATHB2miP. I suggest the authors fuse an epitope tag (e.g., 3xFLAG) to the C-terminus of ATHB2 (utilizing the genomic sequence of ATHB2) and generate transgenic lines to be treated with shade to induce ATHB2miP-3xFLAG production. Affinity purification (anti-FLAG beads) and mass spectrometry can then identify the actual start site of ATHB2miP. This step is crucial, as the current ATHB2miP used may not be the exact sequence, and any observed phenotype could be artifacts arising from these lines.
We carried out exactly this approach. Transgenic lines expressing a C-terminal triple FLAG tag from the genomic ATHB2 locus were generated, subjected to shade treatment, and used for nuclear enrichment, anti-FLAG immunoprecipitation, and mass spectrometry analysis. We detected ATHB2-derived peptides by IP-MS (Fig. 5B), confirming that the FLAG-tagged protein was successfully enriched. However, we did not recover a peptide spanning the ATHB2miP N-terminus that would directly identify the translation initiation site, most likely because ATHB2miP is expressed transiently and at low abundance. We therefore cannot assign the functional start site by mass spectrometry alone. The functional evidence, however, points unambiguously to TTG. The ATHB2 alt construct carries a TTG-to-CTC substitution at this position. Because both codons encode leucine, the full-length ATHB2 protein sequence is unchanged. Yet plants carrying ATHB2 alt display constitutively enhanced hypocotyl elongation under both white light and shade, while ATHB2 WT-complemented plants restore wild-type growth. The only functional difference between these constructs is the capacity to initiate translation from TTG, providing a direct in vivo assignment of this codon as the physiologically relevant start site. Consistent with this, IP-MS revealed distinct peptide profiles between ATHB2 WT and ATHB2 alt plants (peptides I-IV detected exclusively in ATHB2 WT; peptide V exclusively in ATHB2 alt; Fig. 5B), demonstrating that the TTG-to-CTC substitution fundamentally alters which ATHB2 proteoforms are produced. Anti-FLAG immunoblotting detected full-length ATHB2 and ATHB2miP in ATHB2 WT plants; in ATHB2 alt plants, ATHB2miP was replaced by two alternative bands: one slightly larger and one smaller. These findings are consistent with translation initiating from alternative start sites when TTG is mutated (Fig. 5C).
(4) My confusion arose when analyzing the results in Figures 1E - G. The authors didn't specify whether these plants were subjected to shade treatment. What are the sequences within the second intron and third exon excluded from pATHB2control::GUS that promote transcription and translation? Have the authors examined the sequence features? This information is pivotal and related to the above question #1 because it may tell us whether the sequence feature is shared by other miP candidates.
All seedlings shown in Figures 1E-G were subjected to deep shade treatment prior to sampling. This is now clearly stated in the figure legend. The pATHB2miP::GUS construct contains the genomic sequence immediately upstream of the TTG near-cognate start codon, encompassing elements within the second intron and third exon absent from the control construct. The activity of this sequence in the shoot apical meristem and hypocotyl indicates the presence of a functional promoter. Characterization of the specific sequence features responsible is an interesting question we note as a direction for future work.
The latter part of the manuscript focused on the functional characterization of ATHB2miP. The approaches adopted by the authors resemble those used in studying antimorphic (dominant negative) alleles. However, I have several concerns regarding the approaches and conclusions.
(5) Firstly, as mentioned in question #3, the authors did not map the actual translation initiation site of ATHB2miP. Therefore, all constructs involving ATHB2miP, such as eGFP-ATHB2miP, BD-ATHB2miP, and mCherry-ATHB2miP in Figure 2, and 35S::miP in Figures 3-5, may contain extra amino acids in the N-terminus, given that epitope tags were all added to the N-terminus. These additional amino acids could potentially impact the behavior of ATHB2miP and lead to artifacts. Identifying the translation initiation site in ATHB2miP would facilitate the development of tools to disrupt ATHB2miP expression without affecting full-length ATHB2 expression. For instance, if the "CTG" before the leucine zipper domain is confirmed as the translation initiation site, mutating it to another Leu codon (e.g., TTA) could generate transgenic lines using the genomic sequence of ATHB2, including this mutation, to evaluate the impact of losing ATHB2miP on shade responses.
We acknowledge that all constructs used, including the eGFP/mCherry fusions, GAL4 domain fusions, the recombinant GST protein for EMSA, and the 35S::ATHB2miP overexpression line, carry N-terminal additions. To resolve this, we carried out precisely the experiment proposed: a genomic ATHB2 transgene in which the alternative near-cognate start codon TTG was mutated to CTC, a synonymous substitution that preserves the full-length ATHB2 protein sequence while preventing ATHB2miP translation. Plants carrying this construct display strongly enhanced hypocotyl elongation under both white light and deep shade. This genetic result directly maps TTG as the functional initiation site and demonstrates that ATHB2miP production from this codon has measurable physiological consequences in planta, independent of any N-terminal addition artifact.
(6) Another concern pertains to the 35S::miP line utilized in Figures 3-5. The authors only presented results from one 35S::miP line, raising the possibility of T-DNA insertion disrupting an endogenous gene in the transgenic plant genome. It is essential to clarify how many individual T1 plants were generated and how many of them showed the same phenotype as the line used in the manuscript. Additionally, the use of the constitutive CaMV35S promoter could generate artifacts akin to neomorphic mutations. For example, the authors identified Cluster 1 genes that were only induced in 35S::miP, but not in t-athb2 or WT plants (Figure 3B); moreover, they found an overrepresentation of genes involved in root development in this cluster. This observation correlated well with the root phenotype of 35S::miP under the proximity shade (Figure 4D), in which the short-root phenotype was only observed in lines expressing 35S::miP. These data could be artifacts due to the constitutive expression of ATHB2miP in roots but didn't necessarily reflect the natural function of ATHB2miP.
To address the concern about a single overexpression line, we present data from an additional independent 35S::ATHB2miP line earlier in this letter (see our response to Reviewer 1, point 3), alongside two independent 35S::ATHB2 full-length overexpression lines as controls. All 35S::ATHB2miP lines show elongated hypocotyls in white light and shade, consistent with reduced ATHB2 activity. The 35S::ATHB2 full-length lines show the opposite phenotype, confirming that the direction of the effect is specific to the protein being overexpressed and not an insertion artifact. Regarding the concern that constitutive ATHB2miP expression in roots may produce neomorphic effects: we acknowledge that ectopic 35S-driven expression cannot fully replicate the endogenous spatial and temporal pattern of ATHB2miP. The genes in Cluster 1, which are induced exclusively in 35S::miP plants, may partly reflect inhibition of additional HD-ZIPII family members by the overexpressed leucine zipper domain, beyond ATHB2 itself. This interpretation is discussed in the revised manuscript. Critically, however, the ATHB2 alt complementation experiment addresses this concern directly. In these lines, ATHB2miP is absent under the control of the endogenous promoter in the correct spatial context, with no ectopic expression involved. The constitutively enhanced hypocotyl elongation in ATHB2 alt plants relative to ATHB2 WT plants demonstrates that ATHB2miP has a genuine endogenous function that cannot be attributed to 35S overexpression artifacts.
(7) Furthermore, I seek clarification regarding the rationale behind employing different shade conditions, including deep shade, canopy shade, and proximity shade, and the significance of treating plants with these conditions. The results were challenging to interpret, and I have reservations about some statements made. The authors claimed that ATHB2 acts as a growth repressor in deep shade but a growth promoter in the canopy and proximity shade (Lines 366-368). However, it appears that regardless of the shade conditions, most mutant and transgenic lines were not significantly different from WT (Figure 4C). Additionally, the definition of proximity shade in this manuscript (R:FR = 0.06) differs from that in Roig-Villanova & Martinez-Garcia (Front. Plant Sci., 2016; R: FR, 0.5-0.3). Clarity on this disparity would be appreciated.
We employed three shade regimes to capture the spectrum of natural shading encountered by plants. Deep shade (PAR 13 µmol m-2 s-1, R: FR 0.13) simulates dense canopy where both light quantity and quality are strongly reduced. The two intermediate conditions both use PAR 45 µmol m-2 s-1 but differ in R: FR ratio (0.15 and 0.06), simulating conditions of neighboring plant competition where light quantity is less limiting but spectral quality changes. We acknowledge that the terminology "canopy shade" and "proximity shade" as used here does not match the definitions of Roig-Villanova and Martinez-Garcia (2016) and have revised the nomenclature in the manuscript to avoid confusion.
(8) In Figure 5, no statistical analyses were presented in Figure 5C. It remains unclear whether the differences observed are statistically significant. Moreover, the values appear quite similar among all three genotypes. Even if statistically significant, do these minor differences in Fe concentrations significantly impact plant physiology? Additionally, some statements related to Figure 5 do not align with the data presented. For instance, claims about longer hypocotyls in t-athb2, athb2∆, and atbh2∆LZ mutants compared to wild type under shade conditions on high iron media (lines 453-455) were not supported by the data in Figure 5D. Similarly, statements about the differences between mutants (lines 458-460) were not substantiated by the data.
The statistical analysis of the iron concentration data has been redone using a two-way ANOVA with tissue (root vs. shoot) and genotype as factors, followed by Tukey post-hoc comparisons. Statistical group labels are now shown directly on Figure 6C. All statements in the text making claims about genotype differences in hypocotyl or root length under iron conditions have been re-checked against the underlying statistical groupings. Unsupported claims have been corrected or removed.
Reviewer #2 (Recommendations for the authors):
(1) Figure 2A: The domain structure was not explained here, but instead in Figure 4A. Please incorporate that information into Figure 2A.
The domain structure of each ATHB2 variant has been incorporated into Figure 2A.
(2) Figure 3A: The transgenic line 35S::miP was used here but not introduced until Figure 4A.
A brief introductory sentence for the 35S::ATHB2miP (35S::miP) transgenic line has been added to the Results section prior to its first appearance in Figure 3.
(3) Line 283: Does logFC mean log2FC, and should logFC<1 be log2FC<-1?
Yes, logFC refers to log2 fold change. The threshold for downregulated genes should read logFC < −1, and this has been corrected in the revised manuscript.
(4) Figure 3B: Have the authors examined Cluster 16 genes, expressed at low levels only in 35S::miP but not the other two genotypes? Are they also related to root development?
We examined Cluster 16 and found it is enriched for genes involved in responses to light stimuli, not root development.
(5) Line 354-356: Please make sure "-2" and "-1" are in superscripts.
Units have been corrected.
(6) Line 391: "geneotypes" should be "genotypes."
The typo has been corrected.
(7) Line 393: Remove one instance of "all."
The repeated word has been removed.
(8) Figure 5A&B: I suggest the authors combine the data in A and B so readers can easily observe the change in gene expression between WL and shade 45 min.
Thank you for the suggestion. The two heatmaps are presented sequentially in Figure 6A and B. We believe this layout allows clear comparison between white light and shade conditions and have retained the current arrangement.
Reviewer #3 (Public review):
Summary and Strengths:
In this interesting manuscript, the authors identify a large number of alternative transcription start sites (TSS) and focus their functional analysis on an alternative TSS that is expected to produce a micro-protein (miP) encoding the C-terminus of ATHB2 (ATHB2miP). ATHB2miP is expected to comprise the leucine zipper part of ATHB2 and hence interact with the full-length protein through this dimerization motif. Such interactions are shown using yeast two-hybrid and FRET-FLIM assays. ATHB2 is a well-known shade-induced gene that has been implicated in shade-regulated growth responses. The authors then test the potential role for ATHB2miP genetically by comparing several athb2 loss-of-function (LOF) alleles: one does not express either full-length ATHB2 or the short ATHB2miP (t-ATHB2), two CRISPR alleles give rise to frameshift mutations in the full-length transcript but still express a potentially functional short ATHB2miP (athb2deltaLZ and athb2delta). The authors also use plants that over and ectopically express ATHB2miP (35S:miP). Overall, the results are consistent with the hypothesis that ATHB2miP inhibits the function of ATHB2, which constitutes a novel negative feedback loop. Potentially ATHB2miP may also inhibit the activity of other related HD ZIP proteins (based on 35S:miP). The effects of these genetic alterations on shade-regulated hypocotyl growth are relatively modest. Effects on root growth are also investigated and in one intriguing case, the negative feedback model does not appear to explain the data (Figure 4D, effect on lateral roots, because for this phenotype 35S:miP is very different from the lof alleles). The authors also identify a potentially interesting link between shade-regulated hypocotyl growth and iron uptake. A number of text changes and corrections to the figures would be important for clarity. They primarily concern three issues: names of the alleles, names of the studied shade conditions, and statements about significant differences between genotypes. Also, it would be interesting to know whether the effects of ATHB2 on iron uptake are due to local effects of ATHB2. Is ATHB2 expressed in roots?
We thank Reviewer 3 for the thorough reading and for identifying specific inconsistencies.
Weaknesses:
(1) The naming of the different shade conditions is difficult to follow and not consistent with the way most authors in the field call such conditions. Deep shade is ok (low PAR and low R/FR, WL, PAR 13microE, R/FR 0.13). This condition is clearly defined for experiments in Figure 4. However, data in Figure 1 also use Deep shade (line 174) but PAR is not defined there. I suggest that all light conditions are clearly defined in the figure legends and in the M&M (not the case in this ms). Regarding Canopy shade (WL, PAR 45microE, R/FR 0.15) and proximity shade (WL, PAR 45microE, R/FR 0.06), see lines 355-357, this nomenclature is unclear. First proximity shade has a higher R/FR ratio than canopy shade. Second for canopy shade (compared to the WL control) PAR should decrease which is not what is done here. What is called proximity shade and canopy shade are 2 WL conditions with different R/FR ratios, which are compared to WL controls with the same PAR. It would make more sense to call them proximity shade and indicate the different R/FR ratios. Finally, extensive literature from many plant species and numerous labs has shown that hypocotyl elongation increases with R/FR decreasing. In the data shown in Figure 4, it is the opposite. Hypocotyls in Canopy shade (WL, PAR 45microE, R/FR 0.15) are longer than those in proximity shade (WL, PAR 45microE, R/FR 0.06), while with these R/FR ratios the opposite is expected. Could this be a mistake in the text? Please check.
We agree that the terminology was confusing and have revised the nomenclature throughout the manuscript. All light conditions are now clearly defined in both the figure legends and the Materials and Methods section. Deep shade (PAR 13 µmol m-2 s-1, WL+FR; R: FR 0.13 in WL+FR) is consistently defined wherever it appears, including in the context of the 5'PEAT-seq experiment in Figure 1. The two intermediate conditions, which both use PAR 45 µmol m-2 s-1 but differ in R:FR, have been renamed to reflect their R: FR ratio rather than implying a specific natural shading scenario.
(2) In several instances (in particular regarding data from Figures 4 and 5), the authors write that 2 genotypes are significantly different while the statistical analysis of the data does not support such statements. For example lines 392-395, the authors write that in WL the t-DNA mutant, both CRISPR mutants and 35S:miP lines all had significantly lower number of lateral roots than the WT. This is true for the t-DNA mutant (group bc, while the WT is in group a), however, all other genotypes are in group ab, hence not significantly different from the WT. Please carefully check all such statements about significant differences.
We apologize for these inaccuracies. All statistical comparisons have been re-checked against the underlying statistical groupings, and the text has been corrected to reflect only differences supported by pairwise significance. Specifically, the statement about lateral root numbers in white light has been revised to note that only the t-athb2 mutant shows significantly fewer lateral roots than wild type; the CRISPR alleles and 35S::miP lines occupy intermediate groupings and are not significantly different from wild type in that condition.
(3) The naming of the CRISPR mutants is problematic. In particular athb2delta, such a name suggests that the gene is deleted (also suggested by Figure 4A), which is not the case in this CRISPR allele leading to a frameshift early in the coding sequence. This is particularly problematic because in this allele ATHB2miP is still expressed, while based on such a name one would expect that in this mutant both the full-length and the miP are lost. Both CRISPR alleles lead to a frameshift and this should be clarified in Figure 4A and in the text.
We agree that the naming was misleading. We have renamed the two CRISPR alleles throughout the manuscript. The allele carrying a frameshift in the first exon is now referred to as athb2cr2, and the allele carrying a frameshift in the third exon is now referred to as athb2cr1. Figure 4A and the text have been revised accordingly, with a clear description of the frameshift nature of each allele.
(4) Overall hypocotyl growth phenotypes of athb2 lof mutants and 35S::miP are similar and consistent with the model. However, this is not the case for the root phenotype described in 4D. It would be interesting to discuss this.
We thank the reviewer for flagging this apparent discrepancy. It is now explicitly discussed in the revised Discussion. The stronger root phenotype of 35S::miP plants relative to loss-of-function alleles in proximity shade conditions is consistent with ATHB2miP, when overexpressed, inhibiting not only ATHB2 but also other HD-ZIPII family members with which it can form leucine zipper-mediated heterodimers. Published interaction data (Arabidopsis Interactome Mapping Consortium, Science 2011) show that ATHB2 heterodimerizes with HAT2, HAT3, and HAT14. Since ATHB2miP retains the leucine zipper, it could form non-productive heterodimers with these proteins as well. Single athb2 loss-of-function alleles affect only ATHB2, which explains the milder root phenotype relative to 35S::miP. The partial suppression in t-athb2 35S::ATHB2miP is consistent with removing ATHB2 while retaining other HD-ZIPII substrates for ATHB2miP sequestration.
(5) The authors propose a role for ATHB2 in the root, in particular linked to iron uptake. Is this due to a local effect of ATHB2 in the roots? Is ATHB2 expressed in roots? It would be very informative if the authors would show such data, e.g. using the reporter lines used in Figure 1. Are both the FL and the miP expressed in roots?
Based on published expression data, ATHB2 transcript levels in roots are low relative to shoot tissues. The pATHB2::GUS reporter shows strongest expression in the hypocotyl and shoot apical meristem. This is consistent with the effects on iron uptake and root development being at least partly systemic, mediated by shoot-derived signals such as auxin. Steindler et al. (1999) showed that ATHB2-related root phenotypes depend on auxin transport, and He et al. (2020) demonstrated that ATHB2 overexpression reduces expression of PIN auxin efflux carriers and YUCCA biosynthetic enzymes, which would alter auxin distribution throughout the plant. A systemic model is also consistent with the established role of auxin as a long-distance messenger connecting shoot shade perception to root architecture adjustments (van Gelderen et al., 2018). We therefore propose that ATHB2 regulates root development and iron uptake primarily through its activity in the shoot, with downstream consequences for auxin distribution. Formally testing this through tissue-specific complementation is noted as a direction for future work.
(6) From the description regarding 5'PEAT.seq data presented in Figure 1 (see lines 174-177) it is not clear in which light conditions the seedlings were grown. It appears that samples were collected in 3 conditions. WL and after 45 and 90 minutes of low R/FR treatment. However, then the data is discussed collectively. Does the 12398 TSS correspond to what was found in all three conditions together? Are the authors showing shade regulation of TSS? This is clearly the case for ATHB2miP. This needs to be clarified.
We apologize for the lack of clarity. The 12,398 TSSs were identified from all three conditions combined (white light, 45 minutes of supplemental FR, and 90 minutes of supplemental FR). This is now stated explicitly in the Results. The shade condition for the 5'PEAT-seq experiment was deep shade (PAR 13 µmol m-2 s-1), and this is now stated in the figure legend and in the Materials and Methods. Shade-specific regulation of individual alternative TSS candidates, including ATHB2, is described in Supplementary Dataset 1.
(7) The way gene expression of low F/FR effects is done might conflate circadian effects and low R/FR effects because the samples from different light conditions are not collected at the same ZT. This is how I understood the text. If I'm wrong please clarify the text. If I am right, this potential problem should be mentioned in the text.
The reviewer's concern is valid in principle but does not apply to our experimental design. All samples were harvested at the same zeitgeber time (ZT). Plants assigned to the 90-minute shade condition were transferred to supplemental FR 90 minutes before the common harvest time; those assigned to 45-minute shade were transferred 45 minutes before; and control plants remained in white light until the same harvest point. Because all harvests were simultaneous, any differences in gene expression reflect the shade treatment rather than circadian phase. This information has been added to the Materials and Methods section.
(8) Could the authors envisage a way to genetically test the role of ATHB2miP by using an allele that makes the full-length but not the miP? Currently, the authors use lof alleles that either make none of the transcripts (t-DNA) or potentially only the miP (CRISPR alleles). Overall, these alleles do not appear to differ in their phenotypes, suggesting that most of the effect of ATHB2miP is through ATHB2 FL. Having an allele only producing the FL would be nice (but technically I'm not sure how one could do that).
We are pleased to report that we have done exactly this. The ATHB2 alt complementation construct carries a TTG-to-CTC substitution at the alternative near-cognate start codon. Because TTG and CTC both encode leucine, the full-length ATHB2 protein is unchanged in sequence, but translation of ATHB2miP is abolished. Independent homozygous lines carrying ATHB2 alt in the t-athb2 background display constitutively enhanced hypocotyl elongation under both white light and deep shade, while lines carrying the wild-type ATHB2 genomic transgene restore near-wild-type growth. This experiment provides precisely the allele the reviewer proposed and validates the model: endogenous ATHB2miP restrains ATHB2 activity, and its loss leads to exaggerated elongation growth.
-

-
-

-
-
eLife assessment
Through a genome-wide screen for functional alternative transcription start sites (TSS) in Arabidopsis, the authors provide evidence for widespread transcription of potential microproteins from previously annotated protein-coding genes. Functional analysis of AtHB2-miP, derived from the C-terminal region of transcription factor AtHB2 and predicted to form non-productive dimers with ATHB2, suggested that this microprotein could affect AtHB2 functions in shade responses, root growth, and iron homeostasis. The work is valuable as a case study of how new microproteins could act to modulate gene regulation in response to environmental change, but the focus on a single gene, the lack of precision in AtHB2-miP measurement and missing controls, and the relatively minor phenotypic effects mean that data supporting microprotein …
eLife assessment
Through a genome-wide screen for functional alternative transcription start sites (TSS) in Arabidopsis, the authors provide evidence for widespread transcription of potential microproteins from previously annotated protein-coding genes. Functional analysis of AtHB2-miP, derived from the C-terminal region of transcription factor AtHB2 and predicted to form non-productive dimers with ATHB2, suggested that this microprotein could affect AtHB2 functions in shade responses, root growth, and iron homeostasis. The work is valuable as a case study of how new microproteins could act to modulate gene regulation in response to environmental change, but the focus on a single gene, the lack of precision in AtHB2-miP measurement and missing controls, and the relatively minor phenotypic effects mean that data supporting microprotein production as a vital regulatory strategy are incomplete.
-
Reviewer #1 (Public Review):
Summary:
The authors report evidence for a microprotein of AtHB2-miP. The authors came across HB2 in a screen for alternative transcription start sites in Arabidopsis in response to white light or a white light followed by a far red light representative of shade. Out of 337 potential microproteins, authors selected AtHB2. At the beginning of the manuscript, it is investigated that an alternative transcription start site of HB2 gene can be used in response to far red light. The resulting shorter protein form seems to interact with HB2 protein forms, altering the localization of HB2 in transient expression assays. The functionality of HB2-miP overexpression has been addressed in transgenic Arabidopsis lines using a 35S promoter. The responses and phenotypes were compared with either WT or various types of …
Reviewer #1 (Public Review):
Summary:
The authors report evidence for a microprotein of AtHB2-miP. The authors came across HB2 in a screen for alternative transcription start sites in Arabidopsis in response to white light or a white light followed by a far red light representative of shade. Out of 337 potential microproteins, authors selected AtHB2. At the beginning of the manuscript, it is investigated that an alternative transcription start site of HB2 gene can be used in response to far red light. The resulting shorter protein form seems to interact with HB2 protein forms, altering the localization of HB2 in transient expression assays. The functionality of HB2-miP overexpression has been addressed in transgenic Arabidopsis lines using a 35S promoter. The responses and phenotypes were compared with either WT or various types of athb2 mutant lines with disrupted HB2 gene. Such mutants and the 35S promoter-driven AtHB2-miP line showed various types of phenotypes versus each other that can be classified as mild or none, e.g. small effects on root growth, iron homeostasis gene expression, and iron contents.
Strengths:
The authors performed an interesting screen for alternative transcription start sites which resulted in 337 candidates (Figure 1A). Principally, it can be interesting to find that plants may use alternative start sites for HB2 in response to shading light. The authors provide evidence that alternative transcription start sites of HB2 can be present and used in response to FR. The possibility that potentially resulting small protein may have effects under FR light, causing alteration of root growth and physiology, is an interesting idea.
Weaknesses:
In the present manuscript, there are several signs of incomplete analysis.
(1) The transient expression experiments are not conducted with much detail to demonstrate that indeed HB2 miP is produced and can interact with regular protein. The localization of HB2 was found to be linked with condensates, but perhaps not in the presence of HB2 miP. Clearly, the lack of quantitative and qualitative analysis hampers a clear assessment of this point.
(2) The authors, unfortunately, did not provide the data of the screen to demonstrate which concrete candidates may have miPs and whether there is enrichment of certain functions. There is no supplemental table accompanying Figure 1A.
(3) One of the major unclear points that is also not addressed in the discussion is that the function of miR is studied in overexpression plants (35S promoter::miP). The effects are only compared to wild type and various lines of HB2 knockouts or knockdowns, partly with fairly uncharacterized phenotypes. It can now not be clearly determined whether the miP effects are due to a regular function of miP or due to overexpression of it. A needed control would be a 35S::AtHB2 line, or better at least two different lines (only a single miP overexpression line investigated). Since it has not been assessed by deletion mutant analysis to determine which protein parts of miP are involved in the protein regulation, it cannot be ruled out that the observed miP effects are not naturally occurring but the result of ectopic expression of a protein. Clearly, the effect of miP would be ideally studied in an environment where the levels can be controlled and the resulting phenotypes and protein levels quantified.
(4) It is not shown that the microprotein is generated in Arabidopsis in response to shade, e.g. through Western or fluorescence protein detection. The main idea that authors want to claim, namely that miP binds with regular protein and thereby controls its localization or activity has not been addressed in Arabidopsis. There are no localization experiments of HB2 protein data in the presence of miP in Arabidopsis.
(5) The plants with altered HB2 forms seem to grow well and the recorded phenotypes are rather minor. Photos are not shown. At some point, the authors discuss that there could be redundancy or that HB miP might interact with other HB proteins. However, such protein interactions have not been experimentally investigated.
-
Reviewer #2 (Public Review):
The first portion of the manuscript centered on identifying and confirming the ATHB2 microprotein (ATHB2miP), which constitutes the core message of this study. Overall, I find no issue with the selection criteria employed for identifying alternative microprotein mRNA transcripts. However, I do have some queries that I hope the authors can address for clarity.
(1) Upon reviewing the supplemental dataset where the authors listed the 377 unique novel miPs, along with those specifically in WL or shade treatments, I sought to comprehend the rationale behind focusing on ATHB2. Have the authors examined the shade response of all 377 potential microprotein candidates? Readers may be intrigued to learn how many of these candidates exhibit induction or repression under shade conditions, and whether such changes …
Reviewer #2 (Public Review):
The first portion of the manuscript centered on identifying and confirming the ATHB2 microprotein (ATHB2miP), which constitutes the core message of this study. Overall, I find no issue with the selection criteria employed for identifying alternative microprotein mRNA transcripts. However, I do have some queries that I hope the authors can address for clarity.
(1) Upon reviewing the supplemental dataset where the authors listed the 377 unique novel miPs, along with those specifically in WL or shade treatments, I sought to comprehend the rationale behind focusing on ATHB2. Have the authors examined the shade response of all 377 potential microprotein candidates? Readers may be intrigued to learn how many of these candidates exhibit induction or repression under shade conditions, and whether such changes correlate positively or negatively with alterations in the full-length TSSs in response to shade. Essentially, I aim to discern the prevalence of microprotein production during shade responses and any shared characteristics among these microprotein transcripts. This inquiry also aims to uncover the existence of a common mechanism regulating microprotein transcription.
(2) To confirm that ATHB2miP stems from an independent transcription event, the authors sequenced full-length cDNAs using PacBio isoseq. However, I find the information regarding isoseq missing from the manuscript. My assumption is that the full-length cDNAs were reverse transcribed from mRNAs isolated from whole seedlings, where mature mRNAs in the cytoplasm predominate, making it challenging to evaluate whether a specific mRNA undergoes post-transcriptional processing. One approach to confirming ATHB2miP as a product of independent transcription involves examining nascent mRNA produced in the nucleus. The authors may need to isolate nascent mRNAs associated with RNA Polymerase II in the nucleus from seedlings treated with shade for 45 min, and then perform reverse transcription and PacBio isoseq.
(3) The authors noted the identification of two potential start codons, TTG and CTG, in the alternative TSS of ATHB2 using TISpredictor. Yet, it's imperative to identify the actual translation initiation site and the full-length sequence of ATHB2miP. I suggest the authors fuse an epitope tag (e.g., 3xFLAG) to the C-terminus of ATHB2 (utilizing the genomic sequence of ATHB2) and generate transgenic lines to be treated with shade to induce ATHB2miP-3xFLAG production. Affinity purification (anti-FLAG beads) and mass spectrometry can then identify the actual start site of ATHB2miP. This step is crucial, as the current ATHB2miP used may not be the exact sequence, and any observed phenotype could be artifacts arising from these lines.
(4) My confusion arose when analyzing the results in Figures 1E - G. The authors didn't specify whether these plants were subjected to shade treatment. What are the sequences within the second intron and third exon excluded from pATHB2control::GUS that promote transcription and translation? Have the authors examined the sequence features? This information is pivotal and related to the above question #1 because it may tell us whether the sequence feature is shared by other miP candidates.
The latter part of the manuscript focused on the functional characterization of ATHB2miP. The approaches adopted by the authors resemble those used in studying antimorphic (dominant negative) alleles. However, I have several concerns regarding the approaches and conclusions.
(5) Firstly, as mentioned in question #3, the authors did not map the actual translation initiation site of ATHB2miP. Therefore, all constructs involving ATHB2miP, such as eGFP-ATHB2miP, BD-ATHB2miP, and mCherry-ATHB2miP in Figure 2, and 35S::miP in Figures 3-5, may contain extra amino acids in the N-terminus, given that epitope tags were all added to the N terminus. These additional amino acids could potentially impact the behavior of ATHB2miP and lead to artifacts. Identifying the translation initiation site in ATHB2miP would facilitate the development of tools to disrupt ATHB2miP expression without affecting full-length ATHB2 expression. For instance, if the "CTG" before the leucine zipper domain is confirmed as the translation initiation site, mutating it to another Leu codon (e.g., TTA) could generate transgenic lines using the genomic sequence of ATHB2, including this mutation, to evaluate the impact of losing ATHB2miP on shade responses.
(6) Another concern pertains to the 35S::miP line utilized in Figures 3-5. The authors only presented results from one 35S::miP line, raising the possibility of T-DNA insertion disrupting an endogenous gene in the transgenic plant genome. It is essential to clarify how many individual T1 plants were generated and how many of them showed the same phenotype as the line used in the manuscript. Additionally, the use of the constitutive CaMV35S promoter could generate artifacts akin to neomorphic mutations. For example, the authors identified Cluster 1 genes that were only induced in 35S::miP, but not in t-athb2 or WT plants (Figure 3B); moreover, they found an overrepresentation of genes involved in root development in this cluster. This observation correlated well with the root phenotype of 35S::miP under the proximity shade (Figure 4D), in which the short-root phenotype was only observed in lines expressing 35S::miP. These data could be artifacts due to the constitutive expression of ATHB2miP in roots but didn't necessarily reflect the natural function of ATHB2miP.
(7) Furthermore, I seek clarification regarding the rationale behind employing different shade conditions, including deep shade, canopy shade, and proximity shade, and the significance of treating plants with these conditions. The results were challenging to interpret, and I have reservations about some statements made. The authors claimed that ATHB2 acts as a growth repressor in deep shade but a growth promoter in the canopy and proximity shade (Lines 366-368). However, it appears that regardless of the shade conditions, most mutant and transgenic lines were not significantly different from WT (Figure 4C). Additionally, the definition of proximity shade in this manuscript (R:FR = 0.06) differs from that in Roig-Villanova & Martinez-Garcia (Front. Plant Sci., 2016; R:FR, 0.5-0.3). Clarity on this disparity would be appreciated.
(8) In Figure 5, no statistical analyses were presented in Figure 5C. It remains unclear whether the differences observed are statistically significant. Moreover, the values appear quite similar among all three genotypes. Even if statistically significant, do these minor differences in Fe concentrations significantly impact plant physiology? Additionally, some statements related to Figure 5 do not align with the data presented. For instance, claims about longer hypocotyls in t-athb2, athb2∆, and atbh2∆LZ mutants compared to wild type under shade conditions on high iron media (lines 453-455) were not supported by the data in Figure 5D. Similarly, statements about the differences between mutants (lines 458-460) were not substantiated by the data.
-
Reviewer #3 (Public Review):
Summary and Strengths:
In this interesting manuscript, the authors identify a large number of alternative transcription start sites (TSS) and focus their functional analysis on an alternative TSS that is expected to produce a micro-protein (miP) encoding the C-terminus of ATHB2 (ATHB2miP). ATHB2miP is expected to comprise the leucine zipper part of ATHB2 and hence interact with the full-length protein through this dimerization motif. Such interactions are shown using yeast two-hybrid and FRET-FLIM assays. ATHB2 is a well-known shade-induced gene that has been implicated in shade-regulated growth responses. The authors then test the potential role for ATHB2miP genetically by comparing several athb2 loss-of-function (LOF) alleles: one does not express either full-length ATHB2 or the short ATHB2miP (t-ATHB2), …
Reviewer #3 (Public Review):
Summary and Strengths:
In this interesting manuscript, the authors identify a large number of alternative transcription start sites (TSS) and focus their functional analysis on an alternative TSS that is expected to produce a micro-protein (miP) encoding the C-terminus of ATHB2 (ATHB2miP). ATHB2miP is expected to comprise the leucine zipper part of ATHB2 and hence interact with the full-length protein through this dimerization motif. Such interactions are shown using yeast two-hybrid and FRET-FLIM assays. ATHB2 is a well-known shade-induced gene that has been implicated in shade-regulated growth responses. The authors then test the potential role for ATHB2miP genetically by comparing several athb2 loss-of-function (LOF) alleles: one does not express either full-length ATHB2 or the short ATHB2miP (t-ATHB2), two CRISPR alleles give rise to frameshift mutations in the full-length transcript but still express a potentially functional short ATHB2miP (athb2deltaLZ and athb2delta). The authors also use plants that over and ectopically express ATHB2miP (35S:miP). Overall, the results are consistent with the hypothesis that ATHB2miP inhibits the function of ATHB2, which constitutes a novel negative feedback loop. Potentially ATHB2miP may also inhibit the activity of other related HD ZIP proteins (based on 35S:miP). The effects of these genetic alterations on shade-regulated hypocotyl growth are relatively modest. Effects on root growth are also investigated and in one intriguing case, the negative feedback model does not appear to explain the data (Figure 4D, effect on lateral roots, because for this phenotype 35S:miP is very different from the lof alleles). The authors also identify a potentially interesting link between shade-regulated hypocotyl growth and iron uptake. A number of text changes and corrections to the figures would be important for clarity. They primarily concern three issues: names of the alleles, names of the studied shade conditions, and statements about significant differences between genotypes. Also, it would be interesting to know whether the effects of ATHB2 on iron uptake are due to local effects of ATHB2. Is ATHB2 expressed in roots?
Weaknesses:
(1) The naming of the different shade conditions is difficult to follow and not consistent with the way most authors in the field call such conditions. Deep shade is ok (low PAR and low R/FR, WL, PAR 13microE, R/FR 0.13). This condition is clearly defined for experiments in Figure 4. However, data in Figure 1 also use Deep shade (line 174) but PAR is not defined there. I suggest that all light conditions are clearly defined in the figure legends and in the M&M (not the case in this ms). Regarding Canopy shade (WL, PAR 45microE, R/FR 0.15) and proximity shade (WL, PAR 45microE, R/FR 0.06), see lines 355-357, this nomenclature is unclear. First proximity shade has a higher R/FR ratio than canopy shade. Second for canopy shade (compared to the WL control) PAR should decrease which is not what is done here. What is called proximity shade and canopy shade are 2 WL conditions with different R/FR ratios, which are compared to WL controls with the same PAR. It would make more sense to call them proximity shade and indicate the different R/FR ratios. Finally, extensive literature from many plant species and numerous labs has shown that hypocotyl elongation increases with R/FR decreasing. In the data shown in Figure 4, it is the opposite. Hypocotyls in Canopy shade (WL, PAR 45microE, R/FR 0.15) are longer than those in proximity shade (WL, PAR 45microE, R/FR 0.06), while with these R/FR ratios the opposite is expected. Could this be a mistake in the text? Please check.
(2) In several instances (in particular regarding data from Figures 4 and 5), the authors write that 2 genotypes are significantly different while the statistical analysis of the data does not support such statements. For example lines 392-395, the authors write that in WL the t-DNA mutant, both CRISPR mutants and 35S:miP lines all had significantly lower number of lateral roots than the WT. This is true for the t-DNA mutant (group bc, while the WT is in group a), however, all other genotypes are in group ab, hence not significantly different from the WT. Please carefully check all such statements about significant differences.
(3) The naming of the CRISPR mutants is problematic. In particular athb2delta, such a name suggests that the gene is deleted (also suggested by Figure 4A), which is not the case in this CRISPR allele leading to a frameshift early in the coding sequence. This is particularly problematic because in this allele ATHB2miP is still expressed, while based on such a name one would expect that in this mutant both the full length and the miP are lost. Both CRISPR alleles lead to a frameshift and this should be clarified in Figure 4A and in the text.
(4) Overall hypocotyl growth phenotypes of athb2 lof mutants and 35S:miP are similar and consistent with a model according to which ATHB2miP inhibits the full-length protein. However, this is not the case for the root phenotype described in 4D. It would be interesting to discuss this.
(5) The authors propose a role for ATHB2 in the root, in particular linked to iron uptake. Is this due to a local effect of ATHB2 in the roots? Is ATHB2 expressed in roots? It would be very informative if the authors would show such data, e.g. using the reporter lines used in Figure 1. Are both the FL and the miP expressed in roots?
(6) From the description regarding 5'PEAT.seq data presented in Figure 1 (see lines 174-177) it is not clear in which light conditions the seedlings were grown. It appears that samples were collected in 3 conditions. WL and after 45 and 90 minutes of low R/FR treatment. However, then the data is discussed collectively. Does the 12398 TSS correspond to what was found in all three conditions together? Are the authors showing shade-regulation of TSS? This is clearly the case for ATHB2miP. This needs to be clarified.
(7) The way gene expression of low F/FR effects is done might conflate circadian effects and low R/FR effects because the samples from different light conditions are not collected at the same ZT. This is how I understood the text. If I'm wrong please clarify the text. If I am right, this potential problem should be mentioned in the text.
(8) Could the authors envisage a way to genetically test the role of ATHB2miP by using an allele that makes the full length but not the miP? Currently, the authors use lof alleles that either make none of the transcripts (t-DNA) or potentially only the miP (CRISPR alleles). Overall, these alleles do not appear to differ in their phenotypes, suggesting that most of the effect of ATHB2miP is through ATHB2 FL. Having an allele only producing the FL would be nice (but technically I'm not sure how one could do that).
-
-
A shade-responsive microProtein in the Arabidopsis ATHB2 gene regulates elongation growth and root development https://www.biorxiv.org/content/10.1101/2024.02.01.578400v1
-
A shade-responsive microProtein in the Arabidopsis ATHB2 gene regulates elongation growth and root development https://www.biorxiv.org/content/10.1101/2024.02.01.578400v1
-