LRRK2 regulates synaptic function through modulation of actin cytoskeletal dynamics
Curation statements for this article:-
Curated by eLife

eLife Assessment
This important work begins to understand how BDNF regulates the phosphorylation and activity of LRRK2. The overall strength of evidence has been assessed as compelling, though some claims are only partially supported. The work will be of interest for those that might pursue specific LRRK2 interactions and mutational effects on these pathways as the work continues to develop.
This article has been Reviewed by the following groups
Discuss this preprint
Start a discussion What are Sciety discussions?Listed in
- Evaluated articles (eLife)
Abstract
Abstract
Parkinson’s disease (PD) is a multisystemic disorder that manifests through motor and non-motor symptoms. Motor dysfunction is the most debilitating and it is caused by the degeneration of dopamine-producing neurons in the substantia nigra pars compacta (SNpc). Increasing evidence suggests that synapse dysfunction precedes neuronal loss by years. Still, early synaptic alterations in PD remain poorly understood.
Here we integrate literature meta-analysis, proteomics and phosphoproteomics with biochemical, imaging and electrophysiological measurements in neurons and brains from knockout and knockin Lrrk2 mouse models, as well as human iPSC-derived neurons lacking LRRK2. We demonstrate that phosphorylation of LRRK2 at Ser935 and of RAB proteins is induced by brain-derived neurotrophic factor (BDNF) stimulation in differentiated SH-SY5Y cells and primary mouse neurons. Affinity-purification coupled with mass spectrometry (AP-MS/MS) revealed a significant remodelling of the LRRK2 interactome following BDNF treatment, with enhanced association of LRRK2 to a network of actin cytoskeleton-related proteins. Gene-ontology analyses of both literature-curated LRRK2 interactors and phospho-proteome from striatal tissues with elevated LRRK2 activity (G2019S knockin mice) highlight synapse-actin remodelling as major affected pathways.
We further observed that loss of LRRK2 impairs BDNF signaling and alters postsynaptic density architecture. One month-old Lrrk2 knockout mice display structural alterations in dendritic protrusions, a phenotype that normalizes with age. In human iPSC-derived neurons, BDNF enhances the frequency of miniature excitatory post-synaptic currents (mEPSC) in wild-type but not in LRRK2 knockout neurons, which appear to bypass this regulation through developmental compensation.
Taken together, our study discloses a critical role of LRRK2 in BDNF-dependent synaptic modulation and identifies the synaptic actin cytoskeleton as a convergent site of LRRK2’s pathophysiological activity.
Article activity feed
-

-
-

eLife Assessment
This important work begins to understand how BDNF regulates the phosphorylation and activity of LRRK2. The overall strength of evidence has been assessed as compelling, though some claims are only partially supported. The work will be of interest for those that might pursue specific LRRK2 interactions and mutational effects on these pathways as the work continues to develop.
-
Reviewer #1 (Public review):
Summary:
LRRK2 protein is familially linked to Parkinson's disease by the presence of several gene variants that all confer a gain-of-function effect on LRRK2 kinase activity.
The authors examine the effects of BDNF stimulation in immortalized neuron-like cells, cultured mouse primary neurons, hIPSC-derived neurons, and brain tissue from genetically modified mice. They examine a LRRK2 regulatory phosphorylation residue, LRRK2 binding relationships, and measures of synaptic structure and function.
Strengths:
The study addresses an important research question: how does a PD-linked protein interact with other proteins, and contribute to responses to a well-characterized neuronal signalling pathway involved in the regulation of synaptic function and cell health.
They employ a range of good models and techniques …
Reviewer #1 (Public review):
Summary:
LRRK2 protein is familially linked to Parkinson's disease by the presence of several gene variants that all confer a gain-of-function effect on LRRK2 kinase activity.
The authors examine the effects of BDNF stimulation in immortalized neuron-like cells, cultured mouse primary neurons, hIPSC-derived neurons, and brain tissue from genetically modified mice. They examine a LRRK2 regulatory phosphorylation residue, LRRK2 binding relationships, and measures of synaptic structure and function.
Strengths:
The study addresses an important research question: how does a PD-linked protein interact with other proteins, and contribute to responses to a well-characterized neuronal signalling pathway involved in the regulation of synaptic function and cell health.
They employ a range of good models and techniques to fairly convincingly demonstrate that BDNF stimulation alters LRRK2 phosphorylation and binding to many proteins. IN this revised manuscript, aspects are well validated e.g., drebrin binding, but there is a disconnect between these findings and alterations to LRRK2 substrates. A convincing phosphoproteomic analysis of PD mutant Knock-in mouse brain is included. Overall the links between LRRK2, LRRK2 activity, and the changes to synaptic molecules, structures, and activity are intriguing.
Weaknesses:
The data sets remain disjointed, conclusions are sweeping, and not always in line with what the data is showing. Validation of 'omics' data is light. Some inconsistencies with the major conclusions are ignored. Several of the assays employed (western blotting especially) are underpowered, findings key to their interpretation are addressed in only one or other of the several models employed, and supporting observations are lacking.
Main Conclusions of Abstract:
(1) Increase in pLRRK2 Ser935 and pRAB after BDNF in SH-SY5Y & mouse neurons
Well supported, but only for pLRRK2 in neurons, why not pERK pAkt & pRab?
(2) Omics Proteome remodelling of LRRK2 interactome with BDNF & different in G2019S mouse neurons.
Supports that the phosphoproteome of G2019S is different. Drebrin interaction with LRRK2 very well supported. Link between drebrin and LRRK2 activity somewhat supported (pS935 site), but the consequence (non-specific pRab8) not supported, as there is no evidence of a change in LRRK2 substrate(s).
(3) Golgi 1 month LKO mouse altered dendritic spines, transient at 1m not older.
Supported but very small transient change in spines, disconnected to other results (e.g., drebrin).
(4) iPSC-derived neurons BDNF increases mEPSC frequency (transient at 70 not 50 or 90 days) in WT not KO "which appear to bypass this regulation through developmental compensation"
Weak, not clear what is being bypassed.
Main Conclusions Based on Old and New Figure / Data:
(1) Increase in pLRRK2 Ser935 and pRAB after BDNF in SH-SY5Y & mouse neurons
Well supported, but only for pLRRK2 in neurons, why not ERK Akt & Rab?
(2) BDNF promotes LRRK2 interaction with "post-synaptic actin cytoskeleton components"
Tone down, only one postsynaptic validated - drebrin strong BUT CONTRADICTORY; link between drebrin and LRRK2 activity (pS935 site) supported, consequence (non-specific pRab8) broken, no evidence of change in LRRK2 substrate.
(3) LRRK2 G2019S striatal phosphoproteome is different from WT.
It is different. Where is link to BDNF or Drebrin?
(4) BDNF signaling is impaired in Lrrk2 knockout neurons
TrkB changes seem higher in SHSY5Y. pAKT impaired, pERK not convincing. Primary neurons Akt slower but it and Erk mostly intact. MLi-2 did not block pAkt or pErk in WT or KO (higher in latter). Whatever is happening in KO, Mli-2 not really blocking effect in WT. If we are to assume that studying the KO was a means to understand LRRK2 function, the authors data should explain why we care if an effect is absent in LKO, if LRRK2 isn't doing the same job in WT?
BDNF increases synaptic puncta in WT not LKO (which start higher?). Is this BDNF increase blocked by LRRK2 inhibition?
(5) Postsynaptic structural changes in Lrrk2 knockout neurons
Golgi impregnation shows some very small spine changes at 1m. Not sustained over age. mRNA changes are very small (10% not even a fold... very weak and should be written as so). Derbrin levels reduced clearly at 1m, but probably also at 4 & 18. Underpowered, disconnected time course from the spine changes.
(6) An effect on "spontaneous electrical activity" at Div70
Weak. What is so special at 70 days that means we should be confident in the differences, or be satisfied that the other time points are legitimately ignored? These are 10-11 cells from 3 cultures assayed at 3 time points but only one is presented (rest in supplement). This should be a 2 (time) or 3 way (+culture RM) ANOVA. As it stands, in WT there is a little - no activity at 50 days, little to no at 70 days, and variable to lots or none at 90. BDNF did nothing at 50 or 90 but may have at 70. In KO low activity stable at 50 & 70, tanks at 90. BDNF would seem to have a similar effect on KO at 90 as WT at 70, but as there are only 7 cells it remains inconclusive. Thus the conclusion that BDNF signalling is broken in LKO is not well supported by the ephys data, nor is the BDNF effect in WT cells (even at the 70 day time point) shown to be susceptible to LRRK2 inhibition.
-
Reviewer #2 (Public review):
The data show that BDNF regulates the PD-associated kinase LRRK2, they place LRRK2 within well-described BDNF pathways biochemically, and they show that LRRK2 can play a role mediating BDNF-driven synaptic outcomes at excitatory synapses. The chief strength is that the data provide a potential focal point for multiple observations that have been made across many labs. The findings will be of broad interest because LRRK2 has emerged as a protein that is likely to be part of Parkinson's pathology and its normal and pathological actions remain poorly understood.
A major strength of the study is the multiple approaches that were used (biochemistry, bioinformatics, light and electron microscopy and electrophysiology) across different experimental models (cells, primary neurons, human neurons, mice) to identify …
Reviewer #2 (Public review):
The data show that BDNF regulates the PD-associated kinase LRRK2, they place LRRK2 within well-described BDNF pathways biochemically, and they show that LRRK2 can play a role mediating BDNF-driven synaptic outcomes at excitatory synapses. The chief strength is that the data provide a potential focal point for multiple observations that have been made across many labs. The findings will be of broad interest because LRRK2 has emerged as a protein that is likely to be part of Parkinson's pathology and its normal and pathological actions remain poorly understood.
A major strength of the study is the multiple approaches that were used (biochemistry, bioinformatics, light and electron microscopy and electrophysiology) across different experimental models (cells, primary neurons, human neurons, mice) to identify and examine the impact of BDNF on LRRK2 signaling and functions. Noteworthy is also the employment of LRRK2KO preparations to validate outcomes and to place LRRK2 actions up or downstream.
The demonstration that LRRK2 and drebrin interact directly is important and suggests that other interacting proteins identified biochemically and bioinformatically in the paper will be important to pursue.
Some data from different models do not fit well with one another (like mouse and human neurons). This is likely due to inherent differences in the preparations. Since different experiments were carried out on the different preps, however, it is not possible to cross compare. The lack of this information is viewed more as an open question than a cause for concern.
-
Author response:
The following is the authors’ response to the original reviews.
Reviewer #1 (Public Review):
Summary:
LRRK2 protein is familially linked to Parkinson's disease by the presence of several gene variants that all confer a gain-of-function effect on LRRK2 kinase activity.
The authors examine the effects of BDNF stimulation in immortalized neuron-like cells, cultured mouse primary neurons, hIPSC-derived neurons, and synaptosome preparations from the brain. They examine an LRRK2 regulatory phosphorylation residue, LRRK2 binding relationships, and measures of synaptic structure and function.
Strengths:
The study addresses an important research question: how does a PD-linked protein interact with other proteins, and contribute to responses to a well-characterized neuronal signalling pathway involved in the regulation of …
Author response:
The following is the authors’ response to the original reviews.
Reviewer #1 (Public Review):
Summary:
LRRK2 protein is familially linked to Parkinson's disease by the presence of several gene variants that all confer a gain-of-function effect on LRRK2 kinase activity.
The authors examine the effects of BDNF stimulation in immortalized neuron-like cells, cultured mouse primary neurons, hIPSC-derived neurons, and synaptosome preparations from the brain. They examine an LRRK2 regulatory phosphorylation residue, LRRK2 binding relationships, and measures of synaptic structure and function.
Strengths:
The study addresses an important research question: how does a PD-linked protein interact with other proteins, and contribute to responses to a well-characterized neuronal signalling pathway involved in the regulation of synaptic function and cell health?
They employ a range of good models and techniques to fairly convincingly demonstrate that BDNF stimulation alters LRRK2 phosphorylation and binding to many proteins. Some effects of BDNF stimulation appear impaired in (some of the) LRRK2 knock-out scenarios (but not all). A phosphoproteomic analysis of PD mutant Knock-in mouse brain synaptosomes is included.
We thank this Reviewer for pointing out the strengths of our work.
Weaknesses:
The data sets are disjointed, conclusions are sweeping, and not always in line with what the data is showing. Validation of 'omics' data is very light. Some inconsistencies with the major conclusions are ignored. Several of the assays employed (western blotting especially) are likely underpowered, findings key to their interpretation are addressed in only one or other of the several models employed, and supporting observations are lacking.
We appreciate the Reviewer’s overall evaluaVon. In this revised version, we have provided several novel results that strengthen the omics data and the mechanisVc experiments and make the conclusions in line with the data.
As examples to aid reader interpretation: (a) pS935 LRRK2 seems to go up at 5 minutes but goes down below pre-stimulation levels after (at times when BDNF-induced phosphorylation of other known targets remains very high). This is ignored in favour of discussion/investigation of initial increases, and the fact that BDNF does many things (which might indirectly contribute to initial but unsustained changes to pLRRK2) is not addressed.
We thank the Reviewer for raising this important point, which we agree deserves additional investigation. Although phosphorylation does decrease below pre-stimulation levels, a reduction is also observed for ERK/AKT upon sustained exposure to BDNF in our experimental paradigm (figure 1F-G). This phenomenon is well known in response to a number of extracellular stimuli and can be explained by mechanisms related to cellular negative feedback regulation, receptor desensitization (e.g. phosphorylation or internalization), or cellular adaptation. The effect on pSer935, however, is peculiar as phosphorylation goes below the unstimulated level, as pointed by the reviewer. In contrast to ERK and AKT whose phosphorylation is almost absent under unstimulated conditions (Figure 1F-G), the stoichiometry of Ser935 phosphorylation under unstimulated conditions is high. This observation is consistent with MS determination of relative abundance of pSer935 (e.g. in whole brain LRRK2 is nearly 100% phosphorylated at Ser935, see Nirujogi et al., Biochem J 2021). Thus we hypothesized that the modest increase in phosphorylation driven by BDNF likely reflects a saturation or ceiling effect, indicating that the phosphorylation level is already near its maximum under resting conditions. Prolonged BDNF stimulation would bring phosphorylation down below pre-stimulation levels, through negative feedback mechanisms (e.g. phosphatase activity) explained above. To test this hypothesis, we conducted an experiment in conditions where LRRK2 is pretreated for 90 minutes with MLi-2 inhibitor, to reduce basal phosphorylation of S935. After MLi-2 washout, we stimulated with BDNF at different time points. We used GFP-LRRK2 stable lines for this experiment, since the ceiling effect was particularly evident (Figure S1A) and this model has been used for the interactomic study. As shown below (and incorporated in Fig. S1B in the manuscript), LRRK2 responds robustly to BDNF stimulation both in terms of pSer935 and pRABs. Phosphorylation peaks at 5-15 mins, while it decreases to unstimulated levels at 60 and 180 minutes. Notably, while the peak of pSer935 at 5-15 mins is similar to the untreated condition (supporting that Ser935 is nearly saturated in unstimulated conditions), the phosphorylation of RABs during this time period exceeds unstimulated levels. These findings support the notion that, under basal conditions, RAB phosphorylation is far from saturation. The antibodies used to detect RAB phosphorylation are the following: RAB10 Abcam # ab230261 e RAB8 (pan RABs) Abcam # ab230260.
Given the robust response of RAB10 phosphorylation upon BDNF stimulation, we further investigated RAB10 phosphorylation during BDNF stimulation in naïve SH-SY5Y cells. We confirmed that the increase in pSer935 is coupled to increase in pT73-RAB10. Also in this case, RAB10 phosphorylation does not go below the unstimulated level, which aligns with the low pRAB10 stoichiometry in brain (Nirujogi et al., Biochem J 2021). This experiment adds the novel and exciting finding that BDNF stimulation increases LRRK2 kinase activity (RAB phosphorylation) in neuronal cells.
Note that new supplemental figure 1 now includes: A) a comparison of LRRK2 pS935 and total protein levels before and after RA differentiation; B) differentiated GFP-LRRK2 SH-SY5Y (unstimulated, BDNF, MLi-2, BDNF+MLi-2); C) the kinetic of BDNF response in differentiated GFP-LRRK2 SH-SY5Y.
(b) Drebrin coIP itself looks like a very strong result, as does the increase after BDNF, but this was only demonstrated with a GFP over-expression construct despite several mouse and neuron models being employed elsewhere and available for copIP of endogenous LRRK2. Also, the coIP is only demonstrated in one direction. Similarly, the decrease in drebrin levels in mice is not assessed in the other model systems, coIP wasn't done, and mRNA transcripts are not quantified (even though others were). Drebrin phosphorylation state is not examined.
We appreciate the Reviewer suggestions and provided additional experimental evidence supporting the functional relevance of LRRK2-drebrin interaction.
(1) As suggested, we performed qPCR and observed that 1 month-old KO midbrain and cortex express lower levels of Dbn1 as compared to WT brains (Figure 5G). This result is in agreement with the western blot data (Figure 5H).
(2)To further validate the physiological relevance of LRRK2-drebrin interaction we performed two experiments:
i) Western blots looking at pSer935 and pRab8 (pan Rab) in Dbn1 WT and knockout brains. As reported and quantified in Figure 2I, we observed a significant decrease in pSer935 and a trend decrease in pRab8 in Dbn1 KO brains. This finding supports the notion that Drebrin forms a complex with LRRK2 that is important for its activity, e.g. upon BDNF stimulation.
ii) Reverse co-immunoprecipitation of YFP-drebrin full-length, N-terminal domain (1-256 aa) and C-terminal domain (256-649 aa) (plasmids kindly received from Professor Phillip R. Gordon-Weeks, Worth et al., J Cell Biol, 2013) with Flag-LRRK2 co-expressed in HEK293T cells. As shown in supplementary Fig. S2C, we confirm that YFP-drebrin binds LRRK2, with the Nterminal region of drebrin appearing to be the major contributor to this interaction. This result is important as the N-terminal region contains the ADF-H (actin-depolymerising factor homology) domain and a coil-coil region known to directly bind actin (Shirao et al., J Neurochem 2017; Koganezawa et al., Mol Cell Neurosci. 2017). Interestingly, both full-length Drebrin and its truncated C-terminal construct cause the same morphological changes in Factin, indicating that Drebrin-induced morphological changes in F-actin are mediated by its N-terminal domains rather than its intrinsically disordered C-terminal region (Shirao et al., J Neurochem, 2017; Koganezawa et al., Mol Cell Neurosci. 2017). Given the role of LRRK2 in actin-cytoskeletal dynamics and its binding with multiple actin-related protein binding (Fig. 2 and Meixner et al., Mol Cell Proteomics. 2011; Parisiadou and Cai, Commun Integr Biol 2010), these results suggest the possibility that LRRK2 controls actin dynamics by competing with drebrin binding to actin and open new avenues for futures studies.
(3) To address the request for examining drebrin phosphorylation state, we decided to perform another phophoproteomic experiment, leveraging a parallel analysis incorporated in our latest manuscript (Chen et al., Mol Theraphy 2025). In this experiment, we isolated total striatal proteins from WT and G2019S KI mice and enriched the phospho-peptides. Unlike the experiment presented in Fig. 7, phosphopeptides were enriched from total striatal lysates rather than synaptosomal fractions, and phosphorylation levels were normalized to the corresponding total protein abundance. This approach was intended to avoid bias toward synaptic proteins, allowing for the analysis of a broader pool of proteins derived from a heterogeneous ensemble of cell types (neurons, glia, endothelial cells, pericytes etc.). We were pleased to find that this new experiment confirmed drebrin S339 as a differentially phosphorylated site, with a 3.7 fold higher abundance in G2019S Lrrk2 KI mice. The fact that this experiment evidenced an increased phosphorylation stoichiometry in G2019S mice rather than a decreased is likely due to the normalization of each peptide by its corresponding total protein. Gene ontology analysis of differentially phosphorylated proteins using stringent term size (<200 genes) showed post-synaptic spines and presynaptic active zones as enriched categories (Fig. 3F). A SynGO analysis confirms both pre and postsynaptic categories, with high significance for terms related to postsynaptic cytoskeleton (Fig. 3G). As pointed, this is particularly interesting as the starting material was whole striatal tissue – not synaptosomes as previously – indicating that most significant phosphorylation differences occur in synaptic compartments. This once again reinforces our hypothesis that LRRK2 has a prominent role in the synapse. Overall, we confirmed with an independent phosphoproteomic analysis that LRRK2 kinase activity influences the phosphorylation state of proteins related to synaptic function, particularly postsynaptic cytoskeleton. For clarity in data presentation, as mentioned by the Reviewers, we removed Figure 7 and incorporated this new analysis in figure 3, alongside the synaptic cluster analysis.
Altogether, three independent OMICs approaches – (i) experimental LRRK2 interactomics in neuronal cells, (ii) a literature-based LRRK2 synaptic/cytoskeletal interactor cluster, and (iii) a phospho-proteomic analysis of striatal proteins from G2019S KI mice (to model LRRK2 hyperactivity) – converge to synaptic actin-cytoskeleton as a key hub of LRRK2 neuronal function.
(c) The large differences in the CRISPR KO cells in terms of BDNF responses are not seen in the primary neurons of KO mice, suggesting that other differences between the two might be responsible, rather than the lack of LRRK2 protein.
Considering that some variability is expected for these type of cultures and across different species, any difference in response magnitude and kinetics could be attributed to the levels of TrKB and downstream components expressed by the two cell types.
We are confident that differentiated SH-SY5Y cells provide a reliable model for our study as we could translate the results obtained in SH-SY5Y cells in other models. However, to rule out the possibility that the more pronounced effect observed in SH-SY5Y KO cells as respect to Lrrk2 KO primary neurons was due to CRISPR off-target effect, we performed an off-target analysis. Specifically, we selected the first 8 putative off targets exhibiting a CDF (Cutting Frequency Determination) off-target-score >0.2.
As shown in supplemental file 1, sequence disruption was observed only in the LRRK2 ontarget site in LRRK2 KO SH-SY5Y cells, while the 8 off-target regions remained unchanged across the genotypes and relative to the reference sequence.
(d) No validation of hits in the G2019S mutant phosphoproteomics, and no other assays related to the rest of the paper/conclusions. Drebrin phosphorylation is different but unvalidated, or related to previous data sets beyond some discussion. The fact that LRRK2 binding occurs, and increases with BDNF stimulation, should be compared to its phosphorylation status and the effects of the G2019S mutation.
As illustrated in the response to point (b), we performed a new phosphoproteomics investigation – with total striatal lysates instead of striatal synaptosomes and normalization phospho-peptides over total proteins – and found that S339 phosphorylation increases when LRRK2 kinase activity increases (G2019S). To address the request of validating drebrin phosphorylation, the main limitation is that there are no available antibodies against Ser339. While we tried phos-Tag gels in striatal lysates, we could not detect any reliable and specific signal with the same drebrin antibody used for western blot (Thermo Fisher Scientific: MA120377) due to technical limitations of the phosTag method. We are confident that phosphorylation at S339 has a physiological relevance, as it was identified 67 times across multiple proteomic discovery studies and they are placed among the most frequently phosphorylated sites in drebrin (https://www.phosphosite.org/proteinAction.action?id=2675&showAllSites=true).
To infer a possible role of this phosphorylation, we looked at the predicted pathogenicity of using AlphaMissense (Cheng et al., Science 2023). included as supplementary figure (Fig. S3), aminoacid substitutions within this site are predicted not to be pathogenic, also due to the low confidence of the AlphaFold structure.
Ser339 in human drebrin is located just before the proline-rich region (PP domain) of the protein. This region is situated between the actin-binding domains and the C-terminal Homerbinding sequences and plays a role in protein-protein interactions and cytoskeletal regulation (Worth et al., J Cell Biol, 2013). Of interest, this region was previously shown to be the interaction site of adafin (ADFN), a protein involved in multiple cytoskeletal-related processes, including synapse formation and function by regulating puncta adherentia junctions, presynaptic differentiation, and cadherin complex assembly, which are essential for hippocampal excitatory synapses, spine formation, and learning and memory processes (Beaudoin, G. M., 3rd et al., J Neurosci, 2013). Of note, adafin is in the list of LRRK2 interacting proteins (https://www.ebi.ac.uk/intact/home), supporting a possible functional relevance of LRRK2-mediated drebrin phosphorylation in adafin-drebrin complex formation. This has been discussed in the discussion section.
The aim of this MS analysis in G2019S KI mice – now included in figure 3 – was to further validate the crucial role of LRRK2 kinase activity in the context of synaptic regulation, rather than to discover and characterize novel substrates. Consequently, Figure 7 has been eliminated.
Reviewer #2 (Public Review):
Taken as a whole, the data in the manuscript show that BDNF can regulate PD-associated kinase LRRK2 and that LRRK2 modifies the BDNF response. The chief strength is that the data provide a potential focal point for multiple observations across many labs. Since LRRK2 has emerged as a protein that is likely to be part of the pathology in both sporadic and LRRK2 PD, the findings will be of broad interest. At the same time, the data used to imply a causal throughline from BDNF to LRRK2 to synaptic function and actin cytoskeleton (as in the title) are mostly correlative and the presentation often extends beyond the data. This introduces unnecessary confusion. There are also many methodological details that are lacking or difficult to find. These issues can be addressed.
We appreciate the Reviewer’s positive feedback on our study. We also value the suggestion to present the data in a more streamlined and coherent way. In response, we have updated the title to better reflect our overall findings: “LRRK2 Regulates Synaptic Function through Modulation of Actin Cytoskeletal Dynamics.” Additionally, we have included several experiments that we believe enhance and unify the study.
(1) The writing/interpretation gets ahead of the data in places and this was confusing. For example, the abstract highlights prior work showing that Ser935 LRRK2 phosphorylation changes LRRK2 localization, and Figure 1 shows that BDNF rapidly increases LRRK2 phosphorylation at this site. Subsequent figures highlight effects at synapses or with synaptic proteins. So is the assumption that LRRK2 is recruited to (or away from) synapses in response to BDNF? Figure 2H shows that LRRK2-drebrin interactions are enhanced in response to BDNF in retinoic acid-treated SH-SY5Y cells, but are synapses generated in these preps? How similar are these preps to the mouse and human cortical or mouse striatal neurons discussed in other parts of the paper (would it be anticipated that BDNF act similarly?) and how valid are SHSY5Y cells as a model for identifying synaptic proteins? Is drebrin localization to synapses (or its presence in synaptosomes) modified by BDNF treatment +/- LRRK2? Or do LRRK2 levels in synaptosomes change in response to BDNF? The presentation requires re-writing to stay within the constraints of the data or additional data should be added to more completely back up the logic.
We thank the Reviewer for the thorough suggestions and comments. We have extensively revised the text to accurately reflect our findings without overinterpreting. In particular, we agree with the Reviewer that differentiated SH-SY5Y cells are not identical to primary mouse or human neurons; however both neuronal models respond to BDNF. Supporting our observations, it is known that SH-SY5Y cells respond to BDNF. In fact, a common protocol for differentiating SH-SY5Y cells involve BDNF in combination with retinoic acid (Martin et al., Front Pharmacol, 2022; Kovalevich et al., Methods in mol bio, 2013). Additionally, it has been reported that SH-SY5Y cells can form functional synapses (Martin et al., Front Pharmacol, 2022). While we are aware that BDNF, drebrin or LRRK2 can also affect non-synaptic pathways, we focused on synapses when moved to mouse models since: (i) MS and phosphoMS identified several cytoskeletal proteins enriched at the synapse, (ii) we and others have previously reported a role for LRRK2 in governing synaptic and cytoskeletal related processes; (iii) the synapse is a critical site that becomes dysfunctional in the early stages of PD. We have now clarified and adjusted the text as needed. We have also performed additional experiments to address the Reviewer’s concern:
(1) “Is the assumption that LRRK2 is recruited to (or away from) synapses in response to BDNF”? This is a very important point. There is consensus in the field that detecting endogenous LRRK2 in brain slices or in primary neurons via immunofluorescence is very challenging with the commercially available antibodies (Fernandez et al., J Parkinsons Dis, 2022). We established a method in our previous studies to detect LRRK2 biochemically in synaptosomes (Cirnaru et al., Front Mol Neurosci, 2014; Belluzzi et al., Mol Neurodegener., 2016). While these data indicate LRRK2 is present in the synaptic compartments, it would be quite challenging to apply this method to the present study. In fact, applying acute BDNF stimulation in vivo and then isolate synaptosomes is a complex experiment beyond the timeframe of the revision due to the need of mouse ethical approvals. However, this is definitely an intriguing angle to explore in the future.
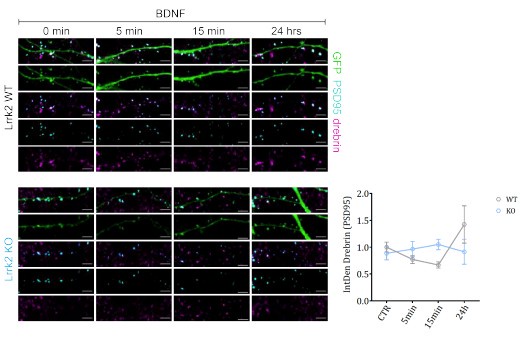
(2)“Is drebrin localization to synapses (or its presence in synaptosomes) modified by BDNF treatment +/- LRRK2?” To try and address this question, we adapted a previously published assay to measure drebrin exodus from dendritic spines. During calcium entry and LTP, drebrin exits dendritic spines and accumulates in the dendritic shafts and cell body (Koganezawa et al., 2017). This facilitates the reorganization of the actin cytoskeleton (Shirao et al., 2017). Given the known role of drebrin and its interaction with LRRK2, we hypothesized that LRRK2 loss might affect drebrin relocalization during spine maturation.
To test this, we treated DIV14 primary cortical neurons from Lrrk2 WT and KO mice with BDNF for 5, 15, and 24 hours, then performed confocal imaging of drebrin localization (Author response image 1). Neurons were transfected at DIV4 with GFP (cell filler) and PSD95 (dendritic spines) for visualization, and endogenous drebrin was stained with an anti-drebrin antibody. We then measured drebrin's overlap with PSD95-positive puncta to track its localization at the spine.
In Lrrk2 WT neurons, drebrin relocalized from spines after BDNF stimulation, peaking at 15 minutes and showing higher co-localization with PSD95 at 24 hours, indicating the spine remodeling occurred. In contrast, Lrrk2 KO neurons showed no drebrin exodus. These findings support the notion that LRRK2's interaction with drebrin is important for spine remodeling via BDNF. However, additional experiments with larger sample sizes are needed, which were not feasible within the revision timeframe (here n=2 experiments with independent neuronal preparations, n=4-7 neurons analyzed per experiment). Thus, we included the relevant figure as Author response image 1 but chose not to add it in the manuscript (figure 3).
Author response image 1.
Lrrk2 affects drebrin exodus from dendritic spines. After the exposure to BDNF for different times (5 minutes, 15 minutes and 24 hours), primary neurons from Lrrk2 WT and KO mice have been transfected with GFP and PSD95 and stained for endogenous drebrin at DIV4. The amount of drebrin localizing in dentritic spines outlined by PSD95 has been assessed at DIV14. The graph shows a pronounced decrease in drebrin content in WT neurons during short time treatments and an increase after 24 hours. KO neurons present no evident variations in drebrin localization upon BDNF stimulation. Scale bar: 4 μm.
(2) The experiments make use of multiple different kinds of preps. This makes it difficult at times to follow and interpret some of the experiments, and it would be of great benefit to more assertively insert "mouse" or "human" and cell type (cortical, glutamatergic, striatal, gabaergic) etc.
We thank the Reviewer for pointing this out. We have now more clearly specified the cell type and species identity throughout the text to improve clarity and interpretation.
(3) Although BDNF induces quantitatively lower levels of ERK or Akt phosphorylation in LRRK2KO preps based on the graphs (Figure 4B, D), the western blot data in Figure 4C make clear that BDNF does not need LRRK2 to mediate either ERK or Akt activation in mouse cortical neurons and in 4A, ERK in SH-SY5Y cells. The presentation of the data in the results (and echoed in the discussion) writes of a "remarkably weaker response". The data in the blots demand more nuance. It seems that LRRK2 may potentiate a response to BDNF that in neurons is independent of LRRK2 kinase activity (as noted). This is more of a point of interpretation, but the words do not match the images.
We thank the Reviewer for pointing this out. We have rephrased our data presentation to better convey our findings. We were not surprised to find that loss of LRRK2 causes only a reduction of ERK and AKT activation upon BDNF rather than a complete loss. This is because these pathways are complex and redundant and are activated by a number of cellular effectors. The fact that LRRK2 is one among many players whose function can be compensated by other signaling molecules is also supported by the phenotype of Lrrk2 KO mice that is measurable at 1 month but disappears with adulthood (4 and 18 months) (figure 5).
Moreover, we removed the sentence “Of note, 90 mins of Lrrk2 inhibition (MLi-2) prior to BDNF stimulation did not prevent phosphorylation of Akt and Erk1/2, suggesting that LRRK2 participates in BDNF-induced phosphorylation of Akt and Erk1/2 independently from its kinase activity but dependently from its ability to be phosphorylated at Ser935 (Fig. 4C-D and Fig. 1B-C)” since the MLi-2 treatment prior to BDNF stimulation was not quantified and our new data point to an involvement of LRRK2 kinase activity upon BDNF stimulation.
(4) Figure 4F/G shows an increase in PSD95 puncta per unit length in response to BDNF in mouse cortical neurons. The data do not show spine induction/dendritic spine density/or spine morphogenesis as suggested in the accompanying text (page 8). Since the neurons are filled/express gfp, spine density could be added or spines having PSD95 puncta. However, the data as reported would be expected to reflect spine and shaft PSDs and could also include some nonsynaptic sites.
The Reviewer is right. We have rephrased the text to reflect an increase in postsynaptic density (PSD) sites, which may include both spine and shaft PSDs, as well as potential nonsynaptic sites.
(5) Experimental details are missing that are needed to fully interpret the data. There are no electron microscopy methods outside of the figure legend. And for this and most other microscopy-based data, there are few to no descriptions of what cells/sites were sampled, how many sites were sampled, and how regions/cells were chosen. For some experiments (like Figure 5D), some detail is provided in the legend (20 segments from each mouse), but it is not clear how many neurons this represents, where in the striatum these neurons reside, etc. For confocal z-stacks, how thick are the optical sections and how thick is the stack? The methods suggest that data were analyzed as collapsed projections, but they cite Imaris, which usually uses volumes, so this is confusing. The guide (sgRNA) sequences that were used should be included. There is no mention of sex as a biological variable.
We thank the Reviewer for pointing out this missing information. We have now included:
(1) EM methods (page 24)
(2) Methods for ICC and confocal microscopy now incorporates the Z-stack thickness (0.5 μm x 6 = 3 μm) on page 23.
(3) Methods for Golgi-Cox staining now incorporates the Z-stack thickness and number of neurons and segments per neuron analyzed.
(4) The sex of mice is mentioned in the material and methods (page 17): “Approximately equal numbers of males and females were used for every experiment”.
(6) For Figures 1F, G, and E, how many experimental replicates are represented by blots that are shown? Graphs/statistics could be added to the supplement. For 1C and 1I, the ANOVA p-value should be added in the legend (in addition to the post hoc value provided).
The blots relative to figure 1F,G and E are representative of several blots (at least n=5). The same redouts are part of figure 4 where quantifications are provided. We added the ANOVA p-value in the legend for figure 1C, 1I and 1K.
(7) Why choose 15 minutes of BDNF exposure for the mass spec experiments when the kinetics in Figure 1 show a peak at 5 mins?
This is an important point. We repeated the experiment in GFP-LRRK2 SH-SY5Y cells (figure S1C) and included the 15 min time point. In addition to confirming that pSer935 increases similarly at 5 and 15 minutes, we also observed an increase in RAB phosphorylation at these time points. As mentioned in our response to Reviewer’s 1, we pretreated with MLi-2 for 90 minutes in this experiment to reduce the high basal phosphorylation stoichiometry of pSer935.
(8) The schematic in Figure 6A suggests that iPSCs were plated, differentiated, and cultured until about day 70 when they were used for recordings. But the methods suggest they were differentiated and then cryopreserved at day 30, and then replated and cultured for 40 more days. Please clarify if day 70 reflects time after re-plating (30+70) or total time in culture (70). If the latter, please add some notes about re-differentiation, etc.
We thank the reviewer for providing further clarity on the iPSC methodology. In the submitted manuscript 70DIV represents the total time in vitro and the process involved a cryostorage event at 30DIV, with a thaw of the cells and a further 40 days of maturation before measurement. We have adjusted the methods in both the text and figure (new schematic) to clarify this. The cryopreservation step has been used in other iPSC methods to great effect (Drummond et al., Front Cell Dev Biol, 2020). Due to the complexity and length of the iPSC neuronal differentiation process, cryopreservation represents a useful method with which to shorten and enhance the ability to repeat experiments and reduce considerable variation between differentiations. User defined differences in culture conditions for each batch of neurons thawed can usefully be treated as a new and separate N compared to the next batch of neurons.
(9) When Figures 6B and 6C are compared it appears that mEPSC frequency may increase earlier in the LRRK2KO preps than in the WT preps since the values appear to be similar to WT + BDNF. In this light, BDNF treatment may have reached a ceiling in the LRRK2KO neurons.
We thank the reviewer for his/her comment and observations about the ceiling effects. It is indeed possible that the loss of LRRK2 and the application of BDNF could cause the same elevation in synaptic neurotransmission. In such a situation, the increased activity as a result of BDNF treatment would be masked by the increased activity observed as a result of LRRK2 KO. To better visualize the difference between WT and KO cultures and the possible ceiling effect, we merged the data in one single graph.
(10) Schematic data in Figures 5A and C and Figures 5B and E are too small to read/see the data.
We thank the Reviewer for this suggestion. We have now enlarged figure 5A and moved the graph of figure 5D in supplemental figure S5, since this analysis of spine morphology is secondary to the one shown in figure 5C.
Reviewer #1 (Recommendations For The Authors):
Please forgive any redundancy in the comments, I wanted to provide the authors with as much information as I had to explain my opinion.
Primary mouse cortical neurons at div14, 20% transient increase in S935 pLRRK2 5min after BDNF, which then declines by 30 minutes (below pre-stim levels, and maybe LRRK2 protein levels do also).
In differentiated SHSY5Y cells there is a large expected increase in pERK and pAKT that is sustained way above pre-stim for 60 minutes. There is a 50% initial increase in pLRRK2 (but the blot is not very clear and no double band in these cells), which then looks like reduced well below pre-stim by 30 & 60 minutes.
We thank the Reviewer for bring up this important point. We have extensively addressed this issue in the public review rebuttal. In essence, the phosphorylation of Ser935 is near saturation under unstimulated conditions, as evidenced by its high basal stoichiometry, whereas Rab phosphorylation is far from saturation, showing an increase upon BDNF stimulation before returning to baseline levels. This distinction highlights that while pSer935 exhibits a ceiling effect due to its near-maximal phosphorylation at rest, pRab responds dynamically to BDNF, indicating low basal phosphorylation and a significant capacity for increase. Figure 1 in the rebuttal summarizes the new data collected.
GFP-fused overexpressed LRRK2 coIPs with drebrin, and this is double following 15 min BDNF. Strong result.
We thank the Reviewer.
BDNF-induced pAKT signaling is greatly impaired, and pERK is somewhat impaired, in CRISPR LKO SHSY5Y cells. In mouse primaries, both AKT and Erk phosph is robustly increased and sustained over 60 minutes in WT and LKO. This might be initially less in LKO for Akt (hard to argue on a WB n of 3 with huge WT variability), regardless they are all roughly the same by 60 minutes and even look higher in LKO at 60. This seems like a big disconnect and suggests the impairment in the SHSy5Y cells might have more to do with the CRISPR process than the LRRK2. Were the cells sequenced for off-target CRISPR-induced modifications?
Following the Reviewer suggestion – and as discussed in the public review section - we performed an off-target analysis. Specifically, we selected the first 8 putative off targets exhibiting a CDF (Cutting Frequency Determination) off-target-score >0.2. As shown in supplemental file 1, sequence disruption was observed only in the LRRK2 on-target site in LRRK2 KO SH-SY5Y cells, while the 8 off-target regions remained unchanged across the genotypes and relative to the reference sequence.
No difference in the density of large PSD-95 puncta in dendrites of LKO primary relative to WT, and the small (10%) increase seen in WT after BDNF might be absent in LKO (it is not clear to me that this is absent in every culture rep, and the data is not highly convincing). This is also referred to as spinogenesis, which has not been quantified. Why not is confusing as they did use a GFP fill...
The Reviewer is right that spinogenesis is not the appropriate term for the process analyzed. We replaced “spinogenesis” with “morphological alternation of dendritic protrusions” or “synapse maturation” which is correlated with the number of PSD95 positive puncta (ElHusseini et al., Science, 2000) .
There is a difference in the percentage of dendritic protrusions classified as filopodia to more being classified as thin spines in LKO striatal neurons at 1 month, which is not seen at any other age, The WT filopodia seems to drop and thin spine percent rise to be similar to LKO at 4 months. This is taken as evidence for delayed maturation in LKO, but the data suggest the opposite. These authors previously published decreased spine and increased filopodia density at P15 in LKO. Now they show that filopodia density is decreased and thin spine density increased at one month. How is that shift from increased to decreased filopodia density in LKO (faster than WT from a larger initial point) evidence of impaired maturation? Again this seems accelerated?
We agree with the Reviewer that the initial interpretation was indeed confusing. To adhere closely to our data and avoid overinterpretation – as also suggested by Reviewer 2 – we revised the text and moved figure 5D to supplementary materials. In essence, our data point out to alterations in the structural properties of dendritic protrusions in young KO mice, specifically a reduction in their size (head width and neck height) and a decrease in postsynaptic density (PSD) length, as observed with TEM. These findings suggest that LRRK2 is involved in morphological processes during spine development.
Shank3 and PSD95 mRNA transcript levels were reduced in the LKO midbrain, only shank3 was reduced in the striatum and only PSD was reduced in the cortex. No changes to mRNA of BDNF-related transcripts. None of these mRNA changes protein-validated. Drebrin protein (where is drebrin mRNA?) levels are reduced in LKO at 1&4 but not clearly at 18 months (seems the most robust result but doesn't correlate with other measures, which here is basically a transient increase (1m) in thin striatal spines).
As illustrated before, we performed qPCR for Dbn1 and found that its expression is significantly reduced in the cortex and midbrain and non-significantly reduced in the striatum (1 months old mice, a different cohort as those used for the other analysis in figure 5).
24h BDNF increases the frequency of mEPSCs on hIPSC-derived cortical-like neurons, but not LKO, which is already high. There are no details of synapse number or anything for these cultures and compares 24h treatment. BDNF increases mEPSC frequency within minutes PMC3397209, and acute application while recording on cells may be much more informative (effects of BDNF directly, and no issues with cell-cell / culture variability). Calling mEPSC "spontaneous electrical activity" is not standard.
We thank the reviewer for this point. We provided information about synapse number (Bassoon/Homer colocalization) in supplementary figure S7. The lack of response of LRRK2 KO cultures in terms of mEPSC is likely due to increase release probability as the number of synapses does not change between the two genotypes.
The pattern of LRRK2 activation is very disconnected from that of BDNF signalling onto other kinases. Regarding pLRRK2, s935 is a non-autophosph site said to be required for LRRK2 enzymatic activity, that is mostly used in the field as a readout of successful LRRK2 inhibition, with some evidence that this site regulates LRRK2 subcellular localization (which might be more to do with whether or not it is p at 935 and therefor able to act as a kinase).
The authors imply BDNF is activating LRRK2, but really should have looked at other sites, such as the autophospho site 1292 and 'known' LRRK2 substrates like T73 pRab10 (or other e.g., pRab12) as evidence of LRRK2 activation. One can easily argue that the initial increase in pLRRK2 at this site is less consequential than the observation that BDNF silences LRRK2 activity based on p935 being sustained to being reduced after 5 minutes, and well below the prestim levels... not that BDNF activates LRRK2.
As described above, we have collected new data showing that BDNF stimulation increases LRRK2 kinase activity toward its physiological substrates Rab10 and Rab8 (using a panphospho-Rab antibody) (Figure 1 and Figure S1). Additionally, we have also extensively commented the ceiling effect of pS935.
BDNF does a LOT. What happens to network activity in the neural cultures with BDNF application? Should go up immediately. Would increasing neural activity (i.e., through depolarization, forskolin, disinhibition, or something else without BDNF) give a similar 20% increase in pS935 LRRK2? Can this be additive, or occluded? This would have major implications for the conclusions that BDNF and pLRRK2 are tightly linked (as the title suggests).
These are very valuable observations; however, they fall outside the scope and timeframe of this study. We agree that future research should focus on gaining a deeper mechanistic understanding of how LRRK2 regulates synaptic activity, including vesicle release probability and postsynaptic spine maturation, independently of BDNF.
Figures 1A & H "Western blot analysis revealed a rapid (5 mins) and transient increase of Ser935 phosphorylation after BDNF treatment (Fig. 1B and 1C). Of interest, BDNF failed to stimulate Ser935 phosphorylation when neurons were pretreated with the LRRK2 inhibitor MLi-2" . The first thing that stands out is that the pLRRK2 in WB is not very clear at all (although we appreciate it is 'a pig' to work with, I'd hope some replicates are clearer); besides that, the 20% increase only at 5min post-BDNF stimulation seems like a much less profound change than the reduction from base at 60 and more at 180 minutes (where total LRRK2 protein is also going down?). That the blot at 60 minutes in H is representative of a 30% reduction seems off... makes me wonder about the background subtraction in quantification (for this there is much less pLRRK2 and more total LRRK2 than at 0 or 5). LRRK2 (especially) and pLRRK2 seem very sketchy in H. Also, total LRRK2 appears to increase in the SHSY5Y cell not the neurons, and this seems even clearer in 2 H.
To better visualize the dynamics of pS935 variation relative to time=0, we presented the data as the difference between t=0 and t=x. It clearly shows that pSe935 goes below prestimulation levels, whereas pRab10 does not. The large difference in the initial stoichiometry of these two phosphorylation is extensively discussed above.
That MLi2 eliminates pLRRK2 (and seems to reduce LRRK2 protein?) isn't surprising, but a 90min pretreatment with MLi-2 should be compared to MLi-2's vehicle alone (MLi-2 is notoriously insoluble and the majority of diluents have bioactive effects like changing activity)... especially if concluding increased pLRRK2 in response to BDNF is a crucial point (when comparing against effects on other protein modifications such as pAKT). This highlights a second point... the changes to pERK and pAKT are huge following BDNF (nothing to massive quantities), whereas pLRRK2 increases are 20-50% at best. This suggests a very modest effect of BDNF on LRRK in neurons, compared to the other kinases. I worry this might be less consequential than claimed. Change in S1 is also unlikely to be significant...
These comments have been thoroughly addressed in the previous responses. Regarding fig. S1, we added an additional experiment (Figure S1C) in GFP-LRRK2 cells showing robust activation of LRRK2 (pS935, pRabs) at the timepoint of MS (15 min).
"As the yields of endogenous LRRK2 purification were insufficient for AP-MS/MS analysis, we generated polyclonal SH-SY5Y cells stably expressing GFP-LRRK2 wild-type or GFP control (Supplementary Fig. 1)" . I am concerned that much is being assumed regarding 'synaptic function' from SHSY5Y cells... also overexpressing GFP-LRRK2 and looking at its binding after BDNF isn't synaptic function.
We appreciate the reviewer’s comment. We would like to clarify that the interactors enriched upon BDNF stimulation predominantly fall into semantic categories related to the synapse and actin cytoskeleton. While this does not imply that these interactors are exclusively synaptic, it suggests that this tightly interconnected network likely plays a role in synaptic function. This interpretation is supported by several lines of evidence: (1) previous studies have demonstrated the relevance of this compartment to LRRK2 function; (2) our new phosphoproteomics data from striatal lysate highlight enrichment of synaptic categories; and (3) analysis of the latest GWAS gene list (134 genes) also indicates significant enrichment of synapse-related categories. Taken together, these findings justify further investigation into the role of LRRK2 in synaptic biology, as discussed extensively in the manuscript’s discussion section.
Figure 2A isn't alluded to in text and supplemental table 1 isn't about LRRK2 binding, but mEPSCs.
We have added Figure 2A and added supplementary .xls table 1, which refers to the excel list of genes with modulated interaction upon BDNF (uploaded in the supplemental material).
We added the extension .xls also for supplementary table 2 and 3.
Figure 2A is useless without some hits being named, and the donut plots in B add nothing beyond a statement that "35% of 'genes' (shouldn't this be proteins?) among the total 207 LRRK2 interactors were SynGO annotated" might as well [just] be the sentence in the text.
We have now included the names of the most significant hits, including cytoskeletal and translation-related proteins, as well as known LRRK2 interactors. We decided to retain the donut plots, as we believe they simplify data interpretation for the reader, reducing the need to jump back and forth between the figures and the text.
Validation of drebrin binding in 2H is great... although only one of 8 named hits; could be increased to include some of the others. A concern alludes to my previous point... there is no appreciable LRRK2 in these cells until GFP-LRRK2 is overexpressed; is this addressed in the MS? Conclusions would be much stronger if bidirectional coIP of these binding candidates were shown with endogenous (GFP-ve) LRRK2 (primaries or hIPSCs, brain tissue?)
To address the Reviewer’s concerns to the best of our abilities, we have added a blot in Supplemental figure S1A showing how the expression levels of LRRK2 increase after RA differentiation. Moreover, we have included several new data further strengthening the functional link between LRRK2 and drebrin, including qPCR of Dbn1 in one-month old Lrrk2 KO brains, western blots of Lrrk2 and Rab in Dbn1 KO brains, and co-IP with drebrin N- and Cterm domains.
Figures 3 A-C are not informative beyond the text and D could be useful if proteins were annotated.
To avoid overcrowding, proteins were annotated in A and the same network structure reported for synaptic and actin-related interactors.
Figure 4. Is this now endogenous LRRK2 in the SHSY5Y cells? Again not much LRRK2 though, and no pLRRK shown.
We confirm that these are naïve SH-SY5Y cells differentiated with RA and LRRK2 is endogenous. We did not assess pS935 in this experiment, as the primary goal was to evaluate pAKT and pERK1/2 levels. To avoid signal saturation, we loaded less total protein (30 µg instead of the 80 µg typically required to detect pS935). pS935 levels were extensively assessed in Figure 1. This experimental detail has now been added in the material and methods section (page 18).
In C (primary neurons) There is very little increase in pLRRK2 / LRRK2 at 5 mins, and any is much less profound a change than the reduction at 30 & 60 mins. I think this is interesting and may be a more substantial consequence of BDNF treatment than the small early increase. Any 5 min increase is gone by 30 and pLRRK2 is reduced after. This is a disconnect from the timing of all the other pProteins in this assay, yet pLRRK2 is supposed to be regulating the 'synaptic effects'?
The first part of the question has already been extensively addressed. Regarding the timing, one possibility is that LRRK2 is activated upstream of AKT and ERK1/2, a hypothesis supported by the reduced activation of AKT and ERK1/2 observed in LRRK2 KO cells, as discussed in the manuscript, and in MLi-2 treated cells (Author response image 2). Concerning the synaptic effects, it is well established that synaptic structural and functional plasticity occurs downstream of receptor activation and kinase signaling cascades. These changes can be mediated by both rapid mechanisms (e.g., mobilization of receptor-containing endosomes via the actin cytoskeleton) and slower processes involving gene transcription of immediate early genes (IEGs). Since structural and functional changes at the synapse generally manifest several hours after stimulation, we typically assessed synaptic activity and structure 24 hours post-stimulation.
Akt Erk1&2 both go up rapidly after BDNF in WT, although Akt seems to come down with pLRRK2. If they aren't all the same Akt is probably the most different between LKO and WT but I am very concerned about an n=3 for wb, wb is semi-quantitative at best, and many more than three replicates should be assessed, especially if the argument is that the increases are quantitively different between WT v KO (huge variability in WT makes me think if this were done 10x it would all look same). Moreover, this isn't similar to the LKO primaries "pulled pups" pooled presumably.
Despite some variability in the magnitude of the pAKT/pERK response in naïve SH-SY5Y cells, all three independent replicates consistently showed a reduced response in LRRK2 KO cells, yielding a highly significant result in the two-way ANOVA test. In contrast, the difference in response magnitude between WT and LRRK2 KO primary cultures was less pronounced, which justified repeating the experiments with n=9 replicates. We hope the Reviewer acknowledges the inherent variability often observed in western blot experiments, particularly when performed in a fully independent manner (different cultures and stimulations, independent blots).
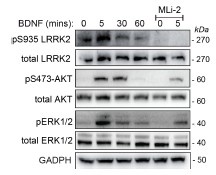
To further strengthen the conclusion that this effect is reproducible and dependent on LRRK2 kinase activity upstream of AKT and ERK, we probed the membranes in figure 1H with pAKT/total AKT and pERK/total ERK. All things considered and consistent with our hypothesis, MLi-2 significantly reduced BDNF-mediated AKT and ERK1/2 phosphorylation levels (Author response image 2).
Author response image 2.
Western blot (same experiments as in figure 1) was performed using antibodies against phospho-Thr202/185 ERK1/2, total ERK1/2 and phospho-Ser473 AKT, total AKT protein levels Retinoic acid-differentiated SH-SY5Y cells stimulated with 100 ng/mL BDNF for 0, 5, 30, 60 mins. MLi-2 was used at 500 nM for 90 mins to inhibit LRRK2 kinase activity.
G lack of KO effect seems to be skewed from one culture in the plot (grey). The scatter makes it hard to read, perhaps display the culture mean +/- BDNF with paired bars. The fact that one replicate may be changing things is suggested by the weirdly significant treatment effect and no genotype effect. Also, these are GFP-filled cells, the dendritic masks should be shown/explained, and I'm very surprised no one counted the number (or type?) of protrusions, especially as the text describes this assay (incorrectly) as spinogenesis...
As suggested by the Reviewer we have replotted the results as bar graphs. Regarding the number of protrusions, we initially counted the number of GFP+ puncta in the WT and did not find any difference (Author response image 3). Due to our imaging setup (confocal microscopy rather than super-resolution imaging and Imaris 3D reconstruction), we were unable to perform a fine morphometric analysis. However, this was not entirely unexpected, as BDNF is known to promote both the formation and maturation of dendritic spines. Therefore, we focused on quantifying PSD95+ puncta as a readout of mature postsynaptic compartments. While we acknowledge that we cannot definitively conclude that each PSD95+ punctum is synaptically connected to a presynaptic terminal, the data do indicate an increase in the number of PSD95+ structures following BDNF stimulation.
Author response image 3.
GFP+ puncta per unit of neurite length (µm) in DIV14 WT primary neurons untreated or upon 24 hour of BDNF treatment (100 ng/ml). No significant difference were observed (n=3).
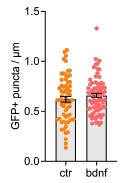
Figure 5. "Dendritic spine maturation is delayed in Lrrk2 knockout mice". The only significant change is at 1 month in KO which shows fewer filopodia and increased thin spines (50% vs wt). At 4 months the % of thin spines is increased to 60% in both... Filopodia also look like 4m in KO at 1m... How is that evidence for delayed maturation? If anything it suggests the KO spines are maturing faster. "the average neck height was 15% shorter and the average head width was 27% smaller, meaning that spines are smaller in Lrrk2 KO brains" - it seems odd to say this before saying that actually there are just MORE thin spines, the number of mature "mushroom' is same throughout, and the different percentage of thin comes from fewer filopodia. This central argument that maturation is delayed is not supported and could be backwards, at least according to this data. Similarly, the average PSD length is likely impacted by a preponderance of thin spines in KO... which if mature were fewer would make sense to say delayed KO maturation, but this isn't the case, it is the fewer filopodia (with no PSD) that change the numbers. See previous comments of the preceding manuscript.
We agree that thin spines, while often considered more immature, represent an intermediate stage in spine development. The data showing an increase in thin spines at 1 month in the KO mice, along with fewer filopodia, could suggest a faster stabilization of these spines, which might indeed be indicative of premature maturation rather than delayed maturation. This change in spine morphology may indicate that the dynamics of synaptic plasticity are affected. Regarding the PSD length, as the Reviewer pointed out, the increased presence of thin spines in KO might account for the observed changes in PSD measurements, as thin spines typically have smaller PSDs. This further reinforces the idea that the overall maturation process may be altered in the KO, but not necessarily delayed.
We rephrase the interpretation of these data, and moved figure 5D as supplemental figure S4.
"To establish whether loss of Lrrk2 in young mice causes a reduction in dendritic spines size by influencing BDNF-TrkB expression" - there is no evidence of this.
We agree and reorganized the text, removing this sentence.
Shank and PSD95 mRNA changes being shown without protein adds very little. Why is drebrin RNA not shown? Also should be several housekeeping RNAs, not one (RPL27)?
We measured Dbn1 mRNA, which shows a significant reduction in midbrain and cortex. Moreover we have now normalized the transcript levels against the geometrical means of three housekeeping genes (RPL27, actin, and GAPDH) relative abundance.
Drebrin levels being lower in KO seems to be the strongest result of the paper so far (shame no pLRRK2 or coIP of drebrin to back up the argument). DrebrinA KO mice have normal spines, what about haploinsufficient drebrin mice (LKO seem to have half derbrin, but only as youngsters?)
As extensively explained in the public review, we used Dbn1 KO mouse brains and were able to show reduced Lrrk2 activity.
Figure 6. hIPSC-derived cortical neurons. The WT 'cortical' neurons have a very low mEPSC frequency at 0.2Hz relative to KO. Is this because they are more or less mature? What is the EPSC frequency of these cells at 30 and 90 days for comparison? Also, it is very very hard to infer anything about mEPSC frequency in the absence of estimates of cell number and more importantly synapse number. Furthermore, where are the details of cell measures such as capacitance, resistance, and quality control e.g., Ra? Table s1 seems redundant here, besides suggesting that the amplitude is higher in KO at base.
We agree that the developmental trajectory of iPSC-derived neurons is critical to accurately interpreting synaptic function and plasticity. In response, we have included additional data now presented in the supplementary figure S7 and summarize key findings below:
At DIV50, both WT and LRRK2 KO neurons exhibit low basal mEPSC activity (~0.5 Hz) and no response to 24 h BDNF stimulation (50 ng/mL).
At DIV70 WT neurons show very low basal activity (~0.2 Hz), which increases ~7.5-fold upon BDNF treatment (1.5 Hz; p < 0.001), and no change in synapse number. KO neurons display elevated basal activity (~1 Hz) similar to BDNF-treated WT neurons, with no further increase upon BDNF exposure (~1.3 Hz) and no change in synapse number.
At DIV90, no significant effect of BDNF in both WT and KO, indicating a possible saturation of plastic responses. The lack of BDNF response at DIV90 may be due to endogenous BDNF production or culture-based saturation effects. While these factors warrant further investigation (e.g., ELISA, co-culture systems), they do not confound the key conclusions regarding the role of LRRK2 in synaptic development and plasticity:
LRRK2 Enables BDNF-Responsive Synaptic Plasticity. In WT neurons, BDNF induces a significant increase in neurotransmitter release (mEPSC frequency) with no reduction in synapse number. This dissociation suggests BDNF promotes presynaptic functional potentiation. KO neurons fail to show changes in either synaptic function or structure in response to BDNF, indicating that LRRK2 is required for activity-dependent remodeling.
LRRK2 Loss Accelerates Synaptic Maturation. At DIV70, KO neurons already exhibit high spontaneous synaptic activity equivalent to BDNF-stimulated WT neurons. This suggests that LRRK2 may act to suppress premature maturation and temporally gate BDNF responsiveness, aligning with the differences in maturation dynamics observed in KO mice (Figure 5).
As suggested by the reviewer we reported the measurement of resistance and capacitance for all DIV (Table 1, supplemental material). A reduction in capacitance was observed in WT neurons at DIV90, which may reflect changes in membrane complexity. However, this did not correlate with differences in synapse number and is unlikely to account for the observed differences in mEPSC frequency. To control for cell number between groups, cell count prior to plating was performed (80k/cm2; see also methods) on the non-dividing cells to keep cell number consistent.
The presence of BDNF in WT seems to make them look like LKO, in the rest of the paper the suggestion is that the LKO lack a response to BDNF. Here it looks like it could be that BDNF signalling is saturated in LKO, or they are just very different at base and lack a response.
Knowing which is important to the conclusions, and acute application (recording and BDNF wash-in) would be much more convincing.
We agree with the Reviewer’s point that saturation of BDNF could influence the interpretation of the data if it were to occur. However, it is important to note that no BDNF exists in the media in base control and KO neuronal culture conditions. This is different from other culture conditions and allows us to investigate the effects of BDNF treatment. Thus, the increased mEPSC frequency observed in KO neurons compared to WT neurons is defined only by the deletion of the gene and not by other extrinsic factors which were kept consistent between the groups. The lack of response or change in mEPSC frequency in KO is proposed to be a compensatory mechanism due to the loss of LRRK2. Of Note, LRRK2 as a “synaptic break” has already been described (Beccano-Kelly et al., Hum Mol Gen, 2015). However, a comprehensive analysis of the underlying molecular mechanisms will require future studies beyond with the scope of this paper.
"The LRRK2 kinase substrates Rabs are not present in the list of significant phosphopeptides, likely due to the low stoichiometry and/or abundance" Likely due to the fact mass spec does not get anywhere near everything.
We removed this sentence in light of the new phosphoproteomic analysis.
Figure 7 is pretty stand-alone, and not validated in any way, hard to justify its inclusion?
As extensively explained we removed figure 7 and included the new phospho-MS as part of figure. 3
Writing throughout shows a very selective and shallow use of the literature.
We extensively reviewed the citations.
"while Lrrk1 transcript in this region is relatively stable during development" The authors reference a very old paper that barely shows any LRRK1 mRNA, and no protein. Others have shown that LRRK1 is essentially not present postnatally PMC2233633. This isn't even an argument the authors need to make.
We thank the reviewer and included this more appropriate citation.
Reviewer #2 (Recommendations For The Authors):
Cyfip1 (Fig 3A) is part of the WAVE complex (page 13).
We thank the reviewer and specified it.
The discussion could be more focused.
We extensively revised the discussion to keep it more focused.
Note that we updated the GO ontology analyses to reflect the updated information present in g:Profiler.
References.
Nirujogi, R. S., Tonelli, F., Taylor, M., Lis, P., Zimprich, A., Sammler, E., & Alessi, D. R. (2021). Development of a multiplexed targeted mass spectrometry assay for LRRK2phosphorylated Rabs and Ser910/Ser935 biomarker sites. The Biochemical journal, 478(2), 299–326. https://doi.org/10.1042/BCJ20200930
Worth, D. C., Daly, C. N., Geraldo, S., Oozeer, F., & Gordon-Weeks, P. R. (2013). Drebrin contains a cryptic F-actin-bundling activity regulated by Cdk5 phosphorylation. The Journal of cell biology, 202(5), 793–806. https://doi.org/10.1083/jcb.201303005
Shirao, T., Hanamura, K., Koganezawa, N., Ishizuka, Y., Yamazaki, H., & Sekino, Y. (2017). The role of drebrin in neurons. Journal of neurochemistry, 141(6), 819–834. https://doi.org/10.1111/jnc.13988
Koganezawa, N., Hanamura, K., Sekino, Y., & Shirao, T. (2017). The role of drebrin in dendritic spines. Molecular and cellular neurosciences, 84, 85–92. https://doi.org/10.1016/j.mcn.2017.01.004
Meixner, A., Boldt, K., Van Troys, M., Askenazi, M., Gloeckner, C. J., Bauer, M., Marto, J. A., Ampe, C., Kinkl, N., & Ueffing, M. (2011). A QUICK screen for Lrrk2 interaction partners--leucine-rich repeat kinase 2 is involved in actin cytoskeleton dynamics. Molecular & cellular proteomics: MCP, 10(1), M110.001172. https://doi.org/10.1074/mcp.M110.001172
Parisiadou, L., & Cai, H. (2010). LRRK2 function on actin and microtubule dynamics in Parkinson disease. Communicative & integrative biology, 3(5), 396–400. https://doi.org/10.4161/cib.3.5.12286
Chen, C., Masotti, M., Shepard, N., Promes, V., Tombesi, G., Arango, D., Manzoni, C., Greggio, E., Hilfiker, S., Kozorovitskiy, Y., & Parisiadou, L. (2024). LRRK2 mediates haloperidol-induced changes in indirect pathway striatal projection neurons. bioRxiv : the preprint server for biology, 2024.06.06.597594. https://doi.org/10.1101/2024.06.06.597594
Cheng, J., Novati, G., Pan, J., Bycroft, C., Žemgulytė, A., Applebaum, T., Pritzel, A.,Wong, L. H., Zielinski, M., Sargeant, T., Schneider, R. G., Senior, A. W., Jumper, J., Hassabis, D., Kohli, P., & Avsec, Ž. (2023). Accurate proteome-wide missense variant effect prediction with AlphaMissense. Science (New York, N.Y.), 381(6664), eadg7492. https://doi.org/10.1126/science.adg7492
Beaudoin, G. M., 3rd, Schofield, C. M., Nuwal, T., Zang, K., Ullian, E. M., Huang, B., & Reichardt, L. F. (2012). Afadin, a Ras/Rap effector that controls cadherin function, promotes spine and excitatory synapse density in the hippocampus. The Journal of neuroscience : the official journal of the Society for Neuroscience, 32(1), 99–110. https://doi.org/10.1523/JNEUROSCI.4565-11.2012
Fernández, B., Chittoor-Vinod, V. G., Kluss, J. H., Kelly, K., Bryant, N., Nguyen, A. P. T., Bukhari, S. A., Smith, N., Lara Ordóñez, A. J., Fdez, E., Chartier-Harlin, M. C., Montine, T. J., Wilson, M. A., Moore, D. J., West, A. B., Cookson, M. R., Nichols, R. J., & Hilfiker, S. (2022). Evaluation of Current Methods to Detect Cellular Leucine-Rich Repeat Kinase 2 (LRRK2) Kinase Activity. Journal of Parkinson's disease, 12(5), 1423–1447. https://doi.org/10.3233/JPD-213128
Cirnaru, M. D., Marte, A., Belluzzi, E., Russo, I., Gabrielli, M., Longo, F., Arcuri, L., Murru, L., Bubacco, L., Matteoli, M., Fedele, E., Sala, C., Passafaro, M., Morari, M., Greggio, E., Onofri, F., & Piccoli, G. (2014). LRRK2 kinase activity regulates synaptic vesicle trafficking and neurotransmitter release through modulation of LRRK2 macromolecular complex. Frontiers in molecular neuroscience, 7, 49. https://doi.org/10.3389/fnmol.2014.00049
Belluzzi, E., Gonnelli, A., Cirnaru, M. D., Marte, A., Plotegher, N., Russo, I., Civiero, L., Cogo, S., Carrion, M. P., Franchin, C., Arrigoni, G., Beltramini, M., Bubacco, L., Onofri, F., Piccoli, G., & Greggio, E. (2016). LRRK2 phosphorylates pre-synaptic Nethylmaleimide sensitive fusion (NSF) protein enhancing its ATPase activity and SNARE complex disassembling rate. Molecular neurodegeneration, 11, 1. https://doi.org/10.1186/s13024-015-0066-z
Martin, E. R., Gandawijaya, J., & Oguro-Ando, A. (2022). A novel method for generating glutamatergic SH-SY5Y neuron-like cells utilizing B-27 supplement. Frontiers in pharmacology, 13, 943627. https://doi.org/10.3389/fphar.2022.943627
Kovalevich, J., & Langford, D. (2013). Considerations for the use of SH-SY5Y neuroblastoma cells in neurobiology. Methods in molecular biology (Clifton, N.J.), 1078, 9–21. https://doi.org/10.1007/978-1-62703-640-5_2
Drummond, N. J., Singh Dolt, K., Canham, M. A., Kilbride, P., Morris, G. J., & Kunath, T. (2020). Cryopreservation of Human Midbrain Dopaminergic Neural Progenitor Cells Poised for Neuronal Differentiation. Frontiers in cell and developmental biology, 8, 578907. https://doi.org/10.3389/fcell.2020.578907
Tao, X., Finkbeiner, S., Arnold, D. B., Shaywitz, A. J., & Greenberg, M. E. (1998). Ca2+ influx regulates BDNF transcription by a CREB family transcription factor-dependent mechanism. Neuron, 20(4), 709–726. https://doi.org/10.1016/s0896-6273(00)810107
El-Husseini, A. E., Schnell, E., Chetkovich, D. M., Nicoll, R. A., & Bredt, D. S. (2000). PSD95 involvement in maturation of excitatory synapses. Science (New York, N.Y.), 290(5495), 1364–1368.
Glebov OO, Cox S, Humphreys L, Burrone J. Neuronal activity controls transsynaptic geometry. Sci Rep. 2016 Mar 8;6:22703. doi: 10.1038/srep22703. Erratum in: Sci Rep. 2016 May 31;6:26422. doi: 10.1038/srep26422. PMID: 26951792; PMCID: PMC4782104.
Beccano-Kelly DA, Volta M, Munsie LN, Paschall SA, Tatarnikov I, Co K, Chou P, Cao LP, Bergeron S, Mitchell E, Han H, Melrose HL, Tapia L, Raymond LA, Farrer MJ, Milnerwood AJ. LRRK2 overexpression alters glutamatergic presynaptic plasticity, striatal dopamine tone, postsynaptic signal transduction, motor activity and memory. Hum Mol Genet. 2015 Mar 1;24(5):1336-49. doi: 10.1093/hmg/ddu543. Epub 2014 Oct 24. PMID: 25343991.
-
-
eLife assessment
This valuable study further discloses the function of LRRK2 in BDNF-dependent synaptic processes in identifying postsynaptic actin cytoskeleton as a convergent site of LRRK2 pathophysiological activity. Multiple approaches in different cellular models provide mostly solid (but at times preliminary) evidence to support (many) of the conclusions, overall consistent with bioinformatics analyses covering previously published work. While an exciting start that should be pursued, examples are suggested by reviewers to add in additional experimentation to better support the expansive interpretation. The identification of mechanisms of LRRK2 action at the synapse is considered highly significant, as better knowledge in this regard may provide insight into why dopaminergic cells die with over-active LRRK2.
-
Reviewer #1 (Public Review):
Summary:
LRRK2 protein is familially linked to Parkinson's disease by the presence of several gene variants that all confer a gain-of-function effect on LRRK2 kinase activity.
The authors examine the effects of BDNF stimulation in immortalized neuron-like cells, cultured mouse primary neurons, hIPSC-derived neurons, and synaptosome preparations from the brain. They examine an LRRK2 regulatory phosphorylation residue, LRRK2 binding relationships, and measures of synaptic structure and function.
Strengths:
The study addresses an important research question: how does a PD-linked protein interact with other proteins, and contribute to responses to a well-characterized neuronal signalling pathway involved in the regulation of synaptic function and cell health?
They employ a range of good models and techniques to …
Reviewer #1 (Public Review):
Summary:
LRRK2 protein is familially linked to Parkinson's disease by the presence of several gene variants that all confer a gain-of-function effect on LRRK2 kinase activity.
The authors examine the effects of BDNF stimulation in immortalized neuron-like cells, cultured mouse primary neurons, hIPSC-derived neurons, and synaptosome preparations from the brain. They examine an LRRK2 regulatory phosphorylation residue, LRRK2 binding relationships, and measures of synaptic structure and function.
Strengths:
The study addresses an important research question: how does a PD-linked protein interact with other proteins, and contribute to responses to a well-characterized neuronal signalling pathway involved in the regulation of synaptic function and cell health?
They employ a range of good models and techniques to fairly convincingly demonstrate that BDNF stimulation alters LRRK2 phosphorylation and binding to many proteins. Some effects of BDNF stimulation appear impaired in (some of the) LRRK2 knock-out scenarios (but not all). A phosphoproteomic analysis of PD mutant Knock-in mouse brain synaptosomes is included.
Weaknesses:
The data sets are disjointed, conclusions are sweeping, and not always in line with what the data is showing. Validation of 'omics' data is very light. Some inconsistencies with the major conclusions are ignored. Several of the assays employed (western blotting especially) are likely underpowered, findings key to their interpretation are addressed in only one or other of the several models employed, and supporting observations are lacking.
As examples to aid reader interpretation:
(a) pS935 LRRK2 seems to go up at 5 minutes but goes down below pre-stimulation levels after (at times when BDNF-induced phosphorylation of other known targets remains very high). This is ignored in favour of discussion/investigation of initial increases, and the fact that BDNF does many things (which might indirectly contribute to initial but unsustained changes to pLRRK2) is not addressed.
(b) Drebrin coIP itself looks like a very strong result, as does the increase after BDNF, but this was only demonstrated with a GFP over-expression construct despite several mouse and neuron models being employed elsewhere and available for copIP of endogenous LRRK2. Also, the coIP is only demonstrated in one direction. Similarly, the decrease in drebrin levels in mice is not assessed in the other model systems, coIP wasn't done, and mRNA transcripts are not quantified (even though others were). Drebrin phosphorylation state is not examined.
(c) The large differences in the CRISPR KO cells in terms of BDNF responses are not seen in the primary neurons of KO mice, suggesting that other differences between the two might be responsible, rather than the lack of LRRK2 protein.
(d) No validation of hits in the G2019S mutant phosphoproteomics, and no other assays related to the rest of the paper/conclusions. Drebrin phosphorylation is different but unvalidated, or related to previous data sets beyond some discussion. The fact that LRRK2 binding occurs, and increases with BDNF stimulation, should be compared to its phosphorylation status and the effects of the G2019S mutation.
-
Reviewer #2 (Public Review):
Taken as a whole, the data in the manuscript show that BDNF can regulate PD-associated kinase LRRK2 and that LRRK2 modifies the BDNF response. The chief strength is that the data provide a potential focal point for multiple observations across many labs. Since LRRK2 has emerged as a protein that is likely to be part of the pathology in both sporadic and LRRK2 PD, the findings will be of broad interest. At the same time, the data used to imply a causal throughline from BDNF to LRRK2 to synaptic function and actin cytoskeleton (as in the title) are mostly correlative and the presentation often extends beyond the data. This introduces unnecessary confusion. There are also many methodological details that are lacking or difficult to find. These issues can be addressed.
(1) The writing/interpretation gets ahead …
Reviewer #2 (Public Review):
Taken as a whole, the data in the manuscript show that BDNF can regulate PD-associated kinase LRRK2 and that LRRK2 modifies the BDNF response. The chief strength is that the data provide a potential focal point for multiple observations across many labs. Since LRRK2 has emerged as a protein that is likely to be part of the pathology in both sporadic and LRRK2 PD, the findings will be of broad interest. At the same time, the data used to imply a causal throughline from BDNF to LRRK2 to synaptic function and actin cytoskeleton (as in the title) are mostly correlative and the presentation often extends beyond the data. This introduces unnecessary confusion. There are also many methodological details that are lacking or difficult to find. These issues can be addressed.
(1) The writing/interpretation gets ahead of the data in places and this was confusing. For example, the abstract highlights prior work showing that Ser935 LRRK2 phosphorylation changes LRRK2 localization, and Figure 1 shows that BDNF rapidly increases LRRK2 phosphorylation at this site. Subsequent figures highlight effects at synapses or with synaptic proteins. So is the assumption that LRRK2 is recruited to (or away from) synapses in response to BDNF? Figure 2H shows that LRRK2-drebrin interactions are enhanced in response to BDNF in retinoic acid-treated SH-SY5Y cells, but are synapses generated in these preps? How similar are these preps to the mouse and human cortical or mouse striatal neurons discussed in other parts of the paper (would it be anticipated that BDNF act similarly?) and how valid are SH-SY5Y cells as a model for identifying synaptic proteins? Is drebrin localization to synapses (or its presence in synaptosomes) modified by BDNF treatment +/- LRRK2? Or do LRRK2 levels in synaptosomes change in response to BDNF? The presentation requires re-writing to stay within the constraints of the data or additional data should be added to more completely back up the logic.
(2) The experiments make use of multiple different kinds of preps. This makes it difficult at times to follow and interpret some of the experiments, and it would be of great benefit to more assertively insert "mouse" or "human" and cell type (cortical, glutamatergic, striatal, gabaergic) etc.
(3) Although BDNF induces quantitatively lower levels of ERK or Akt phosphorylation in LRRK2KO preps based on the graphs (Figure 4B, D), the western blot data in Figure 4C make clear that BDNF does not need LRRK2 to mediate either ERK or Akt activation in mouse cortical neurons and in 4A, ERK in SH-SY5Y cells. The presentation of the data in the results (and echoed in the discussion) writes of a "remarkably weaker response". The data in the blots demand more nuance. It seems that LRRK2 may potentiate a response to BDNF that in neurons is independent of LRRK2 kinase activity (as noted). This is more of a point of interpretation, but the words do not match the images.
(4) Figure 4F/G shows an increase in PSD95 puncta per unit length in response to BDNF in mouse cortical neurons. The data do not show spine induction/dendritic spine density/or spine morphogenesis as suggested in the accompanying text (page 8). Since the neurons are filled/express gfp, spine density could be added or spines having PSD95 puncta. However, the data as reported would be expected to reflect spine and shaft PSDs and could also include some nonsynaptic sites.
(5) Experimental details are missing that are needed to fully interpret the data. There are no electron microscopy methods outside of the figure legend. And for this and most other microscopy-based data, there are few to no descriptions of what cells/sites were sampled, how many sites were sampled, and how regions/cells were chosen. For some experiments (like Figure 5D), some detail is provided in the legend (20 segments from each mouse), but it is not clear how many neurons this represents, where in the striatum these neurons reside, etc. For confocal z-stacks, how thick are the optical sections and how thick is the stack? The methods suggest that data were analyzed as collapsed projections, but they cite Imaris, which usually uses volumes, so this is confusing. The guide (sgRNA) sequences that were used should be included. There is no mention of sex as a biological variable.
(6) For Figures 1F, G, and E, how many experimental replicates are represented by blots that are shown? Graphs/statistics could be added to the supplement. For 1C and 1I, the ANOVA p-value should be added in the legend (in addition to the post hoc value provided).
(7) Why choose 15 minutes of BDNF exposure for the mass spec experiments when the kinetics in Figure 1 show a peak at 5 mins?
(8) The schematic in Figure 6A suggests that iPSCs were plated, differentiated, and cultured until about day 70 when they were used for recordings. But the methods suggest they were differentiated and then cryopreserved at day 30, and then replated and cultured for 40 more days. Please clarify if day 70 reflects time after re-plating (30+70) or total time in culture (70). If the latter, please add some notes about re-differentiation, etc.
(9) When Figures 6B and 6C are compared it appears that mEPSC frequency may increase earlier in the LRRK2KO preps than in the WT preps since the values appear to be similar to WT + BDNF. In this light, BDNF treatment may have reached a ceiling in the LRRK2KO neurons.
(10) Schematic data in Figures 5A and C and Figures 5B and E are too small to read/see the data.
-
