Maternal smoking DNA methylation risk score associated with health outcomes in offspring of European and South Asian ancestry
Curation statements for this article:-
Curated by eLife

eLife assessment
This study offers a useful advance by introducing a cord blood DNA methylation score for maternal smoking effects, with the inclusion of cohorts from diverse backgrounds. However, the overall strength of evidence is deemed incomplete, due to concerns regarding low exposure levels and low statistical power, which hampers the generalisability of their findings. The study provides an interesting basis for future studies, but would benefit from the addition of more cohorts to validate the findings and a focus on more diverse health outcomes.
This article has been Reviewed by the following groups
Discuss this preprint
Start a discussion What are Sciety discussions?Listed in
- Evaluated articles (eLife)
Abstract
Maternal smoking has been linked to adverse health outcomes in newborns but the extent to which it impacts newborn health has not been quantified through an aggregated cord blood DNA methylation (DNAm) score. Here, we examine the feasibility of using cord blood DNAm scores leveraging large external studies as discovery samples to capture the epigenetic signature of maternal smoking and its influence on newborns in White European and South Asian populations.
Methods:
We first examined the association between individual CpGs and cigarette smoking during pregnancy, and smoking exposure in two White European birth cohorts (n=744). Leveraging established CpGs for maternal smoking, we constructed a cord blood epigenetic score of maternal smoking that was validated in one of the European-origin cohorts (n=347). This score was then tested for association with smoking status, secondary smoking exposure during pregnancy, and health outcomes in offspring measured after birth in an independent White European (n=397) and a South Asian birth cohort (n=504).
Results:
Several previously reported genes for maternal smoking were supported, with the strongest and most consistent association signal from the GFI1 gene (6 CpGs with p<5 × 10 -5 ). The epigenetic maternal smoking score was strongly associated with smoking status during pregnancy (OR = 1.09 [1.07, 1.10], p=5.5 × 10 -33 ) and more hours of self-reported smoking exposure per week (1.93 [1.27, 2.58], p=7.8 × 10 -9 ) in White Europeans. However, it was not associated with self-reported exposure (p>0.05) among South Asians, likely due to a lack of smoking in this group. The same score was consistently associated with a smaller birth size (–0.37±0.12 cm, p=0.0023) in the South Asian cohort and a lower birth weight (–0.043±0.013 kg, p=0.0011) in the combined cohorts.
Conclusions:
This cord blood epigenetic score can help identify babies exposed to maternal smoking and assess its long-term impact on growth. Notably, these results indicate a consistent association between the DNAm signature of maternal smoking and a small body size and low birth weight in newborns, in both White European mothers who exhibited some amount of smoking and in South Asian mothers who themselves were not active smokers.
Funding:
This study was funded by the Canadian Institutes of Health Research Metabolomics Team Grant: MWG-146332.
Article activity feed
-

-
-

eLife assessment
This study offers a useful advance by introducing a cord blood DNA methylation score for maternal smoking effects, with the inclusion of cohorts from diverse backgrounds. However, the overall strength of evidence is deemed incomplete, due to concerns regarding low exposure levels and low statistical power, which hampers the generalisability of their findings. The study provides an interesting basis for future studies, but would benefit from the addition of more cohorts to validate the findings and a focus on more diverse health outcomes.
-
Reviewer #2 (Public Review):
Summary:
The authors generated a DNA methylation score in cord blood for detecting exposure to cigarette smoke during pregnancy. They then asked if it could be used to predict height, weight, BMI, adiposity and WHR throughout early childhood.
Strengths:
The study included two cohorts of European ancestry and one of South Asian ancestry.
Weaknesses:
(1) Numbers of mothers who self-reported any smoking was very low likely resulting in underpowered analyses.
(2) Although it was likely that some mothers were exposed to second-hand smoke and/or pollution, data on this was not available.
(3) One of the European cohorts and half of the South Asian cohort had DNA methylation measured on only 2500 CpG sites including only 125 sites previously linked to prenatal smoking.
-
Reviewer #3 (Public Review):
Summary:
Deng et al. assess neonatal cord blood methylation profiles and the association with (self-reported) maternal smoking in multiple populations, including two European (CHILD, FAMILY) and one South Asian (START), via two approaches: 1) they perform an independent epigenome-wide association study (EWAS) and meta-analysis across the CHILD and FAMILY cohort, during which they also benchmark previously reported maternal-smoking associated sites, and 2) they generate new composite methylation risk scores for maternal smoking, and assess their performance and association with phenotypic characteristics in the three populations, in addition to previously described maternal smoking methylation risk scores.
Strengths and weaknesses:
Their meta-analysis across multiple cohorts and comparison with previous …
Reviewer #3 (Public Review):
Summary:
Deng et al. assess neonatal cord blood methylation profiles and the association with (self-reported) maternal smoking in multiple populations, including two European (CHILD, FAMILY) and one South Asian (START), via two approaches: 1) they perform an independent epigenome-wide association study (EWAS) and meta-analysis across the CHILD and FAMILY cohort, during which they also benchmark previously reported maternal-smoking associated sites, and 2) they generate new composite methylation risk scores for maternal smoking, and assess their performance and association with phenotypic characteristics in the three populations, in addition to previously described maternal smoking methylation risk scores.
Strengths and weaknesses:
Their meta-analysis across multiple cohorts and comparison with previous findings represents a strength. In particular the inclusion of a South Asian birth cohort is commendable as it may help to bolster generalizability. However, their conclusions are limited by several important weaknesses:
(1) the low number of (self-reported) maternal smokers in particular their South Asian population, resulting in an inability to conduct benchmarking of maternal smoking sites in this cohort. As such, the inclusion of the START cohort in certain figures is not warranted (e.g., Figure 3) and the overall statement that smoking-associated MRS are portable across populations are not fully supported;
(2) different methylation profiling tools were used: START and CHILD methylation profiles were generated using the more comprehensive 450K array while the FAMILY cohort blood samples were profiled using a targeted array covering only 3,000, as opposed to 450,000 sites, resulting in different coverage of certain sites which affects downstream analyses and MRS, and importantly, omission of potentially relevant sites as the array was designed in 2016 and substantial additional work into epigenetic traits has been conducted since then;
(3) the authors train methylation risk scores (MRS) in CHILD or FAMILY populations based on sites that are associated with maternal smoking in both cohorts and internally validate them in the other cohort, respectively. As START cohort due to insufficient numbers of self-reported maternal smokers, the authors cannot fully independently validated their MRS, thus limiting the strength of their results.Overall strength of evidence and conclusions:
Despite these limitations, the study overall does explore the feasibility of using neonatal cord blood for the assessment of maternal smoking. However, their conclusion on generalizability of the maternal smoking risk score is currently not supported by their data as they were not able to validate their score in a sufficiently large number of maternal smokers and never smokers of South Asian populations.
While their generalizability remains limited due to small sample numbers and previous studies with methylation risk scores exist, their findings may nonetheless provide the basis for future work into prenatal exposures which will be of interest to the research community. In particular their finding that the maternal smoking-associated MRS was associated with small birth sizes and weights across birth cohorts, including the South Asian birth cohort that had very few self-reported smokers, is interesting and the author suggest these findings could be associated with factors other than smoking alone (e.g., pollution), which warrant further investigation and would be highly novel.
Future exploration should also include a strong focus on more diverse health outcomes, including respiratory conditions that may have long-lasting health consequences. -
Author response:
The following is the authors’ response to the previous reviews.
Reviewer #2:
(1) P-values should be reported adjusted for multiple tests or, at the very least, note that they are unadjusted to alert the reader that they may be biased by winner's curse.
Throughout the manuscript, we applied the false discovery rate threshold to declare results that were statistically relevant for discussion. However, for reporting in abstract, we believe the raw p-values are most straightforward as we only reported the most important and robust results, and considering that 1) multiple testing correction does not change the ranking of the adjusted p-values; 2) p-value adjustment depends on both the method and the number of hypothesis tested; 3) all reporting of the most significant discovery results are prone to winner’s curse, but in …
Author response:
The following is the authors’ response to the previous reviews.
Reviewer #2:
(1) P-values should be reported adjusted for multiple tests or, at the very least, note that they are unadjusted to alert the reader that they may be biased by winner's curse.
Throughout the manuscript, we applied the false discovery rate threshold to declare results that were statistically relevant for discussion. However, for reporting in abstract, we believe the raw p-values are most straightforward as we only reported the most important and robust results, and considering that 1) multiple testing correction does not change the ranking of the adjusted p-values; 2) p-value adjustment depends on both the method and the number of hypothesis tested; 3) all reporting of the most significant discovery results are prone to winner’s curse, but in the context of our study: the GFI1 finding was confirmatory in nature, thus raw p-value allows for a direct comparison with existing studies.
We have taken the suggestion to quote the FDR-adjusted p-values throughout the manuscript for meta-analyzed results and discussed the impact of FDR correction for the EWAS and MRS association differed as a result of the number of hypothesis in each context:
“For each EWAS or meta-analysis, the false discovery rate (FDR) adjustment was used to control multiple testing and we considered CpGs that passed an FDR-adjusted p-value < 0.05 to be relevant for maternal smoking.”
“An FDR adjustment was used to control the multiple testing of meta-analyzed association between MRS and 25 (or 23, depending on the number of phenotypes available in the cohort) outcomes, and we considered association that passed an FDR-adjusted p-value < 0.05 to be relevant.”
(2) The odds ratios and p-values reported in the abstract for associations of the MRS with smoking status and smoking exposure per week appear to be missing from the results section of the manuscript or (supplementary) tables.
The results for smoking status during pregnancy was added to the results:
“As a result, the epigenetic maternal smoking score was strongly associated with smoking status during pregnancy (OR=1.09 [1.07,1.10], p=5.5×10⁻³³) in the combined European cohorts.”
The exposure association was reported in the result section and Supplementary Table 8. We do note the typo in the cohort specific p-values, which now has been corrected.
(3) It is misleading to report a lack of MRS associations with maternal smoking in South Asians without also stating that there were only two smokers.
We agree with the reviewer that an association test would not be justified given the lack of smoking in the present South Asian cohort. We also removed the p-value of association for the START cohort in Figure 3, based on this and comment #4 from reviewer #3. The relevant results have been revised as follows:
“The HM450 MRS was significantly associated with maternal smoking history in CHILD and FAMILY (n = 397), but we failed to meaningfully validate the association in START (n = 503; Figure 3) – not surprisingly – due to the low number of ever-smokers (n = 2).”
(4) It is potentially confusing to report MRS associations with maternal smoking by ethnicity but then report associations with birth size and length combined without any explanation. The most novel result of this study is that there is virtually no maternal smoking among the South Asians and yet the MRS is associated with birth weight and size and with height at age 2. This result is buried in the combined analysis. I would suggest reporting the MRS associations with height and weight separately as has been done for maternal smoking behavior.
We thank the reviewer for this suggestion and this has now been added the new Table 3, showing the cohort specific and meta-analyzed effect sizes. In the revision, we highlighted that the ethnic specific MRS associations, such as with smoking exposure at various age (1 and 3 years) and skinfold thickness in European cohorts but not the South Asian cohort, as well as associations that were more homogenous, such as the birth weight and unique body size association in combined cohorts. In particular, the MRS in the South Asian cohort exhibited a consistent association with body size at various time points (at birth, 1, 2, and 5 year) with similar effect sizes. The following was added to the results:
“A higher maternal smoking MRS was significantly associated with smaller birth size (-0.37±0.12, p = 0.0023; Table 3) and height at 1, 2, and 5 year visits in the South Asian cohort (Table 3). We observed similar associations with body size in the white European cohorts (heterogeneity p-values> 0.2), collectively, the MRS was associated with a smaller birth size (-0.22±0.07, p=0.0016; FDR adjusted p = 0.019) in the combined European and South Asian cohorts (Table 3). Meanwhile, a higher maternal smoking MRS was also associated with a lower birth weight (-0.043±0.013, p = 0.001; FDR adjusted p = 0.011) in the combined sample, though the effect was weaker in START (-0.03±0.02; p = 0.094) as compared to the white European cohorts.
The meta-analysis revealed no heterogeneity in the direction nor the effect size of associations for body size and weight between populations at birth or at later visits (heterogeneity p-values = 0.16–1; Supplementary Table 8).”
Reviewer #3:
(1) You mention that the 450K Score performs best even though only 10/143 are included for some populations. Did you explore recalibration of the MRS using only those 10 CpGs?
We thank the reviewer for this comment – due to an error in result transferring, the number of overlapping CpGs between the 450K score and the targeted array was in fact 26. This error only impacted results relevant to the FAMILY study using the HM450K score and did not materially change our results nor conclusions. We have updated accordingly, Table 3, Suppl. Tables 5, 8, 9, Figure 3-B, and Suppl. Figures 5, 6-B), 7-B) and 7-D), and throughout the manuscript for meta-analyzed MRS associations.
The subset of 26 CpGs using the originally derived weight was expected to perform worse than the original HM450K score using the full 143 CpGs. When we did restrict the methylation score construction to these 26 CpGs, the performance in CHILD was worse than the original score, but comparable to FAMILY (updated Suppl. Table 5). These 26 CpGs did overlap with the targeted score derived in CHILD (13 out of 15 present) and in FAMILY (19 out of 63 present), suggesting moderate agreement between the array platform as well as across studies.
In other words, while the subset of 26 CpGs had reasonable performance in both CHILD and FAMILY, both studies could benefit by inclusion of the additional CpGs in the original score. We have included a sentence to discuss the choice of validation study and the trade-off between sample size and # of CpGs under response to Reviewer 3 comment # 2.
(2) Could the internal validation performance be driven by sample size of the training, providing support for the need for larger training sizes? Should this be discussed in the study?
The validation study, CHILD, has the smaller sample size between the two European cohorts. While both potential data for validation had smaller sample sizes, we chose CHILD (n=347), rather than FAMILY (n=397) as it had better coverage with respect to the discovery EWAS or the training data (# of associated CpGs = 3,092, n = 5,647). Beyond the signals of association, the validation performance also depends on a mix of overall sample size and the proportion of current smokers. Given the proportion of current smokers, the effective sample size for a direct comparison, i.e. equivalently-powdered sample size of a balanced (50% cases, 50% controls) design, are 41.7 and 104.7 for CHILD and FAMILY, respectively. While we are unable to directly compare whether a larger effective sample size produced a better performing score, we believe this to be the case, and thus a larger validation study would boost the performance of the methylation score. We have added the following to the discussion:
“Given the proportion of current smokers, the effective sample size for a direct comparison between CHILD and FAMILY, i.e. equivalently-powdered sample size of a balanced (50% cases, 50% controls) design, were 41.7 and 104.7, respectively. While CHILD had a lower effective sample size, we ultimately chose it for validating the methylation score to better cover the CpGs that were significant in the discovery EWAS. A larger validation study will likely further boost the performance of the methylation score and be considered in future research.”
(3) Figure 1: It is very helpful to have an overview diagram, but this should then follow the flow of the manuscript to aid the reader. Currently, the diagram does not follow the flow of the manuscript and thus is rather confusing - for instance, the figure starts with the MRS but initially an EWAS is conducted in the manuscript itself. I suggest to adapt the overview figure accordingly. Moreover, a description for (A), (B), (C) is not provided in the figure legends. Figure 1 could thus be improved further.
We thank the reviewer for the suggestion to improve the key figure that summarizes the manuscript. The EWAS workflow for the primary, secondary and tertiary outcomes, as well as the European cohorts meta-analysis has been added to the updated sub-figure A). The description for each subfigures has also been added to the figure legends as follows:
“Figure 1-A) shows the epigenome-wide association studies conducted in the European cohorts (CHILD and FAMILY); Figure 1-B) illustrated the workflow for methylation risk score (MRS) construction using an external EWAS (Joubert et al., 2016) as the discovery sample and CHILD study as the external validation study, while Figure 1-C) demonstrates the evaluation of the MRS in two independent cohorts of white European (i.e. FAMILY) and South Asian (i.e. START). The validated MRS was then tested for association with smoking specific, maternal, and children phenotypes in CHILD, FAMILY, and START, as shown in Figure 1-D).”
(4) Figure 3: The readability and information content in this figure, and other figures containing boxplots (e.g., Supplementary Figure 5), could be improved. I would suggest to justify X axis labels to the axis rather than overlapping, and importantly, show individual data points wherever possible (e.g., overlaying the box plots). In c), the ANOVA is not justified given the sample size in START. In general, it is worth excluding the START cohorts from this analysis on the justification of a too small sample size for maternal smokers.
We thank the reviewer for their thoughtful points for improvement. The axis labels have been wrapped to avoid overlapping, and the data points added to the boxplots. ANOVA p-value for START was removed due to the low counts of smokers in the figure and manuscript throughout. However, we retained START in Figure 3 and other boxplots to show the distribution of the score for non-smokers to benchmark with the European cohorts.
(5) In addition to boxplots, it may be helpful to show AUC diagrams for ROC curves (e.g. Figure 3). AUCs are reported in the Tables but not shown. Additionally, all AUC results should include 95% Confidence intervals.
This is a great suggestion and we have added the corresponding ROC, annotated with AUC (95% CI) to Figure 3. The 95% CI for all AUC results were added to the Tables and main text. The following was added to Methods:
“The reported 95% confidence interval for each estimated AUC was derived using 2,000 bootstrap samples.”
(6) Supplementary Figure 6: It could be helpful to discuss the amount of overlap between the different MRS.
Most of the scores were derived using the Joubert et al., (2016) EWAS as the discovery sample, including ours, and thus there will be overlap between the scores. The exception was the GondaliaScore, which contained only 3 CpGs that do not overlap with any other scores.
While different scores might not have selected completely identical sets of CpGs, the mapped genes are highly consistent across the scores. We have added to the discussion and results the extent of overlap between the top scores:
“In particular, scores that were derived using the Joubert EWAS as the discovery sample, including ours, had higher pairwise correlation coefficients across the birth cohorts, with many of the CpGs mapping to the same genes, such as AHRR, MYO1G, GFI1, CYP1A1, and RUNX3.”
(7) Supplementary Figure 7: This figure is never referenced in the text and from the legend itself it is not too clear what it is trying to show. Please refer to it in the main text with some additional context.
Supplementary Figure 7 was referenced in the Results under subsection “Methylation Risk Score (MRS) Captures Maternal Smoking and Smoking Exposure”, following the
Methods subsection “Statistical analysis” where we wanted to examine a systematic difference. We made revision to the main text to clarify the analysis:“For the derived MRS, we empirically assessed whether a systematic difference existed in the resulting score with respect to all other derived scores. This was examined via pairwise mean differences between the HM450 and other score using a two-sample t-test and an overall test of mean difference using an ANOVA F-test, among all samples and the subset of never smokers.”
(8) Tables: Tables are currently challenging to read and perhaps more formatting could be done to improve readability.
We thank the reviewer for the suggestion. Main tables have been reformatted to a landscape layout and each numeric cell moved to the centre to improve readability.
-
-
Author response:
The following is the authors’ response to the original reviews.
We thank the reviewers for their time and the thoughtful reviews on our manuscript. The reviewers brought good points regarding the sample size, and the low exposure in the South Asian cohort owing to their unique cultural and social practices. We recognize these as limitations of the paper and discussed these in the revised version. In the revised manuscript, we have taken the key suggestions by reviewers to 1) better illustrate the analytical flow and statistical methods, in particular, to show which datasets had been used in discovery, validation, and testing of the score – as a main figure in the manuscript and in the graphical abstract; 2) demonstrate there is no possibility of overfitting in our approach using statistical metrics of performance; 3) …
Author response:
The following is the authors’ response to the original reviews.
We thank the reviewers for their time and the thoughtful reviews on our manuscript. The reviewers brought good points regarding the sample size, and the low exposure in the South Asian cohort owing to their unique cultural and social practices. We recognize these as limitations of the paper and discussed these in the revised version. In the revised manuscript, we have taken the key suggestions by reviewers to 1) better illustrate the analytical flow and statistical methods, in particular, to show which datasets had been used in discovery, validation, and testing of the score – as a main figure in the manuscript and in the graphical abstract; 2) demonstrate there is no possibility of overfitting in our approach using statistical metrics of performance; 3) emphasize the goal was not for discovery (e.g. our own EWAS was not used for deriving the score), but to compare with existing EWASs and contrast the results from the white European and SA populations; 4) and supplement the analysis with previously derived maternal smoking, smoking and air pollution methylation score and to explore additional health outcomes in relation to lung health in newborns. Finally, we would also like to take this opportunity to re-iterate that it was not our objective to derive the most powerful methylation score of smoking nor to demonstrate the causal role of maternal smoking on birth weight via DNAm. We have restructure the manuscript as well as the discussion to clarify this. Please find below a point-by-point response to the comments below.
Reviewer #1:
The manuscript could benefit from a more detailed description of methods, especially those used to derive MRS for maternal smoking, which appears to involve overfitting. In particular, the addition of a flow chart would be very helpful to guide the reader through the data and analyses. The FDR correction in the EWAS corresponds to a fairly liberal p-value threshold.
We thank the reviewer for these good suggestions. In the revised manuscript, we have provided a flow chart as the new Figure 1, more detailed description of the method (added a subsection “Statistical analysis” under Materials and Methods) as well as metrics including measures of fit indices such as AUC and adjusted R2 for each validation and testing dataset to illustrate there is no danger of overfitting (in new Supplementary Table 5).
The choice of use FDR was indeed arbitrary as there has been no consensus on what significance threshold, if any, should be used in the context of EWAS. Here we simply followed the convention in previous studies to contrast the top associated signals for their effects between different populations and with reported effect sizes. Throughout the manuscript, we have removed the notion of significant associations and used the phrase “top associated signals” or “top associations” when discussion EWAS results for individual CpGs.
Reviewer #2:
(1) The number of mothers who self-reported any smoking was very low, much lower than in the general population and practically non-existent in the South Asian population. As a result, all analyses appeared to have been underpowered. It is possibly for this reason that the authors chose to generate their DNA methylation model using previously published summary statistics. The resulting score is not of great value in itself due to the low-powered dataset used to estimate covariance between CpG sites. In fact, a score was generated for a much larger, better-powered dataset several years ago (Reese, EHP, 2017, PMID 27323799).
We thank the reviewer for pointing out the low exposure in the South Asian population, which we believe is complementary to the literature on maternal smoking that almost exclusively focused on white Europeans. However, the score was validating in the white European cohort (CHILD; current smoking 3.1%), which was reasonably similar to the trend that maternal cigarettes smoking is on the decline from 2016 to 2021, from 7.2% to 4.6% (Martin, Osterman, & Driscoll, 2023). This is also consistent with the fact that CHILD participants were recruited from major metropolitans of Canada with relatively high SES and education as compared to FAMILY.
We do agree with the reviewers that a higher prevalence of maternal smoking in the validating sample could potential improve the power of the score. Our original analytical pipeline focused on CHILD as the validation dataset; FAMILY (see the new Figure 1) was used as the testing data. We alternatively provided an analytical scheme using FAMILY as the validation dataset, as it had a higher proportion of current smokers, however, this is limited by the number of CpGs available (128 in FAMILY vs. 2,619 in CHILD out of the 2,620 CpGs from (Joubert et al., 2016)). The results of all possible combinations of validation vs. testing and restriction of targeted array vs. HM450 are summarized in the new new Supplementary Table 5 and Supplementary Figure 5.
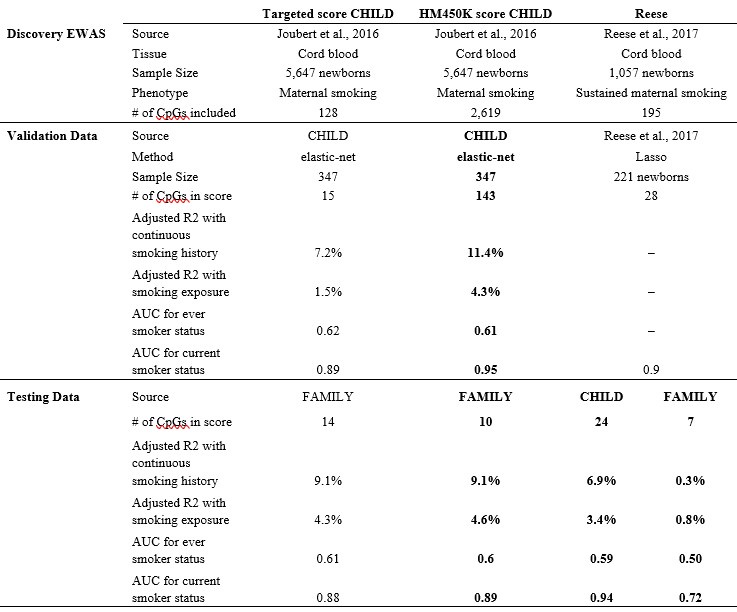
To clarify, our choice to construct DNAm score using published summary statistics was not an ad-hoc decision due to the observed low power from CHILD EWAS. We agree with the reviewer that our study was indeed underpowered and was not originally intended for EWAS discovery. Thus, we specifically proposed to adopt a multivariate strategy from the literature of polygenic risk scores. This approach enabled us to leverage well-powered association signals without individual-level access to data with a sample size of n > 5,000 (Joubert et al., 2016). In comparison, the Reese maternal smoking score (Reese et al., 2017) had a discovery sample size of only n = 1,057. Our score was not out-performed, in fact, the AUC in both FAMILY (external validating dataset; n=411) and CHILD (external testing dataset; n=352) and was larger than that based on the Reese score as tabulated below (part of the new Supplementary Table 5).
Author response table 1.
Further, regarding the comment on the covariance matrix. Indeed, lassosum via elastic-net and summary data requires a reference covariance matrix that is consistent between the discovery data and external validation data. In fact, for moderately sized correlation/covariance values (r2 > 0.1), a sample size of >100 is sufficiently powered to detect it being different from 0 and thus used for estimation. Similar to the linkage disequilibrium of genotype data, the CpGs also exhibit a block-wise correlation structure and thus the theoretical framework of lassosum extends naturally to MRS.
In the revised manuscript, we included the Reese score, as well as a few additional scores to compare their predictiveness of smoking phenotypes in white European cohorts. We note that the applicability was limited in the FAMILY cohort that was profiled using a targeted array and only 7 out of 28 of the CpGs in the Reese score were available. As a result, though the Reese score had similar performance than our derived score in CHILD (0.94 vs. 0.95), its performance in FAMILY was compromised (0.72 vs. 0.89).
(2) The conclusion that "even minimal smoking exposure in South Asian mothers who were not active smokers showed a DNAm signature of small body size and low birthweight in newborns" is not warranted because no analyses were performed to show that the association between DNA methylation and birth size/weight was driven by maternal smoking.
We thank the reviewer for this subtle point – it was not our intention to suggest there was a causal relationship between DNA methylation and birth size that was mediated by maternal smoking. We meant to suggest that the maternal smoking methylation score was consistently associated with negative outcomes in newborns of both white European and South Asian mothers despite no maternal smoking was present in South Asian mothers. It is possible that maternal smoking MRS was capturing a lot more than just smoking and second-hand smoking, such as other environmental exposures that also lead to oxidative stress. These together are associated with reduced birth size/weight.
In the revised manuscript, we have modified the conclusion above to:
“Notably, these results indicate a consistent association between the DNAm signature of maternal smoking and a small body size and low birthweight in newborns, in both white European mothers who exhibited some amount of smoking and in South Asian mothers who themselves were not active smokers.”
(3) Although it was likely that some mothers were exposed to second-hand smoke and/or pollution, data on this was either non-existent or not included in this study. Including this would have allowed a more novel investigation of the effects of smoke exposure on the pregnancies of non-smoking mothers.
We agree with this comment – second-hand smoking was captured by self-reported weekly smoking exposure by the mothers. We reported the association with smoking exposure and found that it was not consistently associated with our methylation scores across the cohorts (cohort specific association p-values of 5.4×10⁻⁵, 3.4×10⁻⁵, and 0.58, for CHILD, FAMILY, and START; original Table 3), possibly due to the low exposure in South Asian population (max weekly exposure was 42 hrs in contrast to 168 hrs in FAMILY and 98 hrs in CHILD). Meanwhile, air pollution data are currently not available. Here we additionally performed the association between maternal smoking and air pollution methylation score, using key CpGs from the largest air pollution EWAS to-date (Gondalia et al., 2021). However, there was no association between the air pollution score and any maternal smoking phenotypes (ps > 0.4).
(4) One of the European cohorts and half of the South Asian cohort had DNA methylation measured on only 2500 CpG sites. This set of sites included only 125 sites previously linked to prenatal smoking. The resulting model of prenatal smoking was small (only 11 CpG sites). It is possible that a large model may have been more powerful.
That is correct – also see our response to R2 comment #1. In our previous analysis, we validated two scores (one based on CpGs on the < 3,000 CpGs array and the other one for the full HM450K). The score with more CpGs indeed had slightly better performance. We included this as one of the limitations of the paper. Nevertheless, it does not impact the conclusion that the scores (based on a larger or smaller model) are transferrable to diverse populations and can be used to comparatively study the DNAm influence of maternal smoking in newborns.
The following was added in the discussion:
“First, the customized array with a limited number of CpGs (<3,000) was designed in 2016 and many large EWASs on smoking and maternal smoking conducted more recently had not been included.”
(5) The health outcomes investigated are potentially interesting but there are other possibly more important outcomes of interest such as birth complications, asthma, and intellectual impairment which are known to be associated with prenatal smoking.
We thank the reviewer for bring up this point. One of the key health outcomes in the CHILD study was asthma, and data at later time points are available. However, we do not have similar outcomes collected in the other two studies (FAMILY and START), which focused on cardiometabolic health in young children. Thus, we did not initially include outcomes that were not available across all cohorts as the intention was to contrast the effects between populations.
We recognize that this is an important question and decided to provide the association results for asthma and allergy at available time points in CHILD, FAMILY, and START. We also included mode of delivery via emergency C-section as an additional proxy outcome of birth complications. However, none of these were marginally (p < 0.05) associated with the DNAm smoking score. These are now included in the updated Supplementary Table 8.
Reviewer #1 (Recommendations For The Authors):
(1) The number of samples in the South Asian birth cohort given in the abstract (n = 887) does not match the sample size of the START cohort from the results section (results, page 7, line 139, n = 880). It is also different from the final analytical dataset size from the methods section (page 17, line 386, n = 890). Please clarify.
We thank the reviewer for pointing this out. In the abstract, it was the final sample sized used for EWAS (no missingness in smoking history). The 880 in result was a typo for 890, which contains three individuals with missing smoking data. These have been updated with the correct sample size for START cohort that had full epigenome-wide methylation data (n = 504, and 503 with non-missing smoking history).
(2) Page 3, line 54: "consistent signal from the GFI1 gene (ps < 5×10⁻⁵)". Is ps a typo? If not then it might be clearer to state how many sites this included.
No, these summarized the six CpG sites in the GFI1 gene as outlined in Table 2. We have clarified in the abstract to show the number of CpG sites included.
(3) Please report effect sizes together with information about the statistical significance (p values).
We have updated the manuscript with (standardized) effect sizes whenever possible along with p-values.
(4) Page 4, line 80. This paragraph could be improved by adding a sentence explaining DNA methylation.
We thank the reviewer for this suggestion. A sentence was included to introduce DNAm at the beginning of the second paragraph:
“DNA methylation is one of the most commonly studied epigenetic mechanisms by which cells regulate gene expression, and is increasingly recognized for its potential as a biomarker (13).”
(5) Page 4, line 84. Sentence difficult to understand, please rephrase: "Our recent systematic review of 17 cord blood epigenome-wide association studies (EWAS) demonstrated that out of the 290 CpG sites reported, 19 sites were identified in more than one study; all of them associated with maternal smoking".
We have revised to clarify the review was on cord blood EWAS with five outcomes: maternal diabetes, pre-pregnancy body mass index, diet during pregnancy, smoking, and gestational age.
“Our recent systematic review of 17 cord blood epigenome-wide association studies (EWAS) found that out of the 290 CpG sites reported to be associated with at least one of the following: maternal diabetes, pre-pregnancy body mass index (BMI), diet during pregnancy, smoking, and gestational age, 19 sites were identified in more than one study and all of them associated with maternal smoking.”
(6) Page 5, line 93. The second part of the sentence is not necessary: "The majority of cohort studies have focused on participants of European ancestry, but few were designed to assess the influence of maternal exposures on DNA methylation changes in non-Europeans".
We have revised accordingly to:
“Only a handful of cohort studies were designed to assess the influence of maternal exposures on DNA methylation changes in non-Europeans.”
(7) Page 5, line 95. "It has been suggested that ancestral background could influence both systematic patterns of methylation (27), such as cell composition and smoking behaviours (28)". The sentence is slightly unclear. Could it be rephrased to say that cell composition differences may be present by ancestry, which can lead to differential DNAm patterns?
We have revised accordingly to:
“It has been suggested that systematic patterns of methylation (Elliott et al., 2022), such as cell composition, could differ between individuals of different ancestral backgrounds, which could in turn confound the association between differential DNAm and smoking behaviours (Choquet et al., 2021).”
(8) Page 5, line 108. How does reducing the number of predictors lead to more interpretable effect sizes?
This was meant as a general comment in the context of variable selection, whereby the fewer predictors there are, the effect size of each predictor becomes more interpretable. However, we recognize this comment might be irrelevant to the specific approaches we adopted. We have revised it to motivate methylation score as a powerful instrument for analysis:
“Reducing the number of predictors and measurement noise in the data can lead to better statistical power and a more parsimonious instrument for subsequent analyses.”
(9) Page 5, line 112. Health consequences seem a bit strong, given that the analysis describes correlations/associations.
We have revised it to “association with”:
“In this paper, we investigated the epigenetic signature of maternal smoking on cord blood DNA methylation in newborns, as well as its influence on newborn and later life outcomes in one South Asian which refers to people who originate from the Indian subcontinent, and two predominantly European-origin birth cohorts.”
Results
(10) It would be very helpful to have a flow diagram to detail all of your analyses.
We thank the reviewer for this suggestion. In the revised manuscript, we have provided a flow chart as the new Figure 1, updated the summary of analysis in . Table 3, and added a new Supplementary Table 5 for the DNAm score derivation, as well as more detailed description of the statistical analysis in the Materials and Methods under the subsection “Statistical analysis”.
(11) Page 7, line 138. Please add a reference to the CHILD study.
We have added a reference of the CHILD study.
(12) Tables in results and in supplemental data a) contain a mixture of fields describing the newborn and its mother (this is not true for Supplementary Table 2), b) lack column descriptions, c) lack descriptions of abbreviations and formatting used in tables, d) use different font types, e) lack descriptions of statistical tests that were used to obtain p-values, f) use inconsistent rounding. Please correct and add the missing information.
We have consolidated the notation and nomenclature in all Tables and text. All numerical results are now rounded to 2 decimal places. The tests used were included in the Table headers as well as described in the Materials and Methods:
“For continuous phenotypes, an analysis of variance (ANOVA) using the F-statistics or a two-sample t-test was used to compare the mean difference across the three cohorts or two groups, respectively. For categorical phenotypes, a chi-square test of independence was used to compare the difference in frequencies of observed categories. Note that three of the categories under smoking history in the START cohort had expected cell counts less than 5, and was thus excluded from the comparison, the reported p-value was for CHILD and FAMILY.”
(13) Table 1. Sample sizes given in column descriptions do not add up to 1,650 (legend text).
We thank the reviewer for pointing this out. The updated sample size is 1,267, based on the 352 CHILD samples, 411 FAMILY samples, and 352 START samples. Notice that we did not remove those without full smoking history data as Table 1 was intended for the epigenetic subsamples.
(14) Page 7, line 156. Supplementary Tables are incorrectly numbered. In the text, Supplementary Table 4 comes after Supplementary Table 2.
We thank the reviewer for catching this and have corrected the ordering of the Supplementary Tables and Figures.
(15) Page 7, line 158. "cell compositions" - do you mean estimated white cell proportions?
We have revised it to “estimated cord blood cell proportions” in the text throughout.
(16) Smoking EWAS - do you see any overlap/directional consistency with the top findings from adult EWASs of smoking such as AHRR?
We annotated the top EWAS signals from the literature in the meta-analysis (new Figure 2; Supplementary Figures 1 and 3), but was only able to confirm associations in the GFI1 gene. The AHRR signals were also annotated, but below the FDR correction threshold as seen in new Figure 2 at the start of chromosome 5. We further added a new Supplementary Figure 3 to show the directional consistency with top findings (2,620 CpGs reported and 128 CpGs overlapped with our meta-analysis) from Joubert et al., 2016. The Pearson’s correlation coefficient with meta-analyzed effect for maternal smoking was 0.72 and for smoking exposure was 0.60.
We added the following to Results:
“Further, we observed consistency in the direction of association for the 128 CpGs that overlapped between our meta-analysis and the 2,620 CpGs with evidence of association for maternal smoking (19) (Supplementary Figure 3). Specifically, the Pearson’s correlation coefficient for maternal smoking and weekly smoking exposure was 0.72 and 0.60, respectively.”
(17) Page 8, line 169. "also coincided with the GFI1 gene" this is a bit imprecise. Please report the correlation with the CpG from the maternal smoking analysis.
The CpG was inside the GFI1 gene, we have included the Pearson’s correlation with the top hit in the text below:
“There were no CpGs associated with the ever-smoker status at an FDR of 0.05, though the top signal (cg09935388) was also mapped to the GFI1 gene (Pearson’s r2 correlation with cg12876356 = 0.75 and 0.68 in CHILD and FAMILY, respectively; Supplementary Figure 1).”
(18) Page 8, line 171. Typo "ccg": "ccg01798813".
It has been corrected to “cpg01798813”.
(19) Page 8, line 176. Please be clear about the phenotype used in these analyses.
The EWAS of weekly smoking exposure in START was removed in this version of the manuscript, in reflection of the results and the reviewer’s comments, as a result of this phenotyping being skewed and possibly leading to only spurious results (also see response to comment #20).
We have clarified the phenotypes for these results under “Epigenetic Association of Maternal Smoking in White Europeans” below:
“The maternal smoking and smoking exposure EWASs in CHILD did not yield any CpGs after FDR correction (Supplementary Figure 3).”
(20) What was the genomic inflation for the EWASs? 474 loci in the South Asian EWAS seems like a lot of findings. Perhaps a more robust method (e.g., OSCA MOMENT) might help to control the false positive rate.
The genomic inflation factor was moderately across the cohorts for smoking exposure: 1.02 in CHILD, 0.94 in FAMILY, and 1.00 in START. However, there was more inflation in the tail of the distribution in START than the European cohorts. The empirical type I error rates at 0.01, 0.001, 0.00001, were high in START (x1.7, x5.7, and x165 times at each respective threshold), in contrast to CHILD (x1.06, x1.05, and x0.6) or FAMILY (x1.6, x1.9, and 0). The smoking exposure EWAS based on START was thus removed as these are likely false positives and there was very low smoking exposure to start with (11 reported weekly exposure between 2–42 hrs/week out of 462 with non-missing data). We have added the QQ-plots as well as the genomic inflation factor for the reported meta-analysis in the new Supplementary Figure 2. The following was added to the Results:
“There was no noticeable inflation of empirical type I error in the association p-values from the meta-analysis, with the median of the observed association test statistic roughly equal to the expected median (Supplementary Figure 2).”
(21) What is the targeted array? I don't think it has been introduced prior to this point.
We introduced it in the Materials and Methods under subsection “Methylation data processing and quality controls”. Considering this comment and previous comments on the ordering of Tables and Figures, we have decided to place Materials and Methods after Introduction and before Results.
(22) The MRS section is described poorly in the results section. It is not clear where the 11 or 114 CpGs come from.
We now include an analytical summary of all scores (derived or external from literature) in the new Supplementary Table 5. Further, we updated the description of scores in Materials and Methods under the subsection “Using DNA Methylation to Construct Predictive Models for Maternal Smoking” to clarify the source and types of MRSs derived:
“To evaluate whether the targeted GMEL-EPIC array design has comparable performance as the epigenome-wide array to evaluate the epigenetic signature of maternal smoking, a total of three MRSs were constructed, two using the 128 CpGs available in all cohorts – across the HM450K and targeted GMEL-EPIC arrays – and with either CHILD (n = 347 with non-missing smoking history) or FAMILY (n = 397) as the validation cohort, and another using 2,107 CpGs that were only available in CHILD and START samples with CHILD as the validation cohort. Henceforth, we referred to these derived maternal smoking scores as the FAMILY targeted MRS, CHILD targeted MRS, and the HM450K MRS, respectively.”
(23) Page 9, line 187. "There was no statistically significant difference between the two scores in all samples (p = 1.00) or among non-smokers (p = 0.24).". How was the significance assessed? Please describe the models (outcome, covariates, model type) used for comparing the two models. It would also be good to report the correlation between the scores.
We have added a subsection “Statistical analysis” under Materials and Methods that described the tests. The correlation between scores is now summarized as a heatmap across all cohorts in the new Supplementary Figure 6.
“For each cohort, we contrasted the three versions of the derived scores using an analysis of variance analysis (ANOVA) along with pairwise comparisons using a two-sample t-test to examine how much information might be lost due to the exclusion of more than 10-fold CpGs at the validation stage. We also examined the correlation structure between all derived and external MRSs using a heatmap summarizing their pairwise Pearson’s correlation coefficient.”
(24) Please include the number of samples in the training/validation and in the test set in the methods and in the results.
We thank the reviewer for this suggestion. In the revised manuscript, we have provided a flow chart as the new Figure 1 and more detailed description of the method in the Materials and Methods. Please also see response to comment #22. The training sample size is based on Joubert et al., (2016), which is 5,647. For our main analyses, the validation sample with non-missing phenotypes remained the CHILD cohort (n=347), while the FAMILY (n=397) and START (n=503) samples were the independent testing data. We alternatively provided another scenario, in which the FAMILY sample was the validation cohort, while CHILD and START were the testing cohorts. The exact sample size and performance metrics for each scenario and score are clearly summarized in the new Supplementary Table 5.
(25) Table 3. Please clarify the type of information contained in the four last columns (p-value?).
Yes – these are the individual cohort p-values. We have taken the suggestion from comment #12 to fully describe all columns and fields.
(26) Page 10, line 215: "The meta-analysis revealed no heterogeneity in the direction nor the effect size of associations between populations". Please quote/refer to the results.
In the revision, the heterogeneity p-values were quoted and the relevant tables (Supplementary Table 8) were added to this sentence.
(27) Figure 2 has issues with x labels. Due to the low number of ever smokers in START, the boxplot may not be the best visualisation method. It would also benefit from listing n's per group.
We appreciate this comment to improve the figure presentation. We increased the font size for the X-labels. The sample size for each group in START was also labeled in the new Figure 3 (previously Figure 2).
Discussion
(28) Studying the association between maternal smoking and cord blood DNAm is interesting from a biological perspective as it allows for assessing the immediate and long-term effects of maternal smoking on newborn health. However, in terms of calculating the MRS, what are the benefits of using cord blood over the mother's blood? We know that blood-based DNAm smoking score is a powerful predictor of long-term smoking status.
The reviewer raises an interesting point – abundant literature supports that DNAm changes are tissue-specific. While mother’s blood DNAm smoking score reflect the long-term exposure to smoking in mothers, the cord blood DNAm captures the consequence of such long-term exposure for newborn health. One of the key results of our study is showing that established DNAm signatures of maternal smoking, which is known to mediate birth size and weight in white Europeans (these references were cited in the original manuscript), carries the same effect of reducing birth weight and size in the South Asian population. This is a critical finding from a DoHaD and public health perspective, as DNAm signatures of maternal smoking, irrespective of the smoking status of the mother, can influence the health trajectory of the newborns.
We have expanded our discussion based on this suggestion to highlight the unique features of studying maternal smoking via different tissues and their implications. The following was added to the discussion:
“There are several advantages of using a cord blood based biomarker from the DoHaD perspective. Firstly, cord blood provides a direct reflection of the in utero environment and fetal exposure to maternal smoking. Additionally, since cord blood is collected at birth, it eliminates potential confounding factors such as postnatal exposures that may affect maternal blood samples. Furthermore, studying cord blood DNAm allows for the assessment of epigenetic changes specifically relevant to the newborn, offering valuable information on the potential long-term health implications.”
(29) Page 13, line 285: "Fourth" without "third".
It has been revised accordingly.
Methods
(30) The methods section does not contain all the details required to replicate the analysis. Whenever statistical analysis is conducted, this section should clearly describe the type of the analysis (linear regression, t-test, etc.) and name the dependent and independent variables. Sample sizes should also be given.
We added further details of test used and sample size for each analysis. We have also included a new “Statistical analysis” subsection under Materials and Methods.
(31) Please describe MRS testing in the methods.
We tested MRS with respect to binary and continuous smoking phenotypes using a logistic and linear regression, respectively. The predictive value was assessed using area under the roc curve for the binary outcome and an adjusted R2 for the continuous outcome. These were added to the new “Statistical analysis” subsection under Materials and Methods. See response to comments #22-24, and #30.
(32) Please describe the methods used to compare the two versions of MRS for maternal
smoking.
It was a two-sample t-test, which was described in the Figure legends. We have now added this to the new “Statistical analysis” subsection under Materials and Methods.
(33) Please describe testing the associations between MRS and Offspring Anthropometrics in more detail.
We added further details on the regression model and the test for association in the methods. We have now added this to the new “Statistical analysis” subsection under Materials and Methods.
(34) Meta analysing the 450k and GMEL arrays is going to substantially reduce the number of CpGs under investigation.
We agree with the reviewer that this is not optimal for signal discovery. However, this is the only way we could synthesize evidence across the cohorts as FAMILY samples were only processed using the customized array. We added the following as a limitation of the study in the discussion.
“First, the customized array with a limited number of CpGs (<3,000) was designed in 2016 and many large EWASs on smoking and maternal smoking conducted more recently had not been included.”
(35) Page 16, line 364: GDM abbreviation was used in the results section (line 145), yet it is introduced in line 364.
Thank you for catching this, we have removed the duplicate.
(36) Page 17, line 381: Given the stated importance of ancestry, why not restrict the sample to genetically confirmed groups?
The reviewer has a valid point that ancestry, either perceived or genetic, can introduce additional heterogeneity due to potential differences in genetics, cultural and social practices, and lifestyles. Genetic data are indeed available for a subset of the individuals. In the original version of the manuscript, we used a stringent ancestry calling method by mapping all individuals with the 1000 Genomes samples from continental populations. The final definition was based on a combination of self-reported and genetically confirmed ancestry. However, if we restricted only to genetically confirmed groups, the sample size would be reduced to 312 (vs. 411), 268 (vs. 352), and 488 (vs. 504) in FAMILY, CHILD, and START, respectively.
We compared the mean difference in the beta-values of the top associated CpGs and the derived MRS between those genetically confirmed vs. self-reported ancestral groups, and observed no material difference. These results are now included in the Supplementary Materials as part of the sensitivity analysis. Thus, given these considerations, we decided to use this complementary approach to retain the maximum number of samples while ensuring some aspect of ancestral homogeneity.
“To maximize sample size in FAMILY and CHILD, we retained either self-identified or genetically confirmed Europeans based on available genetic data (Supplementary Table 1).”
(37) Page 18, line 397: sensitivity analysis not sensitive analysis.
Thank you for catching this, we have revised accordingly.
(38) Page 18, line 409: smoking was rank transformed however, it would be good to see regression diagnostics for the lead loci in the EWAS to check that assumptions were met.
We thank the reviewer for this suggestion. Smoking exposure is indeed skewed and in fact very much zero-inflated across the cohorts. The raw phenotype violated several model assumptions in terms of variance heteroskedasticity, outlying values (influential points), and linearity. The diagnostics suggested improved deviation from model assumption, yet some aspects of the violation remained at a lesser degree. We included a comparison of results before and after transformation and model diagnostics for the lead CpG using CHILD and FAMILY data in the Supplementary Materials. The following was added to the results:
“As a sensitivity analysis, we repeated the analysis for the continuous smoking exposure under rank transformation vs. raw phenotype for the associated CpG in GFI1 and examined the regression diagnostics (Supplementary Material), and found that the model under rank-transformation deviated less from assumptions.”
(39) Page 19, line 418: FDR seems quite a lenient threshold, especially when genome-wide significance thresholds exist. I would be inclined to view the EWAS findings as null.
The choice of use FDR to was indeed arbitrary as there has been no consensus on what significance threshold, if any, should be used in the context of EWAS. The significance threshold for GWAS (Pe’er et al., 2008) probably does not apply directly to EWAS as the number of effective tests will likely differ between genome-wide genetic variants and CpGs. The Bonferroni corrected p-value threshold in this context would be 0.05/200,050=2.5´10-7, which is still less stringent than the GWAS significance threshold. We originally decided to follow the convention of previous studies and use FDR to filter out a subset of plausible associations to contrast the top association signals for their effects between different populations and with reported effect sizes.
We have revised the manuscript throughout by removing the notion of significant associations, and instead used the phrase “top associated signals” or “top associations” when discussion EWAS results for individual CpGs. The following was added to Materials and Methods to clarify the choice of our threshold:
“For each EWAS or meta-analysis, the false discovery rate (FDR) adjustment was used to control multiple testing and we considered CpGs that passed an FDR-adjusted p-value < 0.05 to be relevant for maternal smoking.”
(40) I do not understand Supplementary Figure 6 - how have the data been standardised? Why not plot the CpGs on the beta-value scale?
The standardized values were plotted as the reported p-values for the mean and variance equality tests (i.e. ANOVA F-test, Levene’s test, Anderson-Darling test) were based on these transformed values to reduce inflation due to non-normality. We have since removed this comparison and kept only the comparison of the overall score as the number of CpGs in the HM450k score (143 CpGs) for comparison is too high to be visually interpretable.
(41) It is my understanding, that the MRS for maternal smoking was constructed using external weights projected and regularised using elastic net (effectively trained) in CHILD cohort. The results section discusses associations between maternal smoking history and outcomes in CHILD, FAMILY, and START. Training and testing the score in the same sample (cohort) may result in overfitting and therefore should not be implemented.
The original MRS was constructed using external weights from an independent discovery sample (Joubert et al., 2016; n > 5,000) and the LASSO validation was done in CHILD (n = 352), external testing was in FAMILY and START. This was the lassosum framework whereby we leverage larger sample size from external studies to select more plausible CpGs as candidates to include in the model. Thus, training, validation, and testing were not done in the same samples. We have included a Figure 1 to illustrate the updated analytical flow and a graphical abstract to summarize the methods.
(42) Is it a concern that the findings don't seem to replicate Joubert's results, which came from a much larger study?
Replication is usually done in samples much larger than the discovery samples, thus it is not a concern that we were unable to confirm all signals from Joubert et al., (2016). However, 6/7 of the top associations (FDR adjusted p-value < 0.05) in the meta-analysis were declared as significant in Joubert et al. (2016). In addition, the fact that using Joubert’s summary statistics, we were able to derive MRSs that were strongly associated with both smoking history and weekly exposure suggests shared signals. Also see response to R1 comment #16 for a comparison of effect consistency.
(43) Please check that all analysis scripts have been uploaded to Github and that the EWAS results are publicly available.
We thank the reviewer for this suggestion. All updated scripts and EWAS results are available on Github. We are working to have the results also submitted to EWAS catalog.
Reviewer #2 (Recommendations For The Authors):
The impact of this study is reduced due to previous findings:
(1) Previous studies have already shown that DNA methylation may mediate the effect of maternal smoking on birth size/weight (see e.g.https://doi.org/10.1098/rstb.2018.0120; https://doi.org/10.1093/ije/dyv048).
We thank the reviewer for this point and would like to take the opportunity to clarify that it was not our objective to examine whether there was a causal relationship, between DNA methylation and birth size that was mediated by maternal smoking. One of the key messages of our study is to evaluate whether epigenetic associations – at individual CpGs and aggregated as a score – are consistent between white European and South Asian populations. One way to examine this is through using established DNAm signatures of maternal smoking, which is known to mediate birth size and weight in white Europeans (these references were cited in the original manuscript), and confirm whether they also carry the same effect on birth outcomes in the South Asian population.
Indeed, our results support that maternal smoking methylation score was consistently associated with negative outcomes in newborns of both white European and South Asian mothers despite no maternal smoking was present in South Asian mothers. These collective point to the possibility that the maternal smoking MRS was capturing a lot more than just smoking and second-hand smoking, but potentially other environmental exposures that also lead to oxidative stress. These together are associated with health consequences, including reduced birth size/weight. One of the candidates for such exposure is air pollution as some of the maternal smoking CpGs were previously linked to air pollution. However, we were unable to assess this hypothesis directly without the air pollution data, and the air pollution methylation score was not associated with smoking history (Supplementary Figure 5) nor smoking exposure (p > 0.4 in CHILD, FAMILY and START).
The following was added to Materials and Methods under the subsection Using DNA Methylation to Construct Predictive Models for Maternal Smoking:
“To benchmark and compare with existing maternal smoking MRSs, we calculated the Reese score using 28 CpGs (48,49), Richmond score using 568 CpGs (49), Rauschert score using 204 CpGs (50), Joubert score using all 2,620 CpGs with evidence of association for maternal smoking (19), and finally a three-CpG score for air pollution (51). The details of these scores and score weight can be found in Supplementary Table 4.”
The following was added to Results
“Both produced methylation scores that were significantly associated with maternal smoking history (ANOVA F-test p-values =1.0×10⁻⁶ and 2.4×10⁻¹⁴ in CHILD and 6.9×10⁻¹⁶ and <2.2×10⁻¹⁶ in FAMILY), and the best among alternative scores for CHILD and FAMILY (Supplementary Table 5). With the exception of the air pollution MRS, all remaining scores were marginally associated with smoking history in both CHILD and FAMILY (Supplementary Figure 5).”
(2) Due to the small study size and low levels of prenatal smoke exposure, the model derived here is of little value and is, in fact, superseded by a previously published model (PMID: 27323799). At the very least, the model should be evaluated here. A novel aspect of this study is the inclusion of a South Asian cohort. Unfortunately, smoke exposure is practically non-existent, so it is unclear how it can be used. The more interesting finding in this study is the possibility that environmental factors such as second-hand smoke or pollution may have similar effects on pregnancies as maternal smoking. Are these available? If so, they could be evaluated for associations with DNA methylation. This would be novel.
In the revised manuscript, we included the Reese score (Reese et al., 2017) and a few other maternal smoking scores for comparison. In the CHILD cohort, the performance was comparable to our derived score (AUC of 0.95 vs. 0.94 for Reese score), but its applicability was limited since the FAMILY dataset was profiled using a targeted array and only 7 out of 28 of the CpGs in the Reese score were available (AUC of 0.89 vs. 0.72 for Reese). As compared to the remaining scores from literature (see the new Supplementary Table 5 for complete results), Reese’s score has generally favorable performance.
We did examine second-hand smoking in the original manuscript, showing a significant association with weekly maternal smoking exposure (original Table 3 and Supplementary Table 8). However, air pollution data is not available for assessment.
(3) The other novel aspect is the evaluation of associations with outcomes later in life. Height and weight are interesting but impact could be gained by including other relevant outcomes such as birth complications, asthma, and intellectual impairment which are known to be associated with prenatal smoking.
We thank the reviewer for bring up this point. One of the key health outcomes in the CHILD study was asthma, and data at later time points are available. However, we do not have similar outcomes collected in the other two studies (FAMILY and START), which focused on cardiometabolic health in young children. Thus, we did not initially include outcomes that were not available across all cohorts as the intention was to contrast the effects between populations.
We recognize that this is an important question and decided to provide the association results for mother reported asthma and allergy, but based on different definitions as these outcomes cannot be harmonized across the cohorts. We also included mode of delivery via emergency C-section as an additional proxy outcome of birth complication.
The following was added to Materials and Methods:
“Mode of delivery (emergency c-section vs. other) was collected at the time of delivery.”
“Additional phenotypes included smoking exposures (hours per week) at home, potential allergy based on mother reporting any of: eczema, hay fever, wheeze, asthma, food allergy (egg, cow milk, soy, other) for her child in FAMILY and START, and asthma based on mother’s opinion in CHILD (“In your opinion, does the child have any of the following? Asthma”).”
The following was added to Results:
“The maternal smoking MRS was consistently associated with increasing weekly smoking exposure in children reported by mothers at the 1-year (0.51±0.15, FDR adjusted p= 0.0052) , 3-year (0.53±0.16, FDR adjusted p= 0.0052), and 5-year (0.40±0.15, FDR adjusted p= 0.021) visits with similar effects.”
“We did not find any association with self-reported allergy or asthma in children at later visits (Supplementary Table 8). Further, there was no evidence of association between the MRS and any maternal outcomes (Supplementary Table 8).”
REFERENCES:
Gondalia, R., Baldassari, A., Holliday, K. M., Justice, A. E., Stewart, J. D., Liao, D., . . . Whitsel, E. A. (2021). Epigenetically mediated electrocardiographic manifestations of sub-chronic exposures to ambient particulate matter air pollution in the Women's Health Initiative and Atherosclerosis Risk in Communities Study. Environ Res, 198, 111211. doi:10.1016/j.envres.2021.111211
Joubert, B. R., Felix, J. F., Yousefi, P., Bakulski, K. M., Just, A. C., Breton, C., . . . London, S. J. (2016). DNA Methylation in Newborns and Maternal Smoking in Pregnancy: Genome-wide Consortium Meta-analysis. Am J Hum Genet, 98(4), 680-696. doi:10.1016/j.ajhg.2016.02.019
Martin, J. A., Osterman, M. J. K., & Driscoll, A. K. (2023). Declines in Cigarette Smoking During Pregnancy in the United States, 2016-2021. NCHS Data Brief(458), 1-8. Retrieved from https://www.ncbi.nlm.nih.gov/pubmed/36723453
Reese, S. E., Zhao, S., Wu, M. C., Joubert, B. R., Parr, C. L., Haberg, S. E., . . . London, S. J. (2017). DNA Methylation Score as a Biomarker in Newborns for Sustained Maternal Smoking during Pregnancy. Environ Health Perspect, 125(4), 760-766. doi:10.1289/EHP333
-
eLife assessment
This study offers a useful advance by introducing a cord blood DNA methylation score for maternal smoking effects, with the inclusion of cohorts from diverse backgrounds. However, the overall strength of evidence is deemed incomplete, due to concerns regarding low exposure levels and low statistical power, which hampers the generalisability of their findings. The study provides an interesting basis for future studies, but would benefit from the addition of more cohorts to validate the findings and a focus on more diverse health outcomes.
-
Reviewer #2 (Public Review):
Summary:
The authors generated a DNA methylation score in cord blood for detecting exposure to cigarette smoke during pregnancy. They then asked if it could be used to predict height, weight, BMI, adiposity and WHR throughout early childhood.
Strengths:
The study included two cohorts of European ancestry and one of South Asian ancestry.
Weaknesses:
(1) Numbers of mothers who self-reported any smoking was very low likely resulting in underpowered analyses.
(2) Although it was likely that some mothers were exposed to second-hand smoke and/or pollution, data on this was not available.
(3) One of the European cohorts and half of the South Asian cohort had DNA methylation measured on only 2500 CpG sites including only 125 sites previously linked to prenatal smoking.
-
Reviewer #3 (Public Review):
Summary:
Deng et al. assess neonatal cord blood methylation profiles and the association with (self-reported) maternal smoking in multiple populations, including two European (CHILD, FAMILY) and one South Asian (START), via two approaches: 1) they perform an independent epigenome-wide association study (EWAS) and meta-analysis across the CHILD and FAMILY cohort, during which they also benchmark previously reported maternal-smoking associated sites, and 2) they generate new composite methylation risk scores for maternal smoking, and assess their performance and association with phenotypic characteristics in the three populations, in addition to previously described maternal smoking methylation risk scores.
Strengths and weaknesses:
Their meta-analysis across multiple cohorts and comparison with previous …
Reviewer #3 (Public Review):
Summary:
Deng et al. assess neonatal cord blood methylation profiles and the association with (self-reported) maternal smoking in multiple populations, including two European (CHILD, FAMILY) and one South Asian (START), via two approaches: 1) they perform an independent epigenome-wide association study (EWAS) and meta-analysis across the CHILD and FAMILY cohort, during which they also benchmark previously reported maternal-smoking associated sites, and 2) they generate new composite methylation risk scores for maternal smoking, and assess their performance and association with phenotypic characteristics in the three populations, in addition to previously described maternal smoking methylation risk scores.
Strengths and weaknesses:
Their meta-analysis across multiple cohorts and comparison with previous findings represents a strength. In particular the inclusion of a South Asian birth cohort is commendable as it may help to bolster generalizability. However, their conclusions are limited by several important weaknesses:
(1) the low number of (self-reported) maternal smokers in particular their South Asian population, resulting in an inability to conduct benchmarking of maternal smoking sites in this cohort. As such, the inclusion of the START cohort in certain figures is not warranted (e.g., Figure 3) and the overall statement that smoking-associated MRS are portable across populations are not fully supported;
(2) different methylation profiling tools were used: START and CHILD methylation profiles were generated using the more comprehensive 450K array while the FAMILY cohort blood samples were profiled using a targeted array covering only 3,000, as opposed to 450,000 sites, resulting in different coverage of certain sites which affects downstream analyses and MRS, and importantly, omission of potentially relevant sites as the array was designed in 2016 and substantial additional work into epigenetic traits has been conducted since then;
(3) the authors train methylation risk scores (MRS) in CHILD or FAMILY populations based on sites that are associated with maternal smoking in both cohorts and internally validate them in the other cohort, respectively. As START cohort due to insufficient numbers of self-reported maternal smokers, the authors cannot fully independently validated their MRS, thus limiting the strength of their results.Overall strength of evidence and conclusions:
Despite these limitations, the study overall does explore the feasibility of using neonatal cord blood for the assessment of maternal smoking. However, their conclusion on generalizability of the maternal smoking risk score is currently not supported by their data as they were not able to validate their score in a sufficiently large number of maternal smokers and never smokers of South Asian populations.
While their generalizability remains limited due to small sample numbers and previous studies with methylation risk scores exist, their findings may nonetheless provide the basis for future work into prenatal exposures which will be of interest to the research community. In particular their finding that the maternal smoking-associated MRS was associated with small birth sizes and weights across birth cohorts, including the South Asian birth cohort that had very few self-reported smokers, is interesting and the author suggest these findings could be associated with factors other than smoking alone (e.g., pollution), which warrant further investigation and would be highly novel.
Future exploration should also include a strong focus on more diverse health outcomes, including respiratory conditions that may have long-lasting health consequences. -
-
Author Response
We thank the reviewers for spending the time to read and provide reviews for our manuscript. The reviewers bring good points regarding the sample size, and the low exposure in the South Asian cohort owing to their unique cultural and social practices. We recognize these as limitations of the paper and will discuss these more extensively in the revised version. With respect to sample size, we are not attempting discovery but rather application of mDNA scores derived from external, large discovery samples. As such, though our sample sizes (n = 300–500) seem low for a typical EWAS, they are in a similar range as replication samples in other studies.
We would also like to take this opportunity to emphasize there is no possible overfitting as the score was tested in studies (FAMILY and START) independent of the discovery set …
Author Response
We thank the reviewers for spending the time to read and provide reviews for our manuscript. The reviewers bring good points regarding the sample size, and the low exposure in the South Asian cohort owing to their unique cultural and social practices. We recognize these as limitations of the paper and will discuss these more extensively in the revised version. With respect to sample size, we are not attempting discovery but rather application of mDNA scores derived from external, large discovery samples. As such, though our sample sizes (n = 300–500) seem low for a typical EWAS, they are in a similar range as replication samples in other studies.
We would also like to take this opportunity to emphasize there is no possible overfitting as the score was tested in studies (FAMILY and START) independent of the discovery set (Joubert et al., 2016; n > 5,000) and the LASSO validation (CHILD; n = 352). In other words, the same participants used for LASSO validation were not used in testing. This is precisely to leverage the larger sample size from external studies to select more plausible CpGs as candidates to include in the model. In fact, the discovery sample size in Reese et al., (2017) was only n = 1,057 in comparison.
The validated score was then used for further testing in new datasets (FAMILY and START), where FAMILY achieved a more significant association than in the original validation sample (CHILD). At the same time, the mean squared error for the continuous smoking severity outcome (0 for no smoking, 1 for quit before pregnancy, 2 for quit during pregnancy, and 3 for current smoker) was 0.68 in CHILD and 1.43 in FAMILY, which indicate good fit; while the AUC for predicting current vs. non-smoker was 0.86 in CHILD and 0.9 in FAMILY. Taken together, these suggest the MRS constructed was not in violation of overfitting, or “failing to fit to additional data or predict future observations reliably”.
In terms of value, our derived score contained 11 CpGs that only overlapped 2 out of the 28 CpGs in the score that was derived in the reference provided (Reese, EHP, 2017, PMID 27323799), but they shared four genes that contributed the most weight to the score (MYO1G, CYP1A1, AHRR, and GFI1). In fact, using the 7 CpGs of the score derived in Reese that were present in all cohorts, we obtained slightly worse performance in CHILD (validation cohort; ANOVA p = 4.1E-5, AUC 0.74), and it was not associated with smoking history in FAMILY (testing cohort; p = 0.13). However, we do agree with the reviewer that including more CpGs will improve the performance, using 24/28 CpGs available in CHILD (HM450K), we obtained slightly better results (ANOVA p = 3.8E-7, AUC 0.94), but these were mostly due to the 14/24 CpGs that showed evidence of association with maternal smoking according to EWAS catalog. In conclusion, we believe our score captures the core genes with robust evidence of association and is more parsimonious for applying to external data, but it can also benefit from a larger sample size to capture CpGs that are moderately associated with maternal smoking.
-
eLife assessment
This study offers a useful advance by introducing a cord blood DNA methylation score for maternal smoking effects, with the inclusion of diverse cohorts. However, the overall strength of evidence is deemed incomplete, due to concerns regarding low exposure levels, low statistical power, potential overfitting, and the need for clearer descriptions of statistical methods. Building more directly from the existing evidence base, exploring differences between ancestries, and considering additional health outcomes would help to enhance the study.
-
Reviewer #1 (Public Review):
Summary:
The authors report on the development of the first cord blood DNA methylation score to capture the epigenetic effects of maternal smoking. The score was built in a White European cohort and tested in White European and South Asian ancestry cohorts. Additionally, epigenome-wide association studies were conducted to quantify the impact of maternal smoking on newborn health.
Strengths:
The main strengths include the use of multiple cohorts of different ancestries. This is also the first study to build a cord blood predictor of maternal smoking.
Weaknesses:
The manuscript could benefit from a more detailed description of methods, especially those used to derive MRS for maternal smoking, which appears to involve overfitting. In particular, the addition of a flow chart would be very helpful to guide the …
Reviewer #1 (Public Review):
Summary:
The authors report on the development of the first cord blood DNA methylation score to capture the epigenetic effects of maternal smoking. The score was built in a White European cohort and tested in White European and South Asian ancestry cohorts. Additionally, epigenome-wide association studies were conducted to quantify the impact of maternal smoking on newborn health.
Strengths:
The main strengths include the use of multiple cohorts of different ancestries. This is also the first study to build a cord blood predictor of maternal smoking.
Weaknesses:
The manuscript could benefit from a more detailed description of methods, especially those used to derive MRS for maternal smoking, which appears to involve overfitting. In particular, the addition of a flow chart would be very helpful to guide the reader through the data and analyses. The FDR correction in the EWAS corresponds to a fairly liberal p-value threshold.
-
Reviewer #2 (Public Review):
Summary:
The authors generated a DNA methylation score in cord blood for detecting exposure to cigarette smoke during pregnancy. They then asked if it could be used to predict height, weight, BMI, adiposity, and WHR throughout early childhood.
Strengths:
The study included two cohorts of European ancestry and one of South Asian ancestry.
Weaknesses:
1. The number of mothers who self-reported any smoking was very low, much lower than in the general population and practically non-existent in the South Asian population. As a result, all analyses appeared to have been underpowered. It is possibly for this reason that the authors chose to generate their DNA methylation model using previously published summary statistics. The resulting score is not of great value in itself due to the low-powered dataset used to …
Reviewer #2 (Public Review):
Summary:
The authors generated a DNA methylation score in cord blood for detecting exposure to cigarette smoke during pregnancy. They then asked if it could be used to predict height, weight, BMI, adiposity, and WHR throughout early childhood.
Strengths:
The study included two cohorts of European ancestry and one of South Asian ancestry.
Weaknesses:
1. The number of mothers who self-reported any smoking was very low, much lower than in the general population and practically non-existent in the South Asian population. As a result, all analyses appeared to have been underpowered. It is possibly for this reason that the authors chose to generate their DNA methylation model using previously published summary statistics. The resulting score is not of great value in itself due to the low-powered dataset used to estimate covariance between CpG sites. In fact, a score was generated for a much larger, better-powered dataset several years ago (Reese, EHP, 2017, PMID 27323799).
2. The conclusion that "even minimal smoking exposure in South Asian mothers who were not active smokers showed a DNAm signature of small body size and low birthweight in newborns" is not warranted because no analyses were performed to show that the association between DNA methylation and birth size/weight was driven by maternal smoking.
3. Although it was likely that some mothers were exposed to second-hand smoke and/or pollution, data on this was either non-existent or not included in this study. Including this would have allowed a more novel investigation of the effects of smoke exposure on the pregnancies of non-smoking mothers.
4. One of the European cohorts and half of the South Asian cohort had DNA methylation measured on only 2500 CpG sites. This set of sites included only 125 sites previously linked to prenatal smoking. The resulting model of prenatal smoking was small (only 11 CpG sites). It is possible that a large model may have been more powerful.
5. The health outcomes investigated are potentially interesting but there are other possibly more important outcomes of interest such as birth complications, asthma, and intellectual impairment which are known to be associated with prenatal smoking.
-
