EEG-fMRI in awake rat and whole-brain simulations show decreased brain responsiveness to sensory stimulations during absence seizures
Curation statements for this article:-
Curated by eLife

eLife assessment
This study conducted fMRI experiments in an inbred rat model of absence seizures. The results provide new information suggesting reduced brain responsiveness during this type of seizure. The reviewers had divergent opinions but on average thought the study was valuable and the conclusions were solid.
This article has been Reviewed by the following groups
Discuss this preprint
Start a discussion What are Sciety discussions?Listed in
- Evaluated articles (eLife)
Abstract
In patients suffering absence epilepsy, recurring seizures can significantly decrease their quality of life and lead to yet untreatable comorbidities. Absence seizures are characterized by spike-and-wave discharges on the electroencephalogram associated with a transient alteration of consciousness. However, it is still unknown how the brain responds to external stimuli during and outside of seizures. This study aimed to investigate responsiveness to visual and somatosensory stimulation in Genetic Absence Epilepsy Rats from Strasbourg (GAERS), a well-established rat model for absence epilepsy. Animals were imaged under non-curarized awake state using a quiet, zero echo time, functional magnetic resonance imaging (fMRI) sequence. Sensory stimulations were applied during interictal and ictal periods. Whole-brain hemodynamic responses were compared between these two states. Additionally, a mean-field simulation model was used to explain the changes of neural responsiveness to visual stimulation between states. During a seizure, whole-brain responses to both sensory stimulations were suppressed and spatially hindered. In the cortex, hemodynamic responses were negatively polarized during seizures, despite the application of a stimulus. The mean-field simulation revealed restricted propagation of activity due to stimulation and agreed well with fMRI findings. Results suggest that sensory processing is hindered or even suppressed by the occurrence of an absence seizure, potentially contributing to decreased responsiveness during this absence epileptic process.
Article activity feed
-

-
-

Author response:
The following is the authors’ response to the previous reviews.
eLife assessment
This valuable work performed fMRI experiments in a rodent model of absence seizures. The results provide new information regarding the brain's responsiveness to environmental stimuli during absence seizures. The authors suggest reduced responsiveness occurs during this type of seizure, and the evidence leading to the conclusion is solid, although reviewers had divergent opinions.
Public Reviews:
Reviewer #1 (Public Review):
In this paper, the effects of two sensory stimuli (visual and somatosensory) on fMRI responsiveness during absence seizures were investigated in GEARS rats with concurrent EEG recordings. SPM analysis of fMRI showed a significant reduction in whole-brain responsiveness during the ictal period compared to the …
Author response:
The following is the authors’ response to the previous reviews.
eLife assessment
This valuable work performed fMRI experiments in a rodent model of absence seizures. The results provide new information regarding the brain's responsiveness to environmental stimuli during absence seizures. The authors suggest reduced responsiveness occurs during this type of seizure, and the evidence leading to the conclusion is solid, although reviewers had divergent opinions.
Public Reviews:
Reviewer #1 (Public Review):
In this paper, the effects of two sensory stimuli (visual and somatosensory) on fMRI responsiveness during absence seizures were investigated in GEARS rats with concurrent EEG recordings. SPM analysis of fMRI showed a significant reduction in whole-brain responsiveness during the ictal period compared to the interictal period under both stimuli, and this phenomenon was replicated in a structurally constrained whole-brain computational model of rat brains.
The conclusion of this paper is that whole-brain responsiveness to both sensory stimuli is inhibited and spatially impeded during seizures.
Reviewer #2 (Public Review):
Summary:
This study examined the possible affect of spike-wave discharges (SWDs) on the response to visual or somatosensory stimulation using fMRI and EEG. This is a significant topic because SWDs often are called seizures and because there is non-responsiveness at this time, it would be logical that responses to sensory stimulation are reduced. On the other hand, in rodents with SWDs, sensory stimulation (a noise, for example) often terminates the SWD/seizure.
In humans, these periods of SWDs are due to thalamocortical oscillations. A certain percentage of the normal population can have SWDs in response to photic stimulation at specific frequencies. Other individuals develop SWDs without stimulation. They disrupt consciousness. Individuals have an absent look, or "absence", which is called absence epilepsy.
The authors use a rat model to study the responses to stimulation of the visual or somatosensory systems during and in between SWDs. They report that the response to stimulation is reduced during the SWDs. While some data show this nicely, the authors also report on lines 396-8 "When comparing statistical responses between both states, significant changes (p<0.05, cluster-) were noticed in somatosensory auditory frontal..., with these regions being less activated in interictal state (see also Figure 4). That statement is at odds with their conclusion. I do not see that this issue was addressed.
See comments below starting with “We acknowledge the reviewer…”.
They also conclude that stimulation slows the pathways activated by the stimulus. I do not see any data proving this. It would require repeated assessments of the pathways in time. This issue was not addressed.
See comments below starting with “We acknowledge the reviewer…”.
The authors also study the hemodynamic response function (HRF) and it is not clear what conclusions can be made from the data. This is still an issue. No conclusions appear to be possible to make.
See comments below starting with “We acknowledge the reviewer…”.
Finally, the authors use a model to analyze the data. This model is novel and while that is a strength, its validation is unclear. The authors did not add any validation of their model.
See comments below starting with “We acknowledge the reviewer…”.
Strengths:
Use of fMRI and EEG to study SWDs in rats.
Weaknesses:
Several aspects of the Methods and Results were improved but some are still are unclear.
We acknowledge the reviewer for the concerns of we not addressing the comments above. However, we emphasize that most of the comments were addressed in the already sent “Response to Review Comments” and in the updated manuscript. Here we repeat the responses and provide also additional clarifications to some of the comments.
We thank the reviewer for noting the discrepancy in the statement of “less activated in interictal state”. The statement should have been written vice versa. We also address that the direction of activation change between groups can be misinterpreted based on statistical maps itself (Figure 3) where only statistical changes are visible and not the polarity of response (can be seen in Figure 4). Therefore, we have made a following changes in the section 3.3.: “There were more voxels with significant changes of activity during interictal state compared to ictal state (136% more). Comparing the statistical responses between interictal and ictal states revealed significant changes (p<0.05, cluster-level corrected) in the visual, somatosensory, and medial frontal cortices. In the ictal state, these regions showed significant hemodynamic decreases when comparing to interictal state, and these polarity changes can be seen the hemodynamic response functions (Figure 4).”
We agree with the reviewer that there are no data showing slowing of the pathways in response to stimulus. However, we are a bit confused about this comment, as to what part in conclusion section it refers to. We did not intentionally claim that stimulation slows the activated pathways in the manuscript.
Reviewer is right that strong claims cannot be made from HRF by itself. Therefore, we have avoided to such phrasing throughout the manuscript. In the conclusion section, we speculate that HRF decreases “could play a role in decreased sensory perception” but also state that “further studies are required”. The observed HRF decreases (rather than increases) in the cortex when stimulation was applied during SWD, was discussed in section 4.4., where we speculated that neuronal suppression (possible apparent in negative HRFs) caused by SWD can prevent responsiveness. Conclusion now states the following: “Moreover, the detected decreases in the cortical HRF when sensory stimulation was applied during spike-and-wave discharges, could play a role in decreased sensory perception. Further studies are required to evaluate whether this HRF change is a cause or a consequence of the reduced neuronal response.”
We point out that the main validation of the model and its details were provided in the previous answer to the reviewer and added to the manuscript. The model presented in the paper is based on a mean-field formalism that captures neuronal activity at the mesoscale level. This mean-field formalism is derived via a detailed statistical description of the activity of a spiking neuronal population of excitatory and inhibitory with conductance-based synaptic interactions. Thus, the validation of the mean-field model is performed via direct comparison between the dynamics obtained from the mean-field model and the dynamics obtained from the underlying spiking neural network model. This comparison is shown in the supplementary material of the manuscript, where the transition studied in the paper between interictal (asynchronous irregular activity) and ictal (SWD dynamics) activity, which is predicted by the mean-field model, is indeed observed in the underlying spiking neuronal model. The existence of these two types of dynamics and the transition between them is the main component of the model used to build the analysis of the responsiveness performed in the paper (which has been properly validated).
Reviewer #3 (Public Review):
Summary:
This is an interesting paper investigating fMRI changes during sensory (visual, tactile) stimulation and absence seizures in the GAERS model. The results are potentially important for the field and do suggest that sensory stimulation may not activate brain regions normally during absence seizures. But the findings are limited by substantial methodological issues that do not enable fMRI signals related to absence seizures to be fully disentangled from fMRI signals related to the sensory stimuli.
Strengths:
Investigating fMRI brain responses to sensory stimuli during absence seizures in an animal model is a novel approach with potential to yield important insights.
Use of an awake, habituated model is a valid and potentially powerful approach.
Weaknesses:
The major difficulty with interpreting the results of this study is that the duration of the visual and tactile stimuli were 6 seconds, which is very close to the mean seizure duration per Table 1. Therefore the HRF model looking at fMRI responses to visual or auditory stimuli occurring during seizures was simultaneously weighting both seizure activity and the sensory (visual or auditory) stimuli over the same time intervals on average. The resulting maps and time courses claiming to show fMRI changes from visual or auditory stimulation during seizures will therefore in reality contain some mix of both sensory stimulation-related signals and seizure-related signals. The main claim that the sensory stimuli do not elicit the same activations during seizures as they do in the interictal period may still be true. But the attempts to localize these differences in space or time will be contaminated by the seizure related signals.
In their response to this comment the authors state that some seizures had longer than average duration, and that they attempted to model the effects of both seizures and sensory stimulation. However these factors do not mitigate the concern because the mean duration of seizures and sensory stimulation remain nearly identical, and the models used therefore will not be able to effectively separate signals related to seizures and related to sensory stimulation.
Regressors for seizures were formed by including periods of seizures without any stimulation present. In theory, if seizures were perfectly modeled by the regressor, the left variance is completely orthogonal to the main effect of the stimulus. Furthermore, only the cases where the seizures are longer than the stimulus are used to calculate the responsiveness of the stimulus (while the cases where the seizures are shorter than the stimulus are used as nuisance regressors to account for error variance). However, we agree with the reviewer that in practice all effects of the seizure cannot be removed completely from the effect of stimulus. We have addressed this concern in the “physiologic and methodology consideration” section: “We note a caution that presented maps and time courses showing fMRI changes from visual or whisker stimulation during seizures may contain a mixture of both sensory stimulation-related signals and seizure-related signals. To minimize this contamination in the linear model used, we considered both stimulation and seizure-only states as regressors of interest and used seizure-only responses as nuisance regressors to account for error variance. Thereby, the effects caused by the stimulation should be separated as much as possible from the effects caused by the seizure itself.”
The claims that differences were observed for example between visual cortex and superior colliculus signals with visual stim during seizures vs interictal remain unconvincing due to above.
Maps shown in Figure 3 do not show clear changes in the areas claimed to be involved.
In their response the authors enlarged the cross sections. However there are still discrepancies between the images and the way they are described in the text. For example, in the Results text the authors say that comparing the interictal and ictal states revealed less activation in the somatosensory cortex during the ictal than during the interictal state, yet Figure 3 bottom row left shows greater activation in somatosensory cortex in this contrast.
We note that the direction of activation change between groups can be misinterpreted based on statistical maps itself (Figure 3) where only statistical changes are visible and not the polarity of response (can be seen in Figure 4). Therefore, we have made the following changes to the section 3.3.: “There were more voxels with significant changes of activity during interictal state compared to ictal state (136% more). Comparing the statistical responses between interictal and ictal states revealed significant changes (p<0.05, cluster-level corrected) in the visual, somatosensory, and medial frontal cortices. In the ictal state, these regions showed significant hemodynamic decreases when comparing to interictal state, and these polarity changes can be seen the hemodynamic response functions (Figure 4).”
Recommendations for the authors:
Reviewer #1 (Recommendations For The Authors):
Authors have revised this paper with a lot of detail. The paper can be accepted for publication in this version.
Reviewer #2 (Recommendations For The Authors):
Reviewer #1
(1) The analysis in this paper does not directly answer the scientific question posed by the authors, which is to explore the mechanisms of the reduced brain responsiveness to external stimuli during absence seizures (in terms of altered information processing), but merely characterizes the spatial involvement of such reduced responsiveness. The same holds for the use of mean-field modeling, which merely reproduces experimental results without explaining them mechanistically as what the authors have claimed at the head of the paper.
We agree with the reviewer that the manuscript does not answer specifically about the mechanisms of reduced brain responsiveness. The main scientific question addressed in the manuscript was to compare whole-brain responsiveness of stimulus between ictal and interictal states. The sentence that can lead to misinterpretations in the manuscript abstract: "The mechanism underlying the reduced responsiveness to external stimulus remains unknown." was therefore modified to the following "The whole-brain spatial and temporal characteristics of reduced responsiveness to external stimulus remains unknown".
This change did not address the issue. The problem is that there is no experimentation to address the underlying mechanisms of the results. I also think the changed language in the abstract is less clear than the original.
We fully agree that this manuscript does not answer or claim to be answering about the mechanisms of reduced brain responsiveness. The main scientific question addressed in the manuscript was to compare whole-brain responsiveness of stimulus between ictal and interictal states, by means of hemodynamics and mean-field simulation.
We have changed the language of the abstract to the following:
“In patients suffering absence epilepsy, recurring seizures can significantly decrease their quality of life and lead to yet untreatable comorbidities. Absence seizures are characterized by spike-and-wave discharges on the electroencephalogram associated with a transient alteration of consciousness. However, it is still unknown how the brain responds to external stimuli during and outside of seizures.
This study aimed to investigate responsiveness to visual and somatosensory stimulation in GAERS, a well-established rat model for absence epilepsy. Animals were maintained in a non-curarized awake state allowing for naturally occurring seizures to be produced inside the magnet. They were imaged continuously using a quiet zero-echo-time functional magnetic resonance imaging (fMRI) sequence. Sensory stimulations were applied during interictal and ictal periods. Whole brain responsiveness and hemodynamic responses were compared between these two states. Additionally, a mean-field simulation model was used to mechanistically explain the changes of neural responsiveness to visual stimulation between interictal and ictal states.
Results showed that, during a seizure, whole-brain responses to both sensory stimulations were suppressed and spatially hindered. In several cortical regions, hemodynamic responses were negatively polarized during seizures, despite the application of a stimulus. The simulation experiments also showed restricted propagation of spontaneous activity due to stimulation and so agreed well with fMRI findings. These results suggest that sensory processing observed during an interictal state is hindered or even suppressed by the occurrence of an absence seizure, potentially contributing to decreased responsiveness during this absence epileptic process.”
The authors also study the hemodynamic response function (HRF) and it is not clear what conclusions can be made from the data.
The response of the authors did not clarify this issue. Instead, they explained why they examined HRF and that they can only speculate what the data means.
Reviewer is right that strong claims cannot be made from HRF by itself. Therefore, we have avoided to such phrasing throughout the manuscript. In the conclusion section, we speculate that HRF decreases “could play a role in decreased sensory perception” but also state that “further studies are required”.
Finally, the authors use a model to analyze the data. This model is novel and while that is a strength, its validation is unclear. The conclusion is that the modeling supports the conclusions of the study, which is useful.
Details about the model were added.
This is not entirely satisfactory because there is still no validation of the model.
We point out that the main validation of the model and its details were provided in the previous answer to the reviewer and added to the manuscript. The model presented in the paper is based on a mean-field formalism that captures neuronal activity at the mesoscale level. This mean-field formalism is derived via a detailed statistical description of the activity of a spiking neuronal population of excitatory and inhibitory with conductance-based synaptic interactions. Thus, the validation of the mean-field model is performed via direct comparison between the dynamics obtained from the mean-field model and the dynamics obtained from the underlying spiking neural network model. This comparison is shown in the supplementary material of the manuscript, where the transition studied in the paper between interictal (asynchronous irregular activity) and ictal (SWD dynamics) activity, which is predicted by the mean-field model, is indeed observed in the underlying spiking neuronal model. The existence of these two types of dynamics and the transition between them is the main component of the model used to build the analysis of the responsiveness performed in the paper (which has been properly validated).
How is ROI defined in this paper? What type of atlas is used?
Anatomical ROIs were drawn based on Paxinos and Watson rat brain atlas 7th edition. Region was selected if there were statistically significant activations detected inside that region, based on activation maps. We clarified the definition of ROI as the following:
"Anatomical ROIs, based on Paxinos atlas (Paxinos and Watson rat brain atlas 7th edition), were drawn on the brain areas where statistical differences were seen in activation maps."This is helpful, but the unstained brain does not show the borders of the areas. Therefore just saying an atlas was used is not enough. How in an unstained brain can the areas be accurately outlined?
Areas of the brain were differentiated by co-registering the functional MRI images with an T1-weighted anatomical reference brain that was created on site from the same data set that was used for the manuscript. Potential co-registration inaccuracies created by using a reference brain measured in different site, sequence and a rat strain can be thus avoided. T1-images create sufficient contrast to differentiate main brain areas, but for more accurate border definition (e.g., to differentiate different thalamic nuclei), a coordinate system of the atlas and coordinates known in the used anatomical brain, were used to pinpoint exact borders of the brain areas.
Reviewer #2
The following also is not precise:
"Although seizures are initially triggered by hyperactive somatosensory cortical neurons, the majority of neuronal populations are deactivated rather than activated during the seizure, resulting in an overall decrease in neuronal activity during SWD (McCafferty et al. 2023)."
What neuronal populations? Cortex? Which neurons in the cortex? Those projecting to the thalamus? What about thalamocortical relay cells? Thalamic gabaergic neurons?
Please check that these issues were corrected.
The issues were addressed as follows:
“Although SWDs are initially triggered by hyperactive somatosensory cortical neurons, neuronal firing rates, especially in majority of frontoparietal cortical and thalamocortical relay neurons, are decreased rather than increased during SWD, resulting in an overall decrease in activity in these neuronal populations (McCafferty et al., 2023). Previous fMRI studies have demonstrated blood volume or BOLD signal decreases in several cortical regions including parietal and occipital cortex, but also, quite surprisingly, increases in subcortical regions such as thalamus, medulla and pons (David et al., 2008; McCafferty et al., 2023).”
Results
After removing problematic animals and sessions, was there sufficient power? There probably wasn't enough to determine sex differences.
After removing problematic sessions, we found statistically significant results (multiple comparison corrected) results in both activation maps, and hemodynamic responses. To determine sex differences, there were not enough animals for statistical findings (p>0.05).
This is not the question. The question is whether there was sufficient power.
A simple power calculation was performed as follows: considering a t-test, a risk alpha of 0.05, a power of 0.8, matched pairs (seizure/control), we can detect an effect size of 0.37 with our 4 animals, considering repeated measurements (4 sessions/animal x 11 seizure/control pairs per session). This is now mentioned in the manuscript.
Table 1 has no statistical comparisons.
Table 1 is purely an illustration of stimulation and seizure occurrence. There is no specific interest to compare stimulation types (in what state of seizure it occurred) as it does not provide any meaningful inferences to the study.
Table 1 could be improved by statistics. More could be said and there would be justification to include it.
We thank the reviewer for the suggestion, but as it is yet unclear to what statistical comparison would be feasible to do, we opt to leave it out.
Statistical activation maps - it is not clear how this was done.
Creation of statistical maps are explained in section 2.5.3.
This section is not clear.
We have added a reference (https://doi.org/10.1002/hbm.460020402) for readers to familiarize themselves with the concept of statistical parametric mapping.
Fig 3 "F-contrast maps." Please explain.
Creation of statistical maps are explained in section 2.5.3.
This section is unclear.
We have added a reference (https://doi.org/10.1002/hbm.460020402) for readers to familiarize themself with the concept of statistical parametric mapping.
Reviewer #3 (Recommendations For The Authors):
Aside from the concerns listed as weaknesses above which were not addressed, most of the more minor comments were addressed by the authors in the resubmission. However, the comment below was not addressed because it is impossible to see any firing rate changes elicited by sensory stimuli (if they are present) due to the scale during seizures. The seizure signals should be removed or accounted for by the model so that any possible sensory stimulus-related signals could be seen, and displayed on the same scale as firing rates without seizures. Prior comment (unaddressed) is repeated below:
Figure 6-figure supplement 1, the scales are very different for many of the plots so they are hard to compare. Especially in the ictal periods (D, E, F) it is hard to see if any changes are happening during ictal stimulation similar to interictal stimulation due to very different scales. The activity related to SWD is so large that it overshadows the rest, and perhaps should be subtracted out.
These two comments were addressed and replied in the previous round of reviews. Regarding the different scales of the plots from Figure 6-figure supplement 1, we point out that all the plots in the same scale are already presented in Figure 6 of the main-text. Regarding the activity related to SWD and sensory stimulation, we remark that the effect of the stimulation should be (and was) evaluated with respect to the ongoing activity. All the results concerning the neuronal responsiveness presented in the paper evaluate the statistical significance of the changes in activity produced by the stimulation with respect to the ongoing activity (during ictal and interictal states respectively). For this reason, all the plots containing the time series of neuronal activity in the simulations include the ongoing activity (with SWD dynamics when present) for proper comparison and relevant analysis.
Additional changes:
In the section 3.2., the sentence: “In addition, responses were observed in the somatosensory cortex during a seizure state.” was removed for clarification purposes as deactivation rather than activation was observed in this brain area during a seizure state.
-
eLife assessment
This study conducted fMRI experiments in an inbred rat model of absence seizures. The results provide new information suggesting reduced brain responsiveness during this type of seizure. The reviewers had divergent opinions but on average thought the study was valuable and the conclusions were solid.
-
Reviewer #1 (Public Review):
In this paper, the effects of two sensory stimuli (visual and somatosensory) on fMRI responsiveness during absence seizures were investigated in GEARS rats with concurrent EEG recordings. SPM analysis of fMRI showed a significant reduction in whole-brain responsiveness during the ictal period compared to the interictal period under both stimuli, and this phenomenon was replicated in a structurally constrained whole-brain computational model of rat brains.
The conclusion of this paper is that whole-brain responsiveness to both sensory stimuli is inhibited and spatially impeded during seizures.
The authors have revised this paper with a lot of detail.
-
Reviewer #2 (Public Review):
Summary:
This study examined the possible effect of spike-wave discharges (SWDs) on the response to visual or somatosensory stimulation using fMRI and EEG. This is a significant topic because SWDs often are called seizures and because there is non-responsiveness at this time, it would be logical that responses to sensory stimulation are reduced. On the other hand, in rodents with SWDs, sensory stimulation (a noise, for example) often terminates the SWD/seizure.
In humans, these periods of SWDs are due to thalamocortical oscillations. A certain percentage of the normal population can have SWDs in response to photic stimulation at specific frequencies. Other individuals develop SWDs without stimulation. They disrupt consciousness. Individuals have an absent look, or "absence", which is called absence epilepsy.
The authors use a rat model to study the responses to stimulation of the visual or somatosensory systems during and in between SWDs. They report that the response to stimulation is reduced during the SWDs. While some data show this nicely, there is also difficulty knowing the effect of the stimulus, SWD and stimulus + SWD.
The authors also study the hemodynamic response function (HRF) and it is not clear what conclusions can be made from the data. The authors acknowledge this, but it does lessen its significance.
Finally, the authors use a model to analyze the data. This model is novel and while that is a strength, its validation is with a second model rather than empirical data.
Strengths:
Use of fMRI and EEG to study SWDs in rats.
Weaknesses:
The paper has been improved by revisions but there are still parts that are unclear, as described below.
-
Reviewer #3 (Public Review):
Summary:
This is an interesting paper investigating fMRI changes during sensory (visual, tactile) stimulation and absence seizures in the GAERS model. The results are potentially important for the field and do suggest that sensory stimulation may not activate brain regions normally during absence seizures. However the findings are limited by substantial methodological issues that do not enable fMRI signals related to absence seizures to be fully disentangled from fMRI signals related to the sensory stimuli.
Strengths:
Investigating fMRI brain responses to sensory stimuli during absence seizures in an animal model is a novel approach with potential to yield important insights.
Use of an awake, habituated model is a valid and potentially powerful approach.
The major difficulty with interpreting the results of …
Reviewer #3 (Public Review):
Summary:
This is an interesting paper investigating fMRI changes during sensory (visual, tactile) stimulation and absence seizures in the GAERS model. The results are potentially important for the field and do suggest that sensory stimulation may not activate brain regions normally during absence seizures. However the findings are limited by substantial methodological issues that do not enable fMRI signals related to absence seizures to be fully disentangled from fMRI signals related to the sensory stimuli.
Strengths:
Investigating fMRI brain responses to sensory stimuli during absence seizures in an animal model is a novel approach with potential to yield important insights.
Use of an awake, habituated model is a valid and potentially powerful approach.
The major difficulty with interpreting the results of this study is that the duration of the visual and tactile stimuli were 6 seconds, which is very close to the mean seizure duration per Table 1. Therefore the HRF model looking at fMRI responses to visual or auditory stimuli occurring during seizures was simultaneously weighting both seizure activity and the sensory (visual or auditory) stimuli over the same time intervals on average. The resulting maps and time courses claiming to show fMRI changes from visual or auditory stimulation during seizures will therefore in reality contain some mix of both sensory stimulation-related signals and seizure-related signals. The main claim that the sensory stimuli do not elicit the same activations during seizures as they do in the interictal period may still be true. However the attempts to localize these differences in space or time will be contaminated by the seizure related signals.
In their repeated responses to this comment the authors have stated that some seizures had longer than average duration, and that they have attempted to model the effects of both seizures and sensory stimulation. However these factors do not mitigate the concern because the mean duration of seizures and sensory stimulation remain nearly identical, and the models used therefore will not be able to effectively separate signals related to seizures and related to sensory stimulation. Hemodynamic models can never in reality represent underlying signals in an orthogonal manner, and are only indirectly related to neural activity.
The only way to truly address the important weakness of this study would be to repeat the experiments using stimulus durations that do not match mean seizure duration, e.g. with much shorter duration stimuli.
The authors have clarified and improved the figure images and their description in the text based on previous specific comments. However, the main weakness in the results remains as summarized above.
Minor comments:
Aside from the concerns listed as weaknesses above which were not addressed, most of the more minor comments were addressed by the authors in the resubmissions. However, the comment made twice previously regarding Figure 6-figure supplement 1 was not addressed. It remains impossible to see any firing rate changes elicited by sensory stimuli during the ictal period in parts E and F of the figure vs. parts B and C (interictal), due to the very different scales used. The seizure signals should be removed or accounted for by the model so that any possible sensory stimulus-related signals could be seen, and/or displayed on the same scale as firing rates without seizures. The authors have simply restated their opinion that it is better to include the SWD dynamics in these figures parts, however this makes the figure wholly unconvincing. It is also concerning that part D (ictal), which is in fact shown on the same scale as part A (interictal), actually shows larger firing rates for both excitatory and inhibitory neurons in visual cortex for sensory stimulation during seizures. This contradicts the claims in the rest of the paper that neural activity and fMRI signals are smaller or are even decreased in visual cortex with sensory stimulation during seizures compared to the interictal period.
-
-
Author Response
Reviewer #1 (Public Review):
Summary:
In this paper, the effects of two sensory stimuli (visual and somatosensory) on fMRI responsiveness during absence seizures were investigated in GEARS rats with concurrent EEG recordings. SPM analysis of fMRI showed a significant reduction in whole-brain responsiveness during the ictal period compared to the interictal period under both stimuli, and this phenomenon was replicated in a structurally constrained whole-brain computational model of rat brains.
The conclusion of this paper is that whole-brain responsiveness to both sensory stimuli is inhibited and spatially impeded during seizures.
I also suggest the manuscript should be written in a way that is more accessible to readers who are less familiar with animal experiments. In addition, the implementation and …
Author Response
Reviewer #1 (Public Review):
Summary:
In this paper, the effects of two sensory stimuli (visual and somatosensory) on fMRI responsiveness during absence seizures were investigated in GEARS rats with concurrent EEG recordings. SPM analysis of fMRI showed a significant reduction in whole-brain responsiveness during the ictal period compared to the interictal period under both stimuli, and this phenomenon was replicated in a structurally constrained whole-brain computational model of rat brains.
The conclusion of this paper is that whole-brain responsiveness to both sensory stimuli is inhibited and spatially impeded during seizures.
I also suggest the manuscript should be written in a way that is more accessible to readers who are less familiar with animal experiments. In addition, the implementation and interpretation of brain simulations need to be more careful and clear.
Several sections of the manuscript were clarified and simplified to be more accessible. Also, implementation and interpretations of brain simulations were modified to be more precise.
Strengths:
- ZTE imaging sequence was selected over traditional EPI sequence as the optimal way to perform fMRI experiments during absence seizures.
- A detailed classification of stimulation periods is achieved based on the relative position in time of the stimulation period with respect to the brain state.
- A whole-brain model embedded with a realistic rat connectome is simulated on the TVB platform to replicate fMRI observations.
We thank the reviewer for indicating the strengths of our manuscript.
Weaknesses:
- The analysis in this paper does not directly answer the scientific question posed by the authors, which is to explore the mechanisms of the reduced brain responsiveness to external stimuli during absence seizures (in terms of altered information processing), but merely characterizes the spatial involvement of such reduced responsiveness. The same holds for the use of mean-field modeling, which merely reproduces experimental results without explaining them mechanistically as what the authors have claimed at the head of the paper.
We agree with the reviewer that the manuscript does not answer specifically about the mechanisms of reduced brain responsiveness. The main scientific question addressed in the manuscript was to compare whole-brain responsiveness of stimulus between ictal and interictal states. The sentence that can lead to misinterpretations in the manuscript abstract: “The mechanism underlying the reduced responsiveness to external stimulus remains unknown.” was therefore modified to the following “The whole-brain spatial and temporal characteristics of reduced responsiveness to external stimulus remains unknown”.
- The implementations of brain simulations need to be more specific.
Contribution:
The contribution of this paper is performing fMRI experiments under a rare condition that could provide fresh knowledge in the imaging field regarding the brain's responsiveness to environmental stimuli during absence seizures.
Reviewer #2 (Public Review):
Summary:
This study examined the possible effect of spike-wave discharges (SWDs) on the response to visual or somatosensory stimulation using fMRI and EEG. This is a significant topic because SWDs often are called seizures and because there is non-responsiveness at this time, it would be logical that responses to sensory stimulation are reduced. On the other hand, in rodents with SWDs, sensory stimulation (a noise, for example) often terminates the SWD/seizure.
In humans, these periods of SWDs are due to thalamocortical oscillations. A certain percentage of the normal population can have SWDs in response to photic stimulation at specific frequencies. Other individuals develop SWDs without stimulation. They disrupt consciousness. Individuals have an absent look, or "absence", which is called absence epilepsy.
The authors use a rat model to study the responses to stimulation of the visual or somatosensory systems during and in between SWDs. They report that the response to stimulation is reduced during the SWDs. While some data show this nicely, the authors also report on lines 396-8 "When comparing statistical responses between both states, significant changes (p<0.05, cluster-) were noticed in somatosensory auditory frontal..., with these regions being less activated in interictal state (see also Figure 4). That statement is at odds with their conclusion.
We thank the reviewer for noting this discrepancy. The statement should have been written vice versa and it has been corrected as: “When comparing statistical responses between both states, significant changes (p<0.05, cluster-level corrected) were noticed in the somatosensory, auditory and frontal cortices: these regions were less activated in ictal than in interictal state (see also Figure 4).”
They also conclude that stimulation slows the pathways activated by the stimulus. I do not see any data proving this. It would require repeated assessments of the pathways in time.
We agree with the reviewer that there are no data showing slowing of the pathways in response to stimulus. However, we are a bit confused about this comment, as to what part in conclusion section it refers to. We did not intentionally claim that stimulation slows the activated pathways in the manuscript.
The authors also study the hemodynamic response function (HRF) and it is not clear what conclusions can be made from the data.
Hemodynamic response functions were studied for two reasons:
To account for possible change in HRF during the detection of activated regions. Indeed, a physiological change in HRF can mask the detection of an activation when the software uses a standard HRF to convolve the design matrix (David et al. 2008).
To characterize the shape and polarity of fMRI activations in brain regions that we noticed to be differently activated between ictal and interictal states and evaluate whether alteration in activation was associated to alteration in hemodynamic.
The observed HRF decreases (rather than increases) in the cortex when stimulation was applied during SWD, was discussed in section 4.4., where we speculated that neuronal suppression caused by SWD can prevent responsiveness. In this case, the decreased HRF could either be a consequence or a cause of the observed neuronal suppression. The assumption that the HRF reduction is causal would be supported by a possible vascular steal effect from other activation regions. However, in the conclusion section we did not state this and therefore the following sentence was added to conclusions: “Moreover, the detected decreases in the cortical HRF when sensory stimulation was applied during spike-and-wave discharges, could play a role in decreased sensory perception. Further studies are required to evaluate whether this HRF change is a cause or a consequence of the reduced neuronal response”.
Finally, the authors use a model to analyze the data. This model is novel and while that is a strength, its validation is unclear. The conclusion is that the modeling supports the conclusions of the study, which is useful.
Details about the model were added.
Strengths:
Use of fMRI and EEG to study SWDs in rats.
Weaknesses:
Several aspects of the Methods and Results are unclear.
Reviewer #3 (Public Review):
Summary:
This is an interesting paper investigating fMRI changes during sensory (visual, tactile) stimulation and absence seizures in the GAERS model. The results are potentially important for the field and do suggest that sensory stimulation may not activate brain regions normally during absence seizures. However the findings are limited by substantial methodological issues that do not enable fMRI signals related to absence seizures to be fully disentangled from fMRI signals related to the sensory stimuli.
Strengths:
Investigating fMRI brain responses to sensory stimuli during absence seizures in an animal model is a novel approach with the potential to yield important insights.
The use of an awake, habituated model is a valid and potentially powerful approach.
Weaknesses:
The major difficulty with interpreting the results of this study is that the duration of the visual and auditory stimuli was 6 seconds, which is very close to the mean seizure duration per Table 1. Therefore the HRF model looking at fMRI responses to visual or auditory stimuli occurring during seizures was simultaneously weighting both seizure activity and the sensory (visual or auditory) stimuli over the same time intervals on average. The resulting maps and time courses claiming to show fMRI changes from visual or auditory stimulation during seizures will therefore in reality contain some mix of both sensory stimulation-related signals and seizure-related signals. The main claim that the sensory stimuli do not elicit the same activations during seizures as they do in the interictal period may still be true. However the attempts to localize these differences in space or time will be contaminated by the seizure-related signals.
The claims that differences were observed for example between visual cortex and superior colliculus signals with visual stim during seizures vs. interictal are unconvincing due to the above.
We understand this concern expressed by the reviewer and agree that seizure-related signals must be considered in the analysis when studying stimulation responses. Therefore, in modelling the responses in the SPM framework, we considered both stimulation and seizure-only states as regressors of interest and used seizure-only responses as nuisance regressors to account for error variance. Thereby, the effects caused by the stimulation should be, in theory, separated as much as possible from the effects caused by the seizure itself. Additionally, the cases where stimulations occurred fully inside a seizure (included in Figure 3, “...stimulation during ictal state) actually had a longer average seizure duration of 45 ± 60 s, therefore being much longer than 6s which an average duration taken from all seizures.
However, we acknowledge that there is a potential that some leftover effects from a seizure are still present, and we have noted this caution in the “Physiologic and methodologic considerations” section: “We note a caution that presented maps and time courses showing fMRI changes from visual or whisker stimulation during seizures may contain mixture of both sensory stimulation-related signals and seizure-related signals. To minimize this contamination, we considered in SPM both stimulation and seizure-only states as regressors of interest and used seizure-only responses as nuisance regressors to account for error variance. Thereby, the effects caused by the seizure itself should be separated as much as possible from the effects caused by stimulation.”
The maps shown in Figure 3 do not show clear changes in the areas claimed to be involved.
We clarified the overall appearance of Figure 3, by enlarging the selected cross sections for better anatomical differentiation and added anterior and posterior directions on all images.
Reviewer #1 (Recommendations For The Authors):
- The implementations of brain simulations need to be more specific: How is the stimulation applied in the mean-field model in terms of its mathematical expression? The state variable of the model is the rate of neuronal firing, but how is it subsequently converted into fMRI responses? How are the statistical plots calculated? How much does this result depend on the model parameter?
Further details and explanations about the model have now been added to the manuscript. The stimulation of a specific region is simulated as an increase in the excitatory input to the specific node. In particular we use a square function for representing the stimulus (see for example panel A in Figure 6–figure supplement 1). As the referee mentions, the model describes the dynamics of the neuronal firing rates. This provides direct information about neuronal activity and responsiveness for which all the statistical analyses of the simulations shown in the paper were performed using the firing rates. For these analyses, no conversion to fMRI was needed. To build the statistical maps, an ANOVA (analysis of variance) test was used. The ANOVA test is originally designed to assess the significance of the change in the mean between two samples, and is calculated via an F-test as the ratio of the variance between and within samples. In our case it allowed us to assess the impact of the stimulation on the ongoing neuronal activity by performing a comparison of the timeseries of the firing rate with and without stimulation (this was performed independently for each state). For the results presented in this paper, the ANOVA analysis was performed using the “f_oneway” function of the scipy.stats. module in python. Regarding the dependence on the model parameter, the main results obtained in our paper are related with the responsiveness of the system under two quantitatively different types of ongoing dynamics: an asynchronous irregular activity (interictal period) and an oscillatory SWD type of dynamics (ictal period). In particular, we show how for the SWD dynamics the activity evoked by the stimulus is overshadowed by the ongoing activity which imposes a strong limitation in the response of the system and the propagation of the stimulus. In this sense, the main results of the simulations are very general, and no significant dependence on specific cellular or network parameters was observed within a physiologically relevant range or should be expected. Nevertheless, we point out that, as mentioned in the text, the key parameter that triggers the transition between the two types of dynamics is the strength of the adaptation current (in particular the strength of the spike-triggered adaptation parameter ‘b’ described in the Supplementary information), which in addition has the capacity of controlling the frequency of the oscillations. In the paper, this parameter was set such that the SWD frequency falls within the range observed in the GAERS (between 7-12Hz). We believe that further analysis around the region of transition between states, in particular from a dynamical point of view, could be of relevance for future work.
- In the abstract, what exactly does "typical information flow in functional pathways" mean and which part of the results does this refer to?
We note that this sentence was overly complicated. By “typical information flow”, we were referring to sensory responsiveness during interictal state. Therefore, we made the following modifications to the abstract: “These results suggest that sensory processing observed during an interictal state can be hindered or even suppressed by the occurrence of an absence seizure, potentially contributing to decreased responsiveness.”
- Figure 4 - Figure Supplement 1 performed an analysis of comparing states between 'when stimulation ended a seizure' and 'stimulation during an ictal period'. The authors should explain more clearly in the manuscript what is the reason and significance of considering the state of 'when stimulation ended a seizure'. And how is a seizure considered to be terminated by stimulation rather than ending spontaneously?
We have now added explanations to the manuscript section 2.5.3 as why this state was also of interest: “The case when stimulation ended a seizure is particularly interesting for studying the spatial and temporal aspects explaining shift from ictal, i.e. non-responsiveness state, to non-ictal, i.e. responsiveness state.” We agree that there is a possibility that seizures ended spontaneously at the same time as stimulus was applied but argue that seizures most probably end due to stimulation, based on results published previously (https://doi.org/10.1016/j.brs.2012.05.009).
- In Section 3.1, some detailed descriptions of methods should be moved to Section 2, e.g. how the spatial and temporal SNR is obtained and the description of bad quality data. Also, I suggest the significance of selecting the optimal MRI sequence be stated earlier in the paper, as Section 3.1 cannot be expected from reading the abstract and introduction.
We moved some technical explanations of SNRs from section 3.1. to section 2.4.1. Significance of the selection of the MRI sequence is also now stated earlier in the introduction section: “For this purpose, the functionality of ZTE sequence was first piloted, and selected over traditional EPI sequence for its lower acoustic noise and reduced magnetic susceptibility artefacts. The selected MRI sequence thus appeared optimal for awake EEG-fMRI measurements.”
Some minor issues:
- How is ROI defined in this paper? What type of atlas is used?
Anatomical ROIs were drawn based on Paxinos and Watson rat brain atlas 7th edition. Region was selected if there were statistically significant activations detected inside that region, based on activation maps. We clarified the definition of ROI as the following: “Anatomical ROIs, based on Paxinos atlas (Paxinos and Watson rat brain atlas 7th edition), were drawn on the brain areas where statistical differences were seen in activation maps.”
- Section 4.3.2, "In addition, some responses were seen in the somatosensory cortex during the seizure state, which may be due to the fact that the linear model used did not completely remove the effect of the seizure itself" What is the reason for the authors to make such comments?
This claim was made because we saw similar trend of responses (deactivation) in F-contrast maps in the somatosensory cortex, when comparing “stimulation during ictal state” maps to "seizure map", leading us to assume that the effect of seizure was still apparent in the maps (even though “seizure only” states were used as nuisance regressors). However, as this claim is highly speculative, we have decided to delete this sentence in the manuscript.
- Abbreviations such as SPM, HRF, CBF, etc. are not defined in the manuscript.
Definitions for these abbreviations were added.
- Supplementary information-AdEx mean-field model, 've and vi', e and i should be subscripted.
Subscripts were added.
Reviewer #2 (Recommendations For The Authors):
Below are more detailed questions and concerns. Many questions are about the Methods, which seem to be written by a specialist. However, there are also questions about the experimental approach and conclusions.
One of the strengths of the study is the use of fMRI and EEG. However, to allow rats to be still in the magnet, isoflurane was used, and then as soon as rats recovered they were imaged. However isoflurane has effects on the brain long after the rats have appeared to wake up. Moreover, to train rats to be still, repetitive isoflurane sessions had to be used. Repetitive isoflurane should have a control of some kind, or be discussed as a limitation.
The repetitive use of isoflurane is indeed an important limiting factor that was not yet discussed in the manuscript. We have added the following sentences to the “Physiologic and methodologic considerations” section:
“As the used awake habituation and imaging protocol didn’t allow us to avoid the usage of isoflurane during the preparation steps, we cannot rule out the possible effect of using repetitive anesthesia on brain function. However, duration (~15 min) and concentration of anesthesia (~1.5%) during these steps were still moderate, whereas extended durations (1-3 h) of either single or repetitive isoflurane exposures have been used in previous studies where long-term effects on brain function have been observed (Long II et al., 2016; Stenroos et al., 2021). Moreover, there was a 5-15 min waiting period between the cessation of anesthesia and initiation of fMRI scan, to avoid the potential short-term effects of isoflurane that has been found to be most prominent during the 5 min after isoflurane cessation (Dvořáková et al., 2022).
An assumption of the study is that interictal periods are normal. However, they may not be. A control is necessary. One also wants to know how often GAERS have spontaneous spike-wave discharges (SWDs), what the authors call seizures. The reason is that the more common the SWDs, the less likely interictal periods are normal. It seems from the Methods that rats were selected if they had frequent seizures so many could be captured in a recording session. Those without frequent seizures were discarded.
A good control would be a normal rat that has spontaneous SWDs, since almost all rat strains have them, especially with age and in males (PMID: 7700522). However, whether they are frequent enough might be a problem. Alternatively, animals could be studied with rare seizures to assess the normal baseline, and compared to interictal states in GAERS.
We appreciate this concern raised by the Reviewer. Even though it would be interesting to study different strains and SWD frequency dependence, the aim of this study was to compare interictal vs ictal states in this specific animal model. We also understand that interictal periods could not necessarily model “normal” state and therefore went through the manuscript again to remove any claims referring to this.
About the mechanisms of SWDs, the authors should update their language which seems imprecise and lacks current citations (starting on line 71):
"Although the origin of absence seizures is not fully understood, current studies on rat models of absence seizures suggest that they arise from atypical excitatory-inhibitory patterns in the barrel field of the somatosensory cortex (Meeren et al. 2002; Polack et al. 2007) and lead to synchronous cortico-thalamic activity (Holmes, Brown, and Tucker 2004)."
Some of the best explanations for SWDs that I know of are from the papers of John Huguenard. His reviews are excellent. They discuss the mechanisms of thalamocortical oscillations.
We have reformatted the sentences discussing the mechanism of SWDs and included the explanations provided by manuscripts from Huguenard and McCafferty et al.: “Although the origin of absence seizures is not fully understood, current studies on rat models of absence seizures suggest that they arise from excitatory drive in the barrel field of the somatosensory cortex (Meeren et al. 2002; Polack et al. 2007, 2009, David et al., 2008) and then propagate to other structures (David et al., 2008) including thalamus, knowing to play an essential role during the ictal state (Huguenard, 2019). Notably, the thalamic subnetwork is believed to play a role in coordinating and spacing SWDs via feedforward inhibition together with burst firing patterns. These lead to the rhythms of neuronal silence and activation periods that are detected in SWD waves and spikes (McCafferty et al., 2018; Huguenard, 2019).”
The following also is not precise:
"Although seizures are initially triggered by hyperactive somatosensory cortical neurons, the majority of neuronal populations are deactivated rather than activated during the seizure, resulting in an overall decrease in neuronal activity during SWD (McCafferty et al. 2023)." What neuronal populations? Cortex? Which neurons in the cortex? Those projecting to the thalamus? What about thalamocortical relay cells? Thalamic gabaergic neurons?
Lines 85-8: "In addition, a previous fMRI study on GAERS, which measured changes in cerebral blood volume, found both deactivated and activated brain areas during seizures (David et al. 2008). Which areas and conditions led to reduced activity? Increased activity? How was it surmised?
"concurrent stimuli and therefore could contribute to the alterations in behavioral responsiveness" - This idea has been raised before by others (Logthetis, Barth). Please discuss these as the background for this study.
The particular section was modified to the following:
“Previous results on GAERS have indicated that, during an absence seizure, hyperactive electrophysiological activity in the somatosensory cortex can contribute to bilateral and regular SWD firing patterns in most parts of the cortex. These patterns propagate to different cortical areas (retrosplenial, visual, motor and secondary sensory), basal ganglia, cerebellum, substantia nigra and thalamus (David et al. 2008; Polack et al. 2007). Although SWDs are initially triggered by hyperactive somatosensory cortical neurons, neuronal firing rates, especially in majority of frontoparietal cortical and thalamocortical relay neurons, are decreased rather than increased during SWD, resulting in an overall decrease in activity in these neuronal populations (McCafferty et al. 2023). Previous fMRI studies have demonstrated blood volume or BOLD signal decreases in several cortical regions including parietal and occipital cortex, but also, quite surprisingly, increases in subcortical regions such as thalamus, medulla and pons (David et al., 2008; McCafferty et al., 2023). In line with these findings, graph-based analyses have shown an increased segregation of cortical networks from the rest of the brain (Wachsmuth et al. 2021). Altogether, alterations in these focal networks in the animal models of epilepsy impairs cognitive capabilities needed to process specific concurrent stimuli during SWD and therefore could contribute to the lack of behavioral responsiveness (Chipaux et al. 2013; Luo et al. 2011; Meeren et al. 2002; Studer et al. 2019), although partial voluntary control in certain stimulation schemes can be still present (Taylor et al., 2017).”
Please discuss the mean-field model more. What are its assumptions? What is its validation? Do other models also provide the same result?
We have now extended the discussion and explanation of the mean-field model, both in the main text and in the Supplementary information. The mean-field model is a statistical tool to estimate the mean activity of large neuronal populations, and as such its main assumptions are centered around the size of the population analyzed and the characteristic times of the neuronal dynamics under study. It has been shown that the formalism is valid for characteristic times of neuronal dynamics with a lower bond in the order of few milliseconds and with population size of in the order thousands of neurons (see El Boustani and Destexhe, Neural computation 2009; and Di Volo et al, Neural computation 2019), with both conditions satisfied in the simulations made for this work. Regarding the validation, the model has been extensively validated and used for simulating different brain states (Di Volo et al. 2009; Goldman et al. 2023), signal propagation in cortical circuits (Zerlaut et al, 2018) and to perform whole-brain simulations (Goldman et al, 2023). The standard validation of the mean-field implies its comparison with the activity obtained from the corresponding spiking neural network. For completeness we show in Author response image 1 an example of the SWD type of dynamics obtained from a spiking neural network together with the one obtained from the mean-field. This figure has been added now to the Supplementary information of the paper. Regarding the extension of the results to other models, we think that the generality of our results is an interesting point from our work. The main results obtained from our simulation are related with the responsiveness of the system during two different type of ongoing activity: in the interictal state there is a significant variation on the ongoing activity evoked by the stimulation that is propagated to other regions, while in the SWD state the evoked activity is overshadowed by the ongoing activity which imposes a strong limit to the responsiveness of the system and the propagation of the signal. In this sense, the results of the simulations are very general and should be extensible to other models. Of course, the advantage of using a model like ours is the capability of reproducing the different states, its applicability to large scale simulations, and the fact that it is built from biologically relevant single-cell models (AdEx).
Author response image 1.
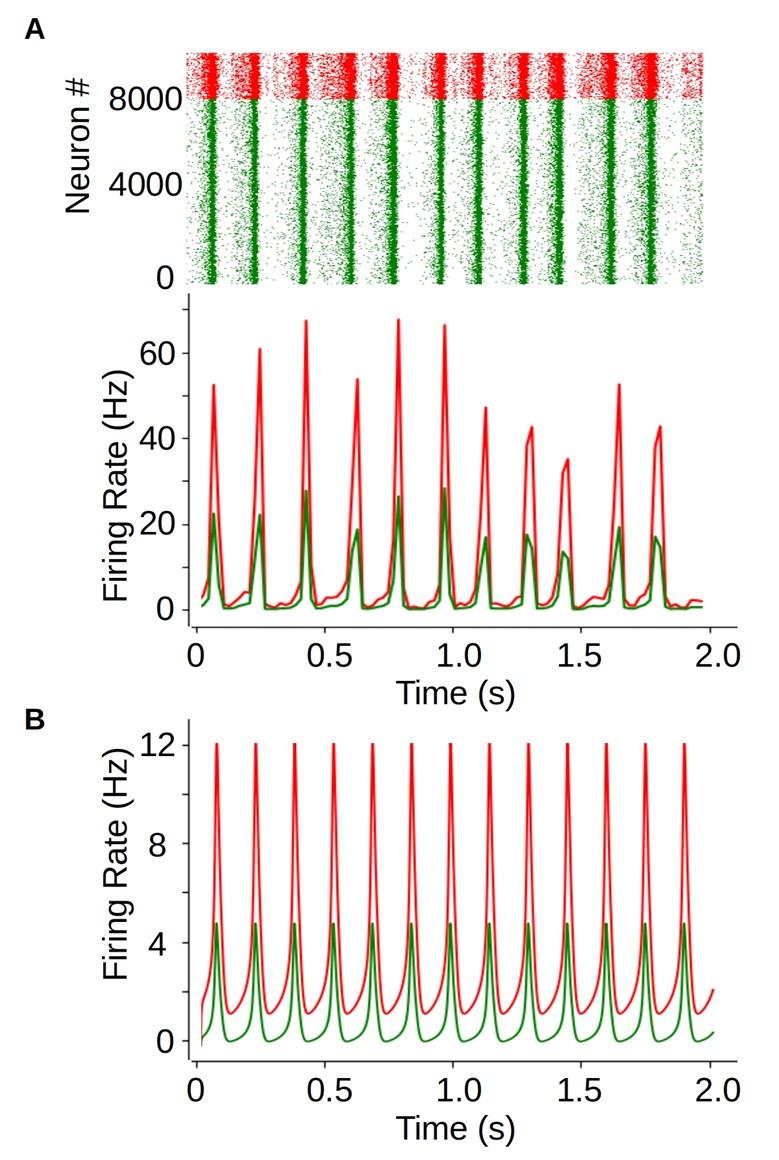
Comparison of the SWD dynamics in the mean-field model and the underlying spiking-neural network of AdEx neurons. A) Raster plot (top) and mean firing rate (bottom) from an SWD type of dynamics obtained from the spiking- network simulations. The network is made of 8000 excitatory neurons and 2000 inhibitory neurons. Neurons in the network are randomly connected with probability p=0.05 for inhibitory-inhibitory and excitatory-inhibitory connections, and p=0.06 for excitatory-excitatory connections. Cellular parameters correspond to the ones used in the mean-field, with spike-triggered adaptation for excitatory neurons set to b=200pA. We show the results for excitatory (green) and inhibitory (red) neurons. B) Mean-firing rate obtained from a single mean-field model. We see that, although the amplitude of oscillations is larger in the spiking-network, the mean-field can correctly capture the general dynamics and frequency of the oscillations.
Line 11: "rats were equally divided by gender." Given n=11, does that mean 5 males and 6 females or the opposite?
Out of 11 animals, 6 were males, and 5 females. This is now mentioned in the manuscript.
What was the type of food?
Type of food was added to the manuscript (Extrudat, vitamin-fortified, irradiated > 25 kGy)
What were the electrodes?
This was provided in the manuscript. Carbon fiber filament was produced by World Precision Instruments. The tips of this filament were spread to brush-like shape to increase the contact surface above the skull.
"low noise zero echo time (ZTE) MRI sequence"- please explain for the non-specialist or provide references.
Reference added.
Lines 148-150: "The length of habituation period was selected based on pilot experiments and was sufficient for rats to be in low-stress state and produce absence seizures inside the magnet." How do the authors know the rats were in a low-stress state?
This claim was based on two factors. At the end of the habituation protocol, the motion of animals was considerably decreased according to previous study using similar restraint/habituation protocol (DOI: 10.3389/fnins.2018.00548). In this study the decreased motion is also correlated with decreased blood corticosterone levels which reduced to baseline levels (indicating low-stress state) after 4 days of habituation. Another factor is when epileptic rodents are continuously recorded for 24h, most SWDs occur during a state of passive wakefulness or drowsiness (Lannes et al. 1988, Coenen et al. 1991) . Either way, as we don’t have a way to provide direct evidence of low-stress state, we modified the sentence to the following:
“The length of habituation period was selected based on pilot experiments to provide low-motion data therefore giving rats a better chance to be in a low-stress state and thus produce absence seizures inside the magnet.”
Lines 150-2: "Respiration rate and motion were monitored during habituation sessions using a pressure pillow and video camera to estimate stress level." What were the criteria for a high stress level?
Criteria for high (or low) stress levels were based mostly on motion levels according to previous study (DOI: 10.1016/s0149-7634(05)80005-3). Still, as we didn’t measure direct measures of stress, we modified the sentence to the following:
“Pressure pillow and video camera were used to estimate physiological state, via breathing rate, and motion level, respectively.”
Lines 152-3: "During the last habituation session, EEG was measured to confirm that the rats produced a sufficient amount of absence seizures (10 or more per session)." If 10 min, the rats would basically be seizing the entire session, leading to doubt about what the interictal state was.
The length of the last habituation session was 60min and the fMRI scan 45min. Given that rats produced ~40-50 seizures during fMRI scan, on average they produced ~1 seizures/min, and one seizure lasting on average of 5-6s, giving ~45s periods for interictal states. 10 or more seizures were used as a threshold to give statistically meaningful findings based on pilot experiments.
Line 153: "Total of 2-5 fMRI experiments were conducted per rat within a 1-3-week period." What was the schedule for each animal? A table would be useful. If it varied, how do the authors know this was justified?
Please see Figure 1–figure supplement 2 for examples of habituation timelines for individual rats:
We found an error when stating 2-5 fMRI experiments, but it should be 3-5 fMRI experiments. This was corrected. We had an aim to acquire 12-14 sessions per stimulation condition and once a sufficient number of sessions were acquired, part of the animals was not used further. Two of the animals that were found to have good quality EEG and produced sufficient amounts of SWDs were kept, and briefly retrained for later second stimulation condition experiments. This was done to replace animals that needed to be excluded in the second stimulation condition due to bad quality EEG or lost implant. Extended use of some animals could theoretically bring slight variation to results but could actually be an advantage as animals were already well trained providing low-motion data.
"Before and after each habituation session, rats were given a treat of sugar water and/or chocolate cereals as positive reinforcement. " How much and what was the concentration of sugar water; chocolate cereal?
Rats were given 3 chocolate cereals and/or 1% sugar water. This was added to the manuscript now.
Line 188: "We relied on pilot calibration of the heated water to maintain the body temperature" Please explain.
Sentence was clarified:
“We relied on pilot calibration of the temperature of heated water circulating inside animal bed to maintain the normal body temperature of ~37 °C"
Line 190: "After manual tuning and matching of the transmit-receive coil, shimming and anatomical imaging" Please explain for the non-specialist.
Sentence was simplified:
“After routine preparation steps in the MRI console were done"
Lines 199-201: "Anatomical imaging was conducted with a T1-FLASH sequence (TR: 530 ms, TE: 4 ms, flip angle 196 18{degree sign}, bandwidth 39,682 kHz, matrix size 128 x 128, 51 slices, field-of-view 32 x 32 mm², resolution 0.25 x 0.25 x 0.5 mm3). fMRI was performed with a 3D ZTE sequence (TR: 0.971 ms, TE: 0 ms, flip angle 4{degree sign}, pulse length 1 µs, bandwidth 150 kHz, oversampling 4, matrix size 60 x 60 x 60, field-of-view 30 x 30 x 60 mm3 , resolution of 0.5 x 0.5 x 1 mm3 , polar under sampling factor 5.64 nr. of projections 2060 resulting to a volume acquisition time of about 2 s). A total of 1350 volumes (45 min) were acquired." Please explain for the non-specialist.
These technical parameters are provided for the sake of repeatability. Section was however clarified as the following and citation was added:
Anatomical imaging was conducted with a T1-FLASH sequence (repetition time: 530 ms, echo time: 4 ms, flip angle 18°, bandwidth 39,682 kHz, matrix size 128 x 128, 51 slices, field-of-view 32 x 32 mm², spatial resolution 0.25 x 0.25 x 0.5 mm3). fMRI was performed with a 3D ZTE sequence (repetition time: 0.971 ms, TE: 0 ms, flip angle 4°, pulse length 1 µs, bandwidth 150 kHz, oversampling 4, matrix size 60 x 60 x 60, field-of-view 30 x 30 x 60 mm3, spatial resolution of 0.5 x 0.5 x 1 mm3, polar under sampling factor 5.64, number of projections 2060 resulting to a volume acquisition time of about 2 s (look Wiesinger & Ho, 2022 for parameter explanations)). A total of 1350 volumes (45 min) were acquired.
"Visual (n=14 sessions, 5 rats) and somatosensory whisker (n=14 sessions, 4 rats)" - Please explain how multiple sessions were averaged for a single rat. Please justify the use of different numbers of sessions per rat.
All the sessions belonging to the same stimulus scheme (multiple sessions per rat) were put at the once as sessions in SPM analysis together with all the stimulus conditions belonging to these sessions. Justifications for using a different number of sessions per rat, were given above.
Lines 205-206: "For the visual stimulation, light pulses (3 Hz, 6 s total length, pulse length 166 ms) were produced by a blue led, and light was guided through two optical fibers to the front of the rat's eyes. What wavelength of blue? Why blue? Is the stimulation strong? Weak?
Wavelength was 470 nm and brightness 7065 mcd with a current of 20mA. Blue was selected as it is in the frequency range that rat can differentiate and this color has been used in previous literature ( https://doi.org/10.1016/j.neuroimage.2020.117542, https://doi.org/10.1016/j.jneumeth.2021.109287)
Line 212: "Stimulation parameters were based on previous rat stimulation fMRI studies to produce robust responses" What is a robust response? One where a lot of visual cortical voxels are activated?
Sentence was corrected as the following:
“Stimulation parameters were based on previous rat stimulation fMRI studies and chosen to activate voxels widely in visual and somatosensory pathways, correspondingly.”
Line 245: "Seizures were confirmed as SWDs if they had a typical regular pattern, had at least double the amplitude compared to baseline signal..." What was the "typical" pattern? What baseline signal was it compared to? Was the baseline measured as an amplitude? Peak to trough?
Sentence was corrected to the following:
“Seizures were confirmed as SWDs if they had a typical regular spike and wave pattern with 7-12 Hz frequency range and had at least double the amplitude compared to baseline signal. All other signals were classified as baseline i.e. signal absent of a distinctive 7-12 Hz frequency power but spread within frequencies from 1 to 90 Hz.”
"using rigid, affine, and SYN registrations" Please explain for the non-specialist.
Corrected as the following:
“using rigid, affine (linear) and SYN (non-linear) registrations”
Line 274-5: "However, there were also intermediate cases where the seizure started or ended during the stimulation block (Figure 1 - Figure Supplement 1). These intermediate cases were modeled as confounds" Why confounds? They could be very interesting because the stimulation may not be affected if timed at the end of the seizure. What was the definition of start and end? Defining the onset and end of seizures is tricky.
We agree that these cases are also highly interesting. Indeed, all the intermediate cases were also analyzed separately but not included in the manuscript (other than the case when stimulation immediately ended a seizure) as no statistical findings were found when comparing these cases to the baseline. E.g. for the case when stimulation was applied towards the end of seizure, it provided weakened responses but still stronger compared to case when stimulation was applied fully during a seizure (indicating some responsiveness after the cessation of seizure). As these intermediate cases led to results with higher variance, we considered them as confounds in the general linear model (i.e. reducing unwanted variance from the results of interests).
Definition of onset and end of seizure can be difficult in some cases. When looking at the signal itself, especially towards the end of seizure the amplitude of SWDs can get weaker and thus the shift from seizure to baseline signal can be more problematic to differentiate. However, when looking at the power spectrum the boundaries were more easily detectable. Thus, in the definitions of onsets and ends of seizure we relied on both the signal and power spectrum (stated in the manuscript).
"in the SPM analysis" Please explain for the non-specialist.
Definition of SPM together with a link to software site was added.
Line 276: "of fMRI data (see 2.5.3.) and thus explained variance that was not accounted for by the main effects of interest. " Please clarify.
Clarified as:
“Intermediate cases, where the seizure started or ended during the stimulation block (Figure 1–figure supplement 1), were considered as confounds of no-interest in the SPM analysis of fMRI data and the explained variance caused by the confounds were reduced from the main effects of interests”
Line 277: "Additionally, a contrast..." What is meant?
This chapter in 2.5.3. was modified as a whole to be more clear.
Line 278-9: "...was given to two cases: i) when stimulation ended a seizure (0-2 s between stimulation start and seizure end)..." Again, how is the seizure onset and end defined?
Look comment above.
Lines 281-2: "Stimulations that did not fully coincide with a seizure were considered as nuisance regressors in the second level analysis." What is meant by nuisance regressor?
Reference to SPM 12 manual was given for technical terms referring to analysis software.
Lines 283-8: "Motion periods were also included as multiple regressors (not convolved with a basis function) to be used as nuisance regressors. Stimulations that coincided with a motion above 0.3% of the voxel size were not considered stimulation inputs. Stimulation and seizure inputs were convolved with "3 gamma distribution basis functions" (i.e. 3rd 285 order gamma) in SPM (option: basis functions, gamma functions, order: 3), to account for temporal and dispersion variations in the hemodynamic response. The choice of 3rd order gamma was based on the expectation that time-to peak and shape of HRFs of seizure could vary across voxels (David et al. 2008)." Please explain the technical terms.
Reference for SPM 12 manual was given for technical terms referring to analysis software, and HRF was defined.
"BAMS rat connectome" - Please explain the technical terms.
Modified as:
“…connection matrix of the rat nervous system (BAMS rat connectome, Bota, Dong, and Swanson 2012).”
Results
After removing problematic animals and sessions, was there sufficient power? There probably wasn't enough to determine sex differences.
After removing problematic sessions, we found statistically significant results (multiple comparison corrected) results in both activation maps, and hemodynamic responses. To determine sex differences, there were not enough animals for statistical findings (p>0.05).
Figure 2 - I don't understand "tSNR" here. What is the point here?
B vs C. Are these different brain areas or the same but SNR was adjusted?
D. Where is FD explained? I think explaining what the parts of the figure show would be helpful.
tSNR, the temporal signal-to-noise ratio, demonstrates the behavior of noise through time. Readers who are planning to mimic the used awake fMRI protocol together with the single loop coil, might be interested on data quality aspect, and ability for the coil to capture signal from noise, as it is one of the most important factors in fMRI designs where small signal changes have to be distinguished from the background noise.
B and C illustrate the same brain area, but B was acquired with high resolution anatomical scanning (T1 FLASH), and C was acquired with low resolution ZTE scanning. We clarified the figure legend to the following:
“…spatial signal-to-noise ratios of an illustrative high resolution anatomical T1-FLASH (B), and low resolution ZTE image (C)
FD was explained in section 2.5.1. Some parts of the explanation were clarified: “Framewise displacement (FD) (Figure 2E) was calculated as follows. First, the differential of successive motion parameters (x, y, z translation, roll, pitch, yaw rotation) was calculated. Then absolute value was taken from each parameter and rotational parameters were divided by 5 mm (as estimate of the rat brain radius) to convert degrees to millimeters (Power et al. 2012). Lastly, all the parameters were summed together.”
Table 1 has no statistical comparisons.
Table 1 is purely an illustration of stimulation and seizure occurrence. There is no specific interest to compare stimulation types (in what state of seizure it occurred) as it does not provide any meaningful inferences to the study.
Statistical activation maps - it is not clear how this was done.
Creation of statistical maps are explained in section 2.5.3.
Line 384-5: "In addition, some responses were observed in the somatosensory cortex during a seizure state, probably due to incomplete nuisance removal of the effect of the seizure itself by the linear model used." I don't see why the authors would not suggest that the result is logical given that stimuli should activate the somatosensory cortex.
Sentence was modified as the following:
“In addition, responses were observed in the somatosensory cortex during a seizure state”
Fig 3 "F-contrast maps." Please explain.
Creation of statistical maps are explained in section 2.5.3.
HRF- please define. The ROI selection is unclear - it "was based on statistical differences seen in activation maps." But how were ROIs drawn? Also, why were HRFs examined at the end of seizures?
HRF was defined, and definitions of HRF and ROI were moved from results section 3.3. to method section 2.5.3.
Definition of ROI was clarified:
“Anatomical ROIs, based on Paxinos atlas (Paxinos and Watson rat brain atlas 7th edition), were drawn on the brain areas where statistical differences were seen in activation maps.”
HRFs were estimated additionally at the end of seizure as it was specifically interesting to study brain state shifts from ictal to interictal. This shift was also providing us statistically significant findings in means that brain responses differed from ictal stimulation.
Line 421: "Interestingly, the response amplitude was higher when the stimulation ended a seizure compared to when it did not" Why is this interesting?
Word “interestingly” was changed to “additionally” to avoid any inferences in the results section.
Line 427: "Notably, HRFs amplitudes were both negatively and positively signed during the ictal 427 state, depending on the brain region." Why is this notable?
Word “notably” was removed to avoid any inferences in the results section.
Please explain the legends of Figures 4 and 6 more clearly.
Figure 4, and figure 4 – figure supplement 1, legends were clarified:
“HRFs was calculated in selected ROI, belonging to visual or somatosensory area, by multiplying gamma basis functions (Figure 1–figure supplement 1, B) with their corresponding average beta values over a ROI and taking a sum of these values.”
Using the comments above as a guide, please revise the Discussion to be more precise and more clear about what was shown and what can be concluded in light of limitations. Please ensure the literature is cited where appropriate.
Some parts of the discussion and conclusion sections were modified.
Reviewer #3 (Recommendations For The Authors):
Minor comments:
Formatting: fMRI maps in Figures 3 and 5 should be more clearly labeled, indicating anterior and posterior directions on all images, and the cross sections should be enlarged to enable anatomical areas to be more clearly differentiated.
Anterior and posterior directions were added, and cross sections were enlarged.
The Methods section 2.41 and other places in the text, and Figure 2 - Figure Supplement 1 say that there was less artifact on the EEG with ZTA than with GE-EPI. However the EEG shown in Figure 2 - Figure Supplement 1 Part C shows much more artifact in the left (ZTE) trace than the right (GE-EPI) trace. This apparent contradiction should be resolved.
The figure was actually demonstrating the relative change to the signal when MRI sequences were on, and by this standard, the ZTE produced both less amplitude and frequency changes than EPI. In the example figure, the baseline fluctuations in the EEG trace in the left were higher in amplitude than in the right, and this could potentially lead to misconception of ZTE producing more noise. Figure legend was clarified to highlight relative change:
“ZTE also caused relatively less artificial noise on EEG signal, keeping both amplitude of the signal and frequencies relatively more intact, which improved live detection of absence seizures.”
Figure 2 - Supplement 1, part B horizontal axis should provide units.
Units were added.
Figure 2 - Supplement 1, legend last sentence says arrows mark the beginning of each "sequence." Is this a typo and should this instead say "each seizure"?
Should state “each fMRI sequence” which was corrected.
Line 307, Methods "to reveal brain areas where ictal stimulation provided higher amplitude response than interictal" - should this be reversed, ie weren't the authors analyzing a contrast to determine where interictal signals were higher than ictal signals?
This should be reversed, and was corrected, thank you for noting this.
Figure 6 - Figure Supplement 1, the scales are very different for many of the plots so they are hard to compare. Especially in the ictal periods (D, E, F) it is hard to see if any changes are happening during ictal stimulation similar to interictal stimulation due to very different scales. The activity related to SWD is so large that it overshadows the rest and perhaps should be subtracted out.
We point out that Figure 6 - Figure Supplement 1 reproduces with a higher level of detail the results shown of Figure 6 from the main text, where all signals are plotted in the same scale. The difference between scales used in this figure is intended, and its purpose is to show and highlight the large differences observed on the ongoing activity and the evoked response between the two states (ictal and interictal). In interictal periods the ongoing activity is characterized by fluctuations around a baseline level whose variance is highly affected by the application of the stimulus. On the contrary, ictal periods are characterized by large oscillations, with periods of high and synchronized activity followed by periods of nearly no activity, where the effect of the stimulus on the dynamics is overshadowed by the ongoing dynamics (both from local and from afferent nodes) as the referee mentions, and which imposes a strong limit to the responsiveness of the system and the propagation of the signal.
-
eLife assessment
This valuable work performed fMRI experiments in a rodent model of absence seizures. The results provide new information regarding the brain's responsiveness to environmental stimuli during absence seizures. The authors suggest reduced responsiveness occurs during this type of seizure, and the evidence leading to the conclusion is solid, although reviewers had divergent opinions.
-
Reviewer #1 (Public Review):
In this paper, the effects of two sensory stimuli (visual and somatosensory) on fMRI responsiveness during absence seizures were investigated in GEARS rats with concurrent EEG recordings. SPM analysis of fMRI showed a significant reduction in whole-brain responsiveness during the ictal period compared to the interictal period under both stimuli, and this phenomenon was replicated in a structurally constrained whole-brain computational model of rat brains.
The conclusion of this paper is that whole-brain responsiveness to both sensory stimuli is inhibited and spatially impeded during seizures.
-
Reviewer #2 (Public Review):
Summary:
This study examined the possible affect of spike-wave discharges (SWDs) on the response to visual or somatosensory stimulation using fMRI and EEG. This is a significant topic because SWDs often are called seizures and because there is non-responsiveness at this time, it would be logical that responses to sensory stimulation are reduced. On the other hand, in rodents with SWDs, sensory stimulation (a noise, for example) often terminates the SWD/seizure.In humans, these periods of SWDs are due to thalamocortical oscillations. A certain percentage of the normal population can have SWDs in response to photic stimulation at specific frequencies. Other individuals develop SWDs without stimulation. They disrupt consciousness. Individuals have an absent look, or "absence", which is called absence epilepsy.
The authors use a rat model to study the responses to stimulation of the visual or somatosensory systems during and in between SWDs. They report that the response to stimulation is reduced during the SWDs. While some data show this nicely, the authors also report on lines 396-8 "When comparing statistical responses between both states, significant changes (p<0.05, cluster-) were noticed in somatosensory auditory frontal..., with these regions being less activated in interictal state (see also Figure 4). That statement is at odds with their conclusion. I do not see that this issue was addressed.
They also conclude that stimulation slows the pathways activated by the stimulus. I do not see any data proving this. It would require repeated assessments of the pathways in time. This issue was not addressed.
The authors also study the hemodynamic response function (HRF) and it is not clear what conclusions can be made from the data. This is still an issue. No conclusions appear to be possible to make.
Finally, the authors use a model to analyze the data. This model is novel and while that is a strength, its validation is unclear. The authors did not add any validation of their model.
Strengths:
Use of fMRI and EEG to study SWDs in rats.Weaknesses:
Several aspects of the Methods and Results were improved but some are still are unclear. -
Reviewer #3 (Public Review):
Summary:
This is an interesting paper investigating fMRI changes during sensory (visual, tactile) stimulation and absence seizures in the GAERS model. The results are potentially important for the field and do suggest that sensory stimulation may not activate brain regions normally during absence seizures. But the findings are limited by substantial methodological issues that do not enable fMRI signals related to absence seizures to be fully disentangled from fMRI signals related to the sensory stimuli.Strengths:
Investigating fMRI brain responses to sensory stimuli during absence seizures in an animal model is a novel approach with potential to yield important insights.
Use of an awake, habituated model is a valid and potentially powerful approach.
Weaknesses:
The major difficulty with interpreting the …
Reviewer #3 (Public Review):
Summary:
This is an interesting paper investigating fMRI changes during sensory (visual, tactile) stimulation and absence seizures in the GAERS model. The results are potentially important for the field and do suggest that sensory stimulation may not activate brain regions normally during absence seizures. But the findings are limited by substantial methodological issues that do not enable fMRI signals related to absence seizures to be fully disentangled from fMRI signals related to the sensory stimuli.Strengths:
Investigating fMRI brain responses to sensory stimuli during absence seizures in an animal model is a novel approach with potential to yield important insights.
Use of an awake, habituated model is a valid and potentially powerful approach.
Weaknesses:
The major difficulty with interpreting the results of this study is that the duration of the visual and tactile stimuli were 6 seconds, which is very close to the mean seizure duration per Table 1. Therefore the HRF model looking at fMRI responses to visual or auditory stimuli occurring during seizures was simultaneously weighting both seizure activity and the sensory (visual or auditory) stimuli over the same time intervals on average. The resulting maps and time courses claiming to show fMRI changes from visual or auditory stimulation during seizures will therefore in reality contain some mix of both sensory stimulation-related signals and seizure-related signals. The main claim that the sensory stimuli do not elicit the same activations during seizures as they do in the interictal period may still be true. But the attempts to localize these differences in space or time will be contaminated by the seizure related signals.
In their response to this comment the authors state that some seizures had longer than average duration, and that they attempted to model the effects of both seizures and sensory stimulation. However these factors do not mitigate the concern because the mean duration of seizures and sensory stimulation remain nearly identical, and the models used therefore will not be able to effectively separate signals related to seizures and related to sensory stimulation.
The claims that differences were observed for example between visual cortex and superior colliculus signals with visual stim during seizures vs interictal remain unconvincing due to above.
Maps shown in Figure 3 do not show clear changes in the areas claimed to be involved.
In their response the authors enlarged the cross sections. However there are still discrepancies between the images and the way they are described in the text. For example, in the Results text the authors say that comparing the interictal and ictal states revealed less activation in the somatosensory cortex during the ictal than during the interictal state, yet Figure 3 bottom row left shows greater activation in somatosensory cortex in this contrast.
-
-
eLife assessment
This study used fMRI in an animal that simulates a type of epilepsy to ask if the responsiveness of the brain was altered during a seizure. The results suggest that the brain responsiveness is reduced during the seizures. The significance of the findings is useful and the strength of the evidence is incomplete but could be strengthened after additional experiments.
-
Reviewer #1 (Public Review):
Summary:
In this paper, the effects of two sensory stimuli (visual and somatosensory) on fMRI responsiveness during absence seizures were investigated in GEARS rats with concurrent EEG recordings. SPM analysis of fMRI showed a significant reduction in whole-brain responsiveness during the ictal period compared to the interictal period under both stimuli, and this phenomenon was replicated in a structurally constrained whole-brain computational model of rat brains.The conclusion of this paper is that whole-brain responsiveness to both sensory stimuli is inhibited and spatially impeded during seizures.
I also suggest the manuscript should be written in a way that is more accessible to readers who are less familiar with animal experiments. In addition, the implementation and interpretation of brain simulations …
Reviewer #1 (Public Review):
Summary:
In this paper, the effects of two sensory stimuli (visual and somatosensory) on fMRI responsiveness during absence seizures were investigated in GEARS rats with concurrent EEG recordings. SPM analysis of fMRI showed a significant reduction in whole-brain responsiveness during the ictal period compared to the interictal period under both stimuli, and this phenomenon was replicated in a structurally constrained whole-brain computational model of rat brains.The conclusion of this paper is that whole-brain responsiveness to both sensory stimuli is inhibited and spatially impeded during seizures.
I also suggest the manuscript should be written in a way that is more accessible to readers who are less familiar with animal experiments. In addition, the implementation and interpretation of brain simulations need to be more careful and clear.
Strengths:
1. ZTE imaging sequence was selected over traditional EPI sequence as the optimal way to perform fMRI experiments during absence seizures.2. A detailed classification of stimulation periods is achieved based on the relative position in time of the stimulation period with respect to the brain state.
3. A whole-brain model embedded with a realistic rat connectome is simulated on the TVB platform to replicate fMRI observations.
Weaknesses:
1. The analysis in this paper does not directly answer the scientific question posed by the authors, which is to explore the mechanisms of the reduced brain responsiveness to external stimuli during absence seizures (in terms of altered information processing), but merely characterizes the spatial involvement of such reduced responsiveness. The same holds for the use of mean-field modeling, which merely reproduces experimental results without explaining them mechanistically as what the authors have claimed at the head of the paper.2. The implementations of brain simulations need to be more specific.
Contribution:
The contribution of this paper is performing fMRI experiments under a rare condition that could provide fresh knowledge in the imaging field regarding the brain's responsiveness to environmental stimuli during absence seizures. -
Reviewer #2 (Public Review):
Summary:
This study examined the possible effect of spike-wave discharges (SWDs) on the response to visual or somatosensory stimulation using fMRI and EEG. This is a significant topic because SWDs often are called seizures and because there is non-responsiveness at this time, it would be logical that responses to sensory stimulation are reduced. On the other hand, in rodents with SWDs, sensory stimulation (a noise, for example) often terminates the SWD/seizure.In humans, these periods of SWDs are due to thalamocortical oscillations. A certain percentage of the normal population can have SWDs in response to photic stimulation at specific frequencies. Other individuals develop SWDs without stimulation. They disrupt consciousness. Individuals have an absent look, or "absence", which is called absence epilepsy.
The authors use a rat model to study the responses to stimulation of the visual or somatosensory systems during and in between SWDs. They report that the response to stimulation is reduced during the SWDs. While some data show this nicely, the authors also report on lines 396-8 "When comparing statistical responses between both states, significant changes (p<0.05, cluster-) were noticed in somatosensory auditory frontal..., with these regions being less activated in interictal state (see also Figure 4). That statement is at odds with their conclusion.
They also conclude that stimulation slows the pathways activated by the stimulus. I do not see any data proving this. It would require repeated assessments of the pathways in time.
The authors also study the hemodynamic response function (HRF) and it is not clear what conclusions can be made from the data.
Finally, the authors use a model to analyze the data. This model is novel and while that is a strength, its validation is unclear. The conclusion is that the modeling supports the conclusions of the study, which is useful.
Strengths:
Use of fMRI and EEG to study SWDs in rats.Weaknesses:
Several aspects of the Methods and Results are unclear. -
Reviewer #3 (Public Review):
Summary:
This is an interesting paper investigating fMRI changes during sensory (visual, tactile) stimulation and absence seizures in the GAERS model. The results are potentially important for the field and do suggest that sensory stimulation may not activate brain regions normally during absence seizures. However the findings are limited by substantial methodological issues that do not enable fMRI signals related to absence seizures to be fully disentangled from fMRI signals related to the sensory stimuli.Strengths:
Investigating fMRI brain responses to sensory stimuli during absence seizures in an animal model is a novel approach with the potential to yield important insights.The use of an awake, habituated model is a valid and potentially powerful approach.
Weaknesses:
The major difficulty with …Reviewer #3 (Public Review):
Summary:
This is an interesting paper investigating fMRI changes during sensory (visual, tactile) stimulation and absence seizures in the GAERS model. The results are potentially important for the field and do suggest that sensory stimulation may not activate brain regions normally during absence seizures. However the findings are limited by substantial methodological issues that do not enable fMRI signals related to absence seizures to be fully disentangled from fMRI signals related to the sensory stimuli.Strengths:
Investigating fMRI brain responses to sensory stimuli during absence seizures in an animal model is a novel approach with the potential to yield important insights.The use of an awake, habituated model is a valid and potentially powerful approach.
Weaknesses:
The major difficulty with interpreting the results of this study is that the duration of the visual and auditory stimuli was 6 seconds, which is very close to the mean seizure duration per Table 1. Therefore the HRF model looking at fMRI responses to visual or auditory stimuli occurring during seizures was simultaneously weighting both seizure activity and the sensory (visual or auditory) stimuli over the same time intervals on average. The resulting maps and time courses claiming to show fMRI changes from visual or auditory stimulation during seizures will therefore in reality contain some mix of both sensory stimulation-related signals and seizure-related signals. The main claim that the sensory stimuli do not elicit the same activations during seizures as they do in the interictal period may still be true. However the attempts to localize these differences in space or time will be contaminated by the seizure-related signals.The claims that differences were observed for example between visual cortex and superior colliculus signals with visual stim during seizures vs. interictal are unconvincing due to the above.
The maps shown in Figure 3 do not show clear changes in the areas claimed to be involved.
-
