The deubiquitinase Ubp3/Usp10 constrains glucose-mediated mitochondrial repression via phosphate budgeting
Curation statements for this article:-
Curated by eLife

eLife assessment
This study provides valuable insights into the regulation of metabolic flux between glycolysis and respiration in yeast, particularly focusing on the role of inorganic phosphate. The authors propose a novel mechanism involving Ubp3/Ubp10 that potentially mitigates the Crabtree effect, offering substantial, solid evidence through a variety of well-designed assays. This study could reshape our understanding of metabolic regulation with broad biological contexts.
This article has been Reviewed by the following groups
Discuss this preprint
Start a discussion What are Sciety discussions?Listed in
- Evaluated articles (eLife)
Abstract
Many cells in high glucose repress mitochondrial respiration, as observed in the Crabtree and Warburg effects. Our understanding of biochemical constraints for mitochondrial activation is limited. Using a Saccharomyces cerevisiae screen, we identified the conserved deubiquitinase Ubp3 (Usp10), as necessary for mitochondrial repression. Ubp3 mutants have increased mitochondrial activity despite abundant glucose, along with decreased glycolytic enzymes, and a rewired glucose metabolic network with increased trehalose production. Utilizing ∆ubp3 cells, along with orthogonal approaches, we establish that the high glycolytic flux in glucose continuously consumes free Pi. This restricts mitochondrial access to inorganic phosphate (Pi), and prevents mitochondrial activation. Contrastingly, rewired glucose metabolism with enhanced trehalose production and reduced GAPDH (as in ∆ubp3 cells) restores Pi. This collectively results in increased mitochondrial Pi and derepression, while restricting mitochondrial Pi transport prevents activation. We therefore suggest that glycolytic flux-dependent intracellular Pi budgeting is a key constraint for mitochondrial repression.
Article activity feed
-

-

eLife assessment
This study provides valuable insights into the regulation of metabolic flux between glycolysis and respiration in yeast, particularly focusing on the role of inorganic phosphate. The authors propose a novel mechanism involving Ubp3/Ubp10 that potentially mitigates the Crabtree effect, offering substantial, solid evidence through a variety of well-designed assays. This study could reshape our understanding of metabolic regulation with broad biological contexts.
-
Reviewer #2 (Public Review):
Summary:
Cells cultured in high glucose tend to repress mitochondrial biogenesis and activity, a prevailing phenotype type called Crabtree effect that observed in different cell types and cancer. Many signaling pathways have been put forward to explain this effect. Vengayil et al proposed a new mechanism involved in Ubp3/Ubp10 and phosphate that controls the glucose repression of mitochondria. The central hypothesis is that ∆ubp3 shift the glycolysis to trehalose synthesis, therefore lead to the increase of Pi availability in the cytosol, then mitochondrial received more Pi and therefore the glucose repression is reduced.
Strengths:
The strength is that the authors used an array of different assays to test their hypothesis. Most assays were well-designed and controlled.
Weaknesses:
The author addressed my …
Reviewer #2 (Public Review):
Summary:
Cells cultured in high glucose tend to repress mitochondrial biogenesis and activity, a prevailing phenotype type called Crabtree effect that observed in different cell types and cancer. Many signaling pathways have been put forward to explain this effect. Vengayil et al proposed a new mechanism involved in Ubp3/Ubp10 and phosphate that controls the glucose repression of mitochondria. The central hypothesis is that ∆ubp3 shift the glycolysis to trehalose synthesis, therefore lead to the increase of Pi availability in the cytosol, then mitochondrial received more Pi and therefore the glucose repression is reduced.
Strengths:
The strength is that the authors used an array of different assays to test their hypothesis. Most assays were well-designed and controlled.
Weaknesses:
The author addressed my major concerns.
-
Author response:
The following is the authors’ response to the previous reviews.
Public Reviews:
Reviewer #1 (Public Review):
The study by Vengayil et al. presented a role for Ubp3 for mediating inorganic phosphate (Pi) compartmentalization in cytosol and mitochondria, which regulates metabolic flux between cytosolic glycolysis and mitochondrial processes. Although the exact function of increased Pi in mitochondria is not investigated, findings have valuable implications for understanding the metabolic interplay between glycolysis and respiration under glucose-rich conditions. They showed that UBP3 KO cells regulated decreased glycolytic flux by reducing the key Pi-dependent-glycolytic enzyme abundances, consequently increasing Pi compartmentalization to mitochondria. Increased mitochondria Pi increases oxygen consumption and …
Author response:
The following is the authors’ response to the previous reviews.
Public Reviews:
Reviewer #1 (Public Review):
The study by Vengayil et al. presented a role for Ubp3 for mediating inorganic phosphate (Pi) compartmentalization in cytosol and mitochondria, which regulates metabolic flux between cytosolic glycolysis and mitochondrial processes. Although the exact function of increased Pi in mitochondria is not investigated, findings have valuable implications for understanding the metabolic interplay between glycolysis and respiration under glucose-rich conditions. They showed that UBP3 KO cells regulated decreased glycolytic flux by reducing the key Pi-dependent-glycolytic enzyme abundances, consequently increasing Pi compartmentalization to mitochondria. Increased mitochondria Pi increases oxygen consumption and mitochondrial membrane potential, indicative of increased oxidative phosphorylation. In conclusion, the authors reported that the Pi utilization by cytosolic glycolytic enzymes is a key process for mitochondrial repression under glucose conditions.
Comments on revised version:
This reviewer appreciates the author's responses addressing some of the concerns.
(1) However, the concern of reproducibility and experimental methods applied to the study is still valid, particularly considering that many conclusions were drawn from western blot analysis. The authors used separate gel loading controls for western blot analysis, which is not a valid method. Considering loading and other errors/discrepancies during the transfer phase of the assay, the direct control should be analyzing the membrane after transfer or using an internal control antibody on the same membrane. None of the western blots are indicated with marker sizes, and it isn't very clear how many repeats there are and whether those repeats are biological or technical repeats.
We thank the reviewer for raising this concern. This point requires detailed clarification regarding two key points: the first one regarding the use of Coomassie stained gels over internal ‘housekeeping gene’ antibodies, and the second one regarding the challenges in performing controls for western blots In case of high abundance proteins such as glycolytic enzymes.
(1) In our western blots, we have used Coomassie stained gel as a loading control for all our western blots. This is performed by cutting one half of the gel and using it for transfer followed by blotting and using the other half for Coomassie staining. I.e. This is not two separate gels that are loaded, but the same gel. Practically, this is no different from cutting a membrane to blot with different antibodies. This method is of course valid method for normalizing western blot data, and is used by multiple studies, for the reasons mentioned below. The historical use of a ‘house-keeping’ gene as a loading control for western blotting assumes that the protein levels of these does not change under different conditions. However, this approach has multiple, severe limitations (since a ‘housekeeping gene’ is entirely contextual, and indeed), and therefore it is correct to use total protein as a loading control. This is indeed recommended for use by multiple studies (Collins et al., 2015). Coomassie staining for total protein is far more reliable than using house-keeping genes as a loading control in western blots (Welinder and Ekblad, 2011). A notable example would be GAPDH itself, which is widely used as a loading control in many studies. As is clear from our data in this manuscript, GAPDH levels itself decrease in ubp3Δ cells. Had we used GAPDH as a loading control, we wouldn’t have identified the decrease in glycolytic enzymes in ubp3Δ cells, and this story would have met with a tragic fate very early on in its inception. We have in fact be very careful with these quantitations, and even before loading samples on gels, they are first normalized using a standard protein estimation assay (Bradford), followed by normalized loading, followed by cutting the gel into two parts - one for coomassie staining and protein normalization, and the other for the western blot for the respective proteins. However, in point (2) below, we clarify on why sometimes we have to load a separate gel with normalized protein, which should resolve this point.
(2) Glycolytic enzymes are highly abundant proteins and to achieve a signal in the linear range of western blot, the protein extracts have to be diluted (up to 25 or 50 times). As discussed under point 1, an internal control ‘housekeeping gene’ antibody is not a reliable method to use as loading control. Even if we want to use an antibody for an internal protein as a control, there are not many proteins that are as abundant as metabolic enzymes and because of this simple reason, the sample dilution results in these proteins not getting detected in the western blot since the signal will be below the limit of detection. This leaves using a separate gel loading control as the only easy to perform, reliable option.
We would like to further highlight the fact that the changes in metabolic enzymes and ETC proteins that we observe in the ubp3 mutant by western blot, were also independently observed by large scale untargeted quantitative proteomics study by (Isasa et al., 2015), which we cite extensively in this manuscript. Since an entirelyindependent study, using a completely different (untargeted) method has also shown very similar changes in proteins that we observe (mitochondrial, and glycolytic enzymes), there should be no room for doubt regarding the altered glycolytic enzyme and ETC protein levels that we discover in this study.
None of the western blots are indicated with marker sizes
We have clearly indicated the marker sizes in all our western blots. Separately, raw images of the blots and Coomassie stained gels have been provided with the manuscript raw data, and is therefore easily available for any interested reader.
It isn't very clear how many repeats there are and whether those repeats are biological or technical repeats.
We have already clearly indicated the details of each blot in the figure legends. For example “A representative blot (out of three biological replicates, n=3) and their quantifications are shown. Data represent mean ± SD.” We kindly request the reviewer to thoroughly go through the figure legends for details regarding the western blots, or any other data. We hope this addresses all the reviewer concerns regarding the credibility of our western blot results and the method of using Coomassie stained gels as loading controls in this study.
(2) Concern regarding citing the Ouyang et al. paper is still valid. This paper is an essential implication in phosphate metabolism and is directly related to some of the findings associated with mitochondrial function, along with conflicting results, which should be discussed in the discussion section. As a reviewer, I do not request citing any paper from the authors in general; however, considering some of the conflicting results here, citing and discussing paper from Ouyang et al. will improve the interoperation/value of their findings.
As mentioned in detail in our previous response letter, we do not believe that the study from Ouyang et al., present ‘conflicting results’ of any kind. Nevertheless, in response to the reviewer's suggestion, we have revised the discussion section of our manuscript and added a few points that incorporate the insights from Ouyang et al. These are in the discussion section (“It is important to highlight that our experiments, whether involving Pi supplementation or Pi limitations, maintain the cellular Pi concentration within the millimolar range and are conducted within a short timeframe (~ 1 hour). This differs significantly from Pi starvation studies, where cells are subjected to prolonged and complete Pi deprivation, triggering extensive metabolic adjustments to sustain available Pi pools, such as an increase in mitochondrial membrane potential, independent of respiration”). We trust that this modification will enhance the interested readers' understanding of our study's overarching conclusions.
Reviewer #2 (Public Review):
Summary:
Cells cultured in high glucose tend to repress mitochondrial biogenesis and activity, a prevailing phenotype type called Crabree effect that observed in different cell types and cancer. Many signaling pathways have been put forward to explain this effect. Vengayil et al proposed a new mechanism involved in Ubp3/Ubp10 and phosphate that controls the glucose repression of mitochondria. The central hypothesis is that ∆ubp3 shift the glycolysis to trehalose synthesis, therefore lead to the increase of Pi availability in the cytosol, then mitochondrial received more Pi and therefore the glucose repression is reduced.
Strengths:
The strength is that the authors used an array of different assays to test their hypothesis. Most assays were well designed and controlled.
Weaknesses:
I think the main conclusions are not strongly supported by the current dataset. Here are my comments on authors' response and model.
(1) The authors addressed some of my concerns related to ∆ubp3. But based on the results they observed and discussed, the ∆ubp3 redirect some glycolytic flux to gluconeogenesis while the 0.1% glucose in WT does not. Similarly, the shift of glycolysis to trehalose synthesis is also not relevant to the WT cells cultured in low glucose situation. This should be discussed in the manuscript to make sure readers are not misled to think ∆ubp3 mimic low glucose. It is likely that ∆ubp3 induce proteostasis stress, which is known to activate respiration and trehalose synthesis.
But based on the results they observed and discussed, the ∆ubp3 redirect some glycolytic flux to gluconeogenesis while the 0.1% glucose in WT does not. Similarly, the shift of glycolysis to trehalose synthesis is also not relevant to the WT cells cultured in low glucose situation.
We would like to clarify that we do not observe a redirection of glycolytic flux to gluconeogenesis in ubp3 mutant. What we observe is a rewiring of glycolytic flux into increased trehalose synthesis and PPP, and decreased glycolysis. Also, the shift of glycolysis to trehalose synthesis is relevant to WT cells cultured in low glucose. It is a well-known fact that the trehalose synthesis increases with decrease in media glucose. In case of 0.1% glucose, this increase in trehalose is not due to an increase in gluconeogenesis (since the pathways utilizing alternate carbon sources still remain repressed in 0.1% glucose (Yin et al., 2003)), but by the increase in glycolytic flux towards trehalose. This is also supported by increase in Tps2 protein levels upon decreasing glucose concentration (Shen et al., 2023). We will also note that there are very few studies that actually estimate gluconeogenic flux in cess (and they only rely on steady state measurements). Estimating gluconeogenic flux appropriately is challenging in itself (eg. see Niphadkar et al 2024).
In case of glucose concentrations lower than 0.1%, the shift to trehalose synthesis might not be as relevant. We observe that the glycolysis defective mutant tdh2tdh3 cells does not show an increase in trehalose synthesis (Figure 3-figure supplement 1E). However, in this context, the decrease in the rate of GAPDH catalyzed reaction alone appears to be sufficient to increase the Pi levels (Figure 3F) even without an increase in trehalose. Therefore, there might be differences in the relative contributions of these two arms towards Pi balance, based on whether it is low glucose in the environment, or a mutant such as ubp3Δ that modulates glycolytic flux. In ubp3Δ cells, the combination of low rate of GAPDH catalyzed reaction and high trehalose will happen (based on how glycolytic flux is modulated), vs only the low rate of the GAPDH catalyzed reaction in tdh2tdh3 cells. As an end point the increase in Pi happens in both cases, but this happens via slightly differing outcomes. Also note: in terms of free Pi sources a low-glucose condition (with low glycolytic rate) is very different from a no-glucose, respiratory condition (where cells perform very high gluconeogenesis, at a rate that is an order of magnitude higher than in low glucose). In respiration-reliant conditions such as in ethanol, cells switch to high gluconeogenesis, where there is a large increase in trehalose synthesis as a default (eg see Varahan et al 2019). In this condition, trehalose synthesis could become a major source for Pi (eg see Gupta 2021). This could also support the increased mitochondrial respiration. In an ethanol-only medium, the directionality of the GAPDH reaction is itself reversed (i.e. G-1,3-BP → G-3-P). Therefore, this reaction now becomes an added source of Pi, instead of a net consumer of Pi (see illustration in Figure 3G). Therefore, a very reasonable inference is that a combination of increased trehalose and increased 1,3 BPG to G3P conversion can become a Pi source, supporting increased mitochondrial respiration in a non-glucose, respiratory medium.
We have now clarified these points in the discussion section in the updated version of our manuscript. Lines xxx. We hope that this updated discussion section satisfies the reviewer’s concern regarding how relevant the increase in trehalose synthesis is for altered Pi balance and increased mitochondrial respiration in WT cells.
It is likely that ∆ubp3 induce proteostasis stress, which is known to activate respiration and trehalose synthesis.
Apart from some general changes in metabolism, there are no reports whatsoever that suggest that general proteostasis stress can results in an extensive, precise metabolic rewiring - where there is an increased in respiration, mitochondrial de-repression, precise decrease in two limiting glycolytic enzyme levels, and a precise reduction in glycolytic flux, as observed in the ubp3 mutant. If this was the case, deletion of any deubiquitinase should result in an increase in trehalose and respiration which clearly does not happen (as is already clear from the large screen shown in Figure 1)
However, in response to this query, we performed experiments to assess the extent of proteostasis stress in ubp3 mutants. For this, we have now estimated the changes in global ubiquitination in WT vs ubp3 mutant, and compared this with conditions of moderate proteostasis stress (mild heat shock at 42C/~1hr). These data are now included in the revised manuscript as Figure 1- figure supplement 1J. Notably, our analysis reveals only very minor alteration in global ubiquitination levels in ubp3 mutants compared to WT cells. This is in very stark contrast to limited heat stress, where a clear increase in global ubiquitination can be easily observed. Given these data, we can conclude that there is no significant general proteostatic stress in ubp3 mutants, that could induce substantial metabolic rewiring of such precise nature.
(2) Pi flux: it is known that vacuole can compensate the reduction of Pi in the cytosol. The paper they cited in the response, especially the Van Heerden et al., 2014 showed that the pulse addition of glucose caused transient Pi reduction and then it came back to normal level after 10min or so. If the authors mean the transient change of glycolysis and respiration, they should point that out clearly in the abstract and introduction. If the authors are trying to put out a general model, then the model must be reconsidered.
In Van Heerden et al., the pulse addition of glucose causes transient Pi reduction due to rapid Pi consumption in glycolysis. The phosphate levels came back to normal level because of the glucose flux into trehalose synthesis releasing free Pi. This is the entire crux of the study and this is the reason why tps2 mutants which cannot synthesize trehalose exhibit a growth defect and have decreased Pi levels. As explained in detail in our early response, the cellular Pi levels are maintained by a relative balance of reactions that consume and release Pi and therefore a change in this balance can change Pi as well. Indeed, if this were not the case, the tps2 mutants would simply maintain the Pi levels similar to WT cells by increasing Pi transport from the medium, which is clearly not the case (eg see Gupta 2021).
The cytosol has ~50mM Pi (van Eunen et al., 2010 FEBSJ), while only 1-2mM of glycolysis metabolites, not sure why partial reduction of several glycolysis enzymes will cause significant changes in cytosolic Pi level and make Pi the limiting factor for mitochondrial respiration. In response to this comment, the authors explained the metabolic flux that the rapid, continuous glycolysis will drain the Pi pool even each glycolytic metabolite is only 1-2mM. However, the metabolic flux both consume and release Pi, that's why there is such measurement of overall free Pi concentration amid the active metabolism. One possibility is that the observed cytosolic Pi level changes was caused by the measurement fluctuation.
The measurement fluctuations that we mentioned in our previous response letter was in case of cells grown in high and low glucose, where there are multiple factors such as mitochondrial amount which complicates the Pi measurements. In case of ubp3 mutants which have a similar amount of total mitochondria as that of WT cells, there is minimal fluctuation for Pi measurement. We have done extensive standardization of mitochondrial isolation and Pi measurement in the isolated mitochondria (as explained in detail in the manuscript) to minimize any such fluctuations.
However, the metabolic flux both consume and release Pi, that's why there is such measurement of overall free Pi concentration amid the active metabolism
The reviewer is correct in pointing out that metabolic flux consume and release Pi. However, in glucose grown yeast cells, the rate of glycolysis which is a Pi consuming reaction is higher than any other metabolic pathway. In fact, the glycolytic rate in glucose-grown S. cerevisiae is one of the highest ever observed in any living system. A decrease in glycolysis and an increase in trehalose therefore shifts the balance in Pi utilization and results in increased free Pi in ubp3 cells. For a more detailed theoretical reasoning on the consumption and production of Pi, see Gupta 2021.
Importantly, the authors measured Pi inside mito for ethanol and glucose, but not the cytosolic Pi, which is the key hypothesis in their model. The model here is that the glycolysis competes with mito for free cytosolic Pi, so it needs to inhibit glycolysis to free up cytosolic Pi for mitochondrial import to increase respiration. I don't see measurement of cytosolic Pi upon different conditions, only the total Pi or mito Pi. The fact is that in Fig.3C they saw WT+Pi in the medium increase total free Pi more than the ∆ubc3, while WT decrease mito Pi compared to WT control and ∆ubc3 and therefore decrease basal OCR upon Pi supplement. A simple math of Pitotal = Pi cyto + Pi mito tells us that if WT has more Pitotal (Fig.3C) but less Pi mito (fig.5 supp 1C), then it has higher Pi cyto. This is contradictory to what the authors tried to rationalize. Furthermore, as I pointed out previously, the isolated mitochondria can import more Pi when supplemented, so if there is indeed higher Picyto, then the mito in WT should import more Pi. So, to address these contradictory points, the authors must measure Pi in the cytosol, which is a critical experiment not done for their model. For example, they hypothesized that adding 2-DG, or ∆ubp3, suppress glycolysis and thus increase the supply of cytosolic Pi for mito to import, but no cytosolic Pi was measured (need absolute value, not the relative fold changes). It is also important to specific how the experiments are done, was the measurement done shortly after adding 2-DG. Given that the cells response to glucose changes/pulses differently in transient vs stable state, the authors are encouraged to specify that.
(1) Importantly, the authors measured Pi inside mito for ethanol and glucose, but not the cytosolic Pi, which is the key hypothesis in their model. The model here is that the glycolysis competes with mito for free cytosolic Pi, so it needs to inhibit glycolysis to free up cytosolic Pi for mitochondrial import to increase respiration. I don't see measurement of cytosolic Pi upon different conditions, only the total Pi or mito Pi.
As clearly described in the manuscript, the key hypothesis that emerges is the role of the availability/accessibility of Pi for the mitochondria, in the context of activity. As discussed in detail in the discussion section, this can come from a combination of available Pi pools in the cytosol and increased transport of this Pi to the mitochondria. While it is true that the decreased glycolysis in ubp3 mutants frees up available Pi pools in the cytosol, measurement of cytosolic Pi in these mutants growing in log phase might not necessarily show an increased cytosolic Pi, if the Pi is being actively transported the the mitochondria at a rate higher that the WT, as indicated by the ~6 fold increase in mitochondrial Pi in ubp3 cells. This would require tools such as intracellular fluorescence based-Pi sensors that could accurately capture temporal changes in cytosolic and mitochondrial Pi following glycolytic inhibition. However, these tools are not available till date for use in yeast and measuring cytosolic Pi following glycolytic inhibition over time using colorimetric Pi assays are extremely difficult.
However, the reviewer does correctly state that we had not included measurement of cytosolic Pi. Since the mitochondrial Pi estimate was itself a very challenging (and critical) experiment we had originally thought that data was sufficient. We have therefore now performed a series of new experiments, where we first enrich the cytosolic fraction (without mitochondrial contamination), and estimated cytosolic Pi amounts in WT and ubp3 cells. Our Pi measurements indicate a cytosolic Pi concentration in the range of ~35 mM, which is similar to the earlier reported values in yeast. We further observe that the cytosolic Pi is about ~25% lower in ubp3 mutants (~25-27 mM) compared to WT cells (Figure 4B). As mentioned earlier, this would be consistent with higher transport of Pi from the cytosol to the mitochondria in these cells. Effectively, ubp3 cells have a total increase in cellular Pi, and with a Pi pool distribution such that there is increased Pi availability in mitochondria (Figure 4B). This further substantiates this hypothesis of an increased Pi allocation to mitochondria in ubp3 mutants. The reason for increased rate of Pi transport to mitochondria is not immediately clear, but could also come from changes in cytosolic pH - a possibility that we suggest in our discussion, and is discussed in a later section of this response letter as well.
(2) The fact is that in Fig.3C they saw WT+Pi in the medium increase total free Pi more than the ∆ubc3, while WT decrease mito Pi compared to WT control and ∆ubc3 and therefore decrease basal OCR upon Pi supplement. A simple math of Pitotal = Pi cyto + Pi mito tells us that if WT has more Pitotal (Fig.3C) but less Pi mito (fig.5 supp 1C), then it has higher Pi cyto. This is contradictory to what the authors tried to rationalize. Furthermore, as I pointed out previously, the isolated mitochondria can import more Pi when supplemented, so if there is indeed higher Picyto, then the mito in WT should import more Pi.
a) “The fact is that in Fig.3C they saw WT+Pi in the medium increase total free Pi more than the ∆ubc3, while WT decrease mito Pi compared to WT control and ∆ubc3 and therefore decrease basal OCR upon Pi supplement. A simple math of Pitotal = Pi cyto + Pi mito tells us that if WT has more Pitotal (Fig.3C) but less Pi mito (fig.5 supp 1C), then it has higher Pi cyto.”
In WT cells supplemented with external Pi (WT+Pi), there is an increased total Pi, but a decreased mitochondrial Pi. As discussed in the discussion section in the manuscript, this could be due to the supplemented Pi not being transported to mitochondria. The reviewer is correct in pointing out that as per simple math this should mean that the cytosolic Pi in WT+Pi should be high. We have now assessed cytosolic Pi upon external Pi supplementation, and this is exactly what we observe in our cytosolic Pi measurements now included in the revised manuscript (Figure 5-figure supplement 5C). There is a higher cytosolic Pi in WT+Pi (~52 mM) compared to WT cells (~35 mM) and ubp3 cells (~27 mM). We have now pointed this out in the discussion section in the revised manuscript “Notably, this increased respiration does not happen upon direct Pi supplementation to highly glycolytic WT cells, where the Pi accumulates in cytosol, without increasing mitochondrial Pi (Figure 5-figure supplement 1C).” We hope that these new data completely addresses the reviewer’s concern regarding the Pi allocations in case of WT+Pi cells.
b) This is contradictory to what the authors tried to rationalize. Furthermore, as I pointed out previously, the isolated mitochondria can import more Pi when supplemented, so if there is indeed higher Picyto, then the mito in WT should import more Pi.
We would like to clarify that the Pi measurements in WT+Pi absolutely do not contradict our hypothesis. Furthermore, nowhere do we claim that an increase in cytosolic Pi will increase mitochondrial Pi!! On the contrary, we explain in detail that supplementing Pi to WT cells (which increases cytosolic Pi) will not increase respiration if the increased Pi is not being transported to mitochondria. This is exactly what happens in WT+Pi, where Pi accumulates in the cytosol but does not result in increased mitochondrial Pi. The reviewer argues that if there is higher cyto Pi, mitochondria should import more Pi. This is true in case of transport via diffusion where the external concentration dictates the direction of metabolite transport, but is fundamentally wrong in case of transport of metabolites where active transporters and additional regulators are involved. This is the entire basis of the idea of metabolic compartmentalisation where cells maintain pools of metabolites in different organelles which regulate the cellular metabolic state. A well-studied example is pyruvate, whose cytosolic concentration is high in glycolytic cells, but it's transport to mitochondria is reduced in glycolysis to maintain cytosolic fermentation. As discussed in the manuscript, a logical explanation for Pi supplementation not increasing respiration and mitochondria Pi is that there might be mechanisms in highly glycolytic cells that restrict the transport of Pi to mitochondria, thereby compartmentalizing Pi in the cytosol. One such possible mechanism is pH (discussed in a later section) and it is possible that there are other mechanisms involved.
In case of isolated mitochondria, Pi supplementation results in an increased respiration simply because it is an in vitro set up where we supplement metabolites such as pyruvate, malate and ADP along with phosphate to ensure that mitochondria is actively respiring and in this case Pi will be consumed since it is being used for ATP synthesis. This is entirely different from an in vivo scenario where cells are glycolytic, and mechanisms to prevent mitochondrial transport of metabolites such as pyruvate and phosphate are active.
c) It is also important to specific how the experiments are done, was the measurement done shortly after adding 2-DG?
Cells were treated with 2-DG for one hour and respiration was measured. We have mentioned these details clearly in the figure legends and methods.
d) The most likely model to me is that, which is also the consensus in the field, is that no matter 2-DG or ∆ubp3, the cells re-wiring metabolism in both cytosol and mitochondria, and it is the total network shift that cause the mitochondrial respiration increase, which requires the increase of mito import of Pi, ADP, O2, and substrates, but not caused/controlled by the Pi that singled out by the authors in their model.
The aim of our study is only to highlight the importance of mitochondrial Pi availability as a critical factor in controlling mitochondrial respiration. Of course this would require sufficient other factors such as ADP, substrates and oxygen. It cannot be otherwise. However, as we point out in the discussion, a major limiting factor might be Pi availability. While the altered glycolysis in ubp3 mutants might control availability of other factors such as pyruvate and ADP, this is not the focus of our study. We would also like to point out that prior studies show that even though cytosolic ADP decreases in the presence of glucose, this does not limit mitochondrial ADP uptake, or decrease respiration, due to the very high affinity of the mitochondrial ADP transporter. This is discussed in our discussion section as well. Further we show that the levels of ETC proteins can be altered by changing Pi levels, which places Pi as a major regulator of respiration. We would like to point out once again that studies in other systems have also highlighted a major role of mitochondrial Pi availability in controlling respiration. These references are included in our manuscript (Scheibye-Knudsen et al., 2009, Seifer et al., 2015). This includes a recent study in T cells that clearly shows increased mitochondrial respiration upon overexpressing mitochondrial Pi transporter SLC25A3 alone (Wu et al., 2023). Our manuscript now in fact provides a contextual explanation of these diverse observations from other cellular systems where mitochondrial Pi transport appears to regulate respiration.
(3) The explanation that cytosolic pH reduction upon glucose depletion/2DG is a mistake. There are a lot of data in the literature showing the opposite. If the authors do think this is true, then need to show the data. Again, it is important to distinguish transient vs stable state for pH changes.
We observe that directly supplementing Pi to WT cells growing in high glucose does not result in higher mitochondrial Pi or increased respiration. However, supplementing Pi to WT cells increases mitochondrial respiration in the presence of glycolytic inhibitor 2-DG. We therefore merely suggest that cytosolic pH could be an additional regulator of mitochondrial Pi transport, since this will be consistent with the differences in mitochondrial Pi transport in highly glycolytic cells, and cells with decreased glycolysis ( such as 2-DG addition and ubp3 mutant). This is because in mitochondria, Pi is co-transported along with protons. Therefore, changes in cytosolic pH (which changes the proton gradient) will control the mitochondrial Pi transport (Hamel et al., 2004). The glycolytic rate is itself a major factor that controls cytosolic pH. The cytosolic pH in highly glycolytic cells is maintained ~7, and decreasing glycolysis results in cytosolic acidification (Orij et al., 2011). Therefore, under conditions of decreased glycolysis (such as loss of Ubp3), cytosolic pH becomes acidic. Since mitochondrial Pi transport depends on the proton gradient, a low cytosolic pH would favour mitochondrial Pi transport. Therefore, under conditions of decreased glycolysis (2DG treatment, or loss of Ubp3), where cytosolic pH would be acidic, increasing cytosolic Pi might indirectly increase mitochondria Pi transport, thereby leading to increased respiration. But we certainly do leave alternate interpretations to the imagination of any reader, and are indeed open to them. These are all exciting future directions this study will enable a contextual interpretation of.
The explanation that cytosolic pH reduction upon glucose depletion/2DG is a mistake.
We have cited two independent studies which suggest that cytosolic pH decreases upon a decrease in glycolysis (Orij et al.,2011 ,Dechant et al., 2010). This control of cytosolic pH by the glycolytic rate has been extensively shown using glycolytic mutants, cells in low glucose and cells grown in the presence of glycolytic inhibitors. According to the reviewer, this is a mistake and
there are a lot of data in the literature showing the opposite.
In our literature review we did not come across any relevant studies that actually show the opposite. If the reviewer still thinks this is a mistake, the reviewer is welcome to include some of the relevant literature that clearly shows the opposite in the comments, with actual measurements of cytosolic pH. Additionally, the possible role of cytosolic pH in this context does not affect the conclusions of our study, and we only include this as a possibility in the discussion. Therefore, this is obviously well beyond the scope of experiments in our current study, and considering the extensive data from multiple studies that shows that cytosolic pH decreases under low glycolysis, there is no relevance to including experiments to address the same in this study. We leave this as a point for an interested reader to think about, and it certainly can nucleate new directions of future study.
-
-
-
Author Response
The following is the authors’ response to the previous reviews.
We thank the reviewers for their reading of the manuscript, and their suggestions. We have extensively addressed all these concerns in the text, and also included several new data and figures in the revised version of the manuscript. We hope that our response and the new experimental data fully address the concerns raised by the reviewers. We include a detailed, pointby-point response to each of the reviewer concerns, pointing to new data and specific changes made in the main manuscript.
Note: Do note that these new data have resulted in a new figure-figure 6, a new supplementary figure -figure 2-figure supplement 2, and an increase in the number of panels in each figure, as well as supplementary figures.
General response comments, highlighting a few aspects …
Author Response
The following is the authors’ response to the previous reviews.
We thank the reviewers for their reading of the manuscript, and their suggestions. We have extensively addressed all these concerns in the text, and also included several new data and figures in the revised version of the manuscript. We hope that our response and the new experimental data fully address the concerns raised by the reviewers. We include a detailed, pointby-point response to each of the reviewer concerns, pointing to new data and specific changes made in the main manuscript.
Note: Do note that these new data have resulted in a new figure-figure 6, a new supplementary figure -figure 2-figure supplement 2, and an increase in the number of panels in each figure, as well as supplementary figures.
General response comments, highlighting a few aspects missed by the reviewers
This manuscript has an enormous amount of data in it. This is understandable, since in part we are proposing an entirely new hypothesis, and way to think about mitochondrial repression, built around substantial circumstantial evidences from diverse literature sources. But to keep the narrative readable and the main idea understandable, a lot of information had to be only very briefly mentioned in the text, and is therefore included as supplemental information. Due to that, it may not always be apparent that this study has set several technical benchmarks. These experiments are extremely challenging to perform, took many iterations to standardize, and in themselves are a first in the field. Yeast cells have the highest known rate of glycolytic flux for any organism. Measuring this glycolytic rate using the formation of intermediates is hard, and all current estimates have been in vitro, and using a stop-flow type set up. In this study, we optimized and directly measured the glycolytic flux using isotope labelled glucose (13C-glucose), which has never been reported before in highly glycolytic cells such as yeast. This is due to the very rapid label saturation (within seconds) after 13C glucose pulse (as is now shown in the figure 2-figure supplement 1). For brevity, this is summarized in this study with sufficient information to reproduce the method, but we will put out a more detailed, associated methodology paper describing several challenges, infrastructure requirements, and resources to be able to carry out these types of experiments using yeast. An added highlight of these experiments with WT and Ubp3 deletion strains is the most direct till date experimental demonstration that glycolytic flux in yeast in high glucose follows zero-order kinetics, and depends entirely on the amounts of the glycolytic enzymes (presumably operating at maximal activity). This nicely complements the recent study by Grigatis 2022 (cited in the discussion), that suggests this possibility.
Separately, this study required the estimation of total inorganic phosphates, as well as mitochondrial pools of phosphates. Till date, there are no studies that have estimated mitochondrial pools of phosphate (for a variety of reasons). In this study, we also experimentally determined the changes in mitochondrial phosphate pools. For this, we had to establish and standardize a rapid mitochondrial isolation method in yeast. Thus, this study provides the first quantitative estimates of mitochondrial Pi amounts (in the context of measured mitochondrial outputs), as shown now in Figure 4. This component on mitochondrial isolation in yeast to assess metabolites may also be explored in future as a methods paper.
Specific responses to the Reviews:
Reviewer #1 (Public Review):
The study by Vengayil et al. presented a role for Ubp3 for mediating inorganic phosphate (Pi) compartmentalization in cytosol and mitochondria, which regulates metabolic flux between cytosolic glycolysis and mitochondrial processes. Although the exact function of increased Pi in mitochondria is not investigated, findings have valuable implications for understanding the metabolic interplay between glycolysis and respiration under glucose-rich conditions. They showed that UBP3 KO cells regulated decreased glycolytic flux by reducing the key Pidependent-glycolytic enzyme abundances, consequently increasing Pi compartmentalization to mitochondria. Increased mitochondria Pi increases oxygen consumption and mitochondrial membrane potential, indicative of increased oxidative phosphorylation. In conclusion, the authors reported that the Pi utilization by cytosolic glycolytic enzymes is a key process for mitochondrial repression under glucose conditions.
(1) However, the main claims are only partially supported by the low number of repeats and utilizing only one strain background, which decreased the overall rigor of the study. The fullpower yeast model could be utilized with testing findings in different backgrounds with increased biological repeats in many assays described in this study. In the yeast model, it has been well established that many phenotypes are genotype/strain dependent (Liti 2019, Gallone 2016, Boekout 2021, etc...). with some strains utilizing mitochondrial respiration even under high glucose conditions (Kaya 2021). It would be conclusive to test whether wild strains with increased respiration under high glucose conditions would also be characterized by increased mitochondrial Pi.
“However, the main claims are only partially supported by the low number of repeats and utilizing only one strain background, which decreased the overall rigor of the study. The full-power yeast model could be utilized with testing findings in different backgrounds with increased biological repeats in many assays described in this study.”
Thank you for the suggestion. We agree that a larger, universal statement cannot be made with data from a single strain, since yeasts do have substantial diversity. In this study, we had originally used a robust, prototrophic industrial strain (CEN.PK background). We have now utilized multiple, diverse strains of S. cerevisiae to test our findings. This includes strains from the common laboratory backgrounds – W303 and BY4742 – which have different auxotrophies, as well as another robust, highly flocculent strain from a prototrophic Σ1278 background. Using all these strains, we now comprehensively find that the role of altered Pi budgeting as a constraint for mitochondrial respiration, and the role of Ubp3 as a regulator of mitochondrial repression is very well conserved. In all tested strains of S. cerevisiae the loss of Ubp3 increases mitochondrial activity (as shown by increased mitochondrial membrane potential and increased Cox2 levels in Figure 6A, B). These data now expand the generality of our findings, and strengthen the manuscript. These results are included in the revised manuscript as a new figure- Figure 6 and the associated text.
Some of the included data in the revised manuscript are shown below:
Author response image 1.
Mitochondrial activity and Cox2 levels in ubp3Δ in different genetic backgrounds
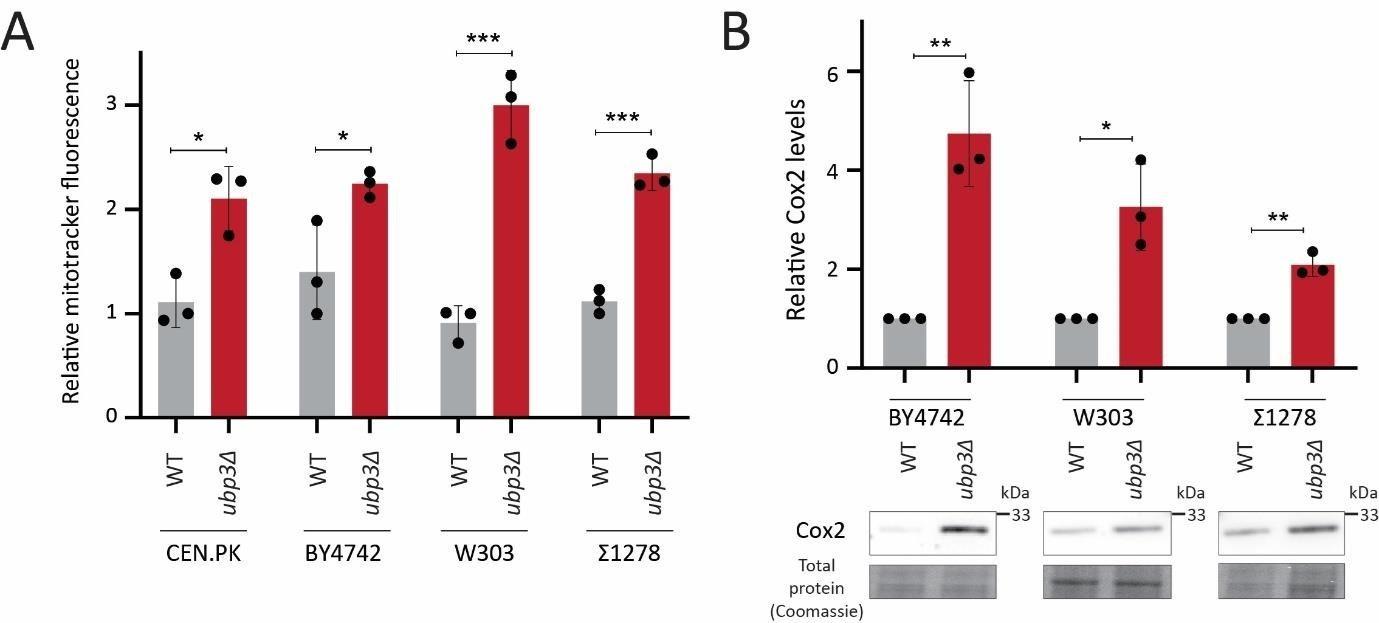
We also used the W303 strain to assess Pi levels, and its role in increasing mitochondrial respiration. We find that the loss of Ubp3 in this genetic background also increases Pi levels and that the increased Pi is necessary for increasing mitochondrial respiration (Figure 6C, D).
Author response image 2.
Basal OCR in WT vs ubp3Δ (W303 strain background) in normal vs low Pi
These experiments collectively have strengthened our findings on the critical role of intracellular Pi budgeting as a general constraint for mitochondrial respiration in high glucose.
“It would be conclusive to test whether wild strains with increased respiration under high glucose conditions would also be characterized by increased mitochondrial Pi.”
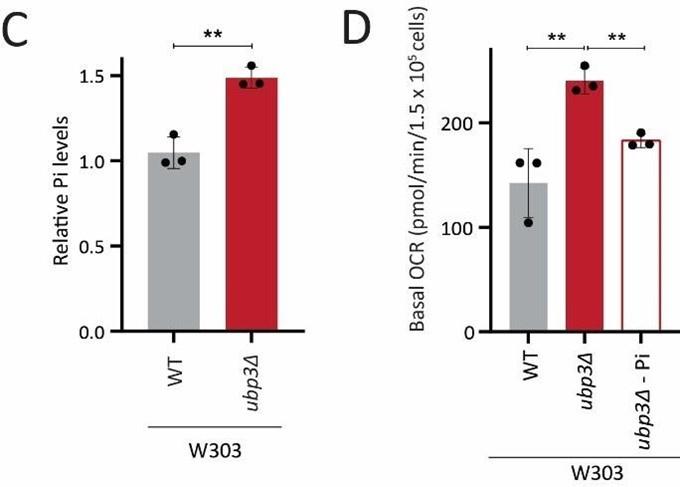
Addressed partially above. Right now the relative basal respiration in glucose across different strains is not well known. We measured mitotracker activity in high glucose in multiple WT strains of S. cerevisiae (W303, Σ1278, S288C and BY4742, compared to the CEN.PK strain). These strains all largely had similar mitotracker potential, except for a slight increase in mitochondrial membrane potential in Σ1278 strain, but not in other strains. We further characterized this using Cox2 protein levels as well as basal OCR, and found that these do not increase. These data is shown below, and is not included in the main text since it does not add any new component to the study.
Author response image 3.
Mitochondrial respiration in different WT strains
We did find this suggestion very interesting though, and are exploring directions for future research based on this suggestion. Since we have now identified a role for intracellular Pi allocation in regulating the Crabtree effect, an interesting direction can be to understand the glucose dependent mitochondrial Pi transport in Crabtree negative yeast strains. We will have to bring in a range of new tools and strains for this, so these experiments are beyond the focus of this current study.
We hope that these new experiments in different genetic backgrounds increases the breadth and generality of our findings, and stimulates new lines of thinking to address how important the role of Pi budgeting as a constraint for mitochondrial repression in high glucose might be.
(2) It is not described whether the drop in glycolytic flux also affects TCA cycle flux. Are there any changes in the pyruvate level? If the TCA cycle is also impaired, what drives increased mitochondrial respiration?
Thank you for pointing this out, and we agree this should be included. We have addressed these concerns in the revised version of the manuscript
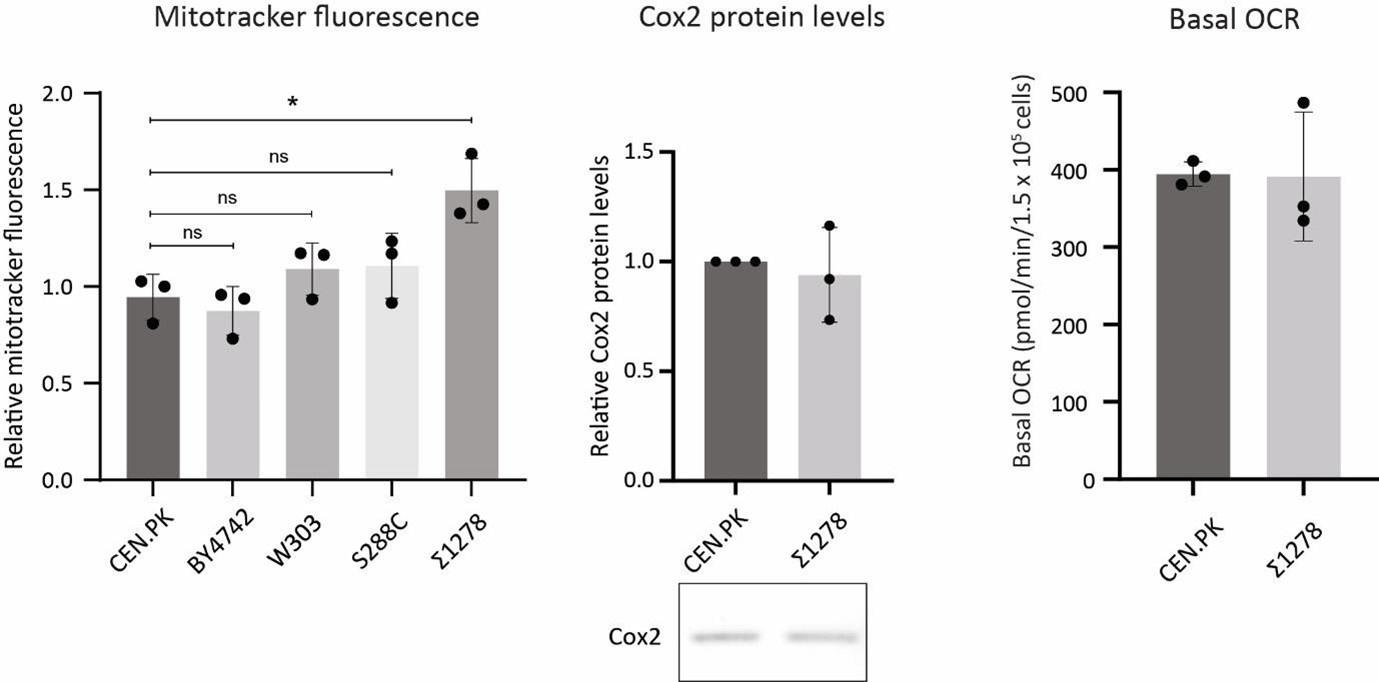
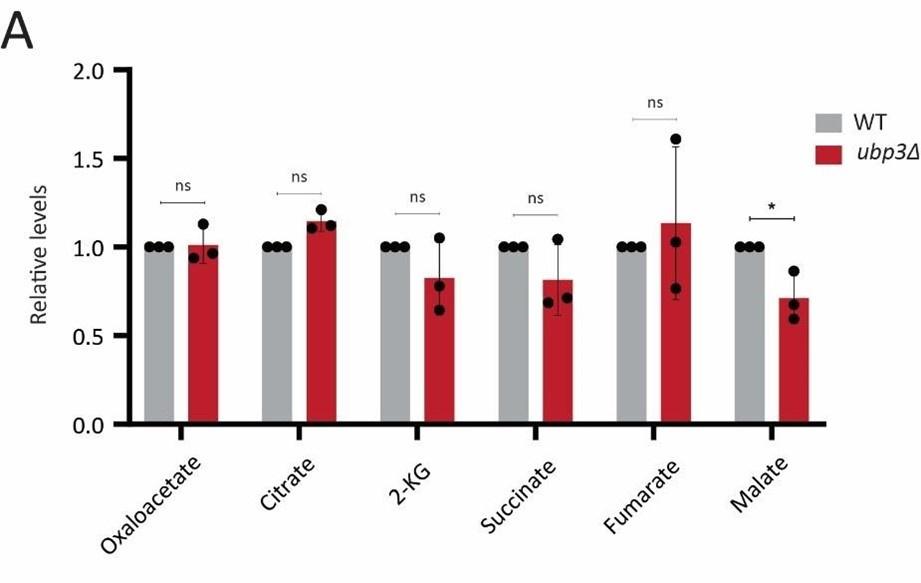
Since glucose derived pyruvate must enter the mitochondrial TCA cycle, one possibility is that a decrease in glycolytic rate could decrease the TCA flux. An alternate possibility is that the cells coincidently increase the pyruvate transport to mitochondria, to thereby maintain the TCA cycle flux comparable to that of WT cells. To test both these possibilities, we first measured the steady state levels of pyruvate and TCA cycle intermediates in WT vs ubp3Δ cells. We do not observe any significant change in the levels of pyruvate, or TCA cycle intermediates (except malate, which showed a significant decrease in ubp3Δ cells). This data is now included in the revised manuscript as Figure 2 – figure supplement 1D and figure supplement 2 A, along with associated text.
Author response image 4.
Pyruvate levels in WT vs ubp3Δ
Author response image 5.
Steady state TCA cycle intermediate levels
Next, in order to address if the TCA cycle flux is impaired in ubp3Δ cells, we also measured the TCA cycle flux in WT vs ubp3Δ cells by pulsing the cells with 13C glucose and tracking 13C label incorporation from glucose into TCA cycle intermediates. This experiment first required substantial standardization, for the time of cell collection and quenching post 13C glucose addition, by measuring the kinetics of 13C incorporation into TCA cycle intermediates at different time points after 13C glucose addition. The standardization of this method is now included in the revised manuscript as Figure 2 – figure supplement 2 C, along with associated text, and is shown below for reference.
Author response image 6.
Kinetics of 13C labelling in TCA cycle intermediates
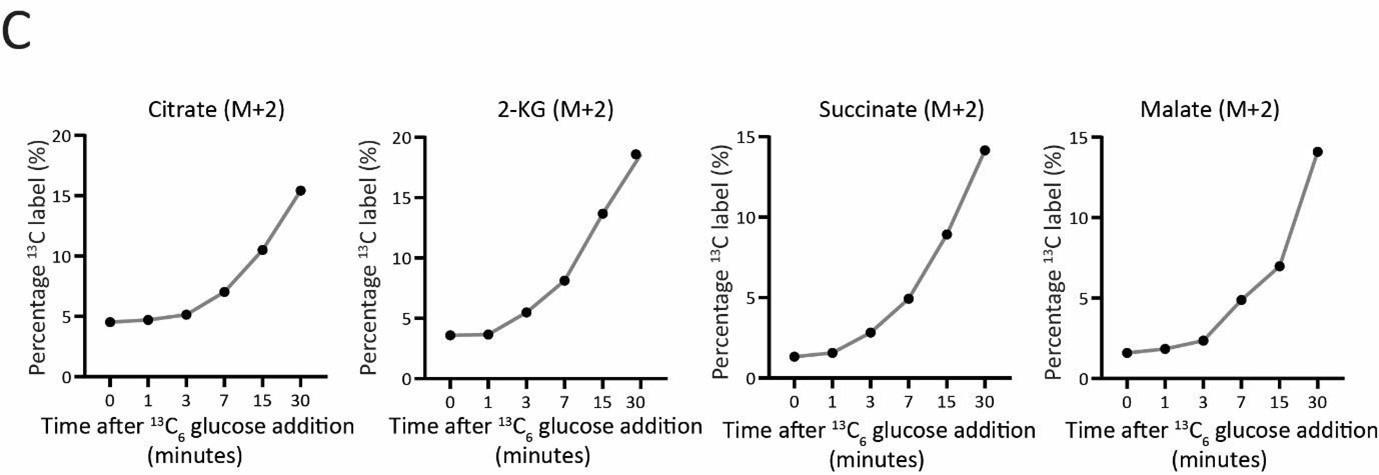
Actual TCA cycle flux results: For measuring the TCA cycle flux, cells were treated with 1% 13C glucose, quenched and samples were collected at 7 mins post glucose addition which is in the linear range of 13C label incorporation (Figure 2- Figure 2 – figure supplement 2 C).
Result: We did not observe any significant changes in the relative 13C label incorporation in TCA cycle intermediates. This data is included in the revised manuscript as Figure 2 – figure supplement 2 D, along with associated text, and is below for your reference.
Author response image 7.
TCA cycle flux
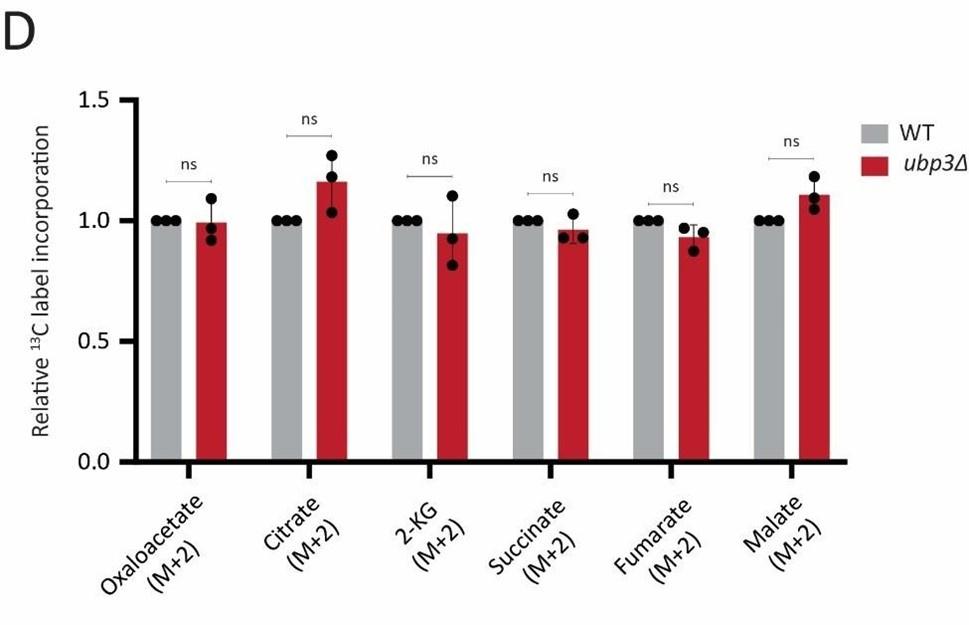
What these data show is that the TCA cycle flux itself is not altered in ubp3Δ. A likely interpretation of this data is that this is due to the increase in the pyruvate transport to mitochondria in ubp3Δ cells, as indicated by the ~10-fold increase in Mpc3 (mitochondrial pyruvate transporter) protein levels (shown in Figure 5-figure supplement 5H), allowing the net same amount of pyruvate into the mitochondria. This increased mitochondrial pyruvate transport could support maintaining the TCA flux in ubp3Δ cells, and supporting the increased respiration. Putting a hierarchy together, the increased respiration in ubp3Δ cells could therefore be primarily due to increased Pi transport, followed by a consequent increase in ETC proteins. We leave it to the readers of this study to make this conclusion.
We hope that we have addressed all concerns that the reviewer has with respect to TCA cycle flux in ubp3Δ cells.
(3) In addition, some of the important literature was also missed in citation and discussion. For example, in a recent study (Ouyang et al., 2022), it was reported that phosphate starvation increases mitochondrial membrane potential independent of respiration in yeast and mammalian cells, and some of the conflicting results were presented in this study.
We are very aware of the recent study by Ouyang et al, which reports that Pi starvation increases mitochondrial membrane potential independent of respiration. However, this study is distinct from the context of our case due to the reasons listed below.
(a) The reviewer may have misinterpreted our low Pi condition as Pi starvation. There is no Pi ‘starvation’ in this study. Here, we cultured ubp3Δ and tdh2Δtdh3Δ cells in a low Pi medium with 1 mM Pi concentration in order to bring down the intracellular free Pi to that of WT levels. These cells are therefore not Pi-starved, but have been manipulated to have the same intracellular Pi levels as that of WT cells, as shown in Figure 4-figure supplement 1D. The Pi concentration in the medium is still in the millimolar range, and the cells are grown in this medium for a short time (~4 hrs) till they reach OD600 ~ 0.8. This is entirely different from the conditions used in Ouyang et al., 2022, where the cells were grown in a Pi-starvation condition with 1-100 micromolar Pi in the medium for a time duration of 6-8 hrs. Since cells respond differentially to changes in Pi concentrations over time (Vardi et al., 2014), the response to low Pi vs Pi starvation will be completely different.
(b) In our study, mitochondrial membrane potential is used as only one of the readouts for mitochondrial activity. Our estimations of mitochondrial respiration are established by including other measurements such as Cox2 protein levels (as an indicator of the ETC) and basal OCR measurements (measuring respiration), all of which provide distinct information. The mitochondrial membrane potential can be regulated independent of mitochondrial respiration state (Liu et al., 2021), using membrane potential alone as a readout to estimate mitochondrial respiration can therefore be limiting in the information it provides. As indicated earlier, mitochondrial membrane potential can change, independent of mitochondrial respiration (Ouyang et al., 2022) and ATP synthesis (Liu et al., 2021). Since the focus of our study is mitochondrial respiration, and not just the change in membrane potential, making conclusions based on potential alone are ambiguous. Most studies in the field have in fact not used the comprehensive array of distinct estimates that we use in this study, and we believe the standards set in this study should become a norm for the field.
(c) The only mutant that is similar to the Ouyang et al study is the Mir1 deletion mutant, which results in acute Pi starvation in mitochondria. In this strain, we find an increase in mitochondrial membrane potential. The data is not included in the manuscript but is shown below.
Author response image 8.
Mitochondrial potential in WT vs mir1Δ
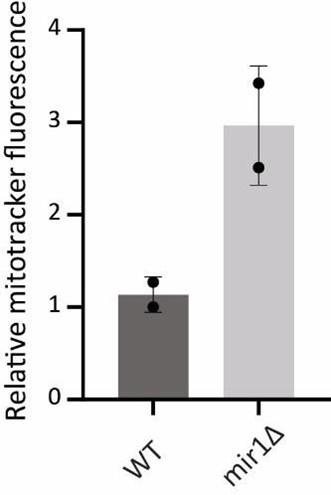
As clear from this data, mitochondrial membrane potential is significantly high in mir1Δ cells. However, the basal OCR and Cox2 protein levels clearly show decreased mitochondrial respiration which is expected in this mutant (Figure 5 A,B). This in fact highlights the limitations of solely relying on mitochondrial membrane potential measurements to draw conclusions, as doing so will lead to a misinterpretation of the actual mitochondrial activity in these cells. We do not wish to highlight limitations in other studies, but hope we make our point clear.
(4) An additional experiment with strains lacking mitochondrial DNA under phosphate-rich and restricted conditions would further strengthen the result.
Strains lacking mitochondrial DNA (Rho0 cells) cannot express the mitochondrially encoded ETC subunit proteins. These strains are therefore incapable of performing mitochondrial respiration. Since Rho0 cells are known to utilize alternate mechanisms to maintain their mitochondrial membrane potential (Liu et al., 2021), using mitotracker fluorescence as a readout of mitochondrial respiration in these strains under different Pi conditions is inconclusive and misleading due to the reasons mentioned in point number 3(b and c). However, since this was a concern raised by the reviewer, we now measured basal OCR in WT and Rho0 strains with Ubp3 deletion under normal vs low Pi medium. As expected, Rho0 cells show extremely low basal OCR values, an entire order of magnitude lower than WT cells. At these very low (barely detectable) levels the deletion of Ubp3 or change in Pi concentration in the medium does not change basal OCR, since these strains are not capable of respiration. We have included this data as Figure 4-figure supplement 1G.
Author response image 9.
Basal OCR in Rho0 cells

(5) Western blot control panels should include entire membrane exposure, and non-cut western blots should be submitted as supplementary.
The non-cut western blot images and the loading controls are now included in the revised manuscript as a supplementary file 2.
(6) In Figure 4, it is shown that Pi addition decreases basal OCR to the WT level. However, the Cox2 level remains significantly higher. This data is confusing as to whether mitochondrial Pi directly regulates respiration or not.
As described in the previous point, the Cox2 levels and the OCR provide distinct pieces of information. In figure 4, we show that culturing ubp3Δ in low Pi significantly decreases both Cox2 protein levels and basal OCR. Since Cox2 protein levels and basal OCR are different readouts for mitochondrial activity, there could be differences in the extent by which Pi availability controls each of these factors. Basal OCR is a direct readout for mitochondrial respiration, and is regulated by multiple factors including ETC protein levels, rate of ATP synthesis, rate of Pi transport etc. In figure 4, we find that culturing ubp3Δ in low Pi decreases basal OCR to WT level. This strongly suggests that high Pi levels are necessary to increase basal OCR in ubp3Δ.
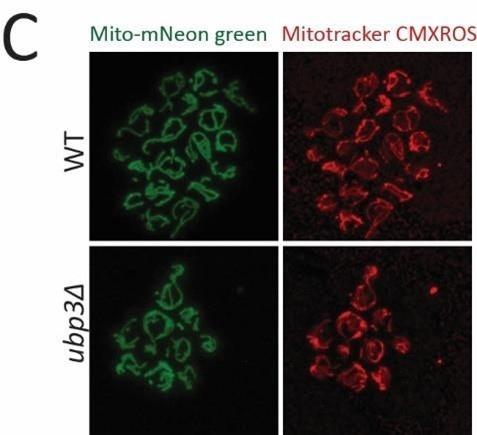
(7) Representative images of Ubx3 KO and wild-type strains stained with CMXRos are missing.
Thank you for noticing this. This data is now included in the revised manuscript as Figure 1figure supplement 1C.
Author response image 10.
(8) Overall, mitochondrial copy number and mtDNA copy number should be analyzed in WT and Ubo3 KO cells as well as Pi-treated and non-treated cells, and basal OCR data should be normalized accordingly. The reported normalization against OD is not appropriate.
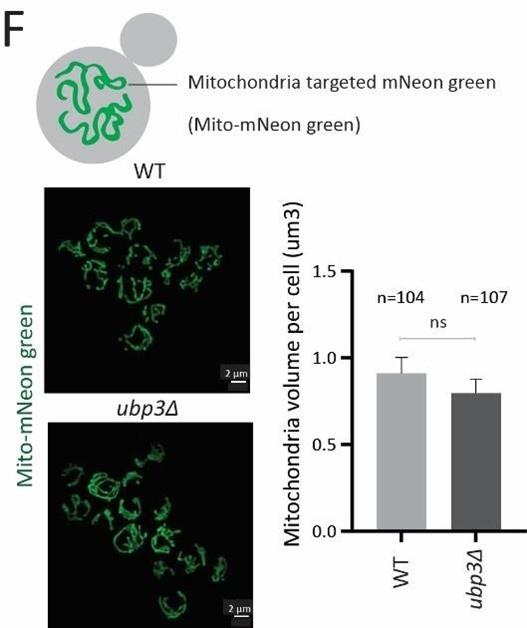
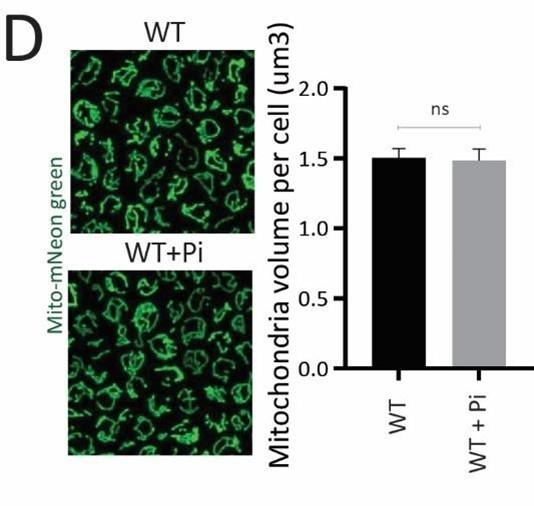
This is a valid concern raised by the reviewer, and something we had extensively considered during the study. To normalize the total mitochondrial amounts in each strain, we always measure the protein levels of the mitochondrial outer membrane protein Tom70. While we had described this in the methods, it may not have been obvious in the text. But this information is included in Figure 1-figure supplement 1G. We did not observe any significant change in Tom70 levels, suggesting that the total mitochondrial amount does not change in ubp3Δ, and we have noted this in the manuscript (results section relevant to Figure 1). As an additional control, to directly measure the mitochondrial amount in these conditions, we have now measured the mitochondrial volume in ubp3Δ cells and WT cells treated with Pi. For this, we used a strain which encodes mitochondria targeted with mNeon green protein (described in Dua et al., JCB, 2023), and which can therefore independently assess total mitochondrial amount. We do not observe any changes in mitochondrial volume or amounts in ubp3Δ cells or WT+Pi, compared to that of WT cells. Therefore, the change in mitochondrial respiration in Ubp3 deletion and Pi addition are not due to changes in total amounts of mitochondria in these conditions. Given all these, the normalization of basal OCR using total cell number is therefore the most appropriate way for normalization. This is also conventionally used for basal OCR normalization in multiple studies.
We have now included these additional data on mitochondrial volumes and amounts in the revised manuscript as Figure1-figure supplement 1F and Figure5-figure supplement 1D, and associated text, and is shown below.
Author response image 11.
Mitochondrial volume in WT vs ubp3Δ cells
Author response image 12.
Mitochondrial volume in WT and WT+Pi
These data collectively address the reviewer’s concerns regarding changes in mitochondrial amounts in all the conditions and strains used in this study.
Reviewer #2 (Public Review):
Summary:
Cells cultured in high glucose tend to repress mitochondrial biogenesis and activity, a prevailing phenotype type called Crabree effect that is observed in different cell types and cancer. Many signaling pathways have been put forward to explain this effect. Vengayil et al proposed a new mechanism involved in Ubp3/Ubp10 and phosphate that controls the glucose repression of mitochondria. The central hypothesis is that ∆ubp3 shifts the glycolysis to trehalose synthesis, therefore leading to the increase of Pi availability in the cytosol, then mitochondria receive more Pi, and therefore the glucose repression is reduced.
Strengths:
The strength is that the authors used an array of different assays to test their hypothesis. Most assays were well-designed and controlled.
Weaknesses:
I think the main conclusions are not strongly supported by the current dataset.
(1) Although the authors discovered ∆ubp3 cells have higher Pi and mitochondrial activity than WT in high glucose, it is not known if WT cultured in different glucose concentration also change Pi that correlate with the mitochondrial activity. The focus of the research on ∆ubp3 is somewhat artificial because ∆ubp3 not only affects glycolysis and mitochondria, but many other cellular pathways are also changed. There is no idea whether culturing cells in low glucose, which derepress the mitochondrial activity, involves Ubp3 or not. Similarly, the shift of glycolysis to trehalose synthesis is also not relevant to the WT cells cultured in a low-glucose situation. “The focus of the research on ∆ubp3 is somewhat artificial because ∆ubp3 not only affects glycolysis and mitochondria, but many other cellular pathways are also changed. There is no idea whether culturing cells in low glucose, which de-repress the mitochondrial activity, involves Ubp3 or not.”
We would like to clarify that the focus of this research is not on Ubp3, or to address mechanistic aspects of how Ubp3 regulates mitochondrial activity, or to identify the targets of Ubp3. That would be an entirely distinct study, with a very different approach.
In this study, while carrying out a screen, we serendipitously found that ubp3Δ cells showed an increase in mitochondrial activity in high glucose. Subsequently, we used this observation, bolstered by diverse orthogonal approaches, to identify a general, systems-level principle that governs mitochondrial repression in high glucose. Through this, we identify a role of phosphate budgeting as a controller of mitochondrial repression in high glucose. In this study, our entire focus has been to use orthogonal approaches, as well as parsimonious interpretations, to establish this new hypothesis as a possibility. We hope this idea, supported by these data, will now enable researchers to pursue other experiments to establish the generality of this phenomenon.
We have not focused our effort in identifying the role of Ubp3, or its regulation upon changes in glucose concentration in this context. That is a very specific, and separate effort, and misses the general point we address here. It is entirely possible that Ubp3 might also regulate mitochondrial activity by additional mechanisms other than mitochondrial Pi availability (such as via the reduction of key glycolytic enzymes at nodes of glycolysis, resulting in reduced glycolytic flux and rerouted glucose metabolism). Had the goal been to identify Ubp3 substrates, it is very likely that we would not have found the role of Pi homeostasis in controlling mitochondrial respiration. This is particularly because the loss of Ubp3 does not result in an acute disruption of glycolysis, unlike say a glycolytic enzyme mutant, which would have resulted in severe effects on growth and overall metabolic state. This would have made it difficult to dissect out finer details of metabolic principles that regulate mitochondrial respiration.
In order to further corroborate our findings, we used the glycolysis defective mutant tdh2Δtdh3Δ cells, where we find a similar change in Pi balance. This complements the key observations made using ubp3Δ cells. Distinctly, we utilized the glycolytic inhibitor 2DG to independently assess the role of mitochondrial Pi transport in regulating respiration. Together, in this study we do not just relying on genetic mutants, but combine the Ubp3 deletion strain with a reduced GAPDH activity strain, and pharmacologic inhibition of glycolysis. Distinctly, we find that mitochondrial Pi transporter levels are repressed under high glucose (Figure 5C, Figure 5-figure supplement 1B). Further, we find that mitochondrial Pi transport is important in increasing mitochondrial respiration upon shift to low glucose and glycolytic inhibition by 2-DG. Therefore, we collectively unravel a more systems level principle that regulates glucose mediated mitochondrial repression, as opposed to a mechanistic study of Ubp3 targets.
Of course, given the conservation of Ubp3, we are very excited to pursue a mechanistic study of Ubp3 targets in future. This is a general challenge for deubiquitinase enzymes, and till date there are very few bona fide substrates known for any deubiquitinase enzyme, from any cellular system (due to challenges in the field that we discuss separately, and have included in the discussion section of this text).
“Similarly, the shift of glycolysis to trehalose synthesis is also not relevant to the WT cells cultured in a low-glucose situation”
The reviewer is correct in pointing out that in low-glucose, the shift to trehalose synthesis might not be as relevant. We observe that the glycolysis defective mutant tdh2Δtdh3Δ cells does not show an increase in trehalose synthesis (Figure 3-figure supplement 1E). However, in this context, the decrease in the rate of GAPDH catalysed reaction alone appears to be sufficient to increase the Pi levels (Figure 3F) even without an increase in trehalose. Therefore, there might be differences in the relative contributions of these two arms towards Pi balance, based on whether it is low glucose in the environment, or a mutant such as ubp3 that modulates glycolytic flux. In ubp3Δ cells, the combination of low rate of GAPDH catalyzed reaction and high trehalose will happen (based on how glycolytic flux is modulated), vs only the low rate of GAPDH catalyzed reaction in tdh2Δtdh3Δ cells. As an end point the increase in Pi happens in both cases, but with slightly differing outcomes. It is also to be noted that in terms of free Pi sources a low-glucose condition (with low glycolytic rate) is very different from a no-glucose, respiratory condition (where cells perform very high gluconeogenesis). In high respiration conditions such as ethanol, cells switch to high gluconeogenesis, where there is a huge increase trehalose synthesis as a default (eg see Varahan et al 2019). In this condition, trehalose synthesis could be a major source for Pi (eg see Gupta 2021), and could support the increased mitochondrial respiration. In an ethanol medium, the directionality of GAPDH reaction is reversed. Therefore, this reaction will also now become an added source of Pi, instead of a consumer of Pi (see illustration in Figure 3G). Therefore, a reasonable interpretation is that a combination of increased trehalose and increased 1,3 BPG to G3P conversion can be a major Pi source to increasing mitochondrial respiration in a non-glucose, respiratory medium.
“it is not known if WT cultured in different glucose concentration also change Pi that correlate with the mitochondrial activity”
This is valid point raised by the reviewer. We have already found that the protein levels of mitochondrial Pi transporter is increased in a non-glucose respiratory (ethanol) medium and a low (0.1%) glucose medium (see Figure 5C, Figure5-figure supplement 1B). In addition, we have tried measuring mitochondrial Pi levels in cells grown in a high glucose medium vs a respiratory, ethanol medium. The results are shown below for the reviewer’s reference. Reviewer response image 3 – Mitochondrial Pi levels in ethanol vs glucose
Author response image 13.
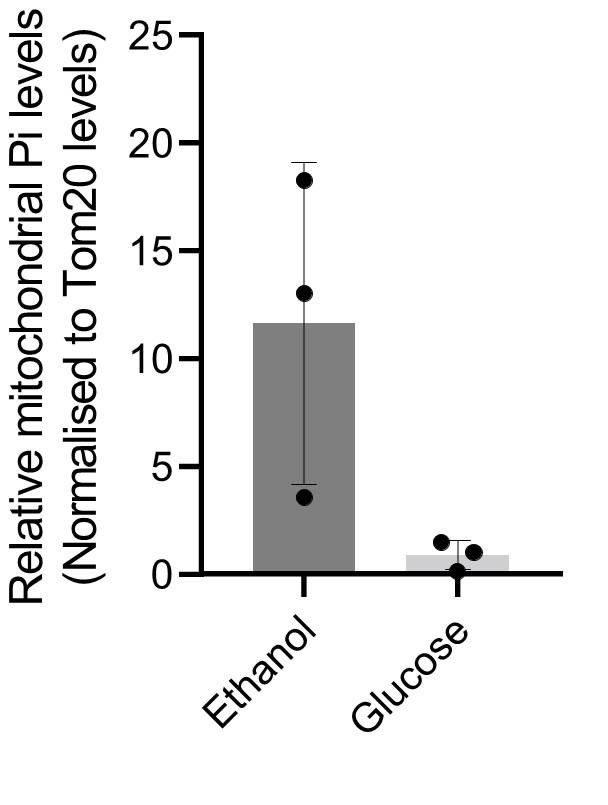
We observe a clear trend where mitochondrial Pi levels are high in cells grown in ethanol medium compared to that of cells grown in high glucose. However, the estimation of Pi, and normalising the Pi levels in isolated mitochondria is extremely difficult in this condition (note that this has never been done before). This is likely due to a rapid rate of conversion of ADP and Pi to ATP (in ethanol) which increases the variation in the estimation of steady state Pi levels, and the high amounts of mitochondria in ethanol grown cells. Since the date shows high variation, we have not included this data in the manuscript, but we are happy to include it here in the response.
Indeed, this study opens up the exciting question of addressing how intracellular Pi allocation is regulated in different conditions of glucose. This can be further extended to Crabtree negative strains such as K. lactis which do not show mitochondrial repression in high glucose. All of these are rich future research programs.
(2) The central hypothesis that Pi is the key constraint behind the glucose repression of mitochondrial biogenesis/activity is supported by the data that limiting Pi will suppress mitochondrial activity increase in these conditions (e.g., ∆ubp3). However, increasing the Pi supply failed to increase mitochondrial activity. The explanation put forward by the authors is that increased Pi supply will increase glycolysis activity, and somehow even reduce the mitochondrial Pi. I cannot understand why only the increased Pi supply in ∆ubp3, but not the increased Pi by medium supplement, can increase mitochondrial activity. The authors said "...that ubp3Δ do not increase mitochondrial Pi by merely increasing the Pi transporters, but rather by increasing available Pi pools". They showed that ∆ubp3 mitochondria had higher Pi but WT cells with medium Pi supplement showed lower Pi, it is hard to understand why the same Pi increase in the cytosol had a different outcome in mitochondrial Pi. Later on, they showed that the isolated mito exposed to higher Pi showed increased activity, so why can't increased Pi in intact cells increase mito activity? Moreover, they first showed that ∆ubp3 had a Mir1 increase in Fig3A, then showed no changes in FigS4G. It is very confusing.
“I cannot understand why only the increased Pi supply in ∆ubp3, but not the increased Pi by medium supplement, can increase mitochondrial activity.”
This is an interesting point, that requires a nuanced explanation, which we try to provide below.
For mitochondrial respiration to increase in the presence of high Pi, the cytosolic Pi has to be transported to the mitochondria sufficiently. In ubp3Δ the increased free Pi (as a consequence of rewired glycolysis) is transported to the mitochondria (Figure 4). This increased mitochondrial Pi can therefore increase mitochondrial respiration in ubp3Δ.
In case of WT+Pi, the externally supplemented Pi cannot further enter mitochondria (as shown in Figure 5-Figure supplement 1C) and is most likely restricted to the cytosol. Because of this inability of the Pi to access mitochondria, the mitochondrial respiration does not increase in WT+Pi (Figure 5-Figure supplement 1E).
The likely reason for this difference in mitochondrial Pi transport in ubp3Δ vs WT+Pi is the relative difference in their glycolytic rate. The glycolytic rate is inherently decreased in ubp3Δ, but not in WT+Pi. To dissect this possibility of glycolytic rate itself contributing to the Pi availability in the mitochondria, we inhibited glycolysis in WT cells (using 2DG), and then supplemented Pi. Compared to cells in the same glucose condition (with 2DG, but without supplementing excess Pi), now the WT+Pi (+2DG) has higher mitochondrial respiration (Figure 5-Figure supplement 1F). This suggests that a combination of low glycolysis and high Pi is required for increasing mitochondrial respiration (as elaborated in the discussion section of the manuscript).
An obvious question that arises out of this observation is how does the change in glycolytic rate regulate mitochondrial Pi transport. One consequence of altering the glycolytic rate is a change in cytosolic pH. This itself will bear on the extent of Pi transport into mitochondria, as discussed in detail below.
In mitochondria, Pi is co-transported along with protons. Therefore, changes in cytosolic pH (which changes the proton gradient) can control the mitochondrial Pi transport (Hamel et al., 2004). Glycolytic rate is a major factor that controls cytosolic pH. The cytosolic pH in highly glycolytic cells is ~7, and decreasing glycolysis results in cytosolic acidification (Orij et al., 2011). Therefore, under conditions of decreased glycolysis (such as loss of Ubp3), cytosolic pH becomes acidic. Since mitochondrial Pi transport is dependent on the proton gradient, a low cytosolic pH would favour mitochondrial Pi transport. Therefore, under conditions of decreased glycolysis (2DG treatment, or loss of Ubp3), where cytosolic pH would be acidic, increasing cytosolic Pi might indirectly increase mitochondria Pi transport, thereby leading to increased respiration.
To explain this and integrate all these points, we have extended a discussion section in this manuscript. We include this section below:
“Supplementing Pi under conditions of low glycolysis (where mitochondrial Pi transport is enhanced), as well as directly supplementing Pi to isolated mitochondria, increases respiration (Figure 5, Figure 5-figure supplement 1). Therefore, in order to derepress mitochondria, a combination of increased Pi along with decreased glycolysis is required. An additional systems-level phenomenon that might regulate Pi transport to the mitochondria is the decrease in cytosolic pH upon decreased glycolysis (60, 61). The cytosolic pH in highly glycolytic cells is ~7, and decreasing glycolysis results in cytosolic acidification (60, 61). Therefore, under conditions of decreased glycolysis (2DG treatment, deletion of Ubp3, and decreased GAPDH activity), cytosolic pH becomes acidic. Since mitochondrial Pi transport itself is dependent on the proton gradient, a low cytosolic pH would favour mitochondrial Pi transport (62). Therefore, under conditions of decreased glycolysis (2DG treatment, or loss of Ubp3, or decreased GAPDH activity), where cytosolic pH would be acidic, increasing cytosolic Pi might indirectly increase mitochondria Pi transport, thereby leading to increased respiration. Alternately, increasing mitochondrial Pi transporter amounts can achieve the same result, as seen by overexpressing Mir1 (Figure 5).”
This possibility of changes in cytosolic pH regulating mitochondrial Pi transport and thereby respiration is a really interesting future research question, and an idea that has not yet been explored till date. This can stimulate new lines of thinking towards finding conserved biochemical principles that control mitochondrial repression in high glucose.
“Moreover, they first showed that ∆ubp3 had a Mir1 increase in Fig3A, then showed no changes in FigS4G. It is very confusing”
increase in Mir1 in ubp3Δ shown in figure 3A comes from the analysis of the proteomics dataset from a previous study (Isasa et al., 2015). Subsequently, we more systematically experimentally assessed Mir1 levels directly, and did not observe an increase in Mir1 (Figure 4figure supplement 1H in revised manuscript). It is entirely possible that in a large-scale study (as in Isasa 2015), some specific proteomic targets might not fully reproduce when tested very specifically (as is described in Handler et al., 2018 and Mehta et al., 2022). We do clearly indicate this in the text, but given the density of information in this study, it is understandable that this point was missed by the reviewer.
(3) Given that there is no degradation difference for these glycolytic enzymes in ∆ubp3, and the authors found transcriptional level changes, suggests an alternative possibility where ∆ubp3 may signal through unknown mechanisms to parallelly regulate both mitochondrial biogenesis and glycolytic enzyme expression. The increase of trehalose synthesis usually happens in cells under proteostasis stress, so it is important to rule out whether ∆ubp3 signals these metabolic changes via proteostasis dysregulation. This echoes my first point that it is unknown whether wild-type cells use a similar mechanism as ∆ubp3 cells to regulate the glucose repression of mitochondria.
We appreciate this point raised by the reviewer, but this again requires some clarification (as made earlier). The goal of this study was to identify systems-level principles that explain mitochondrial repression in high glucose. Although we started by performing a screen to identify proteostatic regulators of mitochondrial activity in high glucose, and identified Ubp3 as a mediator of mitochondrial activity, our approach was to use ubp3Δ cells as a model to understand the metabolic principles that regulate mitochondrial repression. This has been reiterated repeatedly in the manuscript – for example lines 123-124 “We therefore decided to use ubp3Δ cells to start delineating requirements for glucose-mediated mitochondrial repression.” and again in the discussion section – lines 442-460, where we discuss some unique advantages of using ubp3Δ cells to understand a general basis of mitochondrial regulation. To test this hypothesis, we also used orthogonal approaches, as well as other mutants and conditions with defective glycolysis, such as tdh2Δtdh3Δ cells and 2DG treatments. Only with these multiple converging evidences do we infer that there might be a role of the change in Pi balance (due to changes in glycolytic rate) in regulating mitochondrial activity.
We certainly agree that there is great value in identifying the mechanistic details of how Ubp3 regulates mitochondria. But this requires very distinct approaches not pursued in this study. This is not the question that we are addressing in this story. Separately, identifying targets of DUBs is one of the exceptional challenges in biology, since there are currently no straightforward chemicalbiology approaches to do so for this class of proteins. Unlike kinase/phosphatase systems, or even ubiquitin ligases, substrate trapping mutants etc have proven to be abject failures in identifying direct targets of DUBs. A quantitative proteomics study might suggest some proteins/cellular processes regulated by Ubp3. This has been attempted for several DUBs, but rarely have any direct substrates of DUBs every been identified, in any system. A high quality quantitative, descriptive proteome dataset of ubp3Δ cells is already available from a previous study (Isasa et al., 2015), which we cite extensively in this manuscript, and indeed was invaluable for this study. We cannot improve the outstanding quality dataset already available. Interestingly, the findings of this study actually help substantiate our idea of an increased mitochondrial activity and change in Pi homeostasis in ubp3Δ cells. The Isasa et al dataset finds proteins involved in mitochondrial respiration that are high in ubp3Δ cells, and the glycolytic enzymes and PHO regulon proteins are reduced. In our study, using these data references, we were able to conceptually piece together how changes in glycolytic flux can alter Pi balance.
Apart from identifying changes in protein levels, a separate challenge in making sense of this quantitative proteomics data is the difficulty in pinpointing any target of Ubp3 that specifically regulates these processes. A single DUB can have multiple substrates, and this could regulate the cellular metabolic state in a combinatorial manner. This is the essence of all signaling regulators in how they function, and it is therefore important to understand what their systems-level regulation of cell states are (separate from their specific individual substrates). Therefore, identifying the specific target of Ubp3 responsible for this metabolic rewiring can be very challenging. These experiments are well beyond the scope or interest of the current manuscript.
If we had pursued that road in this study, we would not have made any general findings related to Pi balance, nor would this more general hypothesis have emerged.
(4) Other major concerns:
(a) The authors selectively showed a few proteins in their manuscript to support their conclusion. For example, only Cox2 and Tom70 were used to illustrate mitochondrial biogenesis difference in line 97. Later on, they re-analyzed the previous MS dataset from Isasa et al 2015 and showed a few proteins in Fig3A to support their conclusion that ∆ubp3 increases mitochondrial OXPHOS proteins. However, I checked that MS dataset myself and saw that many key OXPHOS proteins do not change, for example, both ATP1 and ATP2 do not change, which encode the alpha and beta subunits of F1 ATPase. They selectively reported the proteins' change in the direction along with their hypothesis.
To clarify, we observe an increase in Cox2 protein levels but not in Tom70 levels which suggests that there is no increase in mitochondrial biogenesis. The increase is specific to some respiration related mitochondrial proteins such as Cox2 (Figure 1E, Figure 3A). We have clearly pointed out this in the manuscript. We used Cox2 protein levels as an additional readout for ETC activity, to validate our observations coming from the potentiometric mitotracker readouts, and basal oxygen consumption rate (OCR) measurements. This was for 3 reasons: Cox2 is a mitochondrial genome encoded subunit of the complex IV (cytochrome c oxidase) in the ETC, and has a redox centre critical for the cytochrome c oxidase activity. The biogenesis and assembly of complex IV subunits have been studied with respect to multiple conditions such as glucose availability and hypoxia and the expression and stability of the mitochondrial encoded complex IV subunits are exceptionally well correlated to changes in mitochondrial respiration (Fontanesi et al., 2006). Cox2 is very well characterised in S. cerevisiae, and the commercially available Cox2 antibodies are outstanding, which makes estimating Cox2 levels by western blotting unambiguous and reproducible.
We re-analyzed the proteomic dataset from Isasa et al to find out additional information regarding the key nodes that are differentially regulated in ubp3Δ. We have not claimed at any point in the manuscript that all OXPHOS related proteins are upregulated in ubp3Δ, nor is there any need for that to be so. We identified Ubp3 from our screen, observed an increase in mitochondrial potential, basal OCR, and Cox2 levels. We later found out that the proteomic data set for ubp3Δ also supports our observations that mitochondrial respiration is upregulated in ubp3Δ. The reviewer points out that we “showed a few proteins in Fig3A to support their conclusion that ∆ubp3 increases mitochondrial OXPHOS proteins”. Our conclusion is that the deletion of Ubp3 increases mitochondrial respiration. The combined readouts which we used to reach this conclusion (OCR, mitochondrial potential, mitochondrial ATP production, Cox2 levels) are far more direct, comprehensive and conclusive than showing an increase in a few proteins related to OXPHOS, as also explained earlier toward a distinct reviewer query. Since different mitochondrial proteins are regulated by different mechanisms, we need not see an increase in all the OXPHOS proteins in a mutant like ubp3Δ where mitochondrial respiration is high. An increase in some key proteins would be sufficient to increase the respiration as seen in our case.
To summarise, the proteomic dataset supports our observation, but our conclusions are not dependent on the increase in OXPHOS proteins observed in the dataset.
(b) The authors said they deleted ETC component Cox2 in line 111. I checked their method and table S1, I cannot figure out how they selectively deleted COX2 from mtDNA. This must be a mistake.
Yes, we understand that for mitochondrially encoded proteins, a simple knock-out strategy has limitations. However, we first tried to generate the Cox2 deletion mutant by a standard PCR mediated gene deletion strategy (Longtine 1998), with the optimistic assumption that even if all Cox2 is not lost, a substantial fraction of the Cox2 genes would be lost via recombination. We selected the transformants after strong antibiotic selection, and then we measured the Cox2 protein levels. Gratifyingly, we found that the mutant strain had substantially decreased Cox2 protein levels (but not a complete loss), and this was retained across generations. The data is shown below.
Author response image 14.
Cox2 levels in WT vs Cox2 mutants
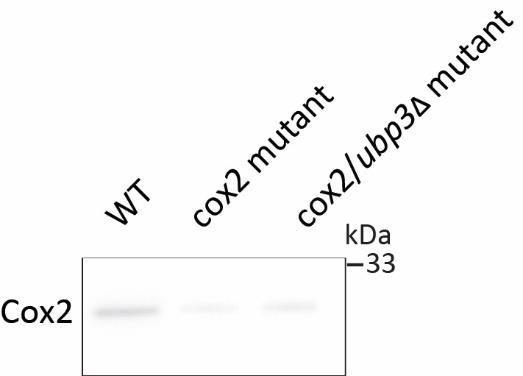
Since the mutants have decreased Cox2 levels, we went ahead and performed growth assays using this strain, in a WT or Ubp3 deletion background. Deletion of Ubp3 in the Cox2 mutant resulted in a more severe growth defect.
However, we fully agree that this strain is not a complete Cox2 knockout, and it is possible that the decrease in Cox2 is due to modifications in some other unelated gene. In the text, we should also not have named this cox2Δ. Since we are not sure of the exact genetic modification in this mutant, we have removed this data from the revised manuscript.
Instead, we have now repeated all experiments, utilizing a fully characterised Cox2 mutant -cox262, described in (5) which has defective respiration. In this revised version, we find that deletion of Ubp3 in this strain retains the originally observed severe growth defect in glucose. This is consistent with our conclusion that a functional mitochondria is required for proper growth in ubp3Δ mutant. To separately validate this conclusion, we also utilized a Rho0 strain which does not have mitochondrial DNA and thereby cannot perform mitochondrial respiration. We show that deletion of Ubp3 results in a more severe growth defect in a Rho0 strain. These results are included in the revised manuscript as figure 1-figure supplement 1 I.
Author response image 15.
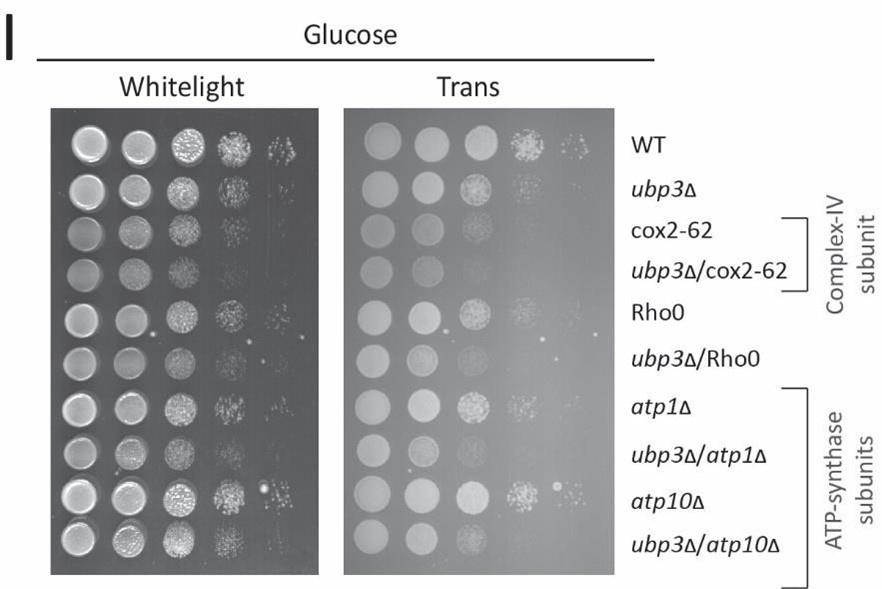
Also, we further confirmed that the Rho0 strain and Rho0 ubp3 strain is incapable of respiration, using seahorse assay. This data is included in the revised manuscript as Figure 4-figure supplement 1G.
Author response image 16.
Basal OCR in Rho0 cells
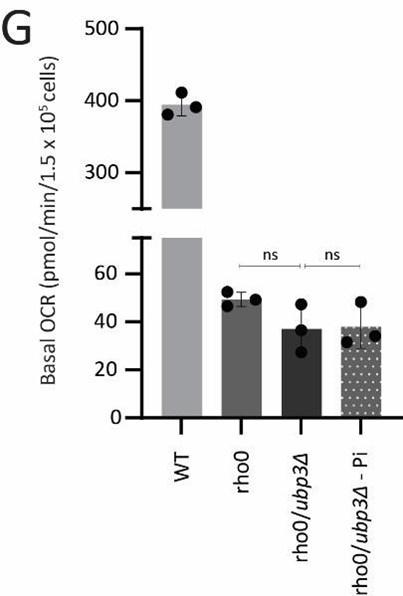
We hope that these new data address the reviewer’s concerns about the Cox2 mutant.
(c) They used sodium azide in a lot of assays to inhibit complex IV. However, this chemical is nonspecific and broadly affects many ATPases as well. Not sure why they do not use more specific inhibitors that are commonly used to assay OCR in seahorse.
We have now performed growth assays for WT and ubp3Δ cells in the presence of specific mitochondrial OXPHOS inhibitors - oligomycin and FCCP. We observe a more severe growth defect in ubp3Δ cells compared to WT cells in the presence of oligomycin and FCCP, similar to the results observed with sodium azide. All these data are now included in the revised manuscript as Figure 1I, Figure1-figure supplement 1H, along with associated text.
Author response image 17.
Growth rate in the presence of FCCP
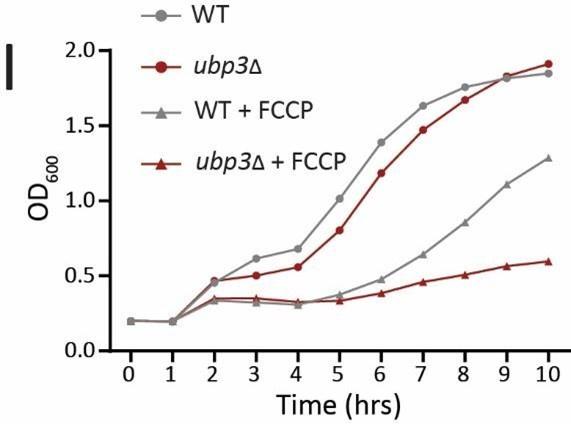
Author response image 18.
Figure1-figure supplement 1H- Growth rate in the presence of oligomycin
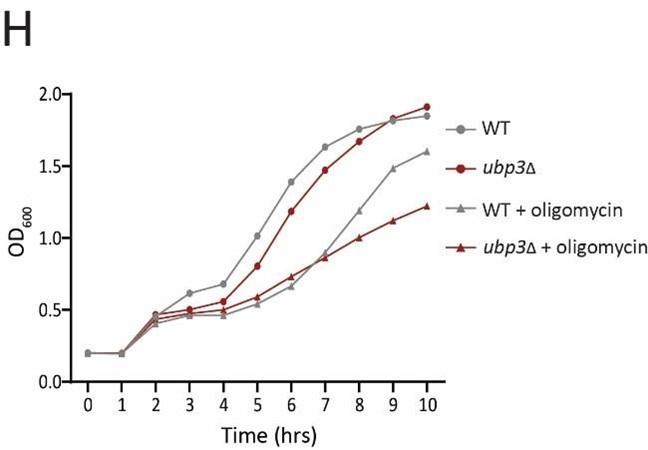
We hope that these new data addresses the reviewer’s concerns.
(d) The authors measured cellular Pi level by grinding the entire cells to release Pi. However, this will lead to a mix of cytosolic and vacuolar Pi. Related to this caveat, the cytosol has ~50mM Pi, while only 1-2mM of these glycolysis metabolites, I am not sure why the reduction of several glycolysis enzymes will cause significant changes in cytosolic Pi levels and make Pi the limiting factor for mitochondrial respiration. One possibility is that the observed cytosolic Pi level changes were caused by the measurement issue mentioned above.
The Pi estimation shown in figure 3 C, E, F and G is a measure of total Pi in the cells. The vacuole is a major storehouse of phosphate in cells. However, unlike plant cells where free phosphate is stored in vacuoles, yeast vacuoles store phosphate only in the form of polyphosphates (Yang et al., 2017, Hürlimann et al., 2007). The free Pi formed from the hydrolysis of polyphosphate is subsequently transported to cytosol via the exporter Pho91 (Hürlimann et al., 2007). This therefore makes cytosol and mitochondria the major storage of usable free Pi in yeast. Since the malachite green assay that we use for phosphate estimation is specific to free Pi, and not polyphosphate, the Pi estimates that we show in figure 3 come from a combination of cytosolic and mitochondrial Pi. As explained earlier, in order to specifically measure mitochondrial Pi, we have established methods to rapidly isolate mitochondria, and then followed this by estimating Pi in these isolated mitochondria (Figure 4B). Here we clearly see a large increase in mitochondrial Pi in the Ubp3 deletion cells. This allows us to estimate the changes in Pi levels that specific to mitochondria, without relying only on total Pi changes.
“the cytosol has ~50mM Pi, while only 1-2mM of these glycolysis metabolites, I am not sure why the reduction of several glycolysis enzymes will cause significant changes in cytosolic Pi levels and make Pi the limiting factor for mitochondrial respiration”
The reviewer has completely missed the fact that the glycolytic rate in yeast is the highest known for any cell. While the steady state levels of glycolytic metabolites might be ~2 mM, the process of glycolysis is not static but is rapid and continuous. Glucose is continuously broken down and converted to pyruvate, along with the consumption of Pi and generation of ATP. This is the reason for the rapid 13C label saturation (within seconds of 13C glucose addition) in yeast cells (Figure 2-figure supplement 1F). This instantaneous label saturation makes accurate flux measurements arduous because of which we had to optimize a method for measuring glycolytic flux in yeast cells (Figure 2-D, Figure 2-figure supplement 1F). Indeed, for that reason, our measurements of glycolytic flux in yeast are the first time this is being reported in the field. This in itself is an enormously challenging experiment, and establishes a new benchmark.
In highly glycolytic cells, most of the ATP is synthesized via glycolysis and the rate of glycolysis and ATP synthesis is very high. In the reaction catalysed by GAPDH, Pi and ADP is converted to ATP. This ATP formed acts as a Pi donor to most of the Pi consuming reactions in the cells. Some of these processes such a protein translation utilizes ATP, but releases Pi and ADP and this Pi enters the cellular Pi pool. Several other reactions such as nucleotide biosynthesis, polyphosphate biosynthesis and protein phosphorylation use ATP as a Pi donor and the Pi is fixed in biomolecules. Increasing the rates of these ‘Pi sinks’ therefore can result in a decrease in Pi pools. This is a concept we have earlier tried to clarify more elaborately in (Gupta and Laxman, 2021). In fact, increasing nucleotide biosynthesis and polyphosphate synthesis has earlier been suggested to decrease available free Pi (Austin and Mayer 2020, Desfougères et al., 2016). When glycolytic flux is high, this is coupled/tuned to the consumption of Pi which will be correspondingly high due to increased ATP, nucleotide and polyphosphate synthesis. Pi levels rapidly decrease upon glucose addition, due to the continuous Pi consumption during glycolysis (Hohmann et al., 1996, Van Heerden et al., 2014 , Koobs et al., 1972). Therefore, changes in glycolytic rate due to change in glycolytic enzyme levels can result in significant changes in Pi levels due to changes in Pi consumption rate.
Our results also show that the apart from Pi levels, the glycolytic state can regulate mitochondrial Pi transport as well. This is the reason for mitochondrial Pi levels and basal OCR not increasing merely by adding Pi to cells. We show that basal OCR can be increased by adding Pi in the presence of 2DG. This regulation of mitochondrial Pi transport is a major limiting factor for mitochondrial respiration and could be mediated partly by the regulating of Mir1 levels and also by the changes in the cytosolic pH which regulates the rate of mitochondrial Pi transport. We have discussed these points in the discussion section in our manuscript.
We hope that this clarifies the reviewer’s concerns regarding how changes in glycolytic rate can regulate changes in cytosolic Pi levels.
(e) The authors used ∆mir1 and MIR1 OE to show that Pi viability in the mitochondrial matrix is important for mitochondrial activity and biogenesis. This is not surprising as Pi is a key substrate required for OXPHOS activity. I doubt the approach of adding a control to determine whether Pi has a specific regulatory function, while other OXPHOS substrates, like ADP, O2 etc do not have the same effect.
To clarify, we only used the mir1Δ cells to understand the requirement for Pi transport from cytosol to mitochondria in controlling respiration. The reviewer is correct in stating that deletion of Mir1 would reduce Pi import to mitochondria and thereby inhibit respiration. This is exactly the conclusion we suggest from this experiment as stated in the manuscript – “These data suggest that mitochondrial Pi transport (via Mir1) is critical for maintaining basal mitochondrial activity even in high glucose”. We have only used these experiments to support the idea that even though glycolysis and mitochondria are in different compartments, a change in Pi balance in one compartment (cytosol) can affect Pi levels in the other (mitochondria) since there is Pi transport between these two compartments. Since mitochondria has its own polyphosphate reserves, in the absence of these experiments with mir1Δ cells it can be imagined that mitochondria PolyP can be an additional source of Pi to support respiration, and therefore changes in cytosolic Pi may have only a minor effect on mitochondrial respiration. Our experiments with mir1Δ and Mir1-OEcells indubitably suggest that Pi transport to mitochondria from cytosol is important for respiration, and therefore changes in cytosolic Pi levels (or maintaining cytosolic Pi at a lower level due to the rate of glycolysis) will have rippling effects in mitochondrial Pi availability. Further, these data suggest that for example under glycolytic inhibition (low glucose, or 2DG), while all factors (signalling, substrate availability etc) favour respiration (and mitochondrial derepression), cells cannot unable to achieve this in the absence of ample Pi transport from cytosol. This therefore places Pi at the centre stage in controlling mitochondrial respiration.
We conclude that Pi is a major, but not the only constraint for mitochondrial respiration. There certainly could be a role for ADP, oxygen availability etc in regulating respiration. However, these are beyond the scope of our study. We have discussed about the potential role of ADP in regulating mitochondrial repression in the discussion section. “An additional consideration is the possible contribution of changes in ADP in regulating mitochondrial activity, where the use of ADP in glycolysis might limit mitochondrial ADP. Therefore, when Pi changes as a consequence of glycolysis, it could be imagined that a change in ADP balance can coincidentally occur. However, prior studies show that even though cytosolic ADP decreases in the presence of glucose, this does not limit mitochondrial ADP uptake, or decrease respiration, due to the very high affinity of the mitochondrial ADP transporter.”
We hope that this clarifies the reviewer’s concerns regarding the use of Mir1 OE and mir1Δ strains.
Recommendations for the authors:
Reviewer #1 (Recommendations For The Authors):
Some of the experiments should be repeated in other strain backgrounds for reproducibility and rigor.
As discussed in the response to point number 1, we have now utilized multiple strains of S. cerevisiae to test our findings. We now find that our discoveries regarding the role of altered Pi budgeting as a constraint for mitochondrial respiration, and the role of Ubp3 as a regulator of mitochondrial repression are conserved across multiple genetic backgrounds of S. cerevisiae. These results are included in the revised manuscript as a new figure- Figure 6 and associated text. We used the W303, Σ1278 and BY4742 strains of S. cerevisiae to show that deletion of Ubp3 increases mitochondrial activity (as shown by increased mitochondrial membrane potential and increased Cox2 levels). Using the W303 strain we show that the deletion of Ubp3 increases Pi levels and that the increased Pi is necessary for increasing mitochondrial respiration (Figure 6C, D). These added experiments have substantially broadened the generality of our findings.
The number of biological repeats needs to be increased in all experiments.
We have increased the number of biological repeats in key experiments that shows that the increased Pi levels are necessary for the increased mitochondrial respiration in ubp3Δ and tdh2Δtdh3Δ cells (revised Figure 4F). Apart from a few basal OCR measurements and mitotracker data in supplementary figure, all our experiments are performed for 3 biological repeats. In case of basal OCR measurements, yeast cells have to be aliquoted to poly-L-lysine coated seahorse plates and centrifuged to ensure that the cells are properly settled. This is due to the non-adherent nature of yeast cells. During the centrifugation step, the wells in the two end rows cannot be utilized due to uneven settling of cells which affects the basal OCR readings in these wells. In case of several experiments that involve multiple samples, we were therefore limited to restrict the number of biological replicates to 2 (repeated independently), so that all samples could be accommodated in the plate.
Full western blot images should be supplemented along with the other data.
The complete western blot images are now included in the revised manuscript as supplementary file 2.
TCA cycle flux should be analyzed and presented in the study to conclude some of the findings.
As discussed in detail in the response to point number 2, we have performed steady state and flux measurements for TCA cycle intermediates. This data is now included as a new supplement figure- Figure 2-figure supplement 2.
Reviewer #2 (Recommendations For The Authors):
(1) In Fig. 2A, they should also include the gluconeogenesis enzymes (fructose 1,6 bisphosphatase, PEP carboxykinase, and pyruvate carboxylase) to exclude the possibility that glycolytic intermediates are not rerouted to gluconeogenesis.
We measured the protein levels of Fbp1 (fructose 1,6 bisphosphatase) and Pck1 (PEP carboxykinase). We observed an increase in the protein levels in both enzymes in ubp3Δ. The data is shown below.
Author response image 19.
Fbp1 and Pck1 protein levels
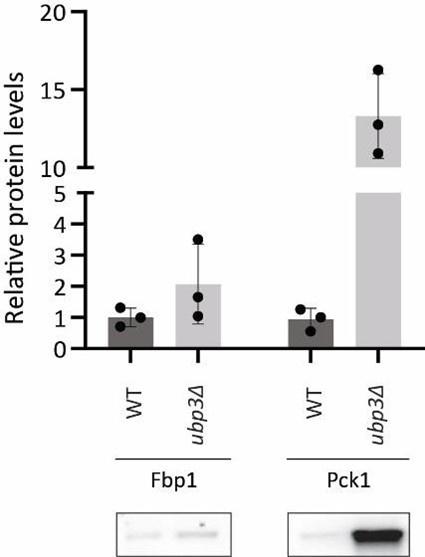
While we agree that this is an interesting observation which might help us in understanding the metabolic rewiring in ubp3Δ, we have not included this data in the current revised version of the manuscript due to two main reasons.
(1) Since ubp3Δ cells have a defective glycolysis and therefore a defective glucose repression, the mRNA and protein levels of gluconeogenic enzymes which are usually glucose-repressed might increase. This might be a response at the level of transcription and translation of these enzymes and might or might not change the rate of gluconeogenesis in these cells. This is because of multiple other factors that regulate gluconeogenic flux such as allostery, mass action etc. Therefore, to avoid confounding our main points and since we cannot make a conclusive assumption on the gluconeogenic metabolism in these mutants, we don’t include this data. The primary focus of our story is the mitochondrial repression component. Understanding the feedback controls that alter gluconeogenesis in these mutants is beyond the scope of this study and could be addressed in a separate future study.
(2) As we highlight extensively in the response letter and in the manuscript, our aim is not to understand the specific mechanistic role of Ubp3. In this manuscript, we identify the conserved constraints that control mitochondrial repression without focusing just on the role of Ubp3 in regulating this. Whether Ubp3 regulates gluconeogenesis is a question that could be addressed in a future study that focuses on identifying the altered signalling mechanisms in ubp3Δ and the targets of Ubp3.
(2) In line 292, page 10, there is a typo "dermine".
We apologize for this mistake. Corrected.
(3) In Figure 5A, is there a reason why they chose 0.1% glucose condition as a low glucose condition? Also, is there a dose-dependent change in OCR or other mitochondrial functions according to the concentration of glucose?
The glucose concentration of 0.1% was selected to decrease (but not completely remove) the available glucose. 0.1% glucose is considered as a standard low glucose condition in S. cerevisiae (Yin et al., 2003) and the effect of this glucose concentration on cellular processes has been extensively studied (Yin et al., 2003, Takeda et al., 2015 etc). <0.2% glucose is the critical threshold for activating respiratory metabolism (Takeda et al., 2015) and shifting cells to 0.1% glucose in our experiments will activate respiration, as we show in our data. However, this is very different from completely removing glucose or using an alternate carbon source such as ethanol, because this would result in full activation of gluconeogenesis. We further find that when cells are grown in ethanol, the gluconeogenic activation will also change the Pi homeostasis. This will in part be a result of the fully reversed direction of the GAPDH catalysed reaction (Figure 3G). If such a condition is used, it could lead to misinterpretations, and confound the conclusions that we make from these set of experiments where Pi homeostasis play a major role. In 0.1% glucose it has been shown that gluconeogenesis is still partly repressed (Yin et al., 2003). The pathways utilizing alternate carbon sources still remain repressed (even though to a lower extend compared to 2% glucose) in 0.1% glucose (Yin et al., 2003). We hope that this clarifies the concerns regarding the rationale behind using 0.1% glucose in our experiments.
The extent of glucose repression is dependent on the concentration of glucose. Glucose concentration >1% has been shown to activate degradation of mRNAs involved in alternate carbon utilization. Different signaling pathways involved in growth under glucose and glucose repression is regulated by glucose concentration. This is discussed in detail in Yin et al., 2002. We (Figure 5figure supplement 1A) also observe a dose dependent increase in mitochondrial membrane potential in the presence of 2DG. This also suggests that the rate of glycolysis (which could be also mediated by changes in glucose concentration) can regulate the extent of mitochondrial derepression.
-
eLife assessment
This valuable study informs on the regulation of metabolic flux between glycolysis and respiration in yeast, mediated by inorganic phosphate. The authors propose a novel mechanism involving Ubp3/Ubp10 that potentially mitigates the Crabtree effect, based on an array of assays that offer substantial insight into mitochondrial biogenesis under high glucose conditions. However, the evidence supporting the conclusions remains incomplete because of a limited number of replicates, particularly in protein blot analyses with insufficient normalization methods, which undermines the robustness of the findings. This work could influence the subfield significantly if the methodological weaknesses are addressed to provide more support for the proposed model.
-
Reviewer #1 (Public Review):
The study by Vengayil et al. presented a role for Ubp3 for mediating inorganic phosphate (Pi) compartmentalization in cytosol and mitochondria, which regulates metabolic flux between cytosolic glycolysis and mitochondrial processes. Although the exact function of increased Pi in mitochondria is not investigated, findings have valuable implications for understanding the metabolic interplay between glycolysis and respiration under glucose-rich conditions. They showed that UBP3 KO cells regulated decreased glycolytic flux by reducing the key Pi-dependent-glycolytic enzyme abundances, consequently increasing Pi compartmentalization to mitochondria. Increased mitochondria Pi increases oxygen consumption and mitochondrial membrane potential, indicative of increased oxidative phosphorylation. In conclusion, the …
Reviewer #1 (Public Review):
The study by Vengayil et al. presented a role for Ubp3 for mediating inorganic phosphate (Pi) compartmentalization in cytosol and mitochondria, which regulates metabolic flux between cytosolic glycolysis and mitochondrial processes. Although the exact function of increased Pi in mitochondria is not investigated, findings have valuable implications for understanding the metabolic interplay between glycolysis and respiration under glucose-rich conditions. They showed that UBP3 KO cells regulated decreased glycolytic flux by reducing the key Pi-dependent-glycolytic enzyme abundances, consequently increasing Pi compartmentalization to mitochondria. Increased mitochondria Pi increases oxygen consumption and mitochondrial membrane potential, indicative of increased oxidative phosphorylation. In conclusion, the authors reported that the Pi utilization by cytosolic glycolytic enzymes is a key process for mitochondrial repression under glucose conditions.
Comments on revised version:
This reviewer appreciates the author's responses addressing some of the concerns.
However, the concern of reproducibility and experimental methods applied to the study is still valid, particularly considering that many conclusions were drawn from western blot analysis. The authors used separate gel loading controls for western blot analysis, which is not a valid method. Considering loading and other errors/discrepancies during the transfer phase of the assay, the direct control should be analyzing the membrane after transfer or using an internal control antibody on the same membrane. None of the western blots are indicated with marker sizes, and it isn't very clear how many repeats there are and whether those repeats are biological or technical repeats.
Concern regarding citing the Ouyang et al. paper is still valid. This paper is an essential implication in phosphate metabolism and is directly related to some of the findings associated with mitochondrial function, along with conflicting results, which should be discussed in the discussion section. As a reviewer, I do not request citing any paper from the authors in general; however, considering some of the conflicting results here, citing and discussing paper from Ouyang et al. will improve the interoperation/value of their findings.
Considering these factors, the presented results do not fully support the findings.
-
Reviewer #2 (Public Review):
Summary:
Cells cultured in high glucose tend to repress mitochondrial biogenesis and activity, a prevailing phenotype type called Crabree effect that observed in different cell types and cancer. Many signaling pathways have been put forward to explain this effect. Vengayil et al proposed a new mechanism involved in Ubp3/Ubp10 and phosphate that controls the glucose repression of mitochondria. The central hypothesis is that ∆ubp3 shift the glycolysis to trehalose synthesis, therefore lead to the increase of Pi availability in the cytosol, then mitochondrial received more Pi and therefore the glucose repression is reduced.
Strengths:
The strength is that the authors used an array of different assays to test their hypothesis. Most assays were well designed and controlled.
Weaknesses:
I think the main …
Reviewer #2 (Public Review):
Summary:
Cells cultured in high glucose tend to repress mitochondrial biogenesis and activity, a prevailing phenotype type called Crabree effect that observed in different cell types and cancer. Many signaling pathways have been put forward to explain this effect. Vengayil et al proposed a new mechanism involved in Ubp3/Ubp10 and phosphate that controls the glucose repression of mitochondria. The central hypothesis is that ∆ubp3 shift the glycolysis to trehalose synthesis, therefore lead to the increase of Pi availability in the cytosol, then mitochondrial received more Pi and therefore the glucose repression is reduced.
Strengths:
The strength is that the authors used an array of different assays to test their hypothesis. Most assays were well designed and controlled.
Weaknesses:
I think the main conclusions are not strongly supported by the current dataset. Here are my comments on authors' response and model.
(1) The authors addressed some of my concerns related to ∆ubp3. But based on the results they observed and discussed, the ∆ubp3 redirect some glycolytic flux to gluconeogenesis while the 0.1% glucose in WT does not. Similarly, the shift of glycolysis to trehalose synthesis is also not relevant to the WT cells cultured in low glucose situation. This should be discussed in the manuscript to make sure readers are not misled to think ∆ubp3 mimic low glucose. It is likely that ∆ubp3 induce proteostasis stress, which is known to activate respiration and trehalose synthesis.
(2) Pi flux: it is known that vacuole can compensate the reduction of Pi in the cytosol. The paper they cited in the response, especially the Van Heerden et al., 2014 showed that the pulse addition of glucose caused transient Pi reduction and then it came back to normal level after 10min or so. If the authors mean the transient change of glycolysis and respiration, they should point that out clearly in the abstract and introduction. If the authors are trying to put out a general model, then the model must be reconsidered.
The cytosol has ~50mM Pi (van Eunen et al., 2010 FEBSJ), while only 1-2mM of glycolysis metabolites, not sure why partial reduction of several glycolysis enzymes will cause significant changes in cytosolic Pi level and make Pi the limiting factor for mitochondrial respiration. In response to this comment, the authors explained the metabolic flux that the rapid, continuous glycolysis will drain the Pi pool even each glycolytic metabolite is only 1-2mM. However, the metabolic flux both consume and release Pi, that's why there is such measurement of overall free Pi concentration amid the active metabolism. One possibility is that the observed cytosolic Pi level changes was caused by the measurement fluctuation, as they showed in "Reviewer response image 3".
Importantly, the authors measured Pi inside mito for ethanol and glucose, but not the cytosolic Pi, which is the key hypothesis in their model. The model here is that the glycolysis competes with mito for free cytosolic Pi, so it needs to inhibit glycolysis to free up cytosolic Pi for mitochondrial import to increase respiration. I don't see measurement of cytosolic Pi upon different conditions, only the total Pi or mito Pi. The fact is that in Fig.3C they saw WT+Pi in the medium increase total free Pi more than the ∆ubc3, while WT decrease mito Pi compared to WT control and ∆ubc3 and therefore decrease basal OCR upon Pi supplement. A simple math of Pitotal = Pi cyto + Pi mito tells us that if WT has more Pitotal (Fig.3C) but less Pi mito (fig.5 supp 1C), then it has higher Pi cyto. This is contradictory to what the authors tried to rationalize. Furthermore, as I pointed out previously, the isolated mitochondria can import more Pi when supplemented, so if there is indeed higher Picyto, then the mito in WT should import more Pi. So, to address these contradictory points, the authors must measure Pi in the cytosol, which is a critical experiment not done for their model. For example, they hypothesized that adding 2-DG, or ∆ubp3, suppress glycolysis and thus increase the supply of cytosolic Pi for mito to import, but no cytosolic Pi was measured (need absolute value, not the relative fold changes). It is also important to specific how the experiments are done, was the measurement done shortly after adding 2-DG. Given that the cells response to glucose changes/pulses differently in transient vs stable state, the authors are encouraged to specify that.
The most likely model to me is that, which is also the consensus in the field, is that no matter 2-DG or ∆ubp3, the cells re-wiring metabolism in both cytosol and mitochondria, and it is the total network shift that cause the mitochondrial respiration increase, which requires the increase of mito import of Pi, ADP, O2, and substrates, but not caused/controlled by the Pi that singled out by the authors in their model.
(3) The explanation that cytosolic pH reduction upon glucose depletion/2DG is a mistake. There are a lot of data in the literature showing the opposite. If the authors do think this is true, then need to show the data. Again, it is important to distinguish transient vs stable state for pH changes.
-
eLife assessment
This useful study explores the phenomenon of glucose-induced mitochondrial repression, known as the Crabtree effect, in cells cultured under high glucose conditions. The study uses a variety of well-designed assays to support the authors' hypothesis, shedding light on inorganic phosphate-mediated metabolic regulation. The analysis and conclusions could benefit from a more rigorous approach, given the limited replication on a single yeast strain background and inadequacies in the normalization methods, leaving the evidence in parts incomplete.
-
Reviewer #1 (Public Review):
The study by Vengayil et al. presented a role for Ubp3 for mediating inorganic phosphate (Pi) compartmentalization in cytosol and mitochondria, which regulates metabolic flux between cytosolic glycolysis and mitochondrial processes. Although the exact function of increased Pi in mitochondria is not investigated, findings have valuable implications for understanding the metabolic interplay between glycolysis and respiration under glucose-rich conditions. They showed that UBP3 KO cells regulated decreased glycolytic flux by reducing the key Pi-dependent-glycolytic enzyme abundances, consequently increasing Pi compartmentalization to mitochondria. Increased mitochondria Pi increases oxygen consumption and mitochondrial membrane potential, indicative of increased oxidative phosphorylation. In conclusion, the …
Reviewer #1 (Public Review):
The study by Vengayil et al. presented a role for Ubp3 for mediating inorganic phosphate (Pi) compartmentalization in cytosol and mitochondria, which regulates metabolic flux between cytosolic glycolysis and mitochondrial processes. Although the exact function of increased Pi in mitochondria is not investigated, findings have valuable implications for understanding the metabolic interplay between glycolysis and respiration under glucose-rich conditions. They showed that UBP3 KO cells regulated decreased glycolytic flux by reducing the key Pi-dependent-glycolytic enzyme abundances, consequently increasing Pi compartmentalization to mitochondria. Increased mitochondria Pi increases oxygen consumption and mitochondrial membrane potential, indicative of increased oxidative phosphorylation. In conclusion, the authors reported that the Pi utilization by cytosolic glycolytic enzymes is a key process for mitochondrial repression under glucose conditions.
However, the main claims are only partially supported by the low number of repeats and utilizing only one strain background, which decreased the overall rigor of the study. The full-power yeast model could be utilized with testing findings in different backgrounds with increased biological repeats in many assays described in this study. In the yeast model, it has been well established that many phenotypes are genotype/strain dependent (Liti 2019, Gallone 2016, Boekout 2021, etc...). with some strains utilizing mitochondrial respiration even under high glucose conditions (Kaya 2021). It would be conclusive to test whether wild strains with increased respiration under high glucose conditions would also be characterized by increased mitochondrial Pi.
It is not described whether the drop in glycolytic flux also affects TCA cycle flux. Are there any changes in the pyruvate level? If the TCA cycle is also impaired, what drives increased mitochondrial respiration?
In addition, some of the important literature was also missed in citation and discussion. For example, in a recent study (Ouyang et al., 2022), it was reported that phosphate starvation increases mitochondrial membrane potential independent of respiration in yeast and mammalian cells, and some of the conflicting results were presented in this study.
An additional experiment with strains lacking mitochondrial DNA under phosphate-rich and restricted conditions would further strengthen the result.
Western blot control panels should include entire membrane exposure, and non-cut western blots should be submitted as supplementary.
In Figure 4, it is shown that Pi addition decreases basal OCR to the WT level. However, the Cox2 level remains significantly higher. This data is confusing as to whether mitochondrial Pi directly regulates respiration or not.
Representative images of Ubx3 KO and wild-type strains stained with CMXRos are missing.
Overall, mitochondrial copy number and mtDNA copy number should be analyzed in WT and Ubo3 KO cells as well as Pi-treated and non-treated cells, and basal OCR data should be normalized accordingly. The reported normalization against OD is not appropriate.
-
Reviewer #2 (Public Review):
Summary:
Cells cultured in high glucose tend to repress mitochondrial biogenesis and activity, a prevailing phenotype type called Crabree effect that is observed in different cell types and cancer. Many signaling pathways have been put forward to explain this effect. Vengayil et al proposed a new mechanism involved in Ubp3/Ubp10 and phosphate that controls the glucose repression of mitochondria. The central hypothesis is that ∆ubp3 shifts the glycolysis to trehalose synthesis, therefore leading to the increase of Pi availability in the cytosol, then mitochondria receive more Pi, and therefore the glucose repression is reduced.Strengths:
The strength is that the authors used an array of different assays to test their hypothesis. Most assays were well-designed and controlled.Weaknesses:
I think the main …Reviewer #2 (Public Review):
Summary:
Cells cultured in high glucose tend to repress mitochondrial biogenesis and activity, a prevailing phenotype type called Crabree effect that is observed in different cell types and cancer. Many signaling pathways have been put forward to explain this effect. Vengayil et al proposed a new mechanism involved in Ubp3/Ubp10 and phosphate that controls the glucose repression of mitochondria. The central hypothesis is that ∆ubp3 shifts the glycolysis to trehalose synthesis, therefore leading to the increase of Pi availability in the cytosol, then mitochondria receive more Pi, and therefore the glucose repression is reduced.Strengths:
The strength is that the authors used an array of different assays to test their hypothesis. Most assays were well-designed and controlled.Weaknesses:
I think the main conclusions are not strongly supported by the current dataset.1. Although the authors discovered ∆ubp3 cells have higher Pi and mitochondrial activity than WT in high glucose, it is not known if WT cultured in different glucose concentration also change Pi that correlate with the mitochondrial activity. The focus of the research on ∆ubp3 is somewhat artificial because ∆ubp3 not only affects glycolysis and mitochondria, but many other cellular pathways are also changed. There is no idea whether culturing cells in low glucose, which de-repress the mitochondrial activity, involves Ubp3 or not. Similarly, the shift of glycolysis to trehalose synthesis is also not relevant to the WT cells cultured in a low-glucose situation.
2. The central hypothesis that Pi is the key constraint behind the glucose repression of mitochondrial biogenesis/activity is supported by the data that limiting Pi will suppress mitochondrial activity increase in these conditions (e.g., ∆ubp3). However, increasing the Pi supply failed to increase mitochondrial activity. The explanation put forward by the authors is that increased Pi supply will increase glycolysis activity, and somehow even reduce the mitochondrial Pi. I cannot understand why only the increased Pi supply in ∆ubp3, but not the increased Pi by medium supplement, can increase mitochondrial activity. The authors said "...that ubp3Δ do not increase mitochondrial Pi by merely increasing the Pi transporters, but rather by increasing available Pi pools". They showed that ∆ubp3 mitochondria had higher Pi but WT cells with medium Pi supplement showed lower Pi, it is hard to understand why the same Pi increase in the cytosol had a different outcome in mitochondrial Pi. Later on, they showed that the isolated mito exposed to higher Pi showed increased activity, so why can't increased Pi in intact cells increase mito activity? Moreover, they first showed that ∆ubp3 had a Mir1 increase in Fig3A, then showed no changes in FigS4G. It is very confusing.
3. Given that there is no degradation difference for these glycolytic enzymes in ∆ubp3, and the authors found transcriptional level changes, suggests an alternative possibility where ∆ubp3 may signal through unknown mechanisms to parallelly regulate both mitochondrial biogenesis and glycolytic enzyme expression. The increase of trehalose synthesis usually happens in cells under proteostasis stress, so it is important to rule out whether ∆ubp3 signals these metabolic changes via proteostasis dysregulation. This echoes my first point that it is unknown whether wild-type cells use a similar mechanism as ∆ubp3 cells to regulate the glucose repression of mitochondria.
4. Other major concerns:
a. The authors selectively showed a few proteins in their manuscript to support their conclusion. For example, only Cox2 and Tom70 were used to illustrate mitochondrial biogenesis difference in line 97. Later on, they re-analyzed the previous MS dataset from Isasa et al 2015 and showed a few proteins in Fig3A to support their conclusion that ∆ubp3 increases mitochondrial OXPHOS proteins. However, I checked that MS dataset myself and saw that many key OXPHOS proteins do not change, for example, both ATP1 and ATP2 do not change, which encode the alpha and beta subunits of F1 ATPase. They selectively reported the proteins' change in the direction along with their hypothesis.
b. The authors said they deleted ETC component Cox2 in line 111. I checked their method and table S1, I cannot figure out how they selectively deleted COX2 from mtDNA. This must be a mistake.
c. They used sodium azide in a lot of assays to inhibit complex IV. However, this chemical is nonspecific and broadly affects many ATPases as well. Not sure why they do not use more specific inhibitors that are commonly used to assay OCR in seahorse.
d. The authors measured cellular Pi level by grinding the entire cells to release Pi. However, this will lead to a mix of cytosolic and vacuolar Pi. Related to this caveat, the cytosol has ~50mM Pi, while only 1-2mM of these glycolysis metabolites, I am not sure why the reduction of several glycolysis enzymes will cause significant changes in cytosolic Pi levels and make Pi the limiting factor for mitochondrial respiration. One possibility is that the observed cytosolic Pi level changes were caused by the measurement issue mentioned above.
e. The authors used ∆mir1 and MIR1 OE to show that Pi viability in the mitochondrial matrix is important for mitochondrial activity and biogenesis. This is not surprising as Pi is a key substrate required for OXPHOS activity. I doubt the approach of adding a control to determine whether Pi has a specific regulatory function, while other OXPHOS substrates, like ADP, O2 etc do not have the same effect. -
-
-
-
-
