Homeostatic synaptic plasticity of miniature excitatory postsynaptic currents in mouse cortical cultures requires neuronal Rab3a
Curation statements for this article:-
Curated by eLife

eLife Assessment
This valuable study presents findings on the role of the small GTPase Rab3A in homeostatic plasticity. While the study provides solid evidence for a requirement of Rab3A in homeostatic up-scaling in cultured mouse neurons, it does not provide a model of how Rab3A is involved in homeostatic plasticity. The work will be of interest to researchers in the field of synaptic transmission and synaptic plasticity.
This article has been Reviewed by the following groups
Discuss this preprint
Start a discussion What are Sciety discussions?Listed in
- Evaluated articles (eLife)
Abstract
Following prolonged activity blockade, amplitudes of miniature excitatory postsynaptic currents (mEPSCs) increase, a form of plasticity termed ‘homeostatic synaptic plasticity’. We previously showed that a presynaptic protein, the small GTPase Rab3a , is required for full expression of the increase in miniature endplate current amplitudes following prolonged blockade of action potential activity at the mouse neuromuscular junction (NMJ) in vivo, where an increase in postsynaptic receptors does not contribute. It is unknown whether this form of Rab3a -dependent homeostatic plasticity at the NMJ shares any characteristics with central synapses. We show here that homeostatic synaptic plasticity of mEPSCs is impaired in mouse cortical neuron cultures prepared from Rab3a −/− and mutant mice expressing a single-point mutation of Rab3a , Rab3a Earlybird mice. To determine if Rab3a is involved in the well-established homeostatic increase in postsynaptic AMPA-type receptors (AMPARs), we performed a series of experiments in which electrophysiological recordings of mEPSCs and confocal imaging of synaptic AMPAR immunofluorescence were assessed within the same cultures. We found that the increase in postsynaptic AMPAR levels in wild-type cultures was more variable than that of mEPSC amplitudes, which might be explained by a presynaptic contribution, but we cannot rule out variability in the measurement. Finally, we demonstrate that Rab3a is acting in neurons because only selective loss of Rab3a in neurons, not glia, disrupted the homeostatic increase in mEPSC amplitudes. This is the first demonstration that a protein thought to function presynaptically is required for homeostatic synaptic plasticity of quantal size in central neurons.
Article activity feed
-

-
-

eLife Assessment
This valuable study presents findings on the role of the small GTPase Rab3A in homeostatic plasticity. While the study provides solid evidence for a requirement of Rab3A in homeostatic up-scaling in cultured mouse neurons, it does not provide a model of how Rab3A is involved in homeostatic plasticity. The work will be of interest to researchers in the field of synaptic transmission and synaptic plasticity.
-
Reviewer #1 (Public review):
Koesters and colleagues investigated the role of the small GTPase Rab3A in homeostatic scaling of miniature synaptic transmission in primary mouse cortical cultures using electrophysiology and immunohistochemistry. The major finding is that TTX incubation for 48 hours does not induce an increase in the amplitude of excitatory synaptic miniature events in neuronal cortical cultures derived from Rab3A KO and Rab3A Earlybird mutant mice. NASPM application had comparable effects on mEPSC amplitude in control and after TTX, implying that Ca2+-permeable glutamate receptors are unlikely modulated during synaptic scaling. Immunohistochemical analysis revealed no significant changes in GluA2 puncta size, intensity, and integral after TTX treatment in control and Rab3A KO cultures. Finally, they provide evidence that …
Reviewer #1 (Public review):
Koesters and colleagues investigated the role of the small GTPase Rab3A in homeostatic scaling of miniature synaptic transmission in primary mouse cortical cultures using electrophysiology and immunohistochemistry. The major finding is that TTX incubation for 48 hours does not induce an increase in the amplitude of excitatory synaptic miniature events in neuronal cortical cultures derived from Rab3A KO and Rab3A Earlybird mutant mice. NASPM application had comparable effects on mEPSC amplitude in control and after TTX, implying that Ca2+-permeable glutamate receptors are unlikely modulated during synaptic scaling. Immunohistochemical analysis revealed no significant changes in GluA2 puncta size, intensity, and integral after TTX treatment in control and Rab3A KO cultures. Finally, they provide evidence that loss of Rab3A in neurons, but not astrocytes, blocks homeostatic scaling. Based on these data, the authors propose a model in which neuronal Rab3A is required for homeostatic scaling of synaptic transmission, potentially through GluA2-independent mechanisms.
The major finding - impaired homeostatic up-scaling after TTX treatment in Rab3A KO and Rab3 earlybird mutant neurons - is supported by data of high quality. However, the paper falls short of providing any evidence or direction regarding potential mechanisms. The data on GluA2 modulation after TTX incubation are likely statistically underpowered and do not allow drawing solid conclusions, such as GluA2-independent mechanisms of up-scaling.
The study should be of interest to the field because it implicates a presynaptic molecule in homeostatic scaling, which is generally thought to involve postsynaptic neurotransmitter receptor modulation. However, it remains unclear how Rab3A participates in homeostatic plasticity.
Major (remaining) point:
(1) The current version of the abstract only includes the results on GluA2 immunofluorescence and mEPSC amplitude modulation after TTX treatment in control cultures, and a requirement for Rab3A in neurons instead of astrocytes. The major findings, including the block of the mEPSC amplitude increase upon TTX treatment in Rab3KO/EB mutants, are not mentioned. The abstract should be revised so that it reflects all major findings, potentially at the expense of citing previous work by the authors.
-
Reviewer #2 (Public review):
First, I would like to thank the authors for the response. I acknowledge that the authors show in previous studies that Rab3A acts from the presynaptic side at the NMJ, and that is, as the authors indicate, their impetus for the current study. However, mechanisms observed at a completely different type of synapses cannot be used as an argument for conclusions here. The authors also acknowledge that they should restrict their conclusions to the data in the current study, and they are merely proposing interpretations. Then perhaps they should restrict these interpretations to the discussion rather than make this claim in the abstract (lines 44-47). Here the authors ask whether Rab3A is involved in the homeostatic increase of postsynaptic AMPARs, am I understanding it correctly that their conclusion for this …
Reviewer #2 (Public review):
First, I would like to thank the authors for the response. I acknowledge that the authors show in previous studies that Rab3A acts from the presynaptic side at the NMJ, and that is, as the authors indicate, their impetus for the current study. However, mechanisms observed at a completely different type of synapses cannot be used as an argument for conclusions here. The authors also acknowledge that they should restrict their conclusions to the data in the current study, and they are merely proposing interpretations. Then perhaps they should restrict these interpretations to the discussion rather than make this claim in the abstract (lines 44-47). Here the authors ask whether Rab3A is involved in the homeostatic increase of postsynaptic AMPARs, am I understanding it correctly that their conclusion for this question is "increase in AMPAR levels in WT cultures is more variable than those in mEPSCs so that it is impossible to determine if Rab3A is involved at all"? If so, then this question has not been answered and should not be regarded as one of the main conclusions with the data presented here. It also remains unclear to me how this piece of inconclusive data serves the main objective of the study.
The authors state at the end that the current study is just an extension of their previous work, and therefore their interpretations here further support the idea that Rab3A is acting presynaptically. I would argue that it is the conclusive data, rather than interpretations that lack concrete evidence, that support ideas and models. I think that we would all agree that immunostaining measurements can be very variable. However, if the authors are determined to use this approach to answer one of their major questions, then perhaps one way to significantly strengthen their conclusions is to find ways to somewhat overcome this technical limitation.
Finally, I thank the authors for addressing other minor concerns of mine.
-
Reviewer #3 (Public review):
This manuscript presents a number of interesting findings that have the potential to increase our understanding of the mechanism underlying homeostatic synaptic plasticity (HSP). The data broadly support that Rab3A plays a role in HSP, although the site and mechanism of action remain uncertain.
The authors clearly demonstrate the Rab3A plays a role in HSP at excitatory synapses, with substantially less plasticity occurring in the Rab3A KO neurons. There is also no apparent HSP in the Earlybird Rab3A mutation, although baseline synaptic strength is already elevated. In this context, it is unclear if the plasticity is absent, already induced by this mutation, or just occluded by a ceiling effect due the synapses already being strengthened. Occlusion may also occur in the mixed cultures, when Rab3A is missing …
Reviewer #3 (Public review):
This manuscript presents a number of interesting findings that have the potential to increase our understanding of the mechanism underlying homeostatic synaptic plasticity (HSP). The data broadly support that Rab3A plays a role in HSP, although the site and mechanism of action remain uncertain.
The authors clearly demonstrate the Rab3A plays a role in HSP at excitatory synapses, with substantially less plasticity occurring in the Rab3A KO neurons. There is also no apparent HSP in the Earlybird Rab3A mutation, although baseline synaptic strength is already elevated. In this context, it is unclear if the plasticity is absent, already induced by this mutation, or just occluded by a ceiling effect due the synapses already being strengthened. Occlusion may also occur in the mixed cultures, when Rab3A is missing from neurons but not astrocytes. The authors do appropriately discuss these options. The authors have solid data showing that Rab3A is unlikely to be active in astrocytes, Finally, they attempt to study the linkage between changes in synaptic strength and AMPA receptor trafficking during HSP, and conclude that trafficking may not be solely responsible for the changes in synaptic strength during HSP.
Strengths:
This work adds another player into the mechanisms underlying an important form of synaptic plasticity. The plasticity is likely only reduced, suggesting Rab3A is only partially required and perhaps multiple mechanisms contribute. The authors speculate about some possible novel mechanisms, including whether Rab3A is active pre-synaptically to regulate quantal amplitude.
As Rab3A is primarily known as a pre-synaptic molecule, this possibility is intriguing and novel for this system. However, it is based on the partial dissociation of AMPAR trafficking and synaptic response, and lacks strong support. On average, they saw similar magnitude of change in mEPSC amplitude and GluA2 cluster area and integral, but the GluA2 data was not significant due to higher variability. It is difficult to determine if this is due to biology or methodology - the imaging method involves assessing puncta pairs (GluA2/VGlut1) clearly associated with a MAP2 labeled dendrite. This is a small subset of synapses, with usually less than 20 synapses per neuron analyzed, which would be expected to be more variable than mEPSC recordings averaged across several hundred events. However, when they reduce the mEPSC number of events to similar numbers as the imaging, the mESPC amplitudes are still less variable than the imaging data. The reason for this remains unclear. The pool of sampled synapses is still different between the methods and recent data has shown that synapses have variable responses during HSP. Further, there could be variability in the subunit composition of newly inserted AMPARs, and only assessing GluA2 could mask this (see below). It is intriguing that pre-synaptic changes might contribute to HSP, especially given the likely localization of Rab3A. But it remains difficult to distinguish if the apparent difference in imaging and electrophysiology is a methodological issue rather than a biological one. Stronger data, especially positive data on changes in release, will be necessary to conclude that pre-synaptic factors are required for HSP, beyond the established changes in post-synaptic receptor trafficking. Specific deletion of Rab3A from pre-synaptic neurons would also be highly informative.
Other questions arise from the NASPM experiments, used to justify looking at GluA2 (and not GluA1) in the immunostaining. First, there is a strong frequency effect that is unclear in origin. One would expect NASPM to merely block some fraction of the post-synaptic current, and not affect pre-synaptic release or block whole synapses. But the change in frequency seems to argue (as the authors do) that some synapses only have CP-AMPARs, while the rest of the synapses have few or none. Another possibility is that there are pre-synaptic NASPM-sensitive receptors that influence release probability. Further, the amplitude data show a strong trend towards smaller amplitude following NASPM treatment (Fig 3B). The p value for both control and TTX neurons was 0.08 - it is very difficult to argue that there is no effect. And the decrease on average is larger in the TTX neurons, and some cells show a strong effect. It is possible there is some heterogeneity between neurons on whether GluA1/A2 heteromers or GluA1 homomers are added during HSP. This would impact the conclusions about the GluA2 imaging as compared to the mEPSC amplitude data.
To understand the role of Rab3A in HSP will require addressing two main issues:
(1) Is Rab3A acting pre-synaptically, post-synaptically or both? The authors provide good evidence that Rab3A is acting within neurons and not astrocytes. But where it is acting (pre or post) would aid substantially in understanding its role. The general view in the field has been that HSP is regulated post-synaptically via regulation of AMPAR trafficking, and considerable evidence supports this view. More concrete support for the authors suggestion of a pre-synaptic site of control would be helpful.
(2) Rab3A is also found at inhibitory synapses. It would be very informative to know if HSP at inhibitory synapses is similarly affected. This is particularly relevant as at inhibitory synapses, one expects a removal of GABARs or a decrease in GABA release (ie the opposite of whatever is happening at excitatory synapses). If both processes are regulated by Rab3A, this might suggest a role for this protein more upstream in the signaling; an effect only at excitatory synapses would argue for a more specific role just at those synapses.
Comments on revisions:
The section on TNF is a bit odd. The data on the astrocyte deletion of Rab3A only argues that Rab3A is unlikely to regulate TNF release. But it could easily be downstream of the neuronal TNF receptor. Without any data addressing the TNF response, it seems quite premature to argue that Rab3A is part of a TNF-independent pathway.
The section title (line 506-7) declaring Rab3A as the first presynaptic protein involved in HSP is also premature, as they don't know it is acting pre-synaptically.
-
Author response:
The following is the authors’ response to the previous reviews
General Response to Reviewers:
We thank the Reviewers for their comments, which continue to substantially improve the quality and clarity of the manuscript, and therefore help us to strengthen its message while acknowledging alternative explanations.
All three reviewers raised the concern that we have not proven that Rab3A is acting on a presynaptic mechanism to increase mEPSC amplitude after TTX treatment of mouse cortical cultures. The reviewers’ main point is that we have not shown a lack of upregulation of postsynaptic receptors in mouse cortical cultures. We want to stress that we agree that postsynaptic receptors are upregulated after activity block in neuronal cultures. However, the reviewers are not acknowledging that we have previously presented …
Author response:
The following is the authors’ response to the previous reviews
General Response to Reviewers:
We thank the Reviewers for their comments, which continue to substantially improve the quality and clarity of the manuscript, and therefore help us to strengthen its message while acknowledging alternative explanations.
All three reviewers raised the concern that we have not proven that Rab3A is acting on a presynaptic mechanism to increase mEPSC amplitude after TTX treatment of mouse cortical cultures. The reviewers’ main point is that we have not shown a lack of upregulation of postsynaptic receptors in mouse cortical cultures. We want to stress that we agree that postsynaptic receptors are upregulated after activity block in neuronal cultures. However, the reviewers are not acknowledging that we have previously presented strong evidence at the mammalian NMJ that there is no increase in AChR after activity blockade, and therefore the requirement for Rab3A in the homeostatic increase in quantal amplitude points to a presynaptic contribution. We agree that we should restrict our firmest conclusions to the data in the current study, but in the Discussion we are proposing interpretations. We have added the following new text:
“The impetus for our current study was two previous studies in which we examined homeostatic regulation of quantal amplitude at the NMJ. An advantage of studying the NMJ is that synaptic ACh receptors are easily identified with fluorescently labeled alpha-bungarotoxin, which allows for very accurate quantification of postsynaptic receptor density. We were able to detect a known change due to mixing 2 colors of alpha-BTX to within 1% (Wang et al., 2005). Using this model synapse, we showed that there was no increase in synaptic AChRs after TTX treatment, whereas miniature endplate current increased 35% (Wang et al., 2005). We further showed that the presynaptic protein Rab3A was necessary for full upregulation of mEPC amplitude (Wang et al., 2011). These data strongly suggested Rab3A contributed to homeostatic upregulation of quantal amplitude via a presynaptic mechanism. With the current study showing that Rab3A is required for the homeostatic increase in mEPSC amplitude in cortical cultures, one interpretation is that in both situations, Rab3A is required for an increase in the presynaptic quantum.”
The point we are making is that the current manuscript is an extension of that work and interpretation of our findings regarding the variability of upregulation of postsynaptic receptors in our mouse cortical cultures further supports the idea that there is a Rab3Adependent presynaptic contribution to homeostatic increases in quantal amplitude.
Public Reviews:
Reviewer #1 (Public review):
Koesters and colleagues investigated the role of the small GTPase Rab3A in homeostatic scaling of miniature synaptic transmission in primary mouse cortical cultures using electrophysiology and immunohistochemistry. The major finding is that TTX incubation for 48 hours does not induce an increase in the amplitude of excitatory synaptic miniature events in neuronal cortical cultures derived from Rab3A KO and Rab3A Earlybird mutant mice. NASPM application had comparable effects on mEPSC amplitude in control and after TTX, implying that Ca2+-permeable glutamate receptors are unlikely modulated during synaptic scaling. Immunohistochemical analysis revealed no significant changes in GluA2 puncta size, intensity, and integral after TTX treatment in control and Rab3A KO cultures. Finally, they provide evidence that loss of Rab3A in neurons, but not astrocytes, blocks homeostatic scaling. Based on these data, the authors propose a model in which neuronal Rab3A is required for homeostatic scaling of synaptic transmission, potentially through GluA2-independent mechanisms.
The major finding - impaired homeostatic up-scaling after TTX treatment in Rab3A KO and Rab3 earlybird mutant neurons - is supported by data of high quality. However, the paper falls short of providing any evidence or direction regarding potential mechanisms. The data on GluA2 modulation after TTX incubation are likely statistically underpowered, and do not allow drawing solid conclusions, such as GluA2-independent mechanisms of up-scaling.
The study should be of interest to the field because it implicates a presynaptic molecule in homeostatic scaling, which is generally thought to involve postsynaptic neurotransmitter receptor modulation. However, it remains unclear how Rab3A participates in homeostatic plasticity.
Major (remaining) point:
(1) Direct quantitative comparison between electrophysiology and GluA2 imaging data is complicated by many factors, such as different signal-to-noise ratios. Hence, comparing the variability of the increase in mini amplitude vs. GluA2 fluorescence area is not valid. Thus, I recommend removing the sentence "We found that the increase in postsynaptic AMPAR levels was more variable than that of mEPSC amplitudes, suggesting other factors may contribute to the homeostatic increase in synaptic strength." from the abstract.
We have not removed the statement, but altered it to soften the conclusion. It now reads, “We found that the increase in postsynaptic AMPAR levels in wild type cultures was more variable than that of mEPSC amplitudes, which might be explained by a presynaptic contribution, but we cannot rule out variability in the measurement.”.
Similarly, the data do not directly support the conclusion of GluA2-independent mechanisms of homeostatic scaling. Statements like "We conclude that these data support the idea that there is another contributor to the TTX- induced increase in quantal size." should be thus revised or removed.
This particular statement is in the previous response to reviewers only, we deleted the sentence that starts, “The simplest explanation Rab3A regulates a presynaptic contributor….”. and “Imaging of immunofluorescence more variable…”. We deleted “ our data suggest….consistently leads to an increase in mEPSC amplitude and sometimes leads to….” We added “…the lack of a robust increase in receptor levels leaves open the possibility that there is a presynaptic contributor to quantal size in mouse cortical cultures. However, the variability could arise from technical factors associated with the immunofluorescence method, and the mechanism of Rab3A-dependent plasticity could be presynaptic for the NMJ and postsynaptic for cortical neurons.”
Reviewer #2 (Public review):
I thank the authors for their efforts in the revision. In general, I believe the main conclusion that Rab3A is required for TTX-induced homeostatic synaptic plasticity is wellsupported by the data presented, and this is an important addition to the repertoire of molecular players involved in homeostatic compensations. I also acknowledge that the authors are more cautious in making conclusions based on the current evidence, and the structure and logic have been much improved.
The only major concern I have still falls on the interpretation of the mismatch between GluA2 cluster size and mEPSC amplitude. The authors argue that they are only trying to say that changes in the cluster size are more variable than those in the mEPSC amplitude, and they provide multiple explanations for this mismatch. It seems incongruous to state that the simplest explanation is a presynaptic factor when you have all these alternative factors that very likely have contributed to the results. Further, the authors speculate in the discussion that Rab3A does not regulate postsynaptic GluA2 but instead regulates a presynaptic contributor. Do the authors mean that, in their model, the mEPSC amplitude increases can be attributed to two factors- postsynaptic GluA2 regulation and a presynaptic contribution (which is regulated by Rab3A)? If so, and Rab3A does not affect GluA2 whatsoever, shouldn't we see GluA2 increase even in the absence of Rab3A? The data in Table 1 seems to indicate otherwise.
The main body of this comment is addressed in the General Response to Reviewers. In addition, we deleted text “current data, coupled with our previous findings at the mouse neuromuscular junction, support the idea that there are additional sources contributing to the homeostatic increase in quantal size.” We added new text, so the sentence now reads: “Increased receptors likely contribute to increases in mESPC amplitudes in mouse cortical cultures, but because we do not have a significant increase in GluA2 receptors in our experiments, it is impossible to conclude that the increase is lacking in cultures from Rab3A-/- neurons.”
I also question the way the data are presented in Figure 5. The authors first compare 3 cultures and then 5 cultures altogether, if these experiments are all aimed to answer the same research question, then they should be pooled together. Interestingly, the additional two cultures both show increases in GluA2 clusters, which makes the decrease in culture #3 even more perplexing, for which the authors comment in line 261 that this is due to other factors. Shouldn't this be an indicator that something unusual has happened in this culture?
Data in this figure is sufficient to support that GluA2 increases are variable across cultures, which hardly adds anything new to the paper or to the field.
A major goal of performing the immunofluorescence measurements in the same cultures for which we had electrophysiological results was to address the common impression that the homeostatic effect itself is highly variable, as the reviewer notes in the comment “…GluA2 increases are variable across cultures…” Presumably, if GluA2 increases are the mechanism of the mEPSC amplitude increases, then variable GluA2 increases should correlate with variable mEPSC amplitude increases, but that is not what we observed. We are left with the explanation that the immunofluorescence method itself is very variable. We have added the point to the Discussion, which reads, “the variability could arise from technical factors associated with the immunofluorescence method, and the mechanism of Rab3A-dependent homeostatic plasticity could be presynaptic for the NMJ and postsynaptic for cortical neurons.”
Finally, the implication of “Shouldn’t this be an indicator that something unusual has happened in this culture?” if it is not due to culture to culture variability in the homeostatic response itself, is that there was a technical problem with accurately measuring receptor levels. We have no reason to suspect anything was amiss in this set of coverslips (the values for controls and for TTX-treated were not outside the range of values in other experiments). In any of the coverslips, there may be variability in the amount of primary anti-GluA2 antibody, as this was added directly to the culture rather than prepared as a diluted solution and added to all the coverslips. But to remove this one experiment because it did not give the expected result is to allow bias to direct our data selection.
The authors further cite a study with comparable sample sizes, which shows a similar mismatch based on p values (Xu and Pozzo-Miller 2007), yet the effect sizes in this study actually match quite well (both ~160%). P values cannot be used to show whether two effects match, but effect sizes can. Therefore, the statement in lines 411-413 "... consistently leads to an increase in mEPSC amplitudes, and sometimes leads to an increase in synaptic GluA2 receptor cluster size" is not very convincing, and can hardly be used to support "the idea that there are additional sources contributing to the homeostatic increase in quantal size.”
We have the same situation; our effect sizes match (19.7% increase for mEPSC amplitude; 18.1% increase for GluA2 receptor cluster size, see Table 1), but in our case, the p value for receptors does not reach statistical significance. Our point here is that there is published evidence that the variability in receptor measurements is greater than the variability in electrophysiological measurements. But we have softened this point, removing the sentences containing “…consistently leads and sometimes...” and “……additional sources contributing…”.
I would suggest simply showing mEPSC and immunostaining data from all cultures in this experiment as additional evidence for homeostatic synaptic plasticity in WT cultures, and leave out the argument for "mismatch". The presynaptic location of Rab3A is sufficient to speculate a presynaptic regulation of this form of homeostatic compensation.
We have removed all uses of the word “mismatch,” but feel the presentation of the 3 matched experiments, 23-24 cells (Figure 5A, D), and the additional 2 experiments for a total of 5 cultures, 48-49 cells (Figure 5C, F), is important in order to demonstrate that the lack of statistically significant receptor response is due neither to a variable homeostatic response in the mEPSC amplitudes, nor to a small number of cultures.
Minor concerns:
(1) Line 214, I see the authors cite literature to argue that GluA2 can form homomers and can conduct currents. While GluA2 subunits edited at the Q/R site (they are in nature) can form homomers with very low efficiency in exogenous systems such as HEK293 cells (as done in the cited studies), it's unlikely for this to happen in neurons (they can hardly traffic to synapses if possible at all).
We were unable to identify a key reference that characterized GluA2 homomers vs. heteromers in native cortical neurons, but we have rewritten the section in the manuscript to acknowledge the low conductance of homomers:
“…to assess whether GluA2 receptor expression, which will identify GluA2 homomers and GluA2 heteromers (the former unlikely to contribute to mEPSCs given their low conductance relative to heteromers (Swanson et al., 1997; Mansour et al., 2001)…”
(2) Lines 221-222, the authors may have misinterpreted the results in Turrigiano 1998. This study does not show that the increase in receptors is most dramatic in the apical dendrite, in fact, this is the only region they have tested. The results in Figures 3b-c show that the effect size is independent of the distance from soma.
Figure 3 in Turrigiano et al., shows that the increase in glutamate responsiveness is higher at the cell body than along the primary dendrite. We have revised our description to indicate that an increase in responsiveness on the primary dendrite has been demonstrated in Turrigiano et al. 1998.
“We focused on the primary dendrite of pyramidal neurons as a way to reduce variability that might arise from being at widely ranging distances from the cell body, or, from inadvertently sampling dendritic regions arising from inhibitory neurons. In addition, it has been shown that there is a clear increase in response to glutamate in this region (Turrigiano et al., 1998).”
“…synaptic receptors on the primary dendrite, where a clear increase in sensitivity to exogenously applied glutamate was demonstrated (see Figure 3 in (Turrigiano et al., 1998)).
(3) Lines 309-310 (and other places mentioning TNFa), the addition of TNFa to this experiment seems out of place. The authors have not performed any experiment to validate the presence/absence of TNFa in their system (citing only 1 study from another lab is insufficient). Although it's convincing that glia Rab3A is not required for homeostatic plasticity here, the data does not suggest Rab3A's role (or the lack of) for TNFa in this process.
We have modified the paragraph in the Discussion that addresses the glial results, to describe more clearly the data that supported an astrocytic TNF-alpha mechanism: “TNF-alpha accumulates after activity blockade, and directly applied to neuronal cultures, can cause an increase in GluA1 receptors, providing a potential mechanism by which activity blockade leads to the homeostatic upregulation of postsynaptic receptors (Beattie et al., 2002; Stellwagen et al., 2005; Stellwagen and Malenka, 2006).”
We have also acknowledged that we cannot rule out TNF-alpha coming from neurons in the cortical cultures: “…suggesting the possibility that neuronal Rab3A can act via a non-TNF-alpha mechanism to contribute to homeostatic regulation of quantal amplitude, although we have not ruled out a neuronal Rab3A-mediated TNF-alpha pathway in cortical cultures.”
Reviewer #3 (Public review):
This manuscript presents a number of interesting findings that have the potential to increase our understanding of the mechanism underlying homeostatic synaptic plasticity (HSP). The data broadly support that Rab3A plays a role in HSP, although the site and mechanism of action remain uncertain.
The authors clearly demonstrate that Rab3A plays a role in HSP at excitatory synapses, with substantially less plasticity occurring in the Rab3A KO neurons. There is also no apparent HSP in the Earlybird Rab3A mutation, although baseline synaptic strength is already elevated. In this context, it is unclear if the plasticity is absent, already induced by this mutation, or just occluded by a ceiling effect due to the synapses already being strengthened. Occlusion may also occur in the mixed cultures when Rab3A is missing from neurons but not astrocytes. The authors do appropriately discuss these options. The authors have solid data showing that Rab3A is unlikely to be active in astrocytes, Finally, they attempt to study the linkage between changes in synaptic strength and AMPA receptor trafficking during HSP, and conclude that trafficking may not be solely responsible for the changes in synaptic strength during HSP.
Strengths:
This work adds another player into the mechanisms underlying an important form of synaptic plasticity. The plasticity is likely only reduced, suggesting Rab3A is only partially required and perhaps multiple mechanisms contribute. The authors speculate about some possible novel mechanisms, including whether Rab3A is active pre-synaptically to regulate quantal amplitude.
As Rab3A is primarily known as a pre-synaptic molecule, this possibility is intriguing. However, it is based on the partial dissociation of AMPAR trafficking and synaptic response and lacks strong support. On average, they saw a similar magnitude of change in mEPSC amplitude and GluA2 cluster area and integral, but the GluA2 data was not significant due to higher variability. It is difficult to determine if this is due to biology or methodology - the imaging method involves assessing puncta pairs (GluA2/VGlut1) clearly associated with a MAP2 labeled dendrite. This is a small subset of synapses, with usually less than 20 synapses per neuron analyzed, which would be expected to be more variable than mEPSC recordings averaged across several hundred events. However, when they reduce the mEPSC number of events to similar numbers as the imaging, the mESPC amplitudes are still less variable than the imaging data. The reason for this remains unclear. The pool of sampled synapses is still different between the methods and recent data has shown that synapses have variable responses during HSP. Further, there could be variability in the subunit composition of newly inserted AMPARs, and only assessing GluA2 could mask this (see below). It is intriguing that pre-synaptic changes might contribute to HSP, especially given the likely localization of Rab3A. But it remains difficult to distinguish if the apparent difference in imaging and electrophysiology is a methodological issue rather than a biological one. Stronger data, especially positive data on changes in release, will be necessary to conclude that pre-synaptic factors are required for HSP, beyond the established changes in post-synaptic receptor trafficking.
Regarding the concern that the lack of increase in receptors is due to a technical issue, please see General Response to Reviewers, above. We have also softened our conclusions throughout, acknowledging we cannot rule out a technical issue.
Other questions arise from the NASPM experiments, used to justify looking at GluA2 (and not GluA1) in the immunostaining. First, there is a strong frequency effect that is unclear in origin. One would expect NASPM to merely block some fraction of the post-synaptic current, and not affect pre-synaptic release or block whole synapses. But the change in frequency seems to argue (as the authors do) that some synapses only have CP-AMPARs, while the rest of the synapses have few or none. Another possibility is that there are pre-synaptic NASPM-sensitive receptors that influence release probability. Further, the amplitude data show a strong trend towards smaller amplitude following NASPM treatment (Fig 3B). The p value for both control and TTX neurons was 0.08 - it is very difficult to argue that there is no effect. The decrease on average is larger in the TTX neurons, and some cells show a strong effect. It is possible there is some heterogeneity between neurons on whether GluA1/A2 heteromers or GluA1 homomers are added during HSP. This would impact the conclusions about the GluA2 imaging as compared to the mEPSC amplitude data.
The key finding in Figure 3 is that NASPM did not eliminate the statistically significant increase in mEPSC amplitude after TTX treatment (Fig 3A). Whether or not NASPM sensitive receptors contribute to mESPC amplitude is a separate question (Fig 3B). We are open to the possibility that NASPM reduces mEPSC amplitude in both control and TTX treated cells (p = 0.08 for both), but that does not change our conclusion that NASPM has no effect on the TTX-induced increase in mEPSC amplitude. The mechanism underlying the decrease in mEPSC frequency following NASPM is interesting, but does not alter our conclusions regarding the role of Rab3A in homeostatic synaptic plasticity of mEPSC amplitude. In addition, the Reviewer does not acknowledge the Supplemental Figure #1, which shows a similar lack of correspondence between homeostatic increases in mEPSC amplitude and GluA1 receptors in two cultures where matched data were obtained. Therefore, we do not think our lack of a robust increase in receptors can be explained by our failing to look at the relevant receptor.
To understand the role of Rab3A in HSP will require addressing two main issues:
(1) Is Rab3A acting pre-synaptically, post-synaptically or both? The authors provide good evidence that Rab3A is acting within neurons and not astrocytes. But where it is acting (pre or post) would aid substantially in understanding its role. The general view in the field has been that HSP is regulated post-synaptically via regulation of AMPAR trafficking, and considerable evidence supports this view. More concrete support for the authors' suggestion of a pre-synaptic site of control would be helpful.
We agree that definitive evidence for a presynaptic role of Rab3A in homeostatic plasticity of mEPSC amplitudes in mouse cortical cultures requires demonstrating that loss of Rab3A in postsynaptic neurons does not disrupt the plasticity, whereas loss in presynaptic neurons does. Without these data, we can only speculate that the Rab3A-dependence of homeostatic plasticity of quantal size in cortical neurons may be similar to that of the neuromuscular junction, where it cannot be receptors. We have added to the Discussion that the mechanism of Rab3A regulation of homeostatic plasticity of quantal amplitude could different between cortical neurons and the neuromuscular junction (lines 448-450 in markup,). Establishing a way to co-culture Rab3A-/- and Rab3A+/+ neurons in ratios that would allow us to record from a Rab3A-/- neuron that has mainly Rab3A+/+ inputs (or vice versa) is not impossible, but requires either transfection or transgenic expression with markers that identify the relevant genotype, and will be the subject of future experiments.
(2): Rab3A is also found at inhibitory synapses. It would be very informative to know if HSP at inhibitory synapses is similarly affected. This is particularly relevant as at inhibitory synapses, one expects a removal of GABARs or a decrease in GABA release (ie the opposite of whatever is happening at excitatory synapses). If both processes are regulated by Rab3A, this might suggest a role for this protein more upstream in the signaling; an effect only at excitatory synapses would argue for a more specific role just at those synapses.
We agree with the Reviewer, that it is important to determine the generality of Rab3A function in homeostatic plasticity. Establishing the homeostatic effect on mIPSCs and then examining them in Rab3A-/- cultures is a large undertaking and will be the subject of future experiments.
Recommendations for the authors:
Reviewer #1 (Recommendations for the authors):
Minor (remaining) points:
(1) The figure referenced in the first response to the reviewers (Figure 5G) does not exist.
We meant Figure 5F, which has been corrected in the current response.
(2) I recommend showing the data without binning (despite some overlap).
The box plot in Origin will not allow not binning, but we can make the bin size so small that for all intents and purposes, there is close to 1 sample in each bin. When we do this, the majority of data are overlapped in a straight vertical line. Previously described concerns were regarding the gaps in the data, but it should be noted that these are cell means and we are not depicting the distributions of mEPSC amplitudes within a recording or across multiple recordings.
(3) Please auto-scale all axes from 0 (e.g., Fig 1E, F).
We have rescaled all mEPSC amplitude axes in box plots to go from 0 (Figures 1, 2 and 6).
(4) Typo in Figure legend 3: "NASPM (20 um)" => uM
Fixed.
Reviewer #2 (Recommendations for the authors):
(1) Line 140, frequencies are reported in Hz while other places are in sec-1, while these are essentially the same, they should be kept consistent in writing.
All mEPSC frequencies have been changed to sec-1, except we have left “Hz” for repetitive stimulation and filtering.
(2) Paragraph starting from line 163 (as well as other places where multiple groups are compared, such as the occlusion discussion), the authors assessed whether there was a change in baseline between WT and mutant group by doing pairwise tests, this is not the right test. A two-way ANOVA, or at least a multivariant test would be more appropriate.
We have performed a two-way ANOVA, with genotype as one factor, and treatment as the other factor. The p values in Figures 1 and 2 have been revised to reflect p values from the post-hoc Tukey test on the specific interactions (for each particular genotype, TTX vs CON effects). The difference in the two WT strains, untreated, was not significant in the Post-Hoc Tukey test, and we have revised the text. The difference between the untreated WT from the Rab3A+/Ebd colony and the untreated Rab3AEbd/Ebd mutant was still significant in the Post-Hoc Tukey test, and this has replaced the Kruskal-Wallis test. The two-way ANOVA was also applied to the neuron-glia experiments and p values in Figure 6 adjusted accordingly.
(3) Relevant to the second point under minor concerns, I suggest this sentence be removed, as reducing variability and avoiding inhibitory projects are reasons good enough to restrict the analysis to the apical dendrites.
We have revised the description of the Turrigiano et al., 1998 finding from their Figure 3 and feel it still strengthens the justification for choosing to analyze only synapses on the apical dendrite.
Reviewer #3 (Recommendations for the authors):
Minor points:
The comments on lines 256-7 could seem misleading - the NASPM results wouldn't rule out contribution of those other subunits, only non-GluA2 containing combinations of those subunits. I would suggest revising this statement. Also, NASPM does likely have an effect, just not one that changes much with TTX treatment.
At new line 213 (markup) we have added the modifier “homomeric” to clarify our point that the lack of NASPM effect on the increase in mEPSC amplitude after TTX indicates that the increase is not due to more homomeric Ca2+-permeable receptors. We have always stated that NASPM reduces mEPSC amplitude, but it is in both control and treated cultures.
Strong conclusions based on a single culture (lines 314-5) seem unwarranted.
We have softened this statement with a “suggesting that” substituted for the previous “Therefore,” but stand by our point that the mEPSC amplitude data support a homeostatic effect of TTX in Culture #3, so the lack of increase in GluA2 cluster size needs an explanation other than variability in the homeostatic effect itself.
Saying (line 554) something is 'the only remaining possibility' also seems unwarranted.
We have softened this statement to read, “A remaining possibility…”.
Beattie EC, Stellwagen D, Morishita W, Bresnahan JC, Ha BK, Von Zastrow M, Beattie MS, Malenka RC (2002) Control of synaptic strength by glial TNFalpha. Science 295:2282-2285.
Mansour M, Nagarajan N, Nehring RB, Clements JD, Rosenmund C (2001) Heteromeric AMPA receptors assemble with a preferred subunit stoichiometry and spatial arrangement. Neuron 32:841-853. Stellwagen D, Malenka RC (2006) Synaptic scaling mediated by glial TNF-alpha. Nature 440:1054-1059.
Stellwagen D, Beattie EC, Seo JY, Malenka RC (2005) Differential regulation of AMPA receptor and GABA receptor trafficking by tumor necrosis factor-alpha. J Neurosci 25:3219-3228.
Swanson GT, Kamboj SK, Cull-Candy SG (1997) Single-channel properties of recombinant AMPA receptors depend on RNA editing, splice variation, and subunit composition. J Neurosci 17:5869.
Turrigiano GG, Leslie KR, Desai NS, Rutherford LC, Nelson SB (1998) Activity-dependent scaling of quantal amplitude in neocortical neurons. Nature 391:892-896.
Wang X, Wang Q, Yang S, Bucan M, Rich MM, Engisch KL (2011) Impaired activity-dependent plasticity of quantal amplitude at the neuromuscular junction of Rab3A deletion and Rab3A earlybird mutant mice. J Neurosci 31:3580-3588.
Wang X, Li Y, Engisch KL, Nakanishi ST, Dodson SE, Miller GW, Cope TC, Pinter MJ, Rich MM (2005) Activity-dependent presynaptic regulation of quantal size at the mammalian neuromuscular junction in vivo. J Neurosci 25:343-351.
-
eLife Assessment
This study presents valuable findings on the role of the small GTPase Rab3A in homeostatic plasticity. While the study demonstrates that Rab3A is required for homeostatic scaling, the evidence supporting the model put forward by the authors is incomplete. The work will be of interest to researchers in the field of synaptic transmission and plasticity.
-
Reviewer #1 (Public review):
Koesters and colleagues investigated the role of the small GTPase Rab3A in homeostatic scaling of miniature synaptic transmission in primary mouse cortical cultures using electrophysiology and immunohistochemistry. The major finding is that TTX incubation for 48 hours does not induce an increase in the amplitude of excitatory synaptic miniature events in neuronal cortical cultures derived from Rab3A KO and Rab3A Earlybird mutant mice. NASPM application had comparable effects on mEPSC amplitude in control and after TTX, implying that Ca2+-permeable glutamate receptors are unlikely modulated during synaptic scaling. Immunohistochemical analysis revealed no significant changes in GluA2 puncta size, intensity, and integral after TTX treatment in control and Rab3A KO cultures. Finally, they provide evidence that …
Reviewer #1 (Public review):
Koesters and colleagues investigated the role of the small GTPase Rab3A in homeostatic scaling of miniature synaptic transmission in primary mouse cortical cultures using electrophysiology and immunohistochemistry. The major finding is that TTX incubation for 48 hours does not induce an increase in the amplitude of excitatory synaptic miniature events in neuronal cortical cultures derived from Rab3A KO and Rab3A Earlybird mutant mice. NASPM application had comparable effects on mEPSC amplitude in control and after TTX, implying that Ca2+-permeable glutamate receptors are unlikely modulated during synaptic scaling. Immunohistochemical analysis revealed no significant changes in GluA2 puncta size, intensity, and integral after TTX treatment in control and Rab3A KO cultures. Finally, they provide evidence that loss of Rab3A in neurons, but not astrocytes, blocks homeostatic scaling. Based on these data, the authors propose a model in which neuronal Rab3A is required for homeostatic scaling of synaptic transmission, potentially through GluA2-independent mechanisms.
The major finding - impaired homeostatic up-scaling after TTX treatment in Rab3A KO and Rab3 earlybird mutant neurons - is supported by data of high quality. However, the paper falls short of providing any evidence or direction regarding potential mechanisms. The data on GluA2 modulation after TTX incubation are likely statistically underpowered, and do not allow drawing solid conclusions, such as GluA2-independent mechanisms of up-scaling.
The study should be of interest to the field because it implicates a presynaptic molecule in homeostatic scaling, which is generally thought to involve postsynaptic neurotransmitter receptor modulation. However, it remains unclear how Rab3A participates in homeostatic plasticity.
Major (remaining) point:
(1) Direct quantitative comparison between electrophysiology and GluA2 imaging data is complicated by many factors, such as different signal-to-noise ratios. Hence, comparing the variability of the increase in mini amplitude vs. GluA2 fluorescence area is not valid. Thus, I recommend removing the sentence "We found that the increase in postsynaptic AMPAR levels was more variable than that of mEPSC amplitudes, suggesting other factors may contribute to the homeostatic increase in synaptic strength." from the abstract.
Similarly, the data do not directly support the conclusion of GluA2-independent mechanisms of homeostatic scaling. Statements like "We conclude that these data support the idea that there is another contributor to the TTX- induced increase in quantal size." should be thus revised or removed. -
Reviewer #2 (Public review):
I thank the authors for their efforts in the revision. In general, I believe the main conclusion that Rab3A is required for TTX-induced homeostatic synaptic plasticity is well-supported by the data presented, and this is an important addition to the repertoire of molecular players involved in homeostatic compensations. I also acknowledge that the authors are more cautious in making conclusions based on the current evidence, and the structure and logic have been much improved.
The only major concern I have still falls on the interpretation of the mismatch between GluA2 cluster size and mEPSC amplitude. The authors argue that they are only trying to say that changes in the cluster size are more variable than those in the mEPSC amplitude, and they provide multiple explanations for this mismatch. It seems …
Reviewer #2 (Public review):
I thank the authors for their efforts in the revision. In general, I believe the main conclusion that Rab3A is required for TTX-induced homeostatic synaptic plasticity is well-supported by the data presented, and this is an important addition to the repertoire of molecular players involved in homeostatic compensations. I also acknowledge that the authors are more cautious in making conclusions based on the current evidence, and the structure and logic have been much improved.
The only major concern I have still falls on the interpretation of the mismatch between GluA2 cluster size and mEPSC amplitude. The authors argue that they are only trying to say that changes in the cluster size are more variable than those in the mEPSC amplitude, and they provide multiple explanations for this mismatch. It seems incongruous to state that the simplest explanation is a presynaptic factor when you have all these alternative factors that very likely have contributed to the results. Further, the authors speculate in the discussion that Rab3A does not regulate postsynaptic GluA2 but instead regulates a presynaptic contributor. Do the authors mean that, in their model, the mEPSC amplitude increases can be attributed to two factors- postsynaptic GluA2 regulation and a presynaptic contribution (which is regulated by Rab3A)? If so, and Rab3A does not affect GluA2 whatsoever, shouldn't we see GluA2 increase even in the absence of Rab3A? The data in Table 1 seems to indicate otherwise.
I also question the way the data are presented in Figure 5. The authors first compare 3 cultures and then 5 cultures altogether, if these experiments are all aimed to answer the same research question, then they should be pooled together. Interestingly, the additional two cultures both show increases in GluA2 clusters, which makes the decrease in culture #3 even more perplexing, for which the authors comment in line 261 that this is due to other factors. Shouldn't this be an indicator that something unusual has happened in this culture? Data in this figure is sufficient to support that GluA2 increases are variable across cultures, which hardly adds anything new to the paper or to the field. The authors further cite a study with comparable sample sizes, which shows a similar mismatch based on p values (Xu and Pozzo-Miller 2007), yet the effect sizes in this study actually match quite well (both ~160%). P values cannot be used to show whether two effects match, but effect sizes can. Therefore, the statement in lines 411-413 "... consistently leads to an increase in mEPSC amplitudes, and sometimes leads to an increase in synaptic GluA2 receptor cluster size" is not very convincing, and can hardly be used to support "the idea that there are additional sources contributing to the homeostatic increase in quantal size".
I would suggest simply showing mEPSC and immunostaining data from all cultures in this experiment as additional evidence for homeostatic synaptic plasticity in WT cultures, and leave out the argument for "mismatch". The presynaptic location of Rab3A is sufficient to speculate a presynaptic regulation of this form of homeostatic compensation.
Minor concerns:
(1) Line 214, I see the authors cite literature to argue that GluA2 can form homomers and can conduct currents. While GluA2 subunits edited at the Q/R site (they are in nature) can form homomers with very low efficiency in exogenous systems such as HEK293 cells (as done in the cited studies), it's unlikely for this to happen in neurons (they can hardly traffick to synapses if possible at all).
(2) Lines 221-222, the authors may have misinterpreted the results in Turrigiano 1998. This study does not show that the increase in receptors is most dramatic in the apical dendrite, in fact, this is the only region they have tested. The results in Figures 3b-c show that the effect size is independent of the distance from soma.
(3) Lines 309-310 (and other places mentioning TNFa), the addition of TNFa to this experiment seems out of place. The authors have not performed any experiment to validate the presence/absence of TNFa in their system (citing only 1 study from another lab is insufficient). Although it's convincing that glia Rab3A is not required for homeostatic plasticity here, the data does not suggest Rab3A's role (or the lack of) for TNFa in this process.
-
Reviewer #3 (Public review):
This manuscript presents a number of interesting findings that have the potential to increase our understanding of the mechanism underlying homeostatic synaptic plasticity (HSP). The data broadly support that Rab3A plays a role in HSP, although the site and mechanism of action remain uncertain.
The authors clearly demonstrate that Rab3A plays a role in HSP at excitatory synapses, with substantially less plasticity occurring in the Rab3A KO neurons. There is also no apparent HSP in the Earlybird Rab3A mutation, although baseline synaptic strength is already elevated. In this context, it is unclear if the plasticity is absent, already induced by this mutation, or just occluded by a ceiling effect due to the synapses already being strengthened. Occlusion may also occur in the mixed cultures when Rab3A is …
Reviewer #3 (Public review):
This manuscript presents a number of interesting findings that have the potential to increase our understanding of the mechanism underlying homeostatic synaptic plasticity (HSP). The data broadly support that Rab3A plays a role in HSP, although the site and mechanism of action remain uncertain.
The authors clearly demonstrate that Rab3A plays a role in HSP at excitatory synapses, with substantially less plasticity occurring in the Rab3A KO neurons. There is also no apparent HSP in the Earlybird Rab3A mutation, although baseline synaptic strength is already elevated. In this context, it is unclear if the plasticity is absent, already induced by this mutation, or just occluded by a ceiling effect due to the synapses already being strengthened. Occlusion may also occur in the mixed cultures when Rab3A is missing from neurons but not astrocytes. The authors do appropriately discuss these options. The authors have solid data showing that Rab3A is unlikely to be active in astrocytes, Finally, they attempt to study the linkage between changes in synaptic strength and AMPA receptor trafficking during HSP, and conclude that trafficking may not be solely responsible for the changes in synaptic strength during HSP.
Strengths:
This work adds another player into the mechanisms underlying an important form of synaptic plasticity. The plasticity is likely only reduced, suggesting Rab3A is only partially required and perhaps multiple mechanisms contribute. The authors speculate about some possible novel mechanisms, including whether Rab3A is active pre-synaptically to regulate quantal amplitude.
As Rab3A is primarily known as a pre-synaptic molecule, this possibility is intriguing. However, it is based on the partial dissociation of AMPAR trafficking and synaptic response and lacks strong support. On average, they saw a similar magnitude of change in mEPSC amplitude and GluA2 cluster area and integral, but the GluA2 data was not significant due to higher variability. It is difficult to determine if this is due to biology or methodology - the imaging method involves assessing puncta pairs (GluA2/VGlut1) clearly associated with a MAP2 labeled dendrite. This is a small subset of synapses, with usually less than 20 synapses per neuron analyzed, which would be expected to be more variable than mEPSC recordings averaged across several hundred events. However, when they reduce the mEPSC number of events to similar numbers as the imaging, the mESPC amplitudes are still less variable than the imaging data. The reason for this remains unclear. The pool of sampled synapses is still different between the methods and recent data has shown that synapses have variable responses during HSP. Further, there could be variability in the subunit composition of newly inserted AMPARs, and only assessing GluA2 could mask this (see below). It is intriguing that pre-synaptic changes might contribute to HSP, especially given the likely localization of Rab3A. But it remains difficult to distinguish if the apparent difference in imaging and electrophysiology is a methodological issue rather than a biological one. Stronger data, especially positive data on changes in release, will be necessary to conclude that pre-synaptic factors are required for HSP, beyond the established changes in post-synaptic receptor trafficking.
Other questions arise from the NASPM experiments, used to justify looking at GluA2 (and not GluA1) in the immunostaining. First, there is a strong frequency effect that is unclear in origin. One would expect NASPM to merely block some fraction of the post-synaptic current, and not affect pre-synaptic release or block whole synapses. But the change in frequency seems to argue (as the authors do) that some synapses only have CP-AMPARs, while the rest of the synapses have few or none. Another possibility is that there are pre-synaptic NASPM-sensitive receptors that influence release probability. Further, the amplitude data show a strong trend towards smaller amplitude following NASPM treatment (Fig 3B). The p value for both control and TTX neurons was 0.08 - it is very difficult to argue that there is no effect. The decrease on average is larger in the TTX neurons, and some cells show a strong effect. It is possible there is some heterogeneity between neurons on whether GluA1/A2 heteromers or GluA1 homomers are added during HSP. This would impact the conclusions about the GluA2 imaging as compared to the mEPSC amplitude data.
To understand the role of Rab3A in HSP will require addressing two main issues:
(1) Is Rab3A acting pre-synaptically, post-synaptically or both? The authors provide good evidence that Rab3A is acting within neurons and not astrocytes. But where it is acting (pre or post) would aid substantially in understanding its role. The general view in the field has been that HSP is regulated post-synaptically via regulation of AMPAR trafficking, and considerable evidence supports this view. More concrete support for the authors' suggestion of a pre-synaptic site of control would be helpful.
(2) Rab3A is also found at inhibitory synapses. It would be very informative to know if HSP at inhibitory synapses is similarly affected. This is particularly relevant as at inhibitory synapses, one expects a removal of GABARs or a decrease in GABA release (ie the opposite of whatever is happening at excitatory synapses). If both processes are regulated by Rab3A, this might suggest a role for this protein more upstream in the signaling; an effect only at excitatory synapses would argue for a more specific role just at those synapses.
-
Author response:
The following is the authors’ response to the previous reviews.
Since multiple Reviewers requested that the results describing effects of TTX treatment on GluA2 receptor levels detected by immunofluorescence and confocal imaging be revised, we have made substantial changes, which are described below. We believe the changes have greatly improved the manuscript and thank the reviewers for their comments.
Lack of significant increase in GluA2 receptor data is due to too few cultures sampled; anything could have happened [in one] particular dissociation. A concern that the TTX effect might vary greatly from culture to culture was why we felt it was important to match the receptor measurements on the same cultures that we recorded mEPSCs. We now present the culture means in Figure 5A (mEPSCs) and 5B (GluA2 receptor cluster …
Author response:
The following is the authors’ response to the previous reviews.
Since multiple Reviewers requested that the results describing effects of TTX treatment on GluA2 receptor levels detected by immunofluorescence and confocal imaging be revised, we have made substantial changes, which are described below. We believe the changes have greatly improved the manuscript and thank the reviewers for their comments.
Lack of significant increase in GluA2 receptor data is due to too few cultures sampled; anything could have happened [in one] particular dissociation. A concern that the TTX effect might vary greatly from culture to culture was why we felt it was important to match the receptor measurements on the same cultures that we recorded mEPSCs. We now present the culture means in Figure 5A (mEPSCs) and 5B (GluA2 receptor cluster size). These plots make it clear that the variability in the GluA2 receptor cluster size effect is not attributable to a failure of that culture to show a homeostatic effect. That is, the variability in GluA2 receptor effect is independent of the variability in mEPSC effect. To increase sample size, we examined 2 additional cultures for synaptic GluA2 receptor levels in control vs. TTX treatment. These cultures showed very modest increases (Figure 5C). When cell means from these experiments were pooled with those from the 3 matched cultures, the TTX effect was still not statistically significant (Figure 5G).
Lack of significant increase in GluA2 receptor data is due to the choice to restrict our analysis to the primary dendrite, close to the cell body. We restricted our analysis to the primary dendrite because Figure 3 in Turrigiano et al, 1998, shows the increased response to exogenously applied glutamate after TTX treatment is greatest close to the cell body and wanes as the glutamate is applied further away (added to Results, new lines 388-389).
Variability in GluA2 receptor data is due to the much smaller number of synapses sampled, compared to mEPSCs. We matched the sampling for mEPSC amplitude data to that of imaging data by taking only 20 samples from each electrophysiological recording. Each mEPSC represents one synapse; in a set of 20 mEPSCs some might come from the same synapse, so that we are sampling from £ 20 synapses. The effect of TTX on mEPSC amplitudes remained significant despite the reduced samples per cell (Figure 5A).
Why do we fail to show a significant increase in receptors when this has been shown in many studies?
We have added to our discussion the point that several studies, including Wang et al. 2019, use the number of puncta, rather than the number of cells, as the sample number. We ran an analysis of GluA2 receptor cluster size where we sampled multiple synapses per cell, and used the number of clusters as the sample n. We found that even with as few as 6 synapses randomly selected from each cell, the effect of TTX on GluA2 receptor cluster size became highly significant (p = 0.001 for data from 3 cultures and p = 0.005 for data from 5 cultures) (see new lines 400-406 in Discussion). In sum, our data are not very different from that of some previous studies. We are not arguing that receptors do not increase. Instead our point is that the increase is more variable than the increase in MESPC amplitude and thus takes a much bigger sample size to detect. In sum, the difference between the mEPSC data and the receptor data is that the mEPSC data consistently show a ~20-25% increase, whereas the receptor data do not always show an increase and sometimes the increase is only ~10%. Finally, we added two matched culture experiments examining synaptic GluA1 receptor cluster characteristics. GluA1 receptor cluster size decreased in one culture, and increased very modestly in the other (Supplemental Figure 1B), whereas mEPSC amplitude robustly increased (Supplemental Figure 1A; Results, new lines 265-268).
We conclude that these data support the idea that there is another contributor to the TTXinduced increase in quantal size.
Other changes in presentation of GluA2 receptor results: Since the effects on intensity and integral are of lesser magnitude than that on cluster size, we have removed these results from the graphs, although they are presented in Table 1. We have removed Figure 6, the presentation of individual culture results, since these results are now conveyed in Figure 5A-C. We have removed graphs depicting GluA2 receptor cluster size in response to TTX in Rab3A-/- cultures, but these data are still presented in Table 1.
We address other detailed comments below.
Public Reviews:
Reviewer #1 (Public review):
(2) The effects of Rab3A on TTX-induced mini frequency modulation remains unclear, because TTX does not induce a change in mini frequency in the Rab3A+/Ebd control (Fig. 2). The respective conclusions should be revised accordingly (l. 427).
The effects on mini frequency were added for completeness, but given the lack of consistently significant changes with TTX treatment or changes in the KO or Rab3AEbd/Ebd cultures, we have removed comment on these results from the Discussion.
(3) The model is still not supported by the data. In particular, data supporting a negative regulation of Rab3A by APs, Rab3A-dependent release of a tropic factor, or a Rab3Adependent increase in GluA2 abundance are not presented.
We have removed the model from the manuscript.
(4) Data points are not overlapping and appear "quantal" in most box plots. How were the data rounded?
The appearance of quantal variation in cell amplitude means is due to the binning that is part of the creation of the box plot. We have not remade the figures without binning, because the binning provides a visual depiction of the distribution of the data points. We have added the bin sizes to the appropriate figure legends.
Reviewer #2 (Public review):
However, the authors still have not provided further investigation of the mechanisms behind the role of Rab3A in this form of plasticity, and the revision therefore has added little to the significance of the study. Moreover, the experimental design for the investigation of the mismatch between mEPSC amplitude and GluA2 cluster fluorescence remains questionable, making it difficult to draw any credible conclusions from groups of data that not only look similar to the eye but also show no significance statistically.
To our knowledge, no other study has matched measurements of mEPSC amplitude in the same cultures where synaptic receptor levels were assessed. As stated above, we have revised the presentation of GluA2 receptor results, concluding from the lack of significant effects on receptor levels that the mEPSC amplitude increase cannot be fully explained by the receptor data (which is strengthened by addition of two more cultures analyzed for GluA2 immunofluorescence). This is an important addition to the significance of the study.
In summary, this study establishes that neuronal Rab3A plays a role in homeostatic synaptic plasticity, but so do a number of other molecules that have been implicated in homeostatic synaptic plasticity in the past two decades (only will grow with the new techniques such as RNAseq). Without going beyond this finding and demonstrating how exactly Rab3A participates in the induction and/or expression of this form of plasticity, or maybe the potential Rab3A-mediated functional and behavioral defects in vivo, the contribution of the current study to the field is limited. However, given the presynaptic location of Rab3A, this finding could serve as a starting point for researchers interested in pre-postsynaptic cross-talk during homeostatic plasticity in general.
We previously published a review in which we list 19 molecules known at that time to be important for homeostatic synaptic plasticity (see Table 2, Koesters et al., 2024), and they fall into two categories: molecules involved in glutamate receptor expression or trafficking, and signaling molecules. Rab3A is the first synaptic vesicle protein to be implicated in homeostatic plasticity of quantal size. We have added this point to the Discussion, new lines 473-476. By demonstrating that Rab3A is not acting in glia (which release TNF, which regulates receptor expression), and that GluA2 receptor levels do not explain the homeostatic mEPSC increase in our experimental conditions, we have ruled out two major mechanisms.
Reviewer #3 (Public review):
Other questions arise from the NASPM experiments, used to justify looking at GluA2 (and not GluA1) in the immunostaining. First, there is a frequency effect that is unclear in origin. One would expect NASPM to merely block some fraction of the post-synaptic current, and not affect pre-synaptic release or block whole synapses. However the change in frequency seems to argue (as the authors do) that some synapses only have CP-AMPARs, while the rest of the synapses have few or none. Another possibility is that there are pre-synaptic NASPM-sensitive receptors that influence release probability. Further, the amplitude data show a strong trend towards smaller amplitude following NASPM treatment (Fig 3B). The p value for both control and TTX neurons was 0.08 - it is very difficult to argue that there is no effect. The decrease on average is larger in the TTX neurons, and some cells show a strong effect. It is possible there is some heterogeneity between neurons on whether GluA1/A2 heteromers or GluA1 homomers are added during HSP. This would impact the weakly supported conclusions about the GluA2 imaging vs mEPSC amplitude data.
We cannot rule out that the NAPSM-induced decrease in mEPSC frequency is due to a loss of presynaptic glutamate receptor enhancement of release probability, and have added this statement to the Results, new lines 202-204. Regarding the p value of 0.08—we are not arguing that NASPM has no effect on mEPSC amplitude, only that it has no effect on the homeostatic increase in amplitude after TTX treatment. An increase in GluA1/A2 heteromers should have been detected in our imaging studies.
Unaddressed issues that would greatly increase the impact of the paper:
(1) Is Rab3A acting pre-synaptically, post-synaptically or both? The authors provide good evidence that Rab3A is acting within neurons and not astrocytes. But where it is acting (pre or post) would aid substantially in understanding its role. They could use sparse knockdown of Rab3A, or simply mix cultures from KO and WT mice (with appropriate tags/labels). The general view in the field has been that HSP is regulated post-synaptically via regulation of AMPAR trafficking, and considerable evidence supports this view. The more support for their suggestion of a pre-synaptic site of control, the better.
We agree that doing co-cultures of Rab3A-/- and Rab3A+/+ neurons is the definitive experiment to determine the locus of action of Rab3A in homeostatic synaptic plasticity. We hope to examine this question in a future manuscript.
(2) Rab3A is also found at inhibitory synapses. It would be very informative to know if HSP at inhibitory synapses is similarly affected. This is particularly relevant as at inhibitory synapses, one expects a removal of GABARs (ie the opposite of whatever is happening at excitatory synapses). If both processes are regulated by Rab3A, this might suggest a role for this protein more upstream in the signaling; an effect only at excitatory synapses would argue for a more specific role just at these synapses.
We agree that it would be very interesting to determine if the homeostatic decrease in mIPSCs after activity blockade depends on Rab3A. We hope to address this question in the future.
Recommendations for the authors:
Reviewer #3 (Recommendations for the authors):
Minor points:
The abstract is a bit repetitive in places. Some editing would be advised.
We did not identify anything repetitive in the abstract except the parallel construction referring to the previous findings at the NMJ and current findings in cortical neurons. However, we have eliminated a section in the introduction which went into detail about the receptor imaging results (previous lines 103-110).
Line 77: 'shift toward early awakening' is unclear; do you mean shorter sleep/wake cycle? Other circadian issues? A more complete description is needed.
We have moved the additional detail about the Earlybird mutation’s effect on circadian period from the Results to the Introduction, new lines 77 to 79.
The results section has many passages that seem more like discussion, offering various interpretation and alternatives for the data. While some commentary is appropriate, to justify the next series of experiments and maintain a logical flow, this manuscript has rather a high amount of this. Some editing and shifting material to the discussion might be warranted.
We have reduced the commentary in the Results section.
Line 245: GluA2 homomers are really unlikely, as they won't pass current (unless unedited) and don't often if ever form. But GluA2/A3 heteromers are likely (and detected by their methods).
GluA2 homomers do conduct current, albeit less than heteromers (Swanson et al., 1997; Oh and Derkach, 2005; Coombs et al., 2019). [The Oh and Derkach paper shows a GluA2 homomer current in Supplementary Figure 3]. We have modified the text to acknowledge that the GluA2 receptor imaging will detect heteromers and homomers (Results, new lines 214 to 215).
Line 258: If the number of synaptic pairs analyzed was usually <20, what was the average and range of pairs? This gets into the sampling issue.
We have added the average number of synaptic sites (20.4 ± 6.5) and range (11-38) to the text, Results, new line 229.
Are the stats of the baseline mEPSC amplitude and frequency shifts (WT vs KO on WT feeder layer) given somewhere (lines 398-402)? If not, please add them.
These stats have been added to the text, mEPSC amplitude, (CON, WT on WT, 13.3 ± 0.5 pA; CON, KO on WT, 15.2 ± 1.1 pA, p = 0.23, Kruskal-Wallis test), new lines 325-326 and frequency, (CON, WT on WT, 2.54 ± 0.57 sec-1; CON, KO on WT, 4.46 ± 1.21 sec-1, p = 0.23, Kruskal-Wallis test), new lines, 329-330.
25mM K+ is going to be much more than 'mildly' depolarizing (line 697). Should just skip that word.
‘mildly’ has been removed.
The section on MiniAnalysis seems overly argumentative, and there is no need to discuss flaws in the Wu paper. The important thing (a bit buried at the end of this section) is that the manual mini selection was done blind to condition, which is the normal way of dealing with potential bias. It would be better to limit the methods to describing what was done.
The bulk of the justification of manual analysis has been removed from the text.
The discussion of potential conductance changes (lines 534-6) seems somewhat unwarranted.
Modification of GluA1 phosphorylation in the GluA1/A2 heteromer would not be detected by NASPM (and the NASPM data being a bit inconclusive anyway). Further, auxiliary subunits (like TARPs) can alter conductance of any of the AMPARs. So I don't think they have enough data to exclude such a possibility.
The discussion of contributions of conductance have been removed from the text.
Coombs ID, Soto D, McGee TP, Gold MG, Farrant M, Cull-Candy SG (2019) Homomeric GluA2(R) AMPA receptors can conduct when desensitized. Nat Commun 10:4312.
Oh MC, Derkach VA (2005) Dominant role of the GluR2 subunit in regulation of AMPA receptors by CaMKII. Nat Neurosci 8:853-854.
Swanson GT, Kamboj SK, Cull-Candy SG (1997) Single-channel properties of recombinant AMPA receptors depend on RNA editing, splice variation, and subunit composition. J Neurosci 17:5869.
-
-
eLife Assessment
This study presents useful findings on the role of the small GTPase Rab3A in homeostatic synaptic plasticity following activity suppression. While the study demonstrates that Rab3A is required for homeostatic scaling, the evidence supporting the model put forward by the authors is incomplete. The work will be of interest to the field of synaptic transmission and synaptic plasticity.
-
Reviewer #1 (Public review):
Koesters and colleagues investigated the role of the small GTPase Rab3A in homeostatic scaling of miniature synaptic transmission in primary mouse cortical cultures using electrophysiology and immunohistochemistry. The major finding is that TTX incubation for 48 hours does not induce an increase in the amplitude of excitatory synaptic miniature events in neuronal cultures derived from Rab3A KO and Rab3A Earlybird mutant mice. NASPM application had comparable effects on mEPSC amplitude in control and after TTX, implying that Ca2+-permeable glutamate receptors are unlikely modulated during synaptic scaling. Immunohistochemical analysis revealed no significant changes in GluA2 puncta size, intensity, and integral in control and Rab3A KO cultures. Finally, they provide evidence that loss of Rab3A in neurons, but …
Reviewer #1 (Public review):
Koesters and colleagues investigated the role of the small GTPase Rab3A in homeostatic scaling of miniature synaptic transmission in primary mouse cortical cultures using electrophysiology and immunohistochemistry. The major finding is that TTX incubation for 48 hours does not induce an increase in the amplitude of excitatory synaptic miniature events in neuronal cultures derived from Rab3A KO and Rab3A Earlybird mutant mice. NASPM application had comparable effects on mEPSC amplitude in control and after TTX, implying that Ca2+-permeable glutamate receptors are unlikely modulated during synaptic scaling. Immunohistochemical analysis revealed no significant changes in GluA2 puncta size, intensity, and integral in control and Rab3A KO cultures. Finally, they provide evidence that loss of Rab3A in neurons, but not astrocytes, blocks homeostatic scaling. Based on these data, the authors propose a model in which neuronal Rab3A is required for homeostatic scaling of synaptic transmission through GluA2-dependent and independent mechanisms.
While the title of the manuscript is mostly supported by data of solid quality, many conclusions, as well as the final model, cannot be derived from the results presented. Importantly, the data do not support that GluA2 levels change upon TTX treatment in control cultures, rendering conclusions regarding Rab3A's role in TTX-dependent GluA2 modulation spurious. Other aspects of the model, such as a Rab3A-dependent release of a tropic factor, cannot be derived from the data.
The following points should be addressed:
(1) There is no (significant) increase in GluA2 levels (intensity, area, or integral) upon TTX treatment in controls (Fig. 5). Conclusions regarding Rab3As role in TTX-dependent GluA2 modulation should be revised accordingly. Hence, the data shown in Fig. 4 - 7 do not allow drawing conclusions in the context of Rab3A-dependent GluA2 modulation and scaling.
(2) The effects of Rab3A on TTX-induced mini frequency modulation remains unclear, because TTX does not induce a change in mini frequency in the Rab3A+/Ebd control (Fig. 2). The respective conclusions should be revised accordingly (l. 427).
(3) The model is still not supported by the data. In particular, data supporting a negative regulation of Rab3A by APs, Rab3A-dependent release of a tropic factor, or a Rab3A-dependent increase in GluA2 abundance are not presented.
(4) Data points are not overlapping and appear "quantal" in most box plots. How were the data rounded?
-
Reviewer #2 (Public review):
In the revised manuscript, the authors investigated the role of a presynaptic protein, Rab3A, in the homeostatic synaptic plasticity in cultured cortical neurons. The study was motivated by their previous findings that Rab3A is required for expression of similar homeostatic mechanisms at the neuromuscular junction. The authors first show that untreated WT neurons express homeostatic synaptic plasticity in response to 48h of TTX treatment (upregulation of both mEPSC amplitude and frequency), whereas neurons lacking Rab3A or carrying a dominant negative mutated Rab3A (earlybird) do not. They also demonstrate that only neuronal, but not glial Rab3A is responsible for this defect. Furthermore, they confirm the increased mEPSC amplitudes in WT neurons reflect the addition of GluA2-containing AMPA receptors rather …
Reviewer #2 (Public review):
In the revised manuscript, the authors investigated the role of a presynaptic protein, Rab3A, in the homeostatic synaptic plasticity in cultured cortical neurons. The study was motivated by their previous findings that Rab3A is required for expression of similar homeostatic mechanisms at the neuromuscular junction. The authors first show that untreated WT neurons express homeostatic synaptic plasticity in response to 48h of TTX treatment (upregulation of both mEPSC amplitude and frequency), whereas neurons lacking Rab3A or carrying a dominant negative mutated Rab3A (earlybird) do not. They also demonstrate that only neuronal, but not glial Rab3A is responsible for this defect. Furthermore, they confirm the increased mEPSC amplitudes in WT neurons reflect the addition of GluA2-containing AMPA receptors rather than calcium-permeable ones, as previously reported by multiple labs. However, the increase in mEPSC amplitude is not accompanied by a corresponding upregulation of GluA2 synaptic clusters according to their IHC data (cluster size and intensity trend slightly upwards but not reaching significance). They further show that this modest upward trend is absent in Rab3A KO neurons, and conclude that Rab3A is involved in postsynaptic GluA2 upregulation during homeostatic synaptic plasticity.
When compared to the original version, the authors have done an admirable job in switching to more established ways to assess homeostatic synaptic plasticity by comparing the mean mEPSC amplitude and frequency, which has greatly improved the legibility of the manuscript to the public. Their data in Figures 1,2, and 8 clearly demonstrate that functional Rab3A in cortical neurons is required for the homeostatic regulation of mEPSCs.
However, the authors still have not provided further investigation of the mechanisms behind the role of Rab3A in this form of plasticity, and the revision therefore has added little to the significance of the study. Moreover, the experimental design for the investigation of the mismatch between mEPSC amplitude and GluA2 cluster fluorescence remains questionable, making it difficult to draw any credible conclusions from groups of data that not only look similar to the eye but also show no significance statistically.
A major claim the authors want to make is that Rab3A, although a presynaptic protein, regulates postsynaptic GluA2, and they do this by showing in Figure 5 that the upward trend of GluA2 cluster size and intensity is absent in Rab3A KO neurons. First, it is difficult to convince readers that this upward trend is real in Figures 5B-D without getting more samples. Second, the authors pick GluA2 clusters on the primary dendrites, whereas mEPSC events come from a much larger synapse population (e.g., more distal), therefore it makes sense that these two forms of measurement do not show matching changes, and this caveat could be addressed by sampling more diverse dendritic locations. Without a convincing phenotype in WT neurons, the support for this claim is weak.
Another claim of the authors is that this mismatch between mEPSC amplitude and GluA2 cluster sizes with the same culture suggests there are other factors contributing to the mEPSC amplitude. They do this by comparing results from individual culture dissociations, which greatly suffer from undersampling (Figure 6). In particular, they point out that 2 out of 3 dissociations show "matching" upward trends in mEPSC and GluA2 cluster (figure 6A and 6B) while the third one shows opposite trends, and use this to support their claim. Anyone who has done culture preparation would know the high variability between dissociations, which is why culture data are always pooled for assessment of any population trend. Anything could have happened to this particular dissociation (culture #3, figure 6C), and drawing conclusion from this single incident does little to support this claim. At least, they should double the dissociation numbers, and their claim would be much more convincing if a similar phenomenon occurs again. Besides, as mentioned above, all these mismatching trends could just be due to sampling differences.
In summary, this study establishes that neuronal Rab3A plays a role in homeostatic synaptic plasticity, but so do a number of other molecules that have been implicated in homeostatic synaptic plasticity in the past two decades (only will grow with the new techniques such as RNAseq). Without going beyond this finding and demonstrating how exactly Rab3A participates in the induction and/or expression of this form of plasticity, or maybe the potential Rab3A-mediated functional and behavioral defects in vivo, the contribution of the current study to the field is limited. However, given the presynaptic location of Rab3A, this finding could serve as a starting point for researchers interested in pre-postsynaptic cross-talk during homeostatic plasticity in general.
-
Reviewer #3 (Public review):
This manuscript presents a number of interesting findings that have the potential to increase our understanding of the mechanism underlying homeostatic synaptic plasticity (HSP). The data broadly support that Rab3A plays a role in HSP, although the site and mechanism of action remain uncertain.
The authors clearly demonstrate the Rab3A plays a role in HSP at excitatory synapses, with substantially less plasticity occurring in the Rab3A KO neurons. There is also no apparent HSP in the Earlybird Rab3A mutation, although baseline synaptic strength seems already elevated. In this context, it is unclear if the plasticity is absent or just occluded by a ceiling effect due the synapses already being strengthened. Occlusion may also occur in the mixed cultures, with Rab3A missing from neurons but not astrocytes. The …
Reviewer #3 (Public review):
This manuscript presents a number of interesting findings that have the potential to increase our understanding of the mechanism underlying homeostatic synaptic plasticity (HSP). The data broadly support that Rab3A plays a role in HSP, although the site and mechanism of action remain uncertain.
The authors clearly demonstrate the Rab3A plays a role in HSP at excitatory synapses, with substantially less plasticity occurring in the Rab3A KO neurons. There is also no apparent HSP in the Earlybird Rab3A mutation, although baseline synaptic strength seems already elevated. In this context, it is unclear if the plasticity is absent or just occluded by a ceiling effect due the synapses already being strengthened. Occlusion may also occur in the mixed cultures, with Rab3A missing from neurons but not astrocytes. The authors do appropriately discuss both options. There are also differences in genetic background between the Rab3A KO and Earlybird mutants that could also impact the results, which are also noted. The authors have solid data showing that Rab3A is unlikely to be active in astrocytes, Finally, they attempt to study the linkage between synaptic strength during HSP and AMPA receptor trafficking and conclude that trafficking may not be solely responsible for the changes in synaptic strength.
Strengths:
This work adds another player into the mechanisms underlying an important form of synaptic plasticity. The plasticity is likely only reduced, suggesting Rab3A is only partially required and perhaps multiple mechanisms contribute. The authors speculate about some possible novel mechanisms.
However, the conclusions on the partial dissociation of AMPAR trafficking and synaptic response are made from somewhat weaker data. On average, across 3 culture sets, they saw similar magnitude of change in mEPSC amplitude and GluA2 cluster area and integral, but the GluA2 data was not significant. This is likely due to the nature of the datasets. Their imaging method involves only assessing puncta pairs (GluA2/VGlut1) clearly associated with a MAP2 labeled dendrite. This is a small subset of synapses, with usually less than 20 synapses per neuron analyzed (as stated by the authors). The mEPSC recordings will be averaging across several hundred events, which likely represent a hundred or more synapses given reasonable expectations on release probability. It has been reported, in work from this lab as well as by direct monitoring of tagged AMPARs during HSP (Wang, et al., 2019), that individual synapses are quite variable in their response. So there will almost necessarily be higher variability in the imaging data due to the smaller number of synapses sampled. The overall trends, though, are in alignment with previous data implicating receptor trafficking as the mechanism for HSP. However, the authors go on to evaluate each of the individual cultures, where 2 show similar changes between the mEPSC data and GluA2 clusters, and 1 culture showing little/no change in GluA2 clusters. The n's are very low here, and none of the datasets are significant. They want to conclude for this culture, there was a change in mEPSC amplitude that was not accompanied by a change in GluA2 at synaptic sites. But these data are collected from different coverslips, and due to the low n's, the potential under-sampling of the GluA2 clusters, and neuron-to-neuron variability, it is very hard to distinguish if this apparent difference is a methodological issue rather than a biological one. Much stronger data would be necessary to conclude that additional factors beyond receptor trafficking are required for HSP.
Other questions arise from the NASPM experiments, used to justify looking at GluA2 (and not GluA1) in the immunostaining. First, there is a frequency effect that is unclear in origin. One would expect NASPM to merely block some fraction of the post-synaptic current, and not affect pre-synaptic release or block whole synapses. However the change in frequency seems to argue (as the authors do) that some synapses only have CP-AMPARs, while the rest of the synapses have few or none. Another possibility is that there are pre-synaptic NASPM-sensitive receptors that influence release probability. Further, the amplitude data show a strong trend towards smaller amplitude following NASPM treatment (Fig 3B). The p value for both control and TTX neurons was 0.08 - it is very difficult to argue that there is no effect. The decrease on average is larger in the TTX neurons, and some cells show a strong effect. It is possible there is some heterogeneity between neurons on whether GluA1/A2 heteromers or GluA1 homomers are added during HSP. This would impact the weakly supported conclusions about the GluA2 imaging vs mEPSC amplitude data.
Unaddressed issues that would greatly increase the impact of the paper:
(1) Is Rab3A acting pre-synaptically, post-synaptically or both? The authors provide good evidence that Rab3A is acting within neurons and not astrocytes. But where it is acting (pre or post) would aid substantially in understanding its role. They could use sparse knock-down of Rab3A, or simply mix cultures from KO and WT mice (with appropriate tags/labels). The general view in the field has been that HSP is regulated post-synaptically via regulation of AMPAR trafficking, and considerable evidence supports this view. The more support for their suggestion of a pre-synaptic site of control, the better.
(2) Rab3A is also found at inhibitory synapses. It would be very informative to know if HSP at inhibitory synapses is similarly affected. This is particularly relevant as at inhibitory synapses, one expects a removal of GABARs (ie the opposite of whatever is happening at excitatory synapses). If both processes are regulated by Rab3A, this might suggest a role for this protein more upstream in the signaling; an effect only at excitatory synapses would argue for a more specific role just at these synapses.
-
Author response:
The following is the authors’ response to the original reviews.
The detailed, thorough critique provided by the three reviewers is very much appreciated. We believe the manuscript is greatly improved by the changes we have made based on those reviews. The major changes are described below, followed by a point by point response.
Major Changes:
(1) We revised our model (old Fig. 10; new Fig. 9) to keep the explanation focused on the data shown in the current study. Specifically, references to GTP/GDP states of Rab3A and changes in the presynaptic quantum have been removed and the mechanisms depicted are confined to pre- or post-synaptic Rab3A participating in either controlling release of a trophic factor that regulates surface GluA2 receptors (pre- or postsynaptic) or directly affecting fusion of GluA2-receptor …
Author response:
The following is the authors’ response to the original reviews.
The detailed, thorough critique provided by the three reviewers is very much appreciated. We believe the manuscript is greatly improved by the changes we have made based on those reviews. The major changes are described below, followed by a point by point response.
Major Changes:
(1) We revised our model (old Fig. 10; new Fig. 9) to keep the explanation focused on the data shown in the current study. Specifically, references to GTP/GDP states of Rab3A and changes in the presynaptic quantum have been removed and the mechanisms depicted are confined to pre- or post-synaptic Rab3A participating in either controlling release of a trophic factor that regulates surface GluA2 receptors (pre- or postsynaptic) or directly affecting fusion of GluA2-receptor containing vesicles (postsynaptic).
(2) We replaced all cumulative density function plots and ratio plots, based on multiple quantile samples per cell, with box plots of cell means. This affects new Figures 1, 2, 3, 5, 6, 7 and 8. All references to “scaling,” “divergent scaling,” or “uniform scaling,” have been removed. New p values for comparison of means are provided above every box plot in Figures 1, 2, 3, 5, 6, 7 and 8. The number of cultures is provided in the figure legends.
(3) We have added frequency to Figures 1, 2 and 8. Frequency values overall are more variable, and the effect of activity blockade less robust, than for mEPSC amplitudes. We have added text indicating that the increase in frequency after activity blockade was significant in neurons from cultures prepared from WT in the Rab3A+/- colony but not cultures prepared from KO mice (Results, lines 143 to 147, new Fig. 1G. H). The TTX-induced increase in frequency was significant in the NASPM experiments before NASPM, but not after NASPM (Results, lines 231 to 233, new Fig. 3, also cultures from WT in Rab3A+/- colony). The homeostatic plasticity effect on frequency did not reach significance in WT on WT glia cultures or
WT on KO glia cultures, possibly due to the variability of frequency, combined with smaller sample sizes (Results, lines 400 to 403, new Fig. 8). In the cultures prepared from WT mice in the Rab3A+/Ebd colony, there was a trend towards higher frequency after TTX that did not reach statistical significance, and in cultures prepared from mutant mice, the p value was large, suggesting disruption of the effect, which appears to be due to an increase in frequency in untreated cultures, similar to the behavior of mEPSC amplitudes in neurons from mutant mice (Results, lines 161-167). In sum, the effect of activity on frequency requires Rab3A and Ca2+-permeable receptors, and is mimicked by the presence of the Rab3A Earlybird mutant. We have also added a discussion of these results (Discussion, lines 427-435).
(4) In the revised manuscript we have added analysis of VGLUT1 levels for the same synaptic sites that we previously analyzed GluA2 levels, and these data are described in Results, lines 344 to 371, and appear in new Table 2. In contrast to previous studies, we did not find any evidence for an increase in VGLUT1 levels after activity blockade. We reviewed those studies to determine whether there might be differences in the experimental details that could explain the lack of effect we observed. In (De Gois et al., 2005), the authors measured mRNA and performed western blots to show increases in VGLUT1 after TTX treatment in older rat cortical cultures (DIV 19). The study performs immunofluorescence imaging of VGLUT1 but only after bicuculline treatment (it decreases), not after TTX treatment. In (Wilson et al.,
2005), the hippocampal cultures are treated with AP5, not TTX, and the VGLUT1 levels in immunofluorescence images are reported relative to synapsin I. That the type of activity blockade matters is illustrated by the failure of Wilson and colleagues to observe a consistent increase in VGLUT1/Synapsin ratio in cultures treated with AMPA receptor blockade (NBQX; supplementary information). These points have been added to the Discussion, lines 436 to 447.)
Reviewer #1:
(1) (model…is not supported by the data), (2) (The analysis of mEPSC data using quantile sampling…), (3) (…statistical analysis of CDFs suffers from n-inflation…), (4) (How does recording noise and the mEPSC amplitude threshold affect “divergent scaling?”) (5) (…justification for the line fits of the ratio data…), (7) (A comparison of p-values between conditions….) and (10) (Was VGLUT intensity altered in the stainings presented in the manuscript?)
The major changes we made, described above, address Reviewer #1’s points. The remaining points are addressed below.
(6) TTX application induces a significant increase in mEPSC amplitude in Rab3A-/- mice in two out of three data sets (Figs. 1 and 9). Hence, the major conclusion that Rab3A is required for homeostatic scaling is only partially supported by the data.
The p values based on CDF comparisons were problematic, but the point we were making is that they were much larger for amplitudes measured in cultures prepared from Rab3A-/- mice (Fig. 1, p = 0.04) compared to those from cultures prepared from Rab3A+/+ mice (Fig. 1, p = 4.6 * 10-4). Now that we are comparing means, there are no significant TTX-induced effects on mEPSC amplitudes for Rab3A-/- data. However, acknowledging that some increase after activity blockade remains, we describe homeostatic plasticity as being impaired or not significant, rather than abolished, by loss of Rab3A, (Abstract, lines 37 to 39; Results, lines 141 to 143; Discussion, lines 415 to 418).
(8) There is a significant increase in baseline mEPSC amplitude in Rab3AEbd/Ebd (15 pA) vs. Rab3AEbd/+ (11 pA) cultures, but not in Rab3A-/- (13.6 pA) vs. Rab3A+/- (13.9 pA). Although the nature of scaling was different between Rab3AEbd/Ebd vs. Rab3AEbd/+ and Rab3AEbd/Ebd with vs. without TTX, the question arises whether the increase in mEPSC amplitude in Rab3AEbd/Ebd is Rab3A dependent. Could a Rab3A independent mechanism occlude scaling?
The Reviewer is concerned that the increase in mEPSC amplitude in the presence of the Rab3A point mutant may be through a ‘non-Rab3A’ mechanism (a concern raised by the lack of such effect in cultures from the Rab3A-/- mice), and secondly, that the already large mEPSC cannot be further increased by the homeostatic plasticity mechanism. It must always be considered that a mutant with an altered genetic sequence may bind to novel partners, causing activities that would not be either facilitated or inhibited by the original molecule. We have added this caveat to Results, lines 180 to 186 We added that a number of other manipulations, implicating individual molecules in the homeostatic mechanism, have caused an increase in mEPSC amplitude at baseline, potentially nonspecifically occluding the ability of activity blockade to induce a further increase (Results lines 186 to 189). Still, it is a strong coincidence that the novel activity of the mutant Rab3A would affect mEPSC amplitude, the same characteristic that is affected by activity blockade in a Rab3A dependent manner, a point which we added to Results, lines 189 to 191.
(9) Figure 4: NASPM appears to have a stronger effect on mEPSC frequency in the TTX condition vs. control (-40% vs -15%). A larger sample size might be necessary to draw definitive conclusions on the contribution of Ca2+-permeable AMPARs.
Our results, even with the modest sample size of 11 cells, are clear: NASPM does not disrupt the effect of TTX treatment on mEPSC amplitude (new Fig. 3A). It also looks like there is a greater magnitude effect of NAPSM on frequency in TTX-treated cells; we note this, but point out that nevertheless, these mEPSCs are not contributing to the increase in mEPSC amplitude (Results, lines 238-241).
(11) The change in GluA2 area or fluorescence intensity upon TTX treatment in controls is modest. How does the GluA2 integral change?
We had reported that GluA2 area showed the most prominent increase following activity blockade, with intensity changing very little. When we examined the integral, it closely matched the change in area. We have added the values for integral to new Fig. 5 D, H; new Fig. 6 A-C; new Fig. 7 A-C and new Table 1 (for GluA2) and new Table 2 (for VGLUT1). These results are described in the text in the following places: Results, lines 289-292; 298-299; 311-319; 328-324). For VGLUT1, both area and intensity changed modestly, and the integral appeared to be a combination of the two, being higher in magnitude and resulting in smaller p values than either area or intensity (Results, lines 344-348; 353-359; new Table 2).
(12) The quantitative comparison between physiology and microscopy data is problematic. The authors report a mismatch in ratio values between the smallest mEPSC amplitudes and the smallest GluA2 receptor cluster sizes (l. 464; Figure 8). Is this comparison affected by the fluorescence intensity threshold? What was the rationale for a threshold of 400 a.u. or 450 a.u.? How does this threshold compare to the mEPSC threshold of 3 pA.
This concern is partially addressed by no longer comparing the rank ordered mEPSC amplitudes with the rank ordered GluA2 receptor characteristics. We had used multiple thresholds in the event that an experiment was not analyzable with the chosen threshold (this in fact happened for VGLUT1, see end of this paragraph). We created box plots of the mean GluA2 receptor cluster size, intensity and integral, for experiments in which we used all three thresholds, to determine if the effect of activity blockade was different depending on which threshold was applied, and found that there was no obvious difference in the results (Author response image 1). Nevertheless, since there is no need to use a different threshold for any of the 6 experiments (3 WT and 3KO), for new Figures 5, 6 and 7 we used the same threshold for all data, 450; described in Methods, lines 746 to 749. For VGLUT1 levels, it was necessary to use a different threshold for Rab3A+/+ Culture #1 (400), but a threshold of 200 for the other five experiments (Methods, lines 751-757). The VGLUT1 immunofluorescent sites in Culture #1 had higher levels overall, and the low threshold caused the entire AOI to be counted as the synapse, which clearly included background levels outside of the synaptic site. Conversely, to use a threshold of 400 on the other experiments meant that the synaptic site found by the automated measurement tool was much smaller that what was visible by eye. In our judgement it would have been meaningless to adhere to a single threshold for VGLUT1 data.
Author response image 1.
Using different thresholds does not substantially alter GluA2 receptor cluster size data. A) Rab3A+/+ Culture #1, size data for three different thresholds, depicted above each graph. B) Rab3A+/+ Culture #2, size data for three different thresholds, depicted above each graph. Note scale bar in A is different from B, to highlight differences for different thresholds. (Culture #3 was only analyzed with 450 threshold).
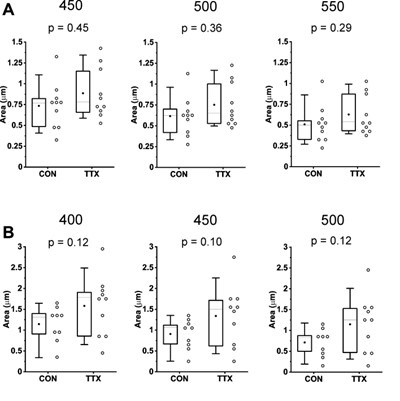
The conclusion that an increase in AMPAR levels is not fully responsible for the observed mEPSC increase is mainly based on the rank-order analysis of GluA2 intensity, yielding a slope of ~0.9. There are several points to consider here: (i) GluA2 fluorescence intensity did increase on average, as did GluA2 cluster size.
(ii) The increase in GluA2 cluster size is very similar to the increase in mEPSC amplitude (each approx. 1820%). (iii) Are there any reports that fluorescence intensity values are linearly reporting mEPSC amplitudes (in this system)? Antibody labelling efficiency, and false negatives of mEPSC recordings may influence the results. The latter was already noted by the authors.
Our comparison between mEPSC amplitude and GluA2 receptor cluster characteristics has been reexamined in the revised version using means rather than rank-ordered data in rank-order plots or ratio plots. Importantly, all of these methods revealed that in one out of three WT cultures (Culture #3) GluA2 receptor cluster size (old Fig. 8, old Table 1; new Fig. 6, new Table 1), intensity and integral (new Fig. 6, new Table 1) values decreased following activity blockade while in the same culture, mEPSC amplitudes increased. It is based on this lack of correspondence that we conclude that increases in mEPSC amplitude are not fully explained by increases in GluA2 receptors, and suggest there may be other contributors. These points are made in the Abstract (lines 108-110); Results (lines 319 to 326; 330337; 341-343) and the Discussion (lines 472 to 474). To our knowledge, there are not any reports that quantitatively compare receptor levels (area, intensity or integrals) to mEPSC amplitudes in the same cultures. We examined the comparisons very closely for 5 studies that used TTX to block activity and examined receptor levels using confocal imaging at identified synapses (Hou et al., 2008; Ibata et al., 2008; Jakawich et al., 2010a; Xu and Pozzo-Miller, 2017; Dubes et al., 2022). We were specifically looking for whether the receptor data were more variable than the mEPSC amplitude data, as we found. However, for 4 of the studies, sample sizes were very different so that we cannot simply compare the p values. Below is a table of the comparisons.
Author response table 1.
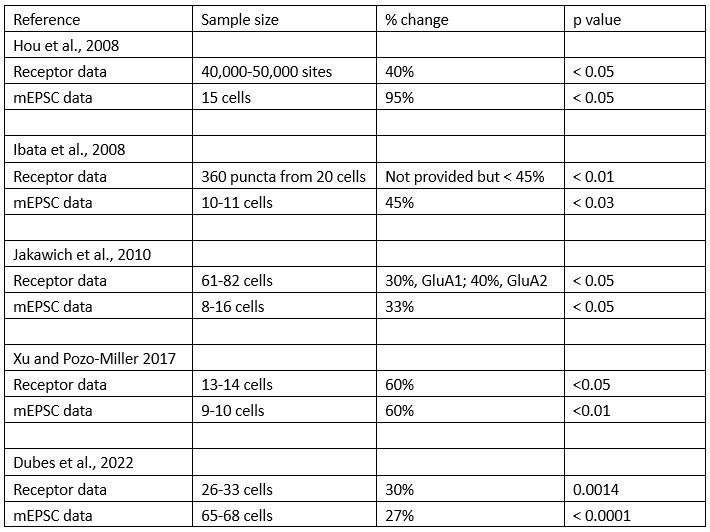
In Xu 2017 the sample sizes are close enough that we feel comfortable concluding that the receptor data were slightly more variable (p < 0.05) than mEPSC data (p<0.01) but recognize that it is speculative to say our finding has been confirmed. A discussion of these articles is in Discussion, lines 456-474.
(iv) It is not entirely clear if their imaging experiments will sample from all synapses. Other AMPAR subtypes than GluA2 could contribute, as could kainite or NMDA receptors.
While our imaging data only examined GluA2, we used the application of NASPM to demonstrate Ca2+permeable receptors did not contribute quantitatively to the increase in mEPSC amplitude following TTX treatment. Since GluA3 and GluA4 are also Ca2+-permeable, the findings in new Figure 3 (old Fig. 4) likely rule out these receptors as well. There are also reports that Kainate receptors are Ca2+-permeable and blocked by NASPM (Koike et al., 1997; Sun et al., 2009), suggesting the NASPM experiment also rules out the contribution of Kainate receptors. Finally, given our recording conditions, which included normal magnesium levels in the extracellular solution as well as TTX to block action-potential evoked synaptic transmission, NMDA receptors would not be available to contribute currents to our recordings due to block by magnesium ions at resting Vm. These points have been added to the Methods section, lines 617 to 677 (NMDA); 687-694 (Ca2+-permeable AMPA receptors and Kainate receptors).
Furthermore, the statement “complete lack of correspondence of TTX/CON ratios” is not supported by the data presented (l. 515ff). First, under the assumption that no scaling occurs in Rab3A-/-, the TTX/CON ratios show a 20-30% change, which indicates the variation of this readout. Second, the two examples shown in Figure 8 for Rab3A+/+ are actually quite similar (culture #1 and #2, particularly when ignoring the leftmost section of the data, which is heavily affected by the raw values approaching zero.
We are no longer presenting ratio plots in the revised manuscript, so we do not base our conclusion that mEPSC amplitude data is not always corresponding to GluA2 receptor data on the difference in behavior of TTX/CON ratio values, but only on the difference in direction of the TTX effect in one out of three cultures. We agree with the reviewer that the ratio plots are much more sensitive to differences between control and treated values than the rank order plot, and we feel these differences are important, for example, there is still a homeostatic increase in the Rab3A-/- cultures, and the effect is still divergent rather than uniform. But the comparison of ratio data will be presented elsewhere.
(13) Figure 7A: TTX CDF was shifted to smaller mEPSC amplitude values in Rab3A-/- cultures. How can this be explained?
While this result is most obvious in CDF plots, we still observe a trend towards smaller mEPSC amplitudes after TTX treatment in two of three individual cultures prepared from Rab3A-/- mice when comparing means (new Fig. 7, Table 1) which did not reach statistical significance for the pooled data (new Fig. 5, new Table 1). There was not any evidence of this decrease in the larger data set (new Fig. 1) nor for Rab3A-/- neurons on Rab3A+/+ glia (new Fig. 8). Given that this effect is not consistent, we did not comment on it in the revised manuscript. It may be that there is a non-Rab3A-dependent mechanism that results in a decrease in mEPSC amplitude after activity blockade, which normally pulls down the magnitude of the activity-dependent increase typically observed. But studying this second component would be difficult given its magnitude and inconsistent presentation.
Reviewer #1 (Recommendations For the Authors):
(1) Abstract, last sentence: The conclusion of the present manuscript should be primarily based on the results presented. At present, it is mainly based on a previous publication by the authors.
We have revised the last sentence to reflect actual findings of the current study (Abstract, lines 47 to 49).
(2) Line 55: “neurodevelopmental”
This phrase has been removed.
(3) Line 56: “AMPAergic” should be replaced by AMPAR-mediated
This sentence was removed when all references to “scaling” were removed; no other instances of “AMPAergic” are present.
(4) Figure 9: The use of BioRender should be disclosed in the Figure Legend.
We used BioRender in new Figures 3, 7 and 8, and now acknowledge BioRender in those figure legends.
(5) Figure legends and results: The number of cultures should be indicated for each comparison.
Number of cultures has been added to the figure legends.
(6) Line 289: A comparison of p-values between conditions does not allow any meaningful conclusions.
Agreed, therefore we have removed CDFs and the KS test comparison p values. All comparisons in the revised manuscript are for cell means.
(7) Line 623ff: The argument referring to NMJ data is weak, given that different types of receptors are involved.
We still think it is valid to point out that Rab3A is required for the increase in mEPC at the NMJ but that ACh receptors do not increase (Discussion, lines 522 to 525). We are not saying that postsynaptic receptors do not contribute in cortical cultures, only that there could be another Rab3A-dependent mechanism that also affects mEPSC amplitude.
(8) Plotting data points outside of the ranges should be avoided (e.g., Fig. 2Giii, 7F).
These two figures are no longer present in the revised manuscript. In revising figures, we made sure no other plots have data points outside of the ranges.
(9) The rationale for investigating Rab3AEbd/Ebd remains elusive and should be described.
A rationale for investigating Rab3AEbd/Ebd is that if the results are similar to the KO, it strengthens the evidence for Rab3A being involved in homeostatic synaptic plasticity. In addition, since its phenotype of early awakening was stronger than that demonstrated in Rab3A KO mice (Kapfhamer et al., 2002), it was possible we would see a more robust effect. These points have been added to the Results, lines 118 to 126.
(10) Figures 3 and 4, as well as Figure 5 and 6 could be merged.
In the revised version, Figure 3 has been eliminated since its main point was a difference in scaling behavior. Figure 4 has been expanded to include a model of how NASPM could reduce frequency (new Fig. 3.) Images of the pyramidal cell body have been added to Figure 5 (new Fig. 4), and Figure 6 has been completely revised and now includes pooled data for both Rab3A+/+ and Rab3A-/- cultures, for mEPSC amplitude, GluA2 receptor cluster size, intensity and integral.
(11) Figure 5: The legend refers to MAP2, but this is not indicated in the figure.
MAP2 has now been added to the labels for each image and described in the figure legend (new Fig. 4).
Reviewer #2:
Technical concerns:
(1) The culture condition is questionable. The authors saw no NMDAR current present during spontaneous recordings, which is worrisome since NMDARs should be active in cultures with normal network activity (Watt et al., 2000; Sutton et al., 2006). It is important to ensure there is enough spiking activity before doing any activity manipulation. Similarly it is also unknown whether spiking activity is normal in Rab3AKO/Ebd neurons.
In the studies cited by the reviewer, NMDA currents were detected under experimental conditions in which magnesium was removed. In our recordings, we have normal magnesium (1.3 mM) and also TTX, which prevents the necessary depolarization to allow inward current through NMDA receptors. This point has been added to our Methods, lines 674 to 677. We acknowledge we do not know the level of spiking in cultures prepared from Rab3A+/+, Rab3A-/- or Rab3A_Ebd/Ebd_ mice. Given the similar mEPSC amplitude for untreated cultures from WT and KO studies, we think it unlikely that activity was low in the latter, but it remains a possibility for untreated cultures from Rab3A_Ebd/Ebd_ mice, where mEPSC amplitude was increased. These points are added to the Methods, lines 615 to 622.
(2) Selection of mEPSC events is not conducted in an unbiased manner. Manually selecting events is insufficient for cumulative distribution analysis, where small biases could skew the entire distribution. Since the authors claim their ratio plot is a better method to detect the uniformity of scaling than the well-established rank-order plot, it is important to use an unbiased population to substantiate this claim.
We no longer include any cumulative distributions or ratio plot analysis in the revised version. We have added the following text to Methods, lines 703 to 720:
“MiniAnalysis selects many false positives with the automated feature when a small threshold amplitude value is employed, due to random fluctuations in noise, so manual re-evaluation of the automated process is necessary to eliminate false positives. If the threshold value is set high, there are few false positives but small amplitude events that visually are clearly mEPSCs are missed, and manual re-evaluation is necessary to add back false negatives or the population ends up biased towards large mEPSC amplitudes. As soon as there is a manual step, bias is introduced. Interestingly, a manual reevaluation step was applied in a recent study that describes their process as ‘unbiased (Wu et al., 2020). In sum, we do not believe it is currently possible to perform a completely unbiased detection process. A fully manual detection process means that the same criterion (“does this look like an mEPSC?”) is applied to all events, not just the false positives, or the false negatives, which prevents the bias from being primarily at one end or the other of the range of mEPSC amplitudes. It is important to note that when performing the MiniAnalysis process, the researcher did not know whether a record was from an untreated cell or a TTX-treated cell.”
(3) Immunohistochemistry data analysis is problematic. The authors only labeled dendrites without doing cell-fills to look at morphology, so it is questionable how they differentiate branches from pyramidal neurons and interneurons. Since glutamatergic synapse on these two types of neuron scale in the opposite directions, it is crucial to show that only pyramidal neurons are included for analysis.
We identified neurons with a pyramidal shape and a prominent primary dendrite at 60x magnification without the zoom feature. This should have been made clear in the description of imaging. We have added an image of the two selected cells to our figure of dendrites (old Fig. 5, new Fig. 4), and described this process in the Methods, lines 736 to 739, and Results, lines 246 to 253. Given the morphology of the neurons selected it is highly unlikely that the dendrites we analyzed came from interneurons.
Conceptual Concerns
The only novel finding here is the implicated role for Rab3A in synaptic scaling, but insights into mechanisms behind this observation are lacking. The authors claim that Rab3A likely regulates scaling from the presynaptic side, yet there is no direct evidence from data presented. In its current form, this study’s contribution to the field is very limited.
We have demonstrated that loss of Rab3A and expression of a Rab3A point mutant disrupt homeostatic plasticity of mEPSC amplitudes, and that in the absence of Rab3A, the increase in GluA2 receptors at synaptic sites is abolished. Further, we show that this effect cannot be through release of a factor, like TNFα, from astrocytes. In the new version, we add the finding that VGLUT1 is not increased after activity blockade, ruling out this presynaptic factor as a contributor to homeostatic increases in mEPSC amplitude. We show for the first time by examining mEPSC amplitudes and GluA2 receptors in the same cultures that the increases in GluA2 receptors are not as consistent as the increases in mEPSC amplitude, suggesting the possibility of another contributor to homeostatic increases in mEPSC amplitude. We first proposed this idea in our previous study of Rab3A-dependent homeostatic increases in mEPC amplitudes at the mouse neuromuscular junction. In sum, we dispute that there is only one novel finding and that we have no insights into mechanism. We acknowledge that we have no direct evidence for regulation from the presynaptic side, and have removed this claim from the revised manuscript. We have retained the Discussion of potential mechanisms affecting the presynaptic quantum and evidence that Rab3A is implicated in these mechanisms (vesicle size, fusion pore kinetics; Discussion, lines 537 to 563). One way to directly show that the amount of transmitter released for an mEPSC has been modified after activity blockade is to demonstrate that a fast off-rate antagonist has become less effective at inhibiting mEPSCs (because the increased glutamate released out competes it; see (Liu et al., 1999) and (Wilson et al., 2005) for example experiments). This set of experiments is underway but will take more time than originally expected, because we are finding surprisingly large decreases in frequency, possibly the result of mEPSCs with very low glutamate concentration that are completely inhibited by the dose used. Once mEPSCs are lost, it is difficult to compare the mEPSC amplitude before and after application of the antagonist. Therefore we intend to include this experiment in a future report, once we determine the reason for the frequency reduction, or, can find a dose where this does not occur.
(1) Their major argument for this is that homeostatic effects on mEPSC amplitudes and GluA2 cluster sizes do not match. This is inconsistent with reports from multiple labs showing that upscaling of mEPSC amplitude and GluA2 accumulation occur side by side during scaling (Ibata et al., 2008; Pozo et al., 2012; Tan et al., 2015; Silva et al., 2019). Further, because the acquisition and quantification methods for mEPSC recordings and immunohistochemistry imaging are entirely different (each with its own limitations in signal detection), it is not convincing that the lack of proportional changes must signify a presynaptic component.
Within the analyses in the revised manuscript, which are now based only on comparison of cell/dendrite means, we find a very good match in the magnitude of increase for the pooled data of mEPSC amplitudes and GluA2 receptor cluster sizes (+19.7% and +20.0% respectively; new Table 1). However, when looking at individual cultures, we had one of three WT cultures in which mEPSC amplitude increased 17.2% but GluA2 cluster size decreased 9.5%. This result suggests that while activity blockade does lead to an increase in GluA2 receptors after activity blockade, the effect is more variable than that for mEPSC amplitude. We went back to published studies to see if this has been previously observed, but found that it was difficult to compare because the sample sizes were different for the two characteristics (see Author response table 1). We included these particular 5 studies because they use the same treatment (TTX), examine receptors using imaging of identified synaptic sites, and record mEPSCs in their cultures (although the authors do not indicate that imaging and recordings are done simultaneously on the same cultures.) Only one of the studies listed by the Reviewer is in our group (Ibata et al., 2008). The study by (Tan et al., 2015) uses western blots to measure receptors; the study by (Silva et al., 2019) blocks activity using a combination of AMPA and NMDA receptor blockers; the study by (Pozo et al., 2012) correlates mEPSC amplitude changes with imaging but not in response to activity blockade, instead for changing the expression of GluA2. While it may seem like splitting hairs to reject studies that use other treatment protocols, there is ample evidence that the mechanisms of homeostatic plasticity depend on how activity was altered, see the following studies for several examples of this (Sutton et al., 2006; Soden and Chen, 2010; Fong et al., 2015). A discussion of the 5 articles we selected is in the revised manuscript, Discussion, lines 456 to 474. In sum, we provide evidence that activity blockade is associated with an overall increase in GluA2 receptors; what we propose is that this increase, being more variable, does not fully explain the increase in mEPSC amplitude. However, we acknowledge that the disparity could be explained by the differences in limitations of the two methods (Discussion, lines 469-472).
(2) The authors also speculate in the discussion that presynaptic Rab3A could be interacting with retrograde BDNF signaling to regulate postsynaptic AMPARs. Without data showing Rab3A-dependent presynaptic changes after TTX treatment, this argument is not compelling. In this retrograde pathway, BDNF is synthesized in and released from dendrites (Jakawich et al., 2010b; Thapliyal et al., 2022), and it is entirely possible for postsynaptic Rab3A to interfere with this process cell-autonomously.
We have added the information that Rab3A could control BDNF from the postsynaptic cell and included the two references provided by the reviewer, Discussion, lines 517 to 518. We have added new evidence, recently published, that the Rab3 family has been shown to regulate targeting of EGF receptors to rafts (among other plasma membrane molecules), with Rab3A itself clearly present in nonneuronal cells (Diaz-Rohrer et al., 2023) (added to Discussion, lines 509 to 515).
(3) The authors propose that a change in AMPAR subunit composition from GluA2-containing ones to GluA1 homomers may account for the distinct changes in mEPSC amplitudes and GluA2 clusters. However, their data from the NASPM wash-in experiments clearly show that the GluA1 homomer contributions have not changed before and after TTX treatment.
We have revised this section in the Discussion, lines 534 to 536, to clarify that any change due to GluA1 homomers should have been detectable by a greater ability of NASPM to reverse the TTX-induced increase.
Reviewer #2 (Recommendations for the Authors):
For authors to have more convincing arguments in general, they will need to clarify/improve certain details in their data collection by addressing the above technical concerns. Additionally, the authors should design experiments to test whether Rab3A regulates scaling from pre- or post-synaptic site. For example, they could sparsely knock out Rab3A in WT neurons to test the postsynaptic possibility. On the other hand, their argument for a presynaptic role would be much more compelling if they could show whether there are clear functional changes such as in vesicle sizes and release probability in the presynaptic terminal of Rab3AKO neurons.
An important next step is to identify whether Rab3A is acting pre- or post-synaptically (Discussion, lines 572 to 573), but these experiments will be undertaken in the future. It would not add much to simply show vesicle size is altered in the KO (and we do not necessarily expect this since mEPSC amplitude is normal in the KO). It will be very difficult to establish that vesicle size is changing with activity blockade and that this change is prevented in the Rab3A KO, because we are looking for a ~25% increase in vesicle volume, which would correspond to a ~7.5% increase in diameter. Finally, we do not believe demonstrating changes in release probability tell us anything about a presynaptic role for Rab3A in regulating the size of the presynaptic quantum.
Reviewer #3 (Public Review)
Weaknesses: However, the rather strong conclusions on the dissociation of AMPAR trafficking and synaptic response are made from somewhat weaker data. The key issue is the GluA2 immunostaining in comparison with the mEPSC recordings. Their imaging method involves only assessing puncta clearly associated with a MAP2 labeled dendrite. This is a small subset of synapses, judging from the sample micrographs (Fig. 5). To my knowledge, this is a new and unvalidated approach that could represent a particular subset of synapses not representative of the synapses contributing to the mEPSC change (they are also sampling different neurons for the two measurements; an additional unknown detail is how far from the cell body were the analyzed dendrites for immunostaining.) While the authors acknowledge that a sampling issue could explain the data, they still use this data to draw strong conclusions about the lack of AMPAR trafficking contribution to the mEPSC amplitude change. This apparent difference may be a methodological issue rather than a biological one, and at this point it is impossible to differentiate these. It will unfortunately be difficult to validate their approach. Perhaps if they were to drive NMDAdependent LTD or chemLTP, and show alignment of the imaging and ephys, that would help. More helpful would be recordings and imaging from the same neurons but this is challenging. Sampling from identified synapses would of course be ideal, perhaps from 2P uncaging combined with SEP-labeled AMPARs, but this is more challenging still. But without data to validate the method, it seems unwarranted to make such strong conclusions such as that AMPAR trafficking does not underlie the increase in mEPSC amplitude, given the previous data supporting such a model.
In the new version, we soften our conclusion regarding the mismatch between GluA2 receptor levels and mEPSC amplitudes, now only stating that receptors may not be the sole contributor to the TTX effect on mEPSC amplitude (Discussion, lines 472 to 474). With our analysis in the new version focusing on comparisons of cell means, the GluA2 receptor cluster size and the mEPSC amplitude data match well in magnitude for the data pooled across the 3 matched cultures (20.0% and 19.7%, respectively, see new Table 1). However, in one of the three cultures the direction of change for GluA2 receptors is opposite that of mEPSC amplitudes (Table 1, Culture #3, -9.5% vs +17.2%, respectively).
It is unlikely that the lack of matching of homeostatic plasticity in one culture, but very good matching in two other cultures, can be explained by an unvalidated focus on puncta associated with MAP2 positive dendrites. We chose to restrict analysis of synaptic GluA2 receptors to the primary dendrite in order to reduce variability, reasoning that we are always measuring synapses for an excitatory pyramidal neuron, synapses that are relatively close to the cell body, on the consistently identifiable primary dendrite. We measured how far this was for the two cells depicted in old Figure 5 (new Fig. 4). Because we always used the 5X zoom window which is a set length, and positioned it within ~10 microns of the cell body, these cells give a ball park estimate for the usual distances. For the untreated cell, the average distance from the cell body was 38.5 ± 2.8 µm; for the TTX-treated cell, it was 42.4 ± 3.2 µm (p = 0.35, KruskalWallis test). We have added these values to the Results, lines 270 to 274.
We did not mean to propose that AMPA receptor levels do not contribute at all to mEPSC amplitude, and we acknowledge there are clear cases where the two characteristics change in parallel (for example, in the study cited by Reviewer #2, (Pozo et al., 2012), increases in GluA2 receptors due to exogenous expression are closely matched by increases in mEPSC amplitudes.) What our matched culture experiments demonstrate is that in the case of TTX treatment, both GluA2 receptors and mEPSC amplitudes increase on average, but sometimes mEPSC amplitudes can increase in the absence of an increase in GluA2 receptors (Culture #3, Rab3A+/+ cultures), and sometimes mEPSC amplitudes do not increase even though GluA2 receptor levels do increase (Culture #3, Rab3A-/- cultures). Therefore, it would not add anything to our argument to examine receptors and mEPSCs in NMDA-dependent LTP, a different plasticity paradigm in which changes in receptors and mEPSCs may more closely align. It has been demonstrated that mEPSCs of widely varying amplitude can be recorded from a single synaptic site (Liu and Tsien, 1995), so we would need to measure a large sample of individual synapse recordings to detect a modest shift in average values due to activity blockade. In addition, it would be essential to express fluorescent AMPA receptors in order to correlate receptor levels in the same cells we record from (or at the same synapses). And yet, even after these heroics, one is still left with the issue that the two methods, electrophysiology and fluorescent imaging, have distinct limitations and sources of variability that may obscure any true quantitative correlation.
Other questions arise from the NASPM experiments, used to justify looking at GluA2 (and not GluA1) in the immunostaining. First, there is a frequency effect that is quite unclear in origin. One would expect NASPM to merely block some fraction of the post-synaptic current, and not affect pre-synaptic release or block whole synapses. It is also unclear why the authors argue this proves that NASPM was at an effective concentration (lines 399-400). Further, the amplitude data show a strong trend towards smaller amplitude. The p value for both control and TTX neurons was 0.08 – it is very difficult to argue that there is no effect. And the decrease is larger in the TTX neurons. Considering the strong claims for a presynaptic locus and the use of this data to justify only looking at GluA2 by immunostaining, these data do not offer much support of the conclusions. Between the sampling issues and perhaps looking at the wrong GluA subunit, it seems premature to argue that trafficking is not a contributor to the mEPSC amplitude change, especially given the substantial support for that hypothesis. Further, even if trafficking is not the major contributor, there could be shifts in conductance (perhaps due to regulation of auxiliary subunits) that does not necessitate a pre-synaptic locus. While the authors are free to hypothesize such a mechanism, it would be prudent to acknowledge other options and explanations.
We have created a model cartoon to explain how NASPM could reduce mEPSC frequency (new Fig. 3D). mEPSCs that arise from a synaptic site that has only Ca2+-permeable AMPA receptors will be completely blocked by NASPM, if the NASPM concentration is maximal. The reason we conclude that we have sufficient NASPM reaching the cells is that the frequency is decreased, as expected if there are synaptic sites with only Ca2+-permeable AMPA receptors. We previously were not clear that there is an effect of NASPM on mEPSC amplitude, although it did not reach statistical significance (new Fig. 3B). Where there is no effect is on the TTX-induced increase in mEPSC amplitude, which remains after the acute NASPM application (new Fig. 3A). We have revised the description of these findings in Results, lines 220 to 241. In reviewing the literature further, we could find no previous studies demonstrating an increase in conductance in GluA2 or Ca2+-impermeable receptors, only in GluA1 homomers. In other words, any conductance change would have been due to a change in GluA1 homomers, and should have been visible as a disruption of the homeostatic plasticity by NASPM application. We have added text to Results, lines 211 to 217; 236-241; Discussion, lines 420 to 422; 526-536 and Methods, lines 685 to 695 regarding this point.
The frequency data are missing from the paper, with the exception of the NASPM dataset. The mEPSC frequencies should be reported for all experiments, particularly given that Rab3A is generally viewed as a pre-synaptic protein regulating release. Also, in the NASPM experiments, the average frequency is much higher in the TTX treated cultures. Is this statistically above control values?
This comment is addressed by the major change #3, above.
Unaddressed issues that would greatly increase the impact of the paper:
(1) Is Rab3A activity pre-synaptically, post-synaptically or both. The authors provide good evidence that Rab3A is acting within neurons and not astrocytes. But where is it acting (pre or post) would aid substantially in understanding its role (and particularly the hypothesized and somewhat novel idea that the amount of glutamate released per vesicle is altered in HSP). They could use sparse knockdown of Rab3A, or simply mix cultures from KO and WT mice (with appropriate tags/labels). The general view in the field has been that HSP is regulated post-synaptically via regulation of AMPAR trafficking, and considerable evidence supports this view. The more support for their suggestion of a pre-synaptic site of control, the better.
This is similar to the request of Reviewer #2, Recommendations to the Authors. An important next step is to identify whether Rab3A is working pre- or postsynaptically. However, it is possible that it is acting pre-synaptically to anterogradely regulate trafficking of AMPAR, as we have depicted in our model, new Fig. 9. To demonstrate that the presynaptic quantum is being altered, we would need to show that vesicle size is increased, or the amount of transmitter being released during an mEPSC is increased after activity blockade. To that end, we are currently performing experiments using a fast off-rate antagonist. As described above in response to Reviewer #2’s Conceptual Concerns, we find dramatic decreases in frequency not explained by the 30-60% inhibition observed for the largest amplitude mEPSCs, which suggests the possibility that small mEPSCs are more sensitive than large mEPSCs and therefore may have less transmitter. Due to these complexities and the delay while we test other antagonists to see if the effect is specific to fast-off rate antagonists, we are not including these results here.
(2) Rab3A is also found at inhibitory synapses. It would be very informative to know if HSP at inhibitory synapses is similarly affected. This is particularly relevant as at inhibitory synapses, one expects a removal of GABARs and/or a decrease of GABA-packaging in vesicles (ie the opposite of whatever is happening at excitatory synapses.). If both processes are regulated by Rab3A, this might suggest a role for this protein more upstream in the signaling, an effect only at excitatory synapses would argue for a more specific role just at these synapses.
It will be important to determine if homeostatic synaptic plasticity at inhibitory synapses on excitatory neurons is sensitive to Rab3A deletion, especially in light of the fact that unlike many of the other molecules implicated in homeostatic increases in mEPSCS, Rab3A is not a molecule known to be selective for glutamate receptor trafficking (in contrast to Arc/Arg3.1 or GRIP1, for example). Such a study would warrant its own publication.
Reviewer #3 (Recommendations for the Authors):
There are a number of minor points or suggestions for the authors:
Is RIM1 part of this pathway (or expected to be)? Some discussion of this would be nice.
RIM, Rab3-interacting molecule, has been implicated at the drosophila neuromuscular junction in a presynaptic form of homeostatic synaptic plasticity in which evoked release is increased after block of postsynaptic receptors (Muller et al., 2012), a plasticity that also requires Rab3-GAP (Muller et al., 2011). To our knowledge there is no evidence that RIM is involved in the homeostatic plasticity of mEPSC amplitude after activity blockade by TTX. The Rim1a KO does not have a change in mEPSC amplitude relative to WT (Calakos et al., 2004), but that is not unexpected given the normal mEPSC amplitude in neurons from cultures prepared from Rab3A-/- mice in the current study. It would be interesting to look at homeostatic plasticity in cortical cultures prepared from Rim1a or other RIM deletion mice, but we have not added these points to the revised manuscript since there are a number of directions one could go in attempting to define the molecular pathway and we feel it is more important to discuss the potential location of action and physiological mechanisms.
Is the Earlybird mutation a GOF? More information about this mutation would help.
We have added a description of how the Earlybird mutation was identified, in a screen for rest:activity mutants (Results, lines 118 to 123). Rab3A Earlybird mice have a shortened circadian period, shifting their wake cycle earlier and earlier. When Rab3A deletion mice were tested in the same activity raster plot measurements, the shift was smaller than that for the Earlybird mutant, suggesting the possibility that it is a dominant negative mutation.
The high K used in the NASPM experiments seems a bit unusual. Have the authors done high K/no drug controls to see if this affects the synapses in any way?
We used the high K based on previous studies that indicated the blocking effect of the Ca2+-permeable receptor blockers was use dependent (Herlitze et al., 1993; Iino et al., 1996; Koike et al., 1997). We reasoned that a modest depolarization would increase the frequency of AMPA receptor mEPSCs and allow access of the NASPM. We have added this point to the Methods, lines 695 to 708.
The NASPM experiments do not show that GluA1 does not contribute (line 401), only that GluA1 homomers are not contributing (much – see above). GluA1/A2 heteromers are quite likely involved. Also, the SEM is missing from the WT pre/post NASPM data.
Imaging of GluA2-positive sites will not distinguish between GluA2 homomers and GluA2-GluA1 heteromers, so we have added this clarification to Results, lines 242 to 246. We have remade the NASPM pre-post line plots so that the mean values and error bars are more visible (new Fig. 3B, C).
It seems odd to speculate based on non-significant findings (line 650-1), with lower significance (p = 0.11) than findings being dismissed in the paper (NASPM on mEPSC amplitude; p = 0.08).
We did not mean to dismiss the effect of NASPM on mEPSC amplitude (new Fig. 3B), rather, we dismiss the effect of NASPM on the homeostatic increase in mEPSC amplitude caused by TTX treatment (new Fig. 3A). We have emphasized this distinction in Results, lines 223 to 225, and Discussion, lines 420 to 422, as well as adding that the stronger effect of NASPM on frequency after TTX treatment suggests an activity-dependent increase in the number of synapses expressing only Ca2+ permeable homomers (Results, lines 236 to 241; Discussion, lines 431 to 435).
Fig. 4 could be labeled better (to make it clear that B is amplitude and C is freq from the same cells).
Fig. 4 has been revised—now the amplitude and frequency plots from the same condition (new Fig. 3, B, C; CON or TTX) are in a vertical line and the figure legend states that the frequency data are from the same cells as in Fig. 3A.
The raw amplitude data seems a bit hidden in the inset panels – I would suggest these data are at least as important as the cumulative distributions in the main panel. Maybe re-organizing the figures would help.
We have removed all cumulative distributions, rank order plots, and ratio plots. The box plots are now full size in new Figures 1, 2, 5, 6, 7 and 8.
I’m not sure I would argue in the paper that 12 cells a day is a limiting issue for experiments. It doesn’t add anything and doesn’t seem like that high a barrier. It is fine to just say it is difficult and therefore there is a limited amount of data meeting the criteria.
We have removed the comment regarding difficulty.
Calakos N, Schoch S, Sudhof TC, Malenka RC (2004) Multiple roles for the active zone protein RIM1alpha in late stages of neurotransmitter release. Neuron 42:889-896.
De Gois S, Schafer MK, Defamie N, Chen C, Ricci A, Weihe E, Varoqui H, Erickson JD (2005) Homeostatic scaling of vesicular glutamate and GABA transporter expression in rat neocortical circuits. J Neurosci 25:7121-7133.
Diaz-Rohrer B, Castello-Serrano I, Chan SH, Wang HY, Shurer CR, Levental KR, Levental I (2023) Rab3 mediates a pathway for endocytic sorting and plasma membrane recycling of ordered microdomains. Proc Natl Acad Sci U S A 120:e2207461120.
Dubes S, Soula A, Benquet S, Tessier B, Poujol C, Favereaux A, Thoumine O, Letellier M (2022) miR-124dependent tagging of synapses by synaptopodin enables input-specific homeostatic plasticity. EMBO J 41:e109012.
Fong MF, Newman JP, Potter SM, Wenner P (2015) Upward synaptic scaling is dependent on neurotransmission rather than spiking. Nat Commun 6:6339.
Herlitze S, Raditsch M, Ruppersberg JP, Jahn W, Monyer H, Schoepfer R, Witzemann V (1993) Argiotoxin detects molecular differences in AMPA receptor channels. Neuron 10:1131-1140.
Hou Q, Zhang D, Jarzylo L, Huganir RL, Man HY (2008) Homeostatic regulation of AMPA receptor expression at single hippocampal synapses. Proc Natl Acad Sci U S A 105:775-780.
Ibata K, Sun Q, Turrigiano GG (2008) Rapid synaptic scaling induced by changes in postsynaptic firing. Neuron 57:819-826.
Iino M, Koike M, Isa T, Ozawa S (1996) Voltage-dependent blockage of Ca(2+)-permeable AMPA receptors by joro spider toxin in cultured rat hippocampal neurones. J Physiol 496 ( Pt 2):431437.
Jakawich SK, Neely RM, Djakovic SN, Patrick GN, Sutton MA (2010a) An essential postsynaptic role for the ubiquitin proteasome system in slow homeostatic synaptic plasticity in cultured hippocampal neurons. Neuroscience 171:1016-1031.
Jakawich SK, Nasser HB, Strong MJ, McCartney AJ, Perez AS, Rakesh N, Carruthers CJ, Sutton MA (2010b) Local presynaptic activity gates homeostatic changes in presynaptic function driven by dendritic BDNF synthesis. Neuron 68:1143-1158.
Kapfhamer D, Valladares O, Sun Y, Nolan PM, Rux JJ, Arnold SE, Veasey SC, Bucan M (2002) Mutations in Rab3a alter circadian period and homeostatic response to sleep loss in the mouse. Nat Genet 32:290-295.
Koike M, Iino M, Ozawa S (1997) Blocking effect of 1-naphthyl acetyl spermine on Ca(2+)-permeable AMPA receptors in cultured rat hippocampal neurons. Neurosci Res 29:27-36.
Liu G, Tsien RW (1995) Properties of synaptic transmission at single hippocampal synaptic boutons. Nature 375:404-408.
Liu G, Choi S, Tsien RW (1999) Variability of neurotransmitter concentration and nonsaturation of postsynaptic AMPA receptors at synapses in hippocampal cultures and slices. Neuron 22:395409.
Muller M, Pym EC, Tong A, Davis GW (2011) Rab3-GAP controls the progression of synaptic homeostasis at a late stage of vesicle release. Neuron 69:749-762.
Muller M, Liu KS, Sigrist SJ, Davis GW (2012) RIM controls homeostatic plasticity through modulation of the readily-releasable vesicle pool. J Neurosci 32:16574-16585.
Pozo K, Cingolani LA, Bassani S, Laurent F, Passafaro M, Goda Y (2012) beta3 integrin interacts directly with GluA2 AMPA receptor subunit and regulates AMPA receptor expression in hippocampal neurons. Proc Natl Acad Sci U S A 109:1323-1328.
Silva MM, Rodrigues B, Fernandes J, Santos SD, Carreto L, Santos MAS, Pinheiro P, Carvalho AL (2019) MicroRNA-186-5p controls GluA2 surface expression and synaptic scaling in hippocampal neurons. Proc Natl Acad Sci U S A 116:5727-5736.
Soden ME, Chen L (2010) Fragile X protein FMRP is required for homeostatic plasticity and regulation of synaptic strength by retinoic acid. J Neurosci 30:16910-16921.
Sun HY, Bartley AF, Dobrunz LE (2009) Calcium-permeable presynaptic kainate receptors involved in excitatory short-term facilitation onto somatostatin interneurons during natural stimulus patterns. J Neurophysiol 101:1043-1055.
Sutton MA, Ito HT, Cressy P, Kempf C, Woo JC, Schuman EM (2006) Miniature neurotransmission stabilizes synaptic function via tonic suppression of local dendritic protein synthesis. Cell 125:785-799.
Tan HL, Queenan BN, Huganir RL (2015) GRIP1 is required for homeostatic regulation of AMPAR trafficking. Proc Natl Acad Sci U S A 112:10026-10031.
Thapliyal S, Arendt KL, Lau AG, Chen L (2022) Retinoic acid-gated BDNF synthesis in neuronal dendrites drives presynaptic homeostatic plasticity. Elife 11.
Wilson NR, Kang J, Hueske EV, Leung T, Varoqui H, Murnick JG, Erickson JD, Liu G (2005) Presynaptic regulation of quantal size by the vesicular glutamate transporter VGLUT1. J Neurosci 25:62216234.
Wu YK, Hengen KB, Turrigiano GG, Gjorgjieva J (2020) Homeostatic mechanisms regulate distinct aspects of cortical circuit dynamics. Proc Natl Acad Sci U S A 117:24514-24525.
Xu X, Pozzo-Miller L (2017) EEA1 restores homeostatic synaptic plasticity in hippocampal neurons from Rett syndrome mice. J Physiol 595:5699-5712.
-
-
-
Author Response
Thank you for your thorough critique and thoughtful suggestions for improving our manuscript, "Homeostatic Synaptic Plasticity of Miniature Excitatory Postsynaptic Currents in Mouse Cortical Cultures Requires Neuronal Rab3A.” The reviewers’ detailed comments suggest that showing multiple types of graphs to demonstrate the presence of divergent scaling of mEPSC amplitudes in cultures from Rab3A wild type, and its disruption in cultures from Rab3A knockout mice, had the unintended consequence of obscuring the major results of our study. Furthermore, our proposal that the difference in characteristics of scaling of GluA2 receptor expression compared to that of mEPSC amplitudes, based on the ratio plots, indicated that a mechanism other than postsynaptic receptors likely contributes to the homeostatic increase in mEPSC …
Author Response
Thank you for your thorough critique and thoughtful suggestions for improving our manuscript, "Homeostatic Synaptic Plasticity of Miniature Excitatory Postsynaptic Currents in Mouse Cortical Cultures Requires Neuronal Rab3A.” The reviewers’ detailed comments suggest that showing multiple types of graphs to demonstrate the presence of divergent scaling of mEPSC amplitudes in cultures from Rab3A wild type, and its disruption in cultures from Rab3A knockout mice, had the unintended consequence of obscuring the major results of our study. Furthermore, our proposal that the difference in characteristics of scaling of GluA2 receptor expression compared to that of mEPSC amplitudes, based on the ratio plots, indicated that a mechanism other than postsynaptic receptors likely contributes to the homeostatic increase in mEPSC amplitude was not convincing to the reviewers. Reviewers 2 and 3 point out these results might be explained by differences in the limitations and artifacts of the two very distinct techniques, electrophysiology and fluorescence imaging. In the revision we will acknowledge that a greater variability in the signal, or, more issues with signal over noise, might be present in imaging experiments compared to electrophysiology. This could explain the lack of identical effects on GluA2 receptors compared to mEPSC amplitudes in the matched experiments, but we maintain it is also possible that a greater variability in GluA2 responses is biologically meaningful. Further, an issue with the accuracy of imaging experiments to report the true receptor effects would also call into question the conclusion that receptors always increase after activity blockade. Finally, the graphs illustrating the detailed characteristics of scaling with rank order and ratio plots required pooling multiple samples per cell, which precludes application of standard statistical methods to determine whether effects or differences reach statistical significance. Therefore, we will remove the cumulative distribution functions, rank order plots, and ratio plots, and show only analyses that involve a single sample per cell. This major change will simplify and clarify the main findings, that homeostatic plasticity of both mEPSC amplitude and GluA2 receptor expression in mouse cortical cultures involves the synaptic vesicle protein Rab3A operating in neurons rather than astrocytes. We will focus our comparison between mEPSC amplitudes and receptors in the same cultures to differences between the magnitude of effects on the mean or median, and will make clear that overall, our data can be explained by two possibilities: 1) the presynaptic vesicle protein is acting via regulation of postsynaptic receptors alone, or, it is regulating both postsynaptic receptors and another contributor to mEPSC amplitude, possibly amount of transmitter released by a single vesicle. Either way, it is very surprising that this presynaptic protein is involved in postsynaptic changes, so our results represent a novel contribution to the field of homeostatic plasticity. In sum, the changes we propose should go a long way towards addressing the majority of the reviewers’ major critiques.
A related issue raised by the reviewers was that the model describing potential presynaptic mechanisms of Rab3A in homeostatic plasticity was not supported by direct evidence (Figure 10). We meant the model to introduce the possibility of a presynaptic contribution to mEPSC amplitude and to stimulate future research, but clearly did not communicate its speculative nature, neither in the Figure legend nor in our discussion of potential mechanisms. In the revision, we will restrict the model to the direct findings in this study. Additionally, we will state where appropriate, that while previous findings at the mouse NMJ are consistent with a presynaptic role for Rab3A (Wang et al., 2011), in the current study there is no direct evidence for this idea in cortical cultures other than the quantitative differences in the fold increases in mEPSC amplitudes and GluA2 receptors which were assayed in the same cultures.
We will submit a revised version addressing each of the reviewer’s concerns and suggestions as described above and below; these major modifications will greatly improve the readability of the manuscript and clarify the main results.
Reviewer #1
Koesters and colleagues investigated the role of the presynaptic small GTPase Rab3A in homeostatic scaling of miniature synaptic transmission in primary mouse cortical cultures using electrophysiology and immunohistochemistry. The major finding is that TTX incubation for 48 hours does not induce an increase in the amplitude of excitatory synaptic miniature events in neuronal cultures derived from Rab3A KO and Rab3A Earlybird mutant mice. NASPM application had comparable effects on mEPSC amplitude in control and after TTX, implying that Ca2+-permeable glutamate receptors are unlikely modulated during synaptic scaling. Immunohistochemical analysis revealed an increase in GluA2 puncta size and intensity in wild type, but not Rab3A KO cultures. Finally, they provide evidence that loss of Rab3A in neurons, but not astrocytes, blocks homeostatic scaling. Based on these data, the authors propose a model in which presynaptic Rab3A is required for homeostatic scaling of synaptic transmission through GluA2-dependent and independent mechanisms.
While the title of the manuscript is mostly supported by data of solid quality, many conclusions, as well as the final model, cannot be derived from the results presented. Importantly, the results do not indicate that Rab3A modulates quantal size on both sides of the synapse. Moreover, several analysis approaches seem inappropriate.
The following points should be addressed:
- The model shown in Figure 10 is not supported by the data. The authors neither provide evidence for two different functional states of Rab3A being involved in mEPSC amplitude modulation, nor for a change in glutamate content of vesicles. Furthermore, the data do not fully support the conclusion of a presynaptic role for Rab3A in homeostatic scaling.
We will revise the model, removing presynaptic mechanisms for Rab3A and restricting it to the direct findings in this study.
- The analysis of mEPSC data using quantile sampling followed by ratio calculation is not meaningful under the tested experimental conditions because of the following reasons:
(i) The analysis implicitly assumes that all events have been detected. The prominent mEPSC frequency increase after TTX suggests that this is not the case, i.e., many (small) mEPSCs are likely missed under control conditions.
We explicitly addressed the potential contribution of missed mEPSCs that are below threshold in (Hanes et al., 2020). We found that even simulating a threshold of 7 pA, applied to data artificially modified by uniformly multiplying the control data set, did not generate a ratio plot with the increasing ratio over 75% of the data that we observe in the experimental data. Overall, the findings from simulating a threshold and a uniform multiplicative factor illustrate that the threshold issue does not cause major changes to the data. Furthermore, in cultures from Rab3A+/+ mice from the Rab3AEbd/+ colony, the mEPSC amplitudes were significantly smaller than those recorded in cultures from Rab3A+/+ mice from the Rab3A+/- colony (lines 327-329, 11 pa vs 13 pA), indicating that if there were smaller mEPSCs occurring in the Rab3A+/+ data set, we would have detected them. Although for these reasons we feel it is unlikely our ratio plot analysis is invalid, to clarify the result that homeostatic plasticity of mEPSC amplitude requires functioning Rab3A, we will remove the ratio plots.
(ii) The analysis is used to conclude how events of a certain size are altered by TTX treatment. However, this analysis compares the smallest mEPSCs of the TTX condition with the smallest control mEPSCs, but this is not a pre-post experimental design. Variation between cells and between coverslips will markedly affect the results and lead to misleading interpretations.
The rank order plot is a well-established plot to examine the mathematical transformation caused by homeostatic plasticity, first used in (Turrigiano et al., 1998). We included it here to facilitate comparison of our findings with previous results. We introduced the ratio plot in (Hanes et al., 2020), finding it shows more clearly differences occurring in the range of small mEPSC values. The reviewer is correct in that we are assuming the smallest mEPSCs before treatment should be matched with the smallest mEPSCs after treatment. It is almost impossible to do a pre-post experimental design for mEPSCs. Even when applying a treatment, for example acute perfusion with a receptor antagonist, to a single cell and recording mEPSCs before and after the treatment, it is not a true pre-post design at the level of mEPSC amplitudes, which come from many different inputs. The power of the method is that different characteristic mathematical transformations for different experimental conditions (e.g., genotype or activity protocol) support the idea that those conditions either involve different mechanisms or have altered the mechanism. Such differences might be missed by only comparing means or medians. However, we found no evidence that loss of Rab3A or expression of the Rab3A Earlybird mutant altered the mathematical transformation due to homeostatic plasticity, other than to reduce its magnitude across all amplitudes. Therefore, including these complex analyses is not adding anything to the finding that Rab3A plays a role in homeostatic plasticity of mEPSC amplitudes and they will be removed in the revision.
(iii) The ratio (TTX/control) vs. control plots seem to suffer from a division by small value artifact (see Figure 6F).
The reviewer is referring to findings on the ratio plot for receptor cluster area. Because the large ratios for the smallest control areas occur in the cultures prepared from wild type mice, and to a much lower extent in cultures prepared from Rab3A knockout mice, we think there is a biologically relevant increase in the TTX/CON ratio, since an artifact due to division by small values should be present in both data sets. However, we cannot rule out that the differences in ratio plot behavior between receptors and mEPSC amplitudes result from the different limitations in detection of receptor clusters vs. the limits of detection of mEPSCs, so we will remove the ratio plots and focus on comparison of means or medians.
Correspondingly, ratio-analysis differs considerably for different control conditions (Fig. 1Giii, Fig. 2Giii, Fig. 6C, Fig. 9A).
The reviewer is correct to point out that the ratio plot shows differences across control conditions (note, these differences are not obvious with the more standard rank order plot). The magnitude of the 50th percentile ratio differs across control conditions, and behaviors of the largest mEPSCs also differ, with some ratios going down at the highest control amplitudes (1Giii, 6C), and others continuing to increase with increasing control amplitude (2Giii, 9A). They all share the divergent increasing ratio from smallest mEPSC amplitude to around the 20 pA level. We attribute the differences in magnitude to the differences in experimental conditions: 1Giii is Rab3A+/+ from the +/+ colony; 1Giii is Rab3A+/+ from the Ebd/+ colony; 6C is a set of Rab3A+/+ cultures assayed several years after the set in 1Giii; 9A is a different culture condition altogether, with neurons being plated onto an already formed bed of astrocytes. Effects on the largest mEPSCs are likely attributable to the small number and high variability of amplitudes in this range. Since the variability in the very sensitive ratio plot have taken away from the main findings of homeostatic plasticity being disrupted in the absence of functioning Rab3A in neurons, we will remove the rank-order and the ratio plots from the manuscript.
- As noted by the authors in a previous publication (Hanes et al. 2020), statistical analysis of CDFs suffers from ninflation. In addition, the quantile sampling method chosen violates an important assumption of the K-S test. Indeed, pvalues for these comparisons are typically several orders of magnitude smaller. Given that the statistical N most likely corresponds to the number of cultures (see, e.g., https://doi.org/10.1371/journal.pbio.2005282), CDF comparisons are not informative and should thus not be used to draw conclusions from the data. The plots can be informative, though.
As the reviewer acknowledges, we were very careful in (Hanes et al., 2020) to state that the p values could not be used to determine significance in the KS test of cumulative distributions for pooled data because the KS test assumes a single sample per cell. We also suggested in that study that the p values could be used in a comparative way for looking at data sets with similar (inflated) n values to say something about bigger or smaller differences. We failed to reiterate those caveats here. In reviewing the article “What is N” by (Lazic et al., 2018) (which we very much appreciate being shown by the reviewer), we agree that in the current study where we are attempting to show how the effect of homeostatic plasticity is or is not altered by loss of Rab3A function, it is imperative that we be able to make conclusions about statistical significance. The pooling approach is essential for having some sense of the mEPSC amplitude distributions, but that is not necessary for looking at the effect of Rab3A. Therefore, we will remove all analyses that involve pooling of multiple mEPSC amplitudes per cell.
- How does recoding noise and the mEPSC amplitude threshold affect "divergent scaling"?
We addressed this in our 2020 paper (Hanes et al., 2020) where we showed that the experimental homeostatic increase in mEPSC amplitude cannot be simulated with uniform, multiplicative synaptic scaling whether we included or excluded distortion caused by a detection threshold.
- What is the justification for the line fits of the ratio data/how was the fit range chosen?
We are assuming the reviewer is referring to the line fits for the rank-order data. If so, the fit range is the entire range of the data. This issue will be addressed by the removal of the rank-order plots from the manuscript.
- TTX application induces a significant increase in mEPSC amplitude in Rab3A-/- mice in two out of three data sets (Figs. 1 and 9). Hence, the major conclusion that Rab3A is required for homeostatic scaling is only partially supported by the data.
Based on the p-values for comparison of means with a Kruskal-Wallis test, we would argue that TTX application does not show a significant increase in mEPSC amplitude in Rab3A-/- neurons (Figure 1 p-value = .318; Figure 9 p-value = .125) when comparing to untreated control mEPSC amplitude means. It is only when we use the KS test and the inflated n’s that we get a barely significant results, p = 0.042. Based on the Lazic article (Lazic et al., 2018), we would now conclude that we cannot use the KS p value in that analysis. We have tried to be clear that the effect of TTX application on mEPSC amplitude in Rab3A-/- neurons is not completely abolished, but rather is dramatically reduced, which we acknowledge in the manuscript (line 279). This issue will be addressed by removal of CDFs from the manuscript.
- Line 289: A comparison of p-values between conditions does not allow any meaningful conclusions.
Although we feel that comparison of magnitude of effects can be stated in a qualitative way for similar sized pooled data sets with larger or smaller p-values, we agree that statistical significance has no meaning. This issue will be addressed by removing the CDF plots from the manuscript.
- There is a significant increase in baseline mEPSC amplitude in Rab3AEbd/Ebd (15 pA) vs. Rab3Aebd/+ (11 pA) cultures, but not in Rab3A-/- (13.6 pA) vs. Rab3A+/- (13.9 pA). Although the nature of scaling was different between Rab3AEbd/Ebd vs. Rab3AEbd/+, and Rab3AEbd/Ebd with vs. without TTX, the question arises whether the increase in mEPSC amplitude in Rab3AEbd/Ebd is Rab3A dependent. Could a Rab3A independent mechanism occlude scaling?
We have acknowledged in the manuscript that one explanation for a failure to exhibit homeostatic plasticity in the cultures from Rab3A Earlybird mutant mice is that the already large basal amplitude occludes any further increase (line 366). In the revision we will make sure the occlusion possibility is highlighted, but we will also discuss other proteins that have been implicated in homeostatic plasticity that have caused an increase in mEPSC amplitude and/or AMPA receptors at baseline, for example, Arc/Arg3.1 KO (Shepherd et al., 2006; Beique et al., 2011); Homer KO (Hu et al., 2010) and inhibition of mir-186-5p (Silva et al., 2019).
- Figure 4: NASPM appears to have a stronger effect on mEPSC frequency in the TTX condition vs. control (-40% vs. 15%). A larger sample size might be necessary to draw definitive conclusions on the contribution of Ca2+-permeable AMPARs.
We will acknowledge that Ca2+-permeable AMPARs could be contributing to the frequency increase following activity blockade and will also include analyses of frequency throughout the manuscript.
- The authors discuss previous papers showing changes in VGLUT1 intensity. Was VGLUT intensity altered in the stainings presented in the manuscript?
We will perform analyses VGLUT1 intensity and include them in the manuscript.
- The change in GluA2 area or fluorescence intensity upon TTX treatment in controls is modest. How does the GluA2 integral change?
The changes in GluA2 integrals look exactly like the changes in cluster size and were not included to simplify the results. But with the removal of the CDFs, rank order, and ratio plots, we can easily include integral measurements. What we did not observe was an additive effect with intensity and size such that the effects on integral were of greater magnitude or statistical significance than either alone. We will include the integral plots in the revised manuscript.
- The quantitative comparison between physiology and microscopy data is problematic. The authors report a mismatch in ratio values between the smallest mEPSC amplitudes and smallest GluA2 receptor cluster sizes (l. 464; Figure 8). Is this comparison affected by the fluorescence intensity threshold?
What was the rationale for a threshold of 400 a.u. or 450 a.u.?
We have acquired AOIs of receptor clusters at multiple threshold levels, and can examine whether the results are altered when using a low, medium or high threshold level.
How does this threshold compare to the mEPSC threshold of 3 pA?
The issue with values being below threshold in untreated cultures has been the concern in interpreting effects on mEPSC amplitudes, specifically, whether this mismatch contributes to divergent scaling. A problem of values being below a toohighly set threshold in the control and becoming detectable after the homeostatic plasticity produces a lower ratio than expected, because now there are values in the treated condition that were not present in the control condition. Instead, for GluA2 receptor cluster size, we observed higher TTX/CON ratios at the low end of the data set. So, based on this, the thresholds chosen for imaging are not having the same effect, if that is what is being asked. This issue will be addressed by removing ratio plots.
The conclusion that an increase in AMPAR levels is not fully responsible for the observed mEPSC increase is mainly based on the rank-order analysis of GluA2 intensity, yielding a slope of ~0.9. There are several points to consider here: (i) GluA2 fluorescence intensity did increase on average, as did GluA2 cluster size. (ii) The increase in GluA2 cluster size is very similar to the increase in mEPSC amplitude (each approx. 18-20%). (iii) Are there any reports that fluorescence intensity values are linearly reporting mEPSC amplitudes (in this system)?
We agree that our data show GluA2 receptors increase as based on cluster size, and did not mean to imply otherwise. Our conclusion that there is another contributor to mEPSC amplitude other than receptors is based on two main findings, 1) that the ratio plots for mEPSC amplitudes and receptor cluster size have distinctively different behaviors, and 2) that there are differences in either magnitude or direction of the TTX effect across 6 matched cultures, 3 from WT animals and 3 from TTX animals (see more explanation of this point below, in response to Reviewer 3). To our knowledge, no one has reported homeostatic plasticity effects on a culture by culture basis, and no one has compared imaging results and physiological results for the same cultures. We will remove the ratio plots and the conclusions based on the differences in behavior for mEPSC amplitudes and receptor cluster size. We will acknowledge in the revision that the differences in magnitude and direction across the 6 matched cultures could be due to the differences in limitations and artifacts of imaging fluorescent antibody staining vs. the limitations and artifacts of detecting mEPSCs electrophysiologically. However, we will continue to state that our results could also be due to the possibility that mEPSC amplitude is not changing in lockstep with receptor levels in every situation. To support this proposal, we will discuss those articles that include both measurements, and point out where mEPSC amplitude measurements and receptor levels match and where they do not.
Antibody labelling efficiency, and false negatives of mEPSC recordings may influence the results. The latter was already noted by the authors.
We will add the caveat that antibody labeling efficiency can vary between coverslips. Although we prepared single solutions that were applied to all coverslips in an experiment, this was not possible for the primary antibody to GluA2, which was added to live cultures in individual wells.(iv) It is not entirely clear if their imaging experiments will sample from all synapses. We will add to Materials and Methods that we sample from all the synapses that could be detected by the researcher on the primary dendrite of the pyramidal cell.
Other AMPAR subtypes than GluA2 could contribute, as could kainate or NMDA receptors.
This is true, other AMPARs (GluA3 and/or GluA4) could be contributing, but we only looked at the receptors well established to be contributing to homeostatic plasticity (GluA1 and GluA2). We will acknowledge the possible contribution of other AMPARs in the revised manuscript.
Furthermore, the statement "complete lack of correspondence of TTX/CON ratios" is not supported by the data presented (l. 515ff). First, under the assumption that no scaling occurs in Rab3A-/- , the TTX/CON ratios show a 20-30% change, which indicates the variation of this readout. Second, the two examples shown in Figure 8 for Rab3A+/+ are actually quite similar (culture #1 and #2), particularly when ignoring the leftmost section of the data, which is heavily affected by the raw values approaching zero.
We will remove the ratio plots from the manuscript and the arguments about differences between GluA2 receptors and mEPSC amplitudes that were based on them. However, we maintain that we have demonstrated a lack of consistent effect for GluA2 receptors and mEPSCs in the matched culture experiments. Yes, the readout of homeostatic plasticity in ratio plots for mEPSCs in the Rab3AKO reach over 1.1 in Figure 1, and as high a 1.2 in the cultures where Rab3AKO neurons were plated on Rab3AWT glia (Figure 9). Our point is that if we had measured GluA2 receptor responses to TTX in those same experiments, the ratios should have been above 1. However, in the experiments in which we measured both mEPSCs and GluA2 receptors, the ratios do not match. In culture #1, the ratio for mEPSCs was at 1 for more than 50% of the data, but for GluA2 receptors, was below 1 for more than 50% of the data. In culture #3, the ratio for mEPSCs was below 1 for more than 50% of the data, but for GluA2 receptors was close to 1.2 for 50% of the data. Only for culture #2 do the ratios appear to match. In the revised manuscript, the evidence that GluA2 receptors and mEPSCs are not changing in parallel will be based on the behavior of means or medians in untreated vs TTXtreated cultures, rather than ratio plots. It could be argued that we need a greater number of matched experiments to make conclusions, but the whole point of a matched experiment is that it should always show the same result—we are no longer dealing with the variability in the homeostatic plasticity itself. We will add a statement that the only three explanations left for the failure of mEPSC amplitudes and GluA2 receptors to change in parallel are 1) a true mismatch, 2) a sampling issue, or 3) technical artifacts that occur in one culture and not another.
- Figure 7A: TTX CDF was shifted to smaller mEPSC amplitude values in Rab3A-/- cultures. How can this be explained?
Figure 7A depicts the pooled data that are shown separately for 3 cultures in Figure 8. We observed mEPSC amplitudes being smaller after TTX treatment in some range of the data for all three Rab3AKO cultures, suggesting that this may be a biological result rather than random variation around no change (which would be a ratio of 1). However, this effect is not significant at the level of means, nor in the KS test (which has the issue of inflated n in any case), so we did not highlight this point. This issue will be addressed by the removal of the CDF plots from the manuscript.
Reviewer #2
Technical concerns:
- The culture condition is questionable. The authors saw no NMDAR current present during spontaneous recordings, which is worrisome since NMDARs should be active in cultures with normal network activity (Watt et al., 2000; Sutton et al., 2006).
The (Watt et al., 2000) study recorded mEPSCs in 0 Mg2+ (Figure 1). The (Sutton et al., 2006) study also shows an average mEPSC waveform (Figure 1D) that was recorded from in 0 Mg2+. Our extracellular recording solution contains Mg2+ (1.3 mM) so we likely are not observing NMDA-mediated currents because they are blocked with Mg2+ when strong depolarizations are prevented with TTX in the recording solution. We will add the idea that the NMDA currents are blocked by Mg2+ to Material and Methods.
It is important to ensure there is enough spiking activity before doing any activity manipulation.
We agree that it would be best if network spiking activity were monitored alongside mEPSC recordings, for example by culturing on multi-electrode arrays. Data from these measurements might explain culture to culture variability in homeostatic responses. To our knowledge, most other studies investigating homeostatic plasticity do not monitor network spiking activity in the same cultures that assay mEPSC amplitudes. This is something that the field should move towards. We will add the caveat that activity was not directly measured to the manuscript.
Similarly, it is also unknown whether spiking activity is normal in Rab3A KO/Ebd neurons.
Since we did not measure spiking activity, we cannot address whether the disruption in homeostatic plasticity in cultures prepared from Rab3A KO and Rab3AEbd/Ebd mutant mice is due to an alteration in network activity. If activity were already low in cultures prepared from these genetically altered mice, we would expect mEPSC amplitudes to be increased, compared to those measured in cultures from WT animals. That is not the case in cultures from Rab3A KO mice, so it is unlikely that network activity is reduced. However, mEPSC amplitudes are increased in Rab3AEbd/Ebd cultures, leaving open this possibility. It would have to be a defect unique to neurons in culture, since the Rab3AEbd/Ebd mouse appears normal in every way, suggesting action potential activity is occurring in the brains of these animals in vivo. We will add the possibility that activity is altered in the cultures from Rab3AKO and Rab3AEbd/Ebd to the manuscript.
- Selection of mEPSC events is not conducted in an unbiased manner. Manually selecting events is insufficient for cumulative distribution analysis, where small biases could skew the entire distribution. Since the authors claim their ratio plot is a better method to detect the uniformity of scaling than the well-established rank-order plot, it is important to use an unbiased population to substantiate this claim.
MiniAnalysis (a standard program used for mEPSC event detection and analysis) selects many false positives with the automated feature (due to the very small sizes of events that are close to the noise level) so manual re-evaluation of the automated process is necessary to eliminate false positives. As soon as there is a manual step, bias is introduced. Interestingly, a manual reevaluation step was applied in a recent study that describes their process as ‘unbiased” (Wu et al., 2020). The alternative is to apply a very large threshold, reducing or eliminating false positives. However, this has the effect of biasing the data towards large events. In sum, we do not believe it is currently possible to perform a completely unbiased detection process. We feel that it is important to include as many small events as possible to reduce the problem of having events in the TTX experimental group that were not matched by events in the control experimental group, for the rank order and ratio plots, so setting the threshold low and manually detecting events accomplishes this. We will add to the Materials and Methods section that the person selecting events did not have information on whether the record was from an untreated or a TTX-treated cell at the time of selection. All of these issues, the potential for skewing the CDFs, and bias potentially interfering in the true rank order and ratio relationships, are addressed by removal of the CDFs, ratio and rank-order plots from the manuscript.
- Immunohistochemistry data analysis is problematic. The authors only labeled dendrites without doing cell-fills to look at morphology, so it is questionable how they differentiate branches from pyramidal neurons and interneurons. Since glutamatergic synapses on these two types of neuron scale in the opposite directions, it is crucial to show that only pyramidal neurons are included for analysis.
MAP2, in addition to labeling dendrites, also labels the cell body, and we used the cell structure revealed by MAP2 staining to select pyramidal-shaped neurons. The selection of the primary dendrite of a pyramidal neuron was stated in lines 239-240 in Materials and Methods and lines 1094 in the figure legend, but we had not explicitly stated how we knew it was a pyramidal neuron. We will include a low power picture of each of the selected pyramidal neurons in the revision.
Conceptual concerns:
The only novel finding here is the implicated role for Rab3A in synaptic scaling, but insights into mechanisms behind this observation are lacking. The author claims that Rab3A likely regulates scaling from the presynaptic side, yet there is no direct evidence from data presented. In its current form, this study's contribution to the field is very limited.
We acknowledge that a presynaptic mechanism is involved in the regulation of homeostatic plasticity by Rab3A is not supported by direct evidence in cortical cultures in this study. But we disagree that the study’s contribution is very limited.
The revised manuscript will emphasize that there are only two possible mechanisms by which Rab3A is acting in homeostatic plasticity. Either this presynaptic vesicle protein is regulating postsynaptic receptors (an extremely surprising result for which we do have direct evidence), or, it is regulating quantal size from both sides of the synapse (supported by direct evidence from our previous study at the mouse neuromuscular junction in vivo, where receptors are not being upregulated during homeostatic plasticity, and, by indirect evidence in the current study, that receptors and mEPSCs are not being identically regulated in the same cultures). Furthermore, the first idea that follows from the effect of Rab3A on receptors is that it would be regulating release of factors from astrocytes, since this is a mechanism that has been shown to be involved in homeostatic plasticity, and we clearly disprove this hypothesis.
- Their major argument for this is that homeostatic effects on mEPSC amplitudes and GluA2 cluster sizes do not match. This is inconsistent with reports from multiple labs showing that upscaling of mEPSC amplitude and GluA2 accumulation occur side by side during scaling (Ibata et al., 2008; Pozo et al., 2012; Tan et al., 2015; Silva et al., 2019).
We agree with the reviewer that many studies show an increase in receptors and mEPSC amplitudes after activity blockade. This is why we were very surprised in our initial experiments to find that there was not a consistent robust increase in receptors in our cultures. At that point we were only imaging, and we assumed that it was homeostatic plasticity that was not always robust. We decided it was essential to measure mEPSC amplitudes and image receptors in the same cultures. We expected to observe larger and smaller effects on mEPSC amplitudes from culture to culture that were paralleled by larger and smaller effects on receptors, but this is not what happened. We have gone back to the literature to look more closely at whether variability across cultures has ever been shown for mEPSC amplitudes, receptors, or both. In a survey of 14 studies, none report results culture by culture. To our knowledge, we are the first to report this variability in the receptor response, and the lack of correlation between mEPSC amplitudes and receptor responses, in the same cultures. That said, for the 4 examples provided by the reviewer, only 1 reports evidence relevant to our study that receptors and mEPSC amplitudes ‘occur side by side,’ which is the (Ibata et al., 2008) study. Here, 24 hr of TTX treatment of rat cortical cultures causes synaptically localized GluA2 receptors in confocal imaging, and mEPSC amplitudes, to both increase to around 130%. The (Pozo et al., 2012) study is not a study of activity blockade but of the effects of overexpressing beta-integrins in rat hippocampal cultures, and this causes both GluA2 receptors and mEPSC amplitudes to increase, but the GluA2 level is not restricted to synaptic sites, and, is expressed as the surface fraction (surface receptor/total receptor—total receptor being surface intensity plus internalized intensity) which increases from 0.5 to 0.55, or to 110%, while mEPSC amplitude increases to ~180%. The (Tan et al., 2015) study only provides Western blot data to show an increase of receptors to 125% in mouse cortical cultures in response to 48 hr TTX, with mEPSC amplitudes increased to ~140%, but the Western blot technique measures synaptic and nonsynaptic receptors on excitatory and inhibitory neurons, as well as receptors on astrocytes. Finally, in (Silva et al., 2019), the culture conditions for the imaging data and the mEPSC amplitude data are markedly different, with ‘low-density’ Banker cultures being used for the former, and ‘high-density’ cultures used for the latter, and the protocol to induce activity blockade is different from ours (noncompetitive AMPA and NMDA blockers); synaptic GluA2 receptors are increased to ~280% and mEPSC amplitudes to ~170%. In the revision we will carefully summarize the previous evidence for receptors and mEPSC amplitude responses to activity blockade. Since it is known that different protocols trigger different molecular mechanisms, for example, TTX + APV triggers a homeostatic plasticity that can be completely reversed by acute application of blockers of Ca-permeable receptors, whereas TTX alone triggers a plasticity that is insensitive to these blockers (Sutton et al., 2006), Figure 4E; (Soden and Chen, 2010); Figure 4A), we will keep our discussion restricted to studies using TTX alone for at least 24 hr. We will acknowledge that our finding that GluA2 receptors and mEPSC amplitudes are not varying in lockstep from culture to culture suggests there is another contributor to mEPSC amplitude, but that we cannot rule out it is due to a greater variability in signal, or more issues with signal over noise, in imaging experiments compared to electrophysiology experiments.
Studies surveyed about reporting results by culture:
(Ju et al., 2004; Stellwagen et al., 2005; Shepherd et al., 2006; Sutton et al., 2006; Cingolani and Goda, 2008; Hou et al., 2008; Ibata et al., 2008; Chang et al., 2010; Hu et al., 2010; Jakawich et al., 2010; Beique et al., 2011; Tatavarty et al., 2013; Diering et al., 2014; Sanderson et al., 2018)
Further, because the acquisition and quantification methods for mEPSC recordings and immunohistochemistry imaging are entirely different (each with its own limitations in signal detection), it is not convincing that the lack of proportional changes must signify a presynaptic component.
We agree with the reviewer that there is no way to compare absolute levels from one type of experimental technique to another, but whatever differences in technical issues there are for the two techniques, they should cause systemic errors and should not contribute to the differences between experiments. Most of the issues with imaging come down to variability in the intensity of fluorescence from experiment to experiment, since the antibody solutions are made anew each time, as is the fixation solution. In addition, the confocal microscope function can vary over time and give brighter or dimmer images. But those kinds of artifacts are addressed by using the same solutions on control and TTX-treated coverslips, and imaging control and TTX-treated coverslips in the same single 2-3 hour imaging session, so that whatever issues there are, they cannot contribute to the TTX effect itself. Therefore when we compare the TTX effect (TTX measurements compared to untreated measurements) from culture to culture and find that in one WT culture there was no increase in receptors but there was in mEPSC amplitude, it is difficult to explain how a limitation specific to the antibody imaging technique could produce such a result. Similarly, when we get the opposite result, that in one KO culture, receptors increased but mEPSC amplitudes did not, it is unclear how limitations in signal detection would produce such a result in one culture but not another. The one exception to this is that the primary GluA2 antibody has to be added individually to each coverslip before returning the dishes to the incubator in order to avoid the disruption to live cells that a complete removal of media would have had. The only remaining ‘artifact’ that could explain the results would be a greater variability in the imaging experiments due to limitations in the signal or the signal to noise ratio. In the revision we will report additional characteristics of imaging experiments, such as average intensity for each coverslip, and for each experiment, to address whether variability in fluorescence levels could explain the variability in TTX effects we observe. We will include the possibility that the mismatches in GluA2 receptors and mEPSCs could be caused by greater variability in the imaging experiments.
- The authors also speculate in the discussion that presynaptic Rab3A could be interacting with retrograde BDNF signaling to regulate postsynaptic AMPARs. Without data showing Rab3A-dependent presynaptic changes after TTX treatment, this argument is not compelling. In this retrograde pathway, BDNF is synthesized in and released from dendrites (Jakawich et al., 2010; Thapliyal et al., 2022), and it is entirely possible for postsynaptic Rab3A to interfere with this process cell-autonomously.
In the revision, the model will focus on the direct findings of the manuscript and tone down the speculation about BDNF signaling, but in the Discussion we will add the possibility that a Rab3A-BDNF interaction could occur either presynaptically or postsynaptically. Interestingly, these articles suggest the postsynaptic BDNF is affecting presynaptic function, namely mEPSC frequency. It is conceivable it could presynaptically affect the vesicle’s release of transmitter.
- The authors propose that a change in AMPAR subunit composition from GluA2-containing ones to GluA1 homomers may account for the distinct changes in mEPSC amplitudes and GluA2 clusters. However, their data from the Naspm wash-in experiments clearly show that GluA1 homomer contributions have not changed before and after TTX treatment.
Our apologies to the reviewer that we were not clear on this point. In lines 396 to 400 we were describing the significant effects that NASPM had on mEPSC frequency on both untreated and TTX-treated cells, despite having only modest, and not quite significant effects on mEPSC amplitude. We conclude from these results that there are synaptic sites that have only GluA1 homomers, and the mEPSCs from these sites are blocked 100% by NASPM. There may be an increase in such GluA1-only synapses after activity blockade, but nevertheless, these events do not contribute to the amplitude increase. So we did not mean to suggest that there is a shift from Glua2 containing to GluA1 containing receptors that leads to the amplitude increase and fully agree with the reviewer that the GluA1 homomer contributions to amplitude have not changed before and after TTX. We will clarify the difference between the contribution of GluA1 homomers to amplitude and frequency in the revised manuscript.
Reviewer #3
Summary: The authors clearly demonstrate the Rab3A plays a role in HSP at excitatory synapses, with substantially less plasticity occurring in the Rab3A KO neurons. There is also no apparent HSP in the Earlybird Rab3A mutation, although baseline synaptic strength seems already elevated. In this context, it is unclear if the plasticity is absent or just occluded by a ceiling effect due the synapses already being strengthened. The authors do appropriately discuss both options. There are also differences in genetic background between the Rab3A KO and Earlybird mutants that could also impact the results, which are also noted. The authors have solid data showing that Rab3A is unlikely to be active in astrocytes, Finally, they attempt to study the linkage between synaptic strength during HSP and AMPA receptor trafficking, and conclude that trafficking is largely not responsible for the changes in synaptic strength.
Strengths: This work adds another player into the mechanisms underlying an important form of synaptic plasticity. The plasticity is only reduced, suggesting Rab3A is only partially required and perhaps multiple mechanisms contribute. The authors speculate about some possible novel mechanisms.
Weaknesses: However, the rather strong conclusions on the dissociation of AMPAR trafficking and synaptic response are made from somewhat weaker data. The key issue is the GluA2 immunostaining in comparison with the mESPC recordings. Their imaging method involves only assessing puncta clearly associated with a MAP2 labeled dendrite. This is a small subset of synapses, judging from the sample micrographs (Fig 5). To my knowledge, this is a new and unvalidated approach that could represent a particular subset of synapses not representative of the synapses contributing to the mEPSC change. (they are also sampling different neurons for the two measurements; an additional unknown detail is how far from the cell body were the analyzed dendrites for immunostaining. While the authors acknowledge that a sampling issue could explain the data, they still use this data to draw strong conclusions about the lack of AMPAR trafficking contribution to the mEPSC amplitude change. This apparent difference may be a methodological issue rather than a biological one, and at this point it is impossible to differentiate these. It will unfortunately be difficult to validate their approach. Perhaps if they were to drive NMDA-dependent LTD or chemLTP, and show alignment of the imaging and ephys, that would help. More helpful would be recordings and imaging from the same neurons but this is challenging. Sampling from identified synapses would of course be ideal, perhaps from 2P uncaging combined with SEP-labeled AMPARs, but this is more challenging still. But without data to validate the method, it seems unwarranted to make such strong conclusions such as that AMPAR trafficking does not underlie the increase in mEPSC amplitude, given the previous data supporting such a model.
We chose the primary dendrite to ensure we were not assaying dendrites from inhibitory neurons or on axons, but we will add in the revision that it is a limitation of our methods that we are not sampling all the synapses for each neuron. The majority of previous studies that establish that receptors are increased side by side with mEPSCs did not measure receptors and mEPSCs in the same cells, nor even in the same cultures. There is a recent study which employs dual recordings, transfection of GluA2 and VGlut1 constructs, and infusion of dyes to highlight cell morphology (Letellier et al., 2019), so in principle an experiment could be done in which synaptic GluA2 sites are imaged in a cell in which the mEPSCs are also measured. It would be difficult to make these measurements in the same cells before and after TTX treatment, since there is a high likelihood of damaging the cell upon electrode withdrawal and with the imaging process itself. In theory, only a few such experiments would be necessary to establish whether receptors and mEPSC amplitudes are varying in lockstep, and we will consider this for a future study. As stated in response to conceptual concern #1 in Reviewer 2’s comments, we will review the literature on previous studies’ demonstrations of increases in receptors and mEPSC amplitudes following activity blockade in more detail, including how the synaptic sites to be imaged were chosen, to address whether our selection of sites touching the primary dendrite is unvalidated.
A sample from 3 articles:
(Ibata et al., 2008), only information is that ‘distal dendrites’ were examined. The authors do not use a dendritic label. (Jakawich et al., 2010), ‘neurons with pyramidal-like morphology were selected for imaging,’ and ‘principal dendrite of each neuron was linearized’—but how these were identified is not clear, since MAP2 or other cellular labels are not described.
(Silva et al., 2019), ‘dendrites with similar thickness and appearance were randomly selected using MAP2 staining,’ which suggests synaptic sites with GluA2 and VGLUT1 were selected on the basis of being close to or touching the MAP2 positive dendrite, although this is not stated explicitly.
We can perform length measurements on the dendrites imaged and report this information in the revision, but the primary dendrite is the closest dendrite to the cell body.
We have addressed the potential contribution of technical artifacts arising from the two distinct methods of measurement, imaging and electrophysiology, in our response to conceptual concern #1 of Reviewer 2.
Other questions arise from the NASPM experiments, used to justify looking at GluA2 (and not GluA1) in the immunostaining. First, there is a frequency effect that is quite unclear in origin. One would expect NASPM to merely block some fraction of the post-synaptic current, and not affect pre-synaptic release or block whole synapses. It is also unclear why the authors argue this proves that the NASPM was at an effective concentration (lines 399-400).
We observed a clear effect of NASPM reducing mEPSC frequency. We will state more clearly that we infer from the loss of mEPSCs after NASPM that such mEPSCs were from synaptic sites that had only GluA1 homomers, and acknowledge that this is an interpretation. We will also clarify that if our inference is correct, it would indicate that the dose of NASPM we used was 100% effective at blocking GluA1 homomers. The alternative explanation would be a presynaptic effect of NASPM, which has never been reported, to our knowledge.
Further, the amplitude data show a strong trend towards smaller amplitude. The p value for both control and TTX neurons was 0.08 - it is very difficult to argue that there is no effect. And the decrease is larger in the TTX neurons. Considering the strong claims for a pre-synaptic and the use of this data to justify only looking at GluA2 by immunostaining, these data do not offer much support of the conclusions. Between the sampling issues and perhaps looking at the wrong GluA subunit, it seems premature to argue that trafficking is not a contributor to the mEPSC amplitude change, especially given the substantial support for that hypothesis. Further, even if trafficking is not the major contributor, there could be shifts in conductance (perhaps due to regulation of auxiliary subunits) that does not necessitate a pre-synaptic locus. While the authors are free to hypothesize such a mechanism, it would be prudent to acknowledge other options and explanations.
We did not mean to suggest that there is no effect of NASPM on mEPSC amplitude. We will clarify that our data indicate that there is no effect of NASPM on the TTX effect on mEPSC amplitude. We agree with the reviewer that the effect of NASPM on frequency is of larger magnitude after TTX treatment, although the p value is larger than that for untreated cells, likely due to greater variability. We interpret this to mean that TTX treatment increases the proportion of synapses that have only GluA1 homomers. Nevertheless, the increase in GluA1 homomer sites does not appear to contribute to the overall increase in amplitude following TTX treatment, and we wanted to find the mechanism of the amplitude increase. That is why we focused on GluA2 receptors. We will acknowledge the limitation of basing our conclusions on only GluA2 receptors in the revision, as well as the possibility that there is a change in conductance. As stated in our response to Reviewer 2, we do not mean to state that GluA2 receptors do not go up after activity blockade, we find that this is the case. We are proposing an additional mechanism contributing to mEPSC amplitude to explain the different responses for GluA2 receptors vs. mEPSC amplitudes in some of the 6 matched experiments (3 WT and 3 KO).
The frequency data are missing from the paper, with the exception of the NASPM dataset. The mEPSC frequencies should be reported for all experiments, particularly given that Rab3A is generally viewed as a pre-synaptic protein regulating release. Also, in the NASPM experiments, the average frequency is much higher in the TTX treated cultures. Is this statistically above control values?
We will report frequency measurements for all experiments shown. Following TTX treatment, frequency variability increases enormously, with cells having as high as > 10 mEPSCs per second, and other TTX-treated cells with frequencies as low as < 1 mEPSC per second, so the TTX effect on frequency, and whether this effect is present or not in Rab3A KO and Rab3AEbd/Ebd is not completely clear, which is why we did not include those results previously.
Unaddressed issues that would greatly increase the impact of the paper:
- Is Rab3A acting pre-synaptically, post-synaptically or both? The authors provide good evidence that Rab3A is acting within neurons and not astrocytes. But where it is acting (pre or post) would aid substantially in understanding its role (and particularly the hypothesized and somewhat novel idea that the amount of glutamate released per vesicle is altered in HSP). They could use sparse knock-down of Rab3A, or simply mix cultures from KO and WT mice (with appropriate tags/labels). The general view in the field has been that HSP is regulated post-synaptically via regulation of AMPAR trafficking, and considerable evidence supports this view. The more support for their suggestion of a pre-synaptic site of control, the better.
We agree with the reviewer that this is the most important question to answer next. The approach suggested by the reviewer would be to record from Rab3A KO neurons in a culture where the majority of its inputs are Rab3A positive. If the TTX effect is absent from these cells, it would strongly indicate that postsynaptic Rab3A is required for homeostatic plasticity. There are not currently transgenic mice expressing GFP forms of Rab3A, so we would have to create one, or, transiently transfect Rab3A-GFP into Rab3AKO neurons. Given that under our experimental conditions, we require a very high density of neurons to observe the increase in mEPSC amplitude, it would be difficult to get the ratio of Rab3A-expressing neurons high enough using transfection to be sure that a given postsynaptic cell lacking Rab3A had a normal number of Rab3A-positive inputs and almost no Rab3A-negative inputs. It may be that the opposite experiment is more doable—an isolated Rab3A-positive neuron in a sea of Rab3A-negative neurons, which could be accomplished with a very low transfection efficiency. Another approach would be to use the fast off rate antagonist gamma-DGG, which is more effective against low glutamate concentrations than high glutamate concentrations (see (Liu et al., 1999; Wu et al., 2007). If gamma-DGG were less effective at reducing mEPSC amplitude in TTX-treated cells, compared to untreated cells, it would support the hypothesis that activity blockade leads to an increase in the amount of transmitter per vesicle fusion event. Further, if the change in gamma-DGG sensitivity after activity blockade were disrupted in cultures from Rab3A KO cells, it would support a presynaptic role for Rab3A in homeostatic plasticity of mEPSC amplitude. We have begun these experiments but are finding the surprising result that within a single recording, small mEPSCs and large mEPSCs appear to be differentially sensitive to gamma-DGG. To confirm that this is a biological characteristic, rather than an issue with the detection threshold, we will be repeating our experiments with a slow off rate antagonist that has same effect regardless of transmitter concentration. The complexity of these results precludes including them in the current manuscript.
- Rab3A is also found at inhibitory synapses. It would be very informative to know if HSP at inhibitory synapses is similarly affected. This is particularly relevant as at inhibitory synapses, one expects a removal of GABARs and/or a decrease of GABA-packaging in vesicles (ie the opposite of whatever is happening at excitatory synapses). If both processes are regulated by Rab3A, this might suggest a role for this protein more upstream in the signaling; an effect only at excitatory synapses would argue for a more specific role just at these synapses.
The next question, after it is determined where Rab3A is acting, is whether it is required for other forms of homeostatic plasticity. This includes plasticity of GABA mIPSCs on pyramidal neurons, but also mEPSCs on inhibitory neurons, and, the downscaling of mEPSCs (and upscaling of mIPSCs) when activity is increased, by bicuculline for example. We will add a statement about future experiments examining other forms of plasticity to the discussion, and include examples where a molecular mechanism has mediated multiple forms, and those that have been shown to be very specific.
Beique JC, Na Y, Kuhl D, Worley PF, Huganir RL (2011) Arc-dependent synapse-specific homeostatic plasticity. Proc Natl Acad Sci U S A 108:816-821.
Chang MC, Park JM, Pelkey KA, Grabenstatter HL, Xu D, Linden DJ, Sutula TP, McBain CJ, Worley PF (2010) Narp regulates homeostatic scaling of excitatory synapses on parvalbumin-expressing interneurons. Nat Neurosci 13:1090-1097.
Cingolani LA, Goda Y (2008) Differential involvement of beta3 integrin in pre- and postsynaptic forms of adaptation to chronic activity deprivation. Neuron Glia Biol 4:179-187.
Diering GH, Gustina AS, Huganir RL (2014) PKA-GluA1 coupling via AKAP5 controls AMPA receptor phosphorylation and cell-surface targeting during bidirectional homeostatic plasticity. Neuron 84:790-805.
Hanes AL, Koesters AG, Fong MF, Altimimi HF, Stellwagen D, Wenner P, Engisch KL (2020) Divergent Synaptic Scaling of Miniature EPSCs following Activity Blockade in Dissociated Neuronal Cultures. J Neurosci 40:4090-4102.
Hou Q, Zhang D, Jarzylo L, Huganir RL, Man HY (2008) Homeostatic regulation of AMPA receptor expression at single hippocampal synapses. Proc Natl Acad Sci U S A 105:775-780.
Hu JH, Park JM, Park S, Xiao B, Dehoff MH, Kim S, Hayashi T, Schwarz MK, Huganir RL, Seeburg PH, Linden DJ, Worley PF (2010) Homeostatic scaling requires group I mGluR activation mediated by Homer1a. Neuron 68:1128-1142.
Ibata K, Sun Q, Turrigiano GG (2008) Rapid synaptic scaling induced by changes in postsynaptic firing. Neuron 57:819826.
Jakawich SK, Nasser HB, Strong MJ, McCartney AJ, Perez AS, Rakesh N, Carruthers CJ, Sutton MA (2010) Local presynaptic activity gates homeostatic changes in presynaptic function driven by dendritic BDNF synthesis. Neuron 68:1143-1158.
Ju W, Morishita W, Tsui J, Gaietta G, Deerinck TJ, Adams SR, Garner CC, Tsien RY, Ellisman MH, Malenka RC (2004) Activity-dependent regulation of dendritic synthesis and trafficking of AMPA receptors. Nat Neurosci 7:244-253.
Lazic SE, Clarke-Williams CJ, Munafo MR (2018) What exactly is 'N' in cell culture and animal experiments? PLoS Biol 16:e2005282.
Liu G, Choi S, Tsien RW (1999) Variability of neurotransmitter concentration and nonsaturation of postsynaptic AMPA receptors at synapses in hippocampal cultures and slices. Neuron 22:395-409.
Pozo K, Cingolani LA, Bassani S, Laurent F, Passafaro M, Goda Y (2012) beta3 integrin interacts directly with GluA2 AMPA receptor subunit and regulates AMPA receptor expression in hippocampal neurons. Proc Natl Acad Sci U S A 109:1323-1328.
Sanderson JL, Scott JD, Dell'Acqua ML (2018) Control of Homeostatic Synaptic Plasticity by AKAP-Anchored Kinase and Phosphatase Regulation of Ca(2+)-Permeable AMPA Receptors. J Neurosci 38:2863-2876.
Shepherd JD, Rumbaugh G, Wu J, Chowdhury S, Plath N, Kuhl D, Huganir RL, Worley PF (2006) Arc/Arg3.1 mediates homeostatic synaptic scaling of AMPA receptors. Neuron 52:475-484.
Silva MM, Rodrigues B, Fernandes J, Santos SD, Carreto L, Santos MAS, Pinheiro P, Carvalho AL (2019) MicroRNA186-5p controls GluA2 surface expression and synaptic scaling in hippocampal neurons. Proc Natl Acad Sci U S A 116:5727-5736.
Soden ME, Chen L (2010) Fragile X protein FMRP is required for homeostatic plasticity and regulation of synaptic strength by retinoic acid. J Neurosci 30:16910-16921. Stellwagen D, Beattie EC, Seo JY, Malenka RC (2005) Differential regulation of AMPA receptor and GABA receptor trafficking by tumor necrosis factor-alpha. J Neurosci 25:3219-3228.
Sutton MA, Ito HT, Cressy P, Kempf C, Woo JC, Schuman EM (2006) Miniature neurotransmission stabilizes synaptic function via tonic suppression of local dendritic protein synthesis. Cell 125:785-799.
Tan HL, Queenan BN, Huganir RL (2015) GRIP1 is required for homeostatic regulation of AMPAR trafficking. Proc Natl Acad Sci U S A 112:10026-10031.
Tatavarty V, Sun Q, Turrigiano GG (2013) How to scale down postsynaptic strength. J Neurosci 33:13179-13189.
Turrigiano GG, Leslie KR, Desai NS, Rutherford LC, Nelson SB (1998) Activity-dependent scaling of quantal amplitude in neocortical neurons. Nature 391:892-896.
Wang X, Wang Q, Yang S, Bucan M, Rich MM, Engisch KL (2011) Impaired activity-dependent plasticity of quantal amplitude at the neuromuscular junction of Rab3A deletion and Rab3A earlybird mutant mice. J Neurosci 31:3580-3588.
Watt AJ, van Rossum MC, MacLeod KM, Nelson SB, Turrigiano GG (2000) Activity coregulates quantal AMPA and NMDA currents at neocortical synapses. Neuron 26:659-670.
Wu XS, Xue L, Mohan R, Paradiso K, Gillis KD, Wu LG (2007) The origin of quantal size variation: vesicular glutamate concentration plays a significant role. J Neurosci 27:3046-3056.
Wu YK, Hengen KB, Turrigiano GG, Gjorgjieva J (2020) Homeostatic mechanisms regulate distinct aspects of cortical circuit dynamics. Proc Natl Acad Sci U S A 117:24514-24525.
-
eLife assessment
This study presents valuable findings on the role of the small GTPase Rab3A in homeostatic plasticity. While the study demonstrates that Rab3A is required for homeostatic scaling, the evidence supporting the model put forward by the authors is incomplete. The work will be of interest to researchers in the field of synaptic transmission and plasticity.
-
Reviewer #1 (Public Review):
Koesters and colleagues investigated the role of the presynaptic small GTPase Rab3A in homeostatic scaling of miniature synaptic transmission in primary mouse cortical cultures using electrophysiology and immunohistochemistry. The major finding is that TTX incubation for 48 hours does not induce an increase in the amplitude of excitatory synaptic miniature events in neuronal cultures derived from Rab3A KO and Rab3A Earlybird mutant mice. NASPM application had comparable effects on mEPSC amplitude in control and after TTX, implying that Ca2+-permeable glutamate receptors are unlikely modulated during synaptic scaling. Immunohistochemical analysis revealed an increase in GluA2 puncta size and intensity in wild type, but not Rab3A KO cultures. Finally, they provide evidence that loss of Rab3A in neurons, but …
Reviewer #1 (Public Review):
Koesters and colleagues investigated the role of the presynaptic small GTPase Rab3A in homeostatic scaling of miniature synaptic transmission in primary mouse cortical cultures using electrophysiology and immunohistochemistry. The major finding is that TTX incubation for 48 hours does not induce an increase in the amplitude of excitatory synaptic miniature events in neuronal cultures derived from Rab3A KO and Rab3A Earlybird mutant mice. NASPM application had comparable effects on mEPSC amplitude in control and after TTX, implying that Ca2+-permeable glutamate receptors are unlikely modulated during synaptic scaling. Immunohistochemical analysis revealed an increase in GluA2 puncta size and intensity in wild type, but not Rab3A KO cultures. Finally, they provide evidence that loss of Rab3A in neurons, but not astrocytes, blocks homeostatic scaling. Based on these data, the authors propose a model in which presynaptic Rab3A is required for homeostatic scaling of synaptic transmission through GluA2-dependent and independent mechanisms.
While the title of the manuscript is mostly supported by data of solid quality, many conclusions, as well as the final model, cannot be derived from the results presented. Importantly, the results do not indicate that Rab3A modulates quantal size on both sides of the synapse. Moreover, several analysis approaches seem inappropriate.
The following points should be addressed:
1. The model shown in Figure 10 is not supported by the data. The authors neither provide evidence for two different functional states of Rab3A being involved in mEPSC amplitude modulation, nor for a change in glutamate content of vesicles. Furthermore, the data do not fully support the conclusion of a presynaptic role for Rab3A in homeostatic scaling.
2. The analysis of mEPSC data using quantile sampling followed by ratio calculation is not meaningful under the tested experimental conditions because of the following reasons: (i) The analysis implicitly assumes that all events have been detected. The prominent mEPSC frequency increase after TTX suggests that this is not the case, i.e., many (small) mEPSCs are likely missed under control conditions. (ii) The analysis is used to conclude how events of a certain size are altered by TTX treatment. However, this analysis compares the smallest mEPSCs of the TTX condition with the smallest control mEPSCs, but this is not a pre-post experimental design. Variation between cells and between coverslips will markedly affect the results and lead to misleading interpretations. (iii) The ratio (TTX/control) vs. control plots seem to suffer from a division by small value artifact (see Figure 6F). Correspondingly, ratio-analysis differs considerably for different control conditions (Fig. 1Giii, Fig. 2Giii, Fig. 6C, Fig. 9A).
3. As noted by the authors in a previous publication (Hanes et al. 2020), statistical analysis of CDFs suffers from n-inflation. In addition, the quantile sampling method chosen violates an important assumption of the K-S test. Indeed, p-values for these comparisons are typically several orders of magnitude smaller. Given that the statistical N most likely corresponds to the number of cultures (see, e.g., https://doi.org/10.1371/journal.pbio.2005282), CDF comparisons are not informative and should thus not be used to draw conclusions from the data. The plots can be informative, though.
4. How does recoding noise and the mEPSC amplitude threshold affect "divergent scaling"?
5. What is the justification for the line fits of the ratio data/how was the fit range chosen?
6. TTX application induces a significant increase in mEPSC amplitude in Rab3A-/- mice in two out of three data sets (Figs. 1 and 9). Hence, the major conclusion that Rab3A is required for homeostatic scaling is only partially supported by the data.
7. Line 289: A comparison of p-values between conditions does not allow any meaningful conclusions.
8. There is a significant increase in baseline mEPSC amplitude in Rab3AEbd/Ebd (15 pA) vs. Rab3Aebd/+ (11 pA) cultures, but not in Rab3A-/- (13.6 pA) vs. Rab3A+/- (13.9 pA). Although the nature of scaling was different between Rab3AEbd/Ebd vs. Rab3AEbd/+, and Rab3AEbd/Ebd with vs. without TTX, the question arises whether the increase in mEPSC amplitude in Rab3AEbd/Ebd is Rab3A dependent. Could a Rab3A independent mechanism occlude scaling?
9. Figure 4: NASPM appears to have a stronger effect on mEPSC frequency in the TTX condition vs. control (-40% vs. -15%). A larger sample size might be necessary to draw definitive conclusions on the contribution of Ca2+-permeable AMPARs.
10. The authors discuss previous papers showing changes in VGLUT1 intensity. Was VGLUT intensity altered in the stainings presented in the manuscript?
11. The change in GluA2 area or fluorescence intensity upon TTX treatment in controls is modest. How does the GluA2 integral change?
12. The quantitative comparison between physiology and microscopy data is problematic. The authors report a mismatch in ratio values between the smallest mEPSC amplitudes and smallest GluA2 receptor cluster sizes (l. 464; Figure 8). Is this comparison affected by the fluorescence intensity threshold? What was the rationale for a threshold of 400 a.u. or 450 a.u.? How does this threshold compare to the mEPSC threshold of 3 pA? The conclusion that an increase in AMPAR levels is not fully responsible for the observed mEPSC increase is mainly based on the rank-order analysis of GluA2 intensity, yielding a slope of ~0.9. There are several points to consider here: (i) GluA2 fluorescence intensity did increase on average, as did GluA2 cluster size. (ii) The increase in GluA2 cluster size is very similar to the increase in mEPSC amplitude (each approx. 18-20%). (iii) Are there any reports that fluorescence intensity values are linearly reporting mEPSC amplitudes (in this system)? Antibody labelling efficiency, and false negatives of mEPSC recordings may influence the results. The latter was already noted by the authors. (iv) It is not entirely clear if their imaging experiments will sample from all synapses. Other AMPAR subtypes than GluA2 could contribute, as could kainate or NMDA receptors.
Furthermore, the statement "complete lack of correspondence of TTX/CON ratios" is not supported by the data presented (l. 515ff). First, under the assumption that no scaling occurs in Rab3A-/- , the TTX/CON ratios show a 20-30% change, which indicates the variation of this readout. Second, the two examples shown in Figure 8 for Rab3A+/+ are actually quite similar (culture #1 and #2), particularly when ignoring the leftmost section of the data, which is heavily affected by the raw values approaching zero.
13. Figure 7A: TTX CDF was shifted to smaller mEPSC amplitude values in Rab3A-/- cultures. How can this be explained? -
Reviewer #2 (Public Review):
In this study, Koesters et al. investigated whether Rab3A, a small GTPase that regulates synaptic vesicle fusion pore opening, is required for excitatory synaptic scaling in response to TTX-induced activity suppression in dissociated mouse cortical neuronal culture. They first show that, while pyramidal neurons from wild-type (WT) littermates show normal synaptic scaling in response to 48h of TTX treatment (~30% increase in the mean mEPSC amplitude), those from two different mouse lines with either deletion (Rab3A-/-) or loss-of-function mutation of Rab3A (Rab3AEbd/Ebd) fail to engage this homeostatic compensation. They perform cumulative distribution analysis to show that the mEPSC population has gone through divergent scaling in WT neurons. Similarly, this phenomenon is absent in neurons from the two Rab3A …
Reviewer #2 (Public Review):
In this study, Koesters et al. investigated whether Rab3A, a small GTPase that regulates synaptic vesicle fusion pore opening, is required for excitatory synaptic scaling in response to TTX-induced activity suppression in dissociated mouse cortical neuronal culture. They first show that, while pyramidal neurons from wild-type (WT) littermates show normal synaptic scaling in response to 48h of TTX treatment (~30% increase in the mean mEPSC amplitude), those from two different mouse lines with either deletion (Rab3A-/-) or loss-of-function mutation of Rab3A (Rab3AEbd/Ebd) fail to engage this homeostatic compensation. They perform cumulative distribution analysis to show that the mEPSC population has gone through divergent scaling in WT neurons. Similarly, this phenomenon is absent in neurons from the two Rab3A mouse lines. They further demonstrate that GluA2-containing AMPARs likely account for the increase in mEPSC amplitudes by comparing measurements before and after washing in blockers specific for GluA2-lacking AMPARs. Subsequently, they perform electrophysiology and immunohistochemistry side by side for WT neurons from the same culture following TTX treatment, and find that both mEPSC amplitudes and GluA2 cluster sizes have shifted towards higher values, while GluA2 cluster intensity remains unchanged. Importantly, all these homeostatic compensations are absent in Rab3A-/- neurons. Finally, they mix neurons and astrocyte feeders either from WT or Rab3A-/- mice, which reveals that neuronal but not astrocytic Rab3A knockout leads to impaired scaling up of mEPSCs. They conclude that Rab3A is required for homeostatic scaling up of mEPSC amplitude in cortical neurons, most likely from the presynaptic side.
Although the authors have raised an interesting question, their conclusion is not well supported by the data presented. I list my technical and conceptual concerns below.
Technical concerns:
1. The culture condition is questionable. The authors saw no NMDAR current present during spontaneous recordings, which is worrisome since NMDARs should be active in cultures with normal network activity (Watt et al., 2000; Sutton et al., 2006). It is important to ensure there is enough spiking activity before doing any activity manipulation. Similarly, it is also unknown whether spiking activity is normal in Rab3A KO/Ebd neurons.
2. Selection of mEPSC events is not conducted in an unbiased manner. Manually selecting events is insufficient for cumulative distribution analysis, where small biases could skew the entire distribution. Since the authors claim their ratio plot is a better method to detect the uniformity of scaling than the well-established rank-order plot, it is important to use an unbiased population to substantiate this claim.
3. Immunohistochemistry data analysis is problematic. The authors only labeled dendrites without doing cell-fills to look at morphology, so it is questionable how they differentiate branches from pyramidal neurons and interneurons. Since glutamatergic synapses on these two types of neuron scale in the opposite directions, it is crucial to show that only pyramidal neurons are included for analysis.
Conceptual concerns:
The only novel finding here is the implicated role for Rab3A in synaptic scaling, but insights into mechanisms behind this observation are lacking. The author claims that Rab3A likely regulates scaling from the presynaptic side, yet there is no direct evidence from data presented. In its current form, this study's contribution to the field is very limited.
1. Their major argument for this is that homeostatic effects on mEPSC amplitudes and GluA2 cluster sizes do not match. This is inconsistent with reports from multiple labs showing that upscaling of mEPSC amplitude and GluA2 accumulation occur side by side during scaling (Ibata et al., 2008; Pozo et al., 2012; Tan et al., 2015; Silva et al., 2019). Further, because the acquisition and quantification methods for mEPSC recordings and immunohistochemistry imaging are entirely different (each with its own limitations in signal detection), it is not convincing that the lack of proportional changes must signify a presynaptic component.
2. The authors also speculate in the discussion that presynaptic Rab3A could be interacting with retrograde BDNF signaling to regulate postsynaptic AMPARs. Without data showing Rab3A-dependent presynaptic changes after TTX treatment, this argument is not compelling. In this retrograde pathway, BDNF is synthesized in and released from dendrites (Jakawich et al., 2010; Thapliyal et al., 2022), and it is entirely possible for postsynaptic Rab3A to interfere with this process cell-autonomously.
3. The authors propose that a change in AMPAR subunit composition from GluA2-containing ones to GluA1 homomers may account for the distinct changes in mEPSC amplitudes and GluA2 clusters. However, their data from the Naspm wash-in experiments clearly show that GluA1 homomer contributions have not changed before and after TTX treatment.
Ibata K, Sun Q, Turrigiano GG (2008) Rapid synaptic scaling induced by changes in postsynaptic firing. Neuron 57:819-826.
Jakawich SK, Nasser HB, Strong MJ, McCartney AJ, Perez AS, Rakesh N, Carruthers CJL, Sutton MA (2010) Local Presynaptic Activity Gates Homeostatic Changes in Presynaptic Function Driven by Dendritic BDNF Synthesis. Neuron 68:1143-1158.
Pozo K, Cingolani LA, Bassani S, Laurent F, Passafaro M, Goda Y (2012) β3 integrin interacts directly with GluA2 AMPA receptor subunit and regulates AMPA receptor expression in hippocampal neurons. Proceedings of the National Academy of Sciences 109:1323-1328.
Silva MM, Rodrigues B, Fernandes J, Santos SD, Carreto L, Santos MAS, Pinheiro P, Carvalho AL (2019) MicroRNA-186-5p controls GluA2 surface expression and synaptic scaling in hippocampal neurons. Proceedings of the National Academy of Sciences 116:5727-5736.
Sutton MA, Ito HT, Cressy P, Kempf C, Woo JC, Schuman EM (2006) Miniature Neurotransmission Stabilizes Synaptic Function via Tonic Suppression of Local Dendritic Protein Synthesis. Cell 125:785-799.
Tan HL, Queenan BN, Huganir RL (2015) GRIP1 is required for homeostatic regulation of AMPAR trafficking. Proceedings of the National Academy of Sciences 112:10026-10031.
Thapliyal S, Arendt KL, Lau AG, Chen L (2022) Retinoic acid-gated BDNF synthesis in neuronal dendrites drives presynaptic homeostatic plasticity. eLife 11:e79863.
Watt AJ, Rossum MCW van, MacLeod KM, Nelson SB, Turrigiano GG (2000) Activity Coregulates Quantal AMPA and NMDA Currents at Neocortical Synapses. Neuron 26:659-670.
-
Reviewer #3 (Public Review):
Summary: The authors clearly demonstrate the Rab3A plays a role in HSP at excitatory synapses, with substantially less plasticity occurring in the Rab3A KO neurons. There is also no apparent HSP in the Earlybird Rab3A mutation, although baseline synaptic strength seems already elevated. In this context, it is unclear if the plasticity is absent or just occluded by a ceiling effect due the synapses already being strengthened. The authors do appropriately discuss both options. There are also differences in genetic background between the Rab3A KO and Earlybird mutants that could also impact the results, which are also noted. The authors have solid data showing that Rab3A is unlikely to be active in astrocytes, Finally, they attempt to study the linkage between synaptic strength during HSP and AMPA receptor …
Reviewer #3 (Public Review):
Summary: The authors clearly demonstrate the Rab3A plays a role in HSP at excitatory synapses, with substantially less plasticity occurring in the Rab3A KO neurons. There is also no apparent HSP in the Earlybird Rab3A mutation, although baseline synaptic strength seems already elevated. In this context, it is unclear if the plasticity is absent or just occluded by a ceiling effect due the synapses already being strengthened. The authors do appropriately discuss both options. There are also differences in genetic background between the Rab3A KO and Earlybird mutants that could also impact the results, which are also noted. The authors have solid data showing that Rab3A is unlikely to be active in astrocytes, Finally, they attempt to study the linkage between synaptic strength during HSP and AMPA receptor trafficking, and conclude that trafficking is largely not responsible for the changes in synaptic strength.
Strengths: This work adds another player into the mechanisms underlying an important form of synaptic plasticity. The plasticity is only reduced, suggesting Rab3A is only partially required and perhaps multiple mechanisms contribute. The authors speculate about some possible novel mechanisms.
Weaknesses: However, the rather strong conclusions on the dissociation of AMPAR trafficking and synaptic response are made from somewhat weaker data. The key issue is the GluA2 immunostaining in comparison with the mESPC recordings. Their imaging method involves only assessing puncta clearly associated with a MAP2 labeled dendrite. This is a small subset of synapses, judging from the sample micrographs (Fig 5). To my knowledge, this is a new and unvalidated approach that could represent a particular subset of synapses not representative of the synapses contributing to the mEPSC change (they are also sampling different neurons for the two measurements; an additional unknown detail is how far from the cell body were the analyzed dendrites for immunostaining). While the authors acknowledge that a sampling issue could explain the data, they still use this data to draw strong conclusions about the lack of AMPAR trafficking contribution to the mEPSC amplitude change. This apparent difference may be a methodological issue rather than a biological one, and at this point it is impossible to differentiate these. It will unfortunately be difficult to validate their approach. Perhaps if they were to drive NMDA-dependent LTD or chemLTP, and show alignment of the imaging and ephys, that would help. More helpful would be recordings and imaging from the same neurons but this is challenging. Sampling from identified synapses would of course be ideal, perhaps from 2P uncaging combined with SEP-labeled AMPARs, but this is more challenging still. But without data to validate the method, it seems unwarranted to make such strong conclusions such as that AMPAR trafficking does not underlie the increase in mEPSC amplitude, given the previous data supporting such a model.
Other questions arise from the NASPM experiments, used to justify looking at GluA2 (and not GluA1) in the immunostaining. First, there is a frequency effect that is quite unclear in origin. One would expect NASPM to merely block some fraction of the post-synaptic current, and not affect pre-synaptic release or block whole synapses. It is also unclear why the authors argue this proves that the NASPM was at an effective concentration (lines 399-400). Further, the amplitude data show a strong trend towards smaller amplitude. The p value for both control and TTX neurons was 0.08 - it is very difficult to argue that there is no effect. And the decrease is larger in the TTX neurons. Considering the strong claims for a pre-synaptic locus and the use of this data to justify only looking at GluA2 by immunostaining, these data do not offer much support of the conclusions. Between the sampling issues and perhaps looking at the wrong GluA subunit, it seems premature to argue that trafficking is not a contributor to the mEPSC amplitude change, especially given the substantial support for that hypothesis. Further, even if trafficking is not the major contributor, there could be shifts in conductance (perhaps due to regulation of auxiliary subunits) that does not necessitate a pre-synaptic locus. While the authors are free to hypothesize such a mechanism, it would be prudent to acknowledge other options and explanations.
The frequency data are missing from the paper, with the exception of the NASPM dataset. The mEPSC frequencies should be reported for all experiments, particularly given that Rab3A is generally viewed as a pre-synaptic protein regulating release. Also, in the NASPM experiments, the average frequency is much higher in the TTX treated cultures. Is this statistically above control values?
Unaddressed issues that would greatly increase the impact of the paper:
Is Rab3A acting pre-synaptically, post-synaptically or both? The authors provide good evidence that Rab3A is acting within neurons and not astrocytes. But where it is acting (pre or post) would aid substantially in understanding its role (and particularly the hypothesized and somewhat novel idea that the amount of glutamate released per vesicle is altered in HSP). They could use sparse knock-down of Rab3A, or simply mix cultures from KO and WT mice (with appropriate tags/labels). The general view in the field has been that HSP is regulated post-synaptically via regulation of AMPAR trafficking, and considerable evidence supports this view. The more support for their suggestion of a pre-synaptic site of control, the better.
Rab3A is also found at inhibitory synapses. It would be very informative to know if HSP at inhibitory synapses is similarly affected. This is particularly relevant as at inhibitory synapses, one expects a removal of GABARs and/or a decrease of GABA-packaging in vesicles (ie the opposite of whatever is happening at excitatory synapses). If both processes are regulated by Rab3A, this might suggest a role for this protein more upstream in the signaling; an effect only at excitatory synapses would argue for a more specific role just at these synapses.
-
