Cholinergic input to mouse visual cortex signals a movement state and acutely enhances layer 5 responsiveness
Curation statements for this article:-
Curated by eLife

eLife assessment
This fundamental study by Yogesh and Keller provides a set of results describing the response properties of cholinergic input and its functional impacts in the mouse visual cortex. They found that cholinergic inputs are elevated by locomotion in a binary manner regardless of locomotor speeds, and activation of cholinergic input differently modulated the activity of Later 2/3 and Layer 5 visual cortex neurons induced by bottom-up (visual stimuli) and top-down (visuomotor mismatch) inputs. The experiments are cutting-edge and well-executed, and the results are convincing.
This article has been Reviewed by the following groups
Discuss this preprint
Start a discussion What are Sciety discussions?Listed in
- Evaluated articles (eLife)
Abstract
Acetylcholine is released in visual cortex by axonal projections from the basal forebrain. The signals conveyed by these projections and their computational significance are still unclear. Using two-photon calcium imaging in behaving mice, we show that basal forebrain cholinergic axons in the mouse visual cortex provide a binary locomotion state signal. In these axons, we found no evidence of responses to visual stimuli or visuomotor prediction errors. While optogenetic activation of cholinergic axons in visual cortex in isolation did not drive local neuronal activity, when paired with visuomotor stimuli, it resulted in layer-specific increases of neuronal activity. Responses in layer 5 neurons to both top-down and bottom-up inputs were increased in amplitude and decreased in latency, whereas those in layer 2/3 neurons remained unchanged. Using opto- and chemogenetic manipulations of cholinergic activity, we found acetylcholine to underlie the locomotion-associated decorrelation of activity between neurons in both layer 2/3 and layer 5. Our results suggest that acetylcholine augments the responsiveness of layer 5 neurons to inputs from outside of the local network, possibly enabling faster switching between internal representations during locomotion.
Article activity feed
-

-
-
-

eLife assessment
This fundamental study by Yogesh and Keller provides a set of results describing the response properties of cholinergic input and its functional impacts in the mouse visual cortex. They found that cholinergic inputs are elevated by locomotion in a binary manner regardless of locomotor speeds, and activation of cholinergic input differently modulated the activity of Later 2/3 and Layer 5 visual cortex neurons induced by bottom-up (visual stimuli) and top-down (visuomotor mismatch) inputs. The experiments are cutting-edge and well-executed, and the results are convincing.
-
Reviewer #1 (Public Review):
The paper submitted by Yogesh and Keller explores the role of cholinergic input from the basal forebrain (BF) in the mouse primary visual cortex (V1). The study aims to understand the signals conveyed by BF cholinergic axons in the visual cortex, their impact on neurons in different cortical layers, and their computational significance in cortical visual processing. The authors employed two-photon calcium imaging to directly monitor cholinergic input from BF axons expressing GCaMP6 in mice running through a virtual corridor, revealing a strong correlation between BF axonal activity and locomotion. This persistent activation during locomotion suggests that BF input provides a binary locomotion state signal. To elucidate the impact of cholinergic input on cortical activity, the authors conducted optogenetic …
Reviewer #1 (Public Review):
The paper submitted by Yogesh and Keller explores the role of cholinergic input from the basal forebrain (BF) in the mouse primary visual cortex (V1). The study aims to understand the signals conveyed by BF cholinergic axons in the visual cortex, their impact on neurons in different cortical layers, and their computational significance in cortical visual processing. The authors employed two-photon calcium imaging to directly monitor cholinergic input from BF axons expressing GCaMP6 in mice running through a virtual corridor, revealing a strong correlation between BF axonal activity and locomotion. This persistent activation during locomotion suggests that BF input provides a binary locomotion state signal. To elucidate the impact of cholinergic input on cortical activity, the authors conducted optogenetic and chemogenetic manipulations, with a specific focus on L2/3 and L5 neurons. They found that cholinergic input modulates the responses of L5 neurons to visual stimuli and visuomotor mismatch, while not significantly affecting L2/3 neurons. Moreover, the study demonstrates that BF cholinergic input leads to decorrelation in the activity patterns of L2/3 and L5 neurons.
This topic has garnered significant attention in the field, drawing the interest of many researchers actively investigating the role of BF cholinergic input in cortical activity and sensory processing. The experiments and analyses were thoughtfully designed and conducted with rigorous standards, providing evidence of layer-specific differences in the impact of cholinergic input on neuronal responses to bottom-up (visual stimuli) and top-down inputs (visuomotor mismatch).
-
Reviewer #2 (Public Review):
The manuscript investigates the function of basal forebrain cholinergic axons in mouse primary visual cortex (V1) during locomotion using two-photon calcium imaging in head-fixed mice. Cholinergic modulation has previously been proposed to mediate the effects of locomotion on V1 responses. The manuscript concludes that the activity of basal forebrain cholinergic axons in visual cortex provides a signal which is more correlated with binary locomotion state than locomotion velocity of the animal and finds no evidence for modulation of cholinergic axons by locomotion velocity. Cholinergic axons did not seem to respond to grating stimuli or visuomotor prediction error. Optogenetic stimulation of these axons increased the amplitude of responses to visual stimuli and decreased the response latency of layer 5 …
Reviewer #2 (Public Review):
The manuscript investigates the function of basal forebrain cholinergic axons in mouse primary visual cortex (V1) during locomotion using two-photon calcium imaging in head-fixed mice. Cholinergic modulation has previously been proposed to mediate the effects of locomotion on V1 responses. The manuscript concludes that the activity of basal forebrain cholinergic axons in visual cortex provides a signal which is more correlated with binary locomotion state than locomotion velocity of the animal and finds no evidence for modulation of cholinergic axons by locomotion velocity. Cholinergic axons did not seem to respond to grating stimuli or visuomotor prediction error. Optogenetic stimulation of these axons increased the amplitude of responses to visual stimuli and decreased the response latency of layer 5 excitatory neurons, but not layer 2/3 neurons. Moreover, optogenetic or chemogenetic stimulation of cholinergic inputs reduced pairwise correlation of neuronal responses. These results provide insight into the role of cholinergic modulation to visual cortex and demonstrate that it affects different layers of visual cortex in a distinct manner. The experiments are well executed and the data appear to be of high quality.
-
Author response:
The following is the authors’ response to the previous reviews.
Reviewer #1 (Recommendations For The Authors):
The author has addressed all the concerns I have raised.
I have only one minor suggestion.
We would argue both a gray screen and a grating are visual stimuli. ... We concur, our data only address one of many possible transitions, but it is a switch between distinct visual stimuli that is sped up by ACh.
Thank you for clarifying this.
Following my comment in the previous review, the author has revised the abstract as follows: (Before) "Our results suggest that acetylcholine augments the responsiveness of layer 5 neurons to inputs from outside of the local network, enabling faster switching between internal representations during locomotion."
(After) "Based on this we speculate that acetylcholine augments the …
Author response:
The following is the authors’ response to the previous reviews.
Reviewer #1 (Recommendations For The Authors):
The author has addressed all the concerns I have raised.
I have only one minor suggestion.
We would argue both a gray screen and a grating are visual stimuli. ... We concur, our data only address one of many possible transitions, but it is a switch between distinct visual stimuli that is sped up by ACh.
Thank you for clarifying this.
Following my comment in the previous review, the author has revised the abstract as follows: (Before) "Our results suggest that acetylcholine augments the responsiveness of layer 5 neurons to inputs from outside of the local network, enabling faster switching between internal representations during locomotion."
(After) "Based on this we speculate that acetylcholine augments the responsiveness of layer 5 neurons to inputs from outside of the local network, possibly enabling faster switching between internal representations during locomotion."
My previous comment concerned specifically the latter part, "enabling faster switching between internal representations during locomotion", and, in fact, their data fully support the first part, "acetylcholine augments the responsiveness of layer 5 neurons to inputs from outside of the local network". Thus, I suggest the following sentence:
"Our results suggest that acetylcholine augments the responsiveness of layer 5 neurons to inputs from outside of the local network, possibly enabling faster switching between internal representations during locomotion."
Thank you for clarifying. We have changed as suggested.
Reviewer #2 (Recommendations For The Authors):
I thank the authors for the clarification regarding the distribution of running speeds in the study. I do agree that 30 cm/s is indeed fast for head-fixed locomotion. My concern is that while all mice contribute to the low locomotion velocity bin, the high locomotion velocity bin is dominated by a subset of animals, since not all mice reached high locomotion speeds. Therefore, the comparison between low, intermediate and high locomotion velocities includes data from different cohorts of animals and variability across animals may confound the analysis of cholinergic axon activity. However, the manuscript is carefully worded to emphasize lack of evidence (e.g. "we found no evidence of an increase in calcium activity between low and high locomotion velocities") and I have revised my summary in the public review to reflect this.
I thank the authors for including the scatterplots of single neuron responses locomotion and optogenetic stimulation, which illustrate their heterogeneity. I am surprised that the axes are limited to 20% deltaF/F as visual responses recorded using GCaMP6f often exceed 100% deltaF/F .
There are definitely neurons with responses larger than 20% dF/F0, but it is a small fraction. There are two considerations relevant to assessing dF/F amplitudes. First, in our hands trial averaged dF/F0 responses tend to be below 30% even for the most responsive neurons (trial averaging convolves response amplitude and response reliability). The reviewer is probably thinking of single trial responses often shown as raw data that can exceed 100s of %. Second, different published variants for calculating dF/F0 can result in a spectrum of values that varies by up to a factor of 10. This is largely a consequence of the choice of F0 and preprocessing related to correcting slow drifts in signal strength (originally motivated by photobleaching). Attempting to compare dF/F0 across labs is unfortunately a futile effort in absence of standardized way of calculating it.
Allow me to clarify how evaluating the effects of optogenetic stimulation and locomotion without analyzing them at the level of individual neurons could result in misleading conclusions. I will use the effects of cholinergic responses on grating responses as an example but this concern applies equally to the other analyses. The manuscript reports that "in layer 2/3, optogenetic activation of cholinergic axons did not result in a detectable increase in grating onset responses (Figure 4C), while the responses of layer 5 neurons to the same stimulus increased with concurrent optogenetic activation of cholinergic axons." As the Figure R2C-D illustrates, only a minority of L2/3 neurons are excited by the grating in baseline conditions, while the vast majority are either suppressed or non-responsive. This is expected, as it is well established that visual responses in layer 2/3 are sparse. If responses of the small subset of L2/3 neurons that are activated by the grating were enhanced, it may not be apparent in the population average presented in the manuscript. In contrast, since a larger fraction of L5 neurons is excited by the grating, enhancement of grating responses may be easier to detect. In other words, the effects of optogenetic stimulation may be to boost the responses of those neurons that are activated by the grating and the difference between L2/3 and L5 lies simply in the proportion of activated neurons. I do not mean to argue in favour of this specific scenario but simply present it so as to illustrate the way in which considering population averages alone may be misleading.
While the authors state in their response that "all relevant and clear conclusions are already captured by the mean differences shown in Figure 4", the evidence supporting this statement is not presented in the manuscript. Most importantly, it is essential to determine whether the neurons that show significant activation in response to gratings (Figure 4C-D), mismatch (Figure 4E-F) or locomotion (Figure 4G-H), are affected by optogenetic stimulation in the same way as the population average.
We have added the analysis suggested as Figure S6. Consistent with the population averages, even within the subset of layer 2/3 neurons most responsive to specific inputs, we found no detectable increase in responsiveness upon optogenetic stimulation of cholinergic axons.
-
-
Author response:
The following is the authors’ response to the previous reviews.
We thank you for the time you took to review our work and for your feedback!
The major changes to the manuscript are:
(1) We have added visual flow speed and locomotion velocity traces to Figure 5 as suggested.
(2) We have rephrased the abstract to more clearly indicate that our statement regarding acetylcholine enabling faster switching of internal representations in layer 5 is speculative.
(3) We have further clarified the positioning of our findings regarding the basal forebrain cholinergic signal in visual cortex in the introduction.
(4) We have added a video (Video S1) to illustrate different mouse running speeds covered by our data.
A detailed point-by-point response to all reviewer concerns is provided below.
Reviewer #1 (Recommendations For The …
Author response:
The following is the authors’ response to the previous reviews.
We thank you for the time you took to review our work and for your feedback!
The major changes to the manuscript are:
(1) We have added visual flow speed and locomotion velocity traces to Figure 5 as suggested.
(2) We have rephrased the abstract to more clearly indicate that our statement regarding acetylcholine enabling faster switching of internal representations in layer 5 is speculative.
(3) We have further clarified the positioning of our findings regarding the basal forebrain cholinergic signal in visual cortex in the introduction.
(4) We have added a video (Video S1) to illustrate different mouse running speeds covered by our data.
A detailed point-by-point response to all reviewer concerns is provided below.
Reviewer #1 (Recommendations For The Authors):
The authors have addressed most of the concerns raised in the initial review. While the paper has been improved, there are still some points of concern in the revised version.
Major comments
(1) Page 1, Line 21: The authors claim, "Our results suggest that acetylcholine augments the responsiveness of layer 5 neurons to inputs from outside of the local network, enabling faster switching between internal representations during locomotion." However, it is not clear which specific data or results support the claim of "switching between internal representations." ...
Authors' response: "... That acetylcholine enables a faster switching between internal representations in layer 5 is a speculation. We have attempted to make this clearer in the discussion. ..."
In the revised version, there is no new data added to directly support the claim - "Our results suggest acetylcholine ..., enabling faster switching between internal representations during locomotion" (in the abstract). The authors themselves acknowledge that this statement is speculative. The present data only demonstrate that ACh reduces the response latency of L5 neurons to visual stimuli, but not that ACh facilitates quicker transitions in neuronal responses from one visual stimulus to another. To maintain scientific rigor and clarity, I recommend the authors amend this sentence to more accurately reflect the findings.
This might be a semantic disagreement? We would argue both a gray screen and a grating are visual stimuli. Hence, we are not sure we understand what the reviewer means by “but not that ACh facilitates quicker transitions in neuronal responses from one visual stimulus to another”. We concur, our data only address one of many possible transitions, but it is a switch between distinct visual stimuli that is sped up by ACh. Nevertheless, we have rephrased the sentence in question by changing “our data suggest” to “based on this we speculate” - but are not sure whether this addresses the reviewer’s concern.
(2) Page 4, Line 103: "..., a direct measurement of the activity of cholinergic projection from basal forebrain to the visual cortex during locomotion has not been made." This statement is incorrect. An earlier study by Reimer et al. indeed imaged cholinergic axons in the visual cortex of mice running on a wheel.
Authors' response: "We have clarified this as suggested. However, we disagree slightly with the reviewer here. The key question is whether the cholinergic axons imaged originate in basal forebrain. While Reimer et al. 2016 did set out to do this, we believe a number of methodological considerations prevent this conclusion: ... Collins et al. 2023 inject more laterally and thus characterize cholinergic input to S1 and A1, ..."
The authors pointed out some methodological caveats in previous studies that measured the BF input in V1, and I agree with them on several points. Nonetheless, the statement that "a direct measurement of the activity of cholinergic projection from basal forebrain to visual cortex during locomotion has not been made. ... Prior measurements of the activity of cholinergic axons in visual cortex have all relied on data from a cross of ChAT-Cre mice with a reporter line ..." (Page 4, Line 103) seems to be an oversimplification. In fact, contrary to what the authors noted, Collins et al. (2023) conducted direct imaging of BF cholinergic axons in V1 (Fig. 1) - "Selected axon segments were chosen from putative retrosplenial, somatosensory, primary and secondary motor, and visual cortices". They used a viral approach to express GCaMP in BF axons to bypass the limitations associated with the use of a GCaMP reporter mouse line - "Viral injections were used for BF- ACh studies to avoid imaging axons or dendrites from cholinergic projections not arising from the BF (e.g. cortical cholinergic interneurons)." The authors should reconsider the text.
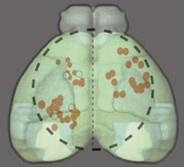
The reason we think that our statement here was – while simplified – accurate, is that Collins et al. do record from cholinergic axons in V1, but they don’t show these data (they only show pooled data across all recordings sites). By superimposing the recording locations of the Collins paper on the Allen mouse brain atlas (Figure R1), we estimate that of the approximately 50 recording sites, most are in somatosensory and somatomotor areas of cortex, and only 1 appears to be in V1, something that is often missed as it is not really highlighted in that paper. If this is indeed correct, we would argue that the data in the Collins et al. paper are not representative of cholinergic activity in visual cortex (we fear only the authors would know for sure). Nevertheless, we have rephrased again.
Author response image 1.
Overlay of the Collins et al. imaging sites (red dots, black outline and dashed circle) on the Allen mouse brain atlas (green shading). Very few (we estimate that it was only 1) of the recording sites appear to be in V1 (the lightest green area), and maybe an additional 4 appear to be in secondary visual areas.
Minor comments
(1) It is unclear which BF subregion(s) were targeted in this study.
Authors' response: Thanks for pointing this out. We targeted the entire basal forebrain (medial septum, vertical and horizontal limbs of the diagonal band, and nucleus basalis) with our viral injections. ... We have now added the labels for basal forebrain subregions targeted next to the injection coordinates in the manuscript.
The authors provided the coordinates for their virus injections targeting the BF subregions - "(AP, ML, DV (in mm): ... ; +0.6, +0.6, -4.9 (nucleus basalis) ..." Is this the right coordinates for the nucleus basalis?
Thank you for catching this - this was indeed incorrect. The coordinates were correct, but our annotation of brain region was not (as the reviewer correctly points out, these coordinates are in the horizontal limb of the diagonal band, not the nucleus basalis). We have corrected this.
Reviewer #2 (Recommendations For The Authors):
Thank you for addressing most of the points raised in my original review. I still some concerns relating to the analysis of the data.
(1) I appreciate the authors point that getting mice to reliably during head-fixed recordings can require training. Since mice in this study were not trained to run, their low speed of locomotion limits the interpretation of the results. I think this is an important potential caveat and I have retained it in the public review.
This might be a misunderstanding. The Jordan paper was a bit of an outlier in that we needed mice to run at very high rates due to fact that our recording times was only minutes. Mice were chosen such that they would more or less continuously run, to maximize the likelihood that they would run during the intracellular recordings. This was what we tried to convey in our previous response. The speed range covered by the analysis in this paper is 0 cm/s to 36 cm/s. 36 cm/s is not far away from the top speed mice can reach on this treadmill (30 cm/s is 1 revolution of the treadmill per second). In our data, the top speed we measured across all mice was 36 cm/s. In the Jordan paper, the peak running speed across the entire dataset was 44 cm/s. Based on the reviewer’s comment, we suspect that the reviewer may be under the impression that 30 cm/s is a relatively slow running speed. To illustrate what this looks like we have made added a video (Video S1) to illustrate different running speeds.
(2) The majority of the analyses in the revised manuscript focus on grand average responses, which may mask heterogeneity in the underlying neural populations. This could be addressed by analysing the magnitude and latency of responses for individual neurons. For example, if I understand correctly, the analyses include all neurons, whether or not they are activated, inhibited, or unaffected by visual stimulation and locomotion. For example, while on average layer 2/3 neurons are suppressed by the grating stimulus (Figure 4A), presumable a subset are activated. Evaluating the effects of optogenetic stimulation and locomotion without analyzing them at the level of individual neurons could result in misleading conclusions. This could be presented in the form of a scatter plot, depicting the magnitude of neuronal responses in locomotion vs stationary condition, and opto+ vs no opto conditions.
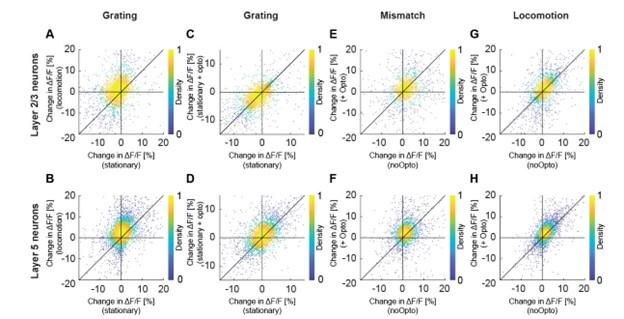
We might be misunderstanding. The first part of the comment is a bit too unspecific to address directly. In cases in which we find the variability is relevant to our conclusions, we do show this for individual cells (e.g.the latencies to running onset are shown as histograms for all cells and axons in Figure S1). It is also unclear to us what the reviewer means by “Evaluating the effects of optogenetic stimulation and locomotion without analyzing them at the level of individual neurons could result in misleading conclusions”. Our conclusions relate to the average responses in L2/3, consistent with the analysis shown. All data will be freely available for anyone to perform follow-up analysis of things we may have missed. E.g., the specific suggestion of presenting the data shown in Figure 4 as a scatter plot is shown below (Figure R2). This is something we had looked at but found not to be relevant to our conclusions. The problem with this analysis is that it is difficult to estimate how much the different sources of variability contribute to the total variability observed in the data, and no interesting pattern is clearly apparent. All relevant and clear conclusions are already captured by the mean differences shown in Figure 4.
Author response image 2.
Optogenetic activation of cholinergic axons in visual cortex primarily enhances responses of layer 5, but not layer 2/3 neurons. Related to Figure 4. (A) Average calcium response of layer 2/3 neurons in visual cortex to full field drifting grating in the absence or presence of locomotion. Each dot is the average calcium activity of an individual neuron during the two conditions. (B) As in A, but for layer 5 neurons. (C) As in A, but comparing the average response while the mice were stationary, to that while cholinergic axons were optogenetically stimulated. (D) As in C, but for layer 5 neurons. (E) Average calcium response of layer 2/3 neurons in visual cortex to visuomotor mismatch, without and with optogenetic stimulation of cholinergic axons in visual cortex. (F) As in E, but for layer 5 neurons. (G) Average calcium response of layer 2/3 neurons in visual cortex to locomotion onset in closed loop, without and with optogenetic stimulation of cholinergic axons in visual cortex. (H) As in G, but for layer 5 neurons.
(3) To help the reader understand the experimental conditions in open loop experiments, please include average visual flow speed traces for each condition in Figure 5.
We have added the locomotion velocity and visual flow speeds to the corresponding conditions in Figure
-
eLife assessment
This important study by Yogesh and Keller provides a set of results describing the response properties of cholinergic input and its functional impacts in the mouse visual cortex. They found that cholinergic inputs are elevated by locomotion in a binary manner regardless of locomotor speeds, and activation of cholinergic input differently modulated the activity of Later 2/3 and Layer 5 visual cortex neurons induced by bottom-up (visual stimuli) and top-down (visuomotor mismatch) inputs. The experiments are cutting-edge and well-executed, and the results are convincing.
-
Reviewer #1 (Public Review):
The paper submitted by Yogesh and Keller explores the role of cholinergic input from the basal forebrain (BF) in the mouse primary visual cortex (V1). The study aims to understand the signals conveyed by BF cholinergic axons in the visual cortex, their impact on neurons in different cortical layers, and their computational significance in cortical visual processing. The authors employed two-photon calcium imaging to directly monitor cholinergic input from BF axons expressing GCaMP6 in mice running through a virtual corridor, revealing a strong correlation between BF axonal activity and locomotion. This persistent activation during locomotion suggests that BF input provides a binary locomotion state signal. To elucidate the impact of cholinergic input on cortical activity, the authors conducted optogenetic …
Reviewer #1 (Public Review):
The paper submitted by Yogesh and Keller explores the role of cholinergic input from the basal forebrain (BF) in the mouse primary visual cortex (V1). The study aims to understand the signals conveyed by BF cholinergic axons in the visual cortex, their impact on neurons in different cortical layers, and their computational significance in cortical visual processing. The authors employed two-photon calcium imaging to directly monitor cholinergic input from BF axons expressing GCaMP6 in mice running through a virtual corridor, revealing a strong correlation between BF axonal activity and locomotion. This persistent activation during locomotion suggests that BF input provides a binary locomotion state signal. To elucidate the impact of cholinergic input on cortical activity, the authors conducted optogenetic and chemogenetic manipulations, with a specific focus on L2/3 and L5 neurons. They found that cholinergic input modulates the responses of L5 neurons to visual stimuli and visuomotor mismatch, while not significantly affecting L2/3 neurons. Moreover, the study demonstrates that BF cholinergic input leads to decorrelation in the activity patterns of L2/3 and L5 neurons.
This topic has garnered significant attention in the field, drawing the interest of many researchers actively investigating the role of BF cholinergic input in cortical activity and sensory processing. The experiments and analyses were thoughtfully designed and conducted with rigorous standards, providing evidence of layer-specific differences in the impact of cholinergic input on neuronal responses to bottom-up (visual stimuli) and top-down inputs (visuomotor mismatch).
-
Reviewer #2 (Public Review):
The manuscript investigates the function of basal forebrain cholinergic axons in mouse primary visual cortex (V1) during locomotion using two-photon calcium imaging in head-fixed mice. Cholinergic modulation has previously been proposed to mediate the effects of locomotion on V1 responses. The manuscript concludes that the activity of basal forebrain cholinergic axons in visual cortex provides a signal which is more correlated with binary locomotion state than locomotion velocity of the animal and finds no evidence for modulation of cholinergic axons by locomotion velocity. Cholinergic axons did not seem to respond to grating stimuli or visuomotor prediction error. Optogenetic stimulation of these axons increased the amplitude of responses to visual stimuli and decreased the response latency of layer 5 …
Reviewer #2 (Public Review):
The manuscript investigates the function of basal forebrain cholinergic axons in mouse primary visual cortex (V1) during locomotion using two-photon calcium imaging in head-fixed mice. Cholinergic modulation has previously been proposed to mediate the effects of locomotion on V1 responses. The manuscript concludes that the activity of basal forebrain cholinergic axons in visual cortex provides a signal which is more correlated with binary locomotion state than locomotion velocity of the animal and finds no evidence for modulation of cholinergic axons by locomotion velocity. Cholinergic axons did not seem to respond to grating stimuli or visuomotor prediction error. Optogenetic stimulation of these axons increased the amplitude of responses to visual stimuli and decreased the response latency of layer 5 excitatory neurons, but not layer 2/3 neurons. Moreover, optogenetic or chemogenetic stimulation of cholinergic inputs reduced pairwise correlation of neuronal responses. These results provide insight into the role of cholinergic modulation to visual cortex and demonstrate that it affects different layers of visual cortex in a distinct manner. The experiments are well executed and the data appear to be of high quality. However, further analyses may be required to fully support some of the study's conclusions. Specifically, the analyses of the effects of locomotion and stimulation of cholinergic inputs present grand averages of responses across all neurons, and therefore may mask heterogeneity across layer 2/3 and layer 5 neurons.
-
-
Author Response
We thank you for the time you took to review our work and for your feedback!
The major changes to the manuscript are:
We have extended the range of locomotion velocity over which we compare its dependence with cholinergic activity in Figures 2E and S2H.
We have quantified the contributions of cholinergic stimulation on multiplicative and additive gains on visual responses (Figure S7).
We have provided single cell examples for the change in latency to visual response (Figure S12).
We have added an analysis to compare layer 2/3 and layer 5 locomotion onset responses as a function of visuomotor condition (Figure S8).
A detailed point-by-point response to all reviewer concerns is provided below.
Reviewer #1 (Public Review):
The paper submitted by Yogesh and Keller explores the role of cholinergic input from the basal …
Author Response
We thank you for the time you took to review our work and for your feedback!
The major changes to the manuscript are:
We have extended the range of locomotion velocity over which we compare its dependence with cholinergic activity in Figures 2E and S2H.
We have quantified the contributions of cholinergic stimulation on multiplicative and additive gains on visual responses (Figure S7).
We have provided single cell examples for the change in latency to visual response (Figure S12).
We have added an analysis to compare layer 2/3 and layer 5 locomotion onset responses as a function of visuomotor condition (Figure S8).
A detailed point-by-point response to all reviewer concerns is provided below.
Reviewer #1 (Public Review):
The paper submitted by Yogesh and Keller explores the role of cholinergic input from the basal forebrain (BF) in the mouse primary visual cortex (V1). The study aims to understand the signals conveyed by BF cholinergic axons in the visual cortex, their impact on neurons in different cortical layers, and their computational significance in cortical visual processing. The authors employed two-photon calcium imaging to directly monitor cholinergic input from BF axons expressing GCaMP6 in mice running through a virtual corridor, revealing a strong correlation between BF axonal activity and locomotion. This persistent activation during locomotion suggests that BF input provides a binary locomotion state signal. To elucidate the impact of cholinergic input on cortical activity, the authors conducted optogenetic and chemogenetic manipulations, with a specific focus on L2/3 and L5 neurons. They found that cholinergic input modulates the responses of L5 neurons to visual stimuli and visuomotor mismatch, while not significantly affecting L2/3 neurons. Moreover, the study demonstrates that BF cholinergic input leads to decorrelation in the activity patterns of L2/3 and L5 neurons.
This topic has garnered significant attention in the field, drawing the interest of many researchers actively investigating the role of BF cholinergic input in cortical activity and sensory processing. The experiments and analyses were thoughtfully designed and conducted with rigorous standards, leading to convincing results which align well with findings in previous studies. In other words, some of the main findings, such as the correlation between cholinergic input and locomotor activity and the effects of cholinergic input on V1 cortical activity, have been previously demonstrated by other labs (Goard and Dan, 2009; Pinto et al., 2013; Reimer et al., 2016). However, the study by Yogesh and Keller stands out by combining cutting-edge calcium imaging and optogenetics to provide compelling evidence of layerspecific differences in the impact of cholinergic input on neuronal responses to bottom-up (visual stimuli) and top-down inputs (visuomotor mismatch).
We thank the reviewer for their feedback.
Reviewer #2 (Public Review):
The manuscript investigates the function of basal forebrain cholinergic axons in mouse primary visual cortex (V1) during locomotion using two-photon calcium imaging in head-fixed mice. Cholinergic modulation has previously been proposed to mediate the effects of locomotion on V1 responses. The manuscript concludes that the activity of basal forebrain cholinergic axons in visual cortex provides a signal which is more correlated with binary locomotion state than locomotion velocity of the animal. Cholinergic axons did not seem to respond to grating stimuli or visuomotor prediction error. Optogenetic stimulation of these axons increased the amplitude of responses to visual stimuli and decreased the response latency of layer 5 excitatory neurons, but not layer 2/3 neurons. Moreover, optogenetic or chemogenetic stimulation of cholinergic inputs reduced pairwise correlation of neuronal responses. These results provide insight into the role of cholinergic modulation to visual cortex and demonstrate that it affects different layers of visual cortex in a distinct manner. The experiments are well executed and the data appear to be of high quality. However, further analyses are required to fully support several of the study's conclusions.
We thank the reviewer for their feedback.
- In experiments analysing the activity of V1 neurons, GCaMP6f was expressed using a ubiquitous Ef1a promoter, which is active in all neuronal cell types as well as potentially non-neuronal cells. The manuscript specifically refers to responses of excitatory neurons but it is unclear how excitatory neuron somata were identified and distinguished from that of inhibitory neurons or other cell types.
This might be a misunderstanding. The Ef1α promoter has been reported to drive highly specific expression in neurons (Tsuchiya et al., 2002) with 99.7% of labeled cells in layer 2/3 of rat cortex being NeuN+ (a neuronal marker), with only 0.3% of labeled cells being GFAP+ (a glial marker) (Yaguchi et al., 2013). This bias was even stronger in layer 5 with 100% of labeled cells being NeuN+ and none GFAP+ (Yaguchi et al., 2013). The Ef1α promoter in an AAV vector, as we use it here, also biases expression to excitatory neurons. In layer 2/3 of mouse visual cortex, we have found that 96.8% ± 0.7% of labeled neurons are excitatory three weeks after viral injection (Attinger et al., 2017). Similar results have also been found in rats (Yaguchi et al., 2013), where on expressing GFP under Ef1a promoter delivered using Lenti virus, 95.2% of labeled neurons in layer 2/3 were excitatory and 94.1% in layer 5 were excitatory. These numbers are comparable to the ones obtained with promoters commonly used to target expression to excitatory neurons. To do this, typically two variants of promoters based on the transcription start region of CaMKIIα gene have been used. The first, the CaMKIIα-0.4 promoter, results in 95% excitatory specificity (Scheyltjens et al., 2015). The second, the CaMKIIα-1.3 promoter, results in only 82% excitatory specificity (Scheyltjens et al., 2015), and is thus not far from chance. We have clarified this in the manuscript. Nevertheless, we have removed the qualifier “excitatory” when talking about neurons in most instances, throughout the manuscript.
- The manuscript concludes that cholinergic axons convey a binary locomotion signal and are not tuned to running speed. The average running velocity of mice in this study is very slow - slower than 15 cm/s in the example trace in Figure 1D and speeds <6 cm/s were quantified in Figure 2E. However, mice can run at much faster speeds both under head-fixed and freely moving conditions (see e.g. Jordan and Keller, 2020, where example running speeds are ~35 cm/s). Given that the data in the present manuscript cover such a narrow range of running speeds, it is not possible to determine whether cholinergic axons are tuned to running speed or convey a binary locomotion signal.
Our previous analysis window of 0-6.25 cm/s covered approximately 80% of all data. We have increased the analysis window to 0-35 cm/s that now covers more than 99% of the data (see below). Also, note that very high running speeds are probably overrepresented in the Jordan and Keller 2020 paper as mice had to be trained to run reliably before all experiments given the relatively short holding times of the intracellular recordings. The running speeds in our current dataset are comparable to other datasets we have acquired in similar experiments.
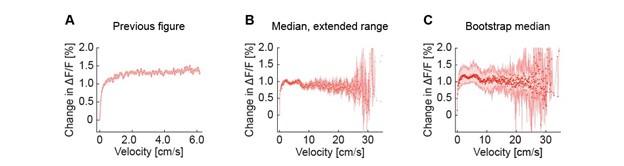
Figure 2E has now been updated to reflect the larger range of data. Please note, as the number of mice that contribute to the data now differs as a function of velocity (some mice run faster than others), we have now switched to a variant of the plot based on hierarchical bootstrap sampling (see Methods). This does not overtly change the appearance of the plot. See Author response image 1 for a comparison of the original plot, the extended range without bootstrap sampling, and the extended range with bootstrap sampling currently used in the paper.
Author response image 1.
Average activity of cholinergic axons as a function of locomotion velocity. (A) As in the previous version of the manuscript. (B) As in A, but with the extended velocity range. (C) As in B, but using hierarchical bootstrap sampling to estimate median (red dots) and 95% confidence interval (shading) for each velocity bin.
- The analyses in Figure 4 only consider the average response to all grating orientations and directions. Without further analysing responses to individual grating directions it is unclear how stimulation of cholinergic inputs affects visual responses. Previous work (e.g. Datarlat and Stryker, 2017) has shown that locomotion can have both additive and multiplicative effects and it would be valuable to determine the type of modulation provided by cholinergic stimulation.
We thank the reviewer for this suggestion. To address this, we quantified how cholinergic stimulation influenced the orientation tuning of V1 neurons. The stimuli we used were full field sinusoidal drifting gratings of 4 different orientations (2 directions each). For each neuron, we identified the preferred orientation and plotted responses relative to this preferred orientation as a function of whether the mouse was running, or we were stimulating cholinergic axons. Consistent with previous work, we found a mixture of a multiplicative and an additive components during running. With cholinergic axon stimulation, the multiplicative effect was stronger than the additive effect. This is now quantified in Figure S7.
- The difference between the effects of locomotion and optogenetic stimulation of cholinergic axons in Figure 5 may be confounded by differences in the visual stimulus. These experiments are carried out under open-loop conditions, where mice may adapt their locomotion based on the speed of the visual stimulus. Consequently, locomotion onsets are likely to occur during periods of higher visual flow. Since optogenetic stimulation is presented randomly, it is likely to occur during periods of lower visual flow speed. Consequently, the difference between the effect of locomotion and optogenetic stimulation may be explained by differences in visual flow speed and it is important to exclude this possibility.
We find that in general locomotion is unaffected by visual flow in open loop conditions in this type of experiment (in this particular dataset, there was a small negative correlation between locomotion and visual flow in the open loop condition, Author response image 2).
Author response image 2.
Correlation between visual flow and locomotion in open loop conditions. Average correlation of locomotion velocity and visual flow speed in open loop for all mice in Figure 5. Each dot is an imaging site. In the open loop, the correlation between locomotion and visual flow speed is close to zero, but significantly negative in this dataset.

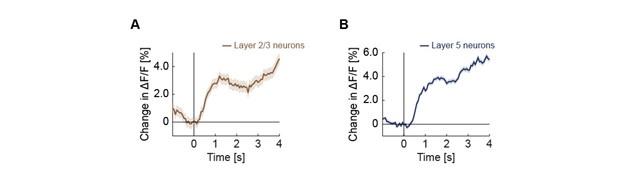
However, to directly address the concern that our results are influenced by visual flow, we can restrict our analysis only to locomotion onsets that occurred in absence of visual flow (Author response image 3A and R3B). These responses are not substantially different from those when including all data (Figures 5A and 5B). Thus, the difference between the effect of locomotion and optogenetic stimulation cannot be explained by differences in visual flow speed.
Author response image 3.
Open loop locomotion onset responses without visual flow. (A) Average calcium response of layer 2/3 neurons in visual cortex to locomotion onset in open loop in the absence of visual flow. Shading indicates SEM. (B) As in A, but for layer 5 neurons.
- It is unclear why chemogenetic manipulations of cholinergic inputs had no effect on pairwise correlations of L2/3 neuronal responses while optogenetic stimulation did.
This is correct – we do not know why that is the case and can only speculate. There are at least two possible explanations for this difference:
Local vs. systemic. The optogenetic manipulation is relatively local, while the chemogenetic manipulation is systemic. It is not clear how cholinergic release in other brain regions influences the correlation structure in visual cortex. It is conceivable that a cortex-wide change in cholinergic release results in a categorically different state with a specific correlation structure in layer 2/3 neurons different from the one induced by the more local optogenetic manipulation.
Layer-specificity of activation. Cholinergic projections to visual cortex arrive both in superficial and deep layers. We activate the axons in visual cortex optogenetically by illuminating the cortical surface. Thus, in our optogenetic experiments, we are primarily activating the axons arriving superficially, while in the chemogenetic experiment, we are likely influencing superficial and deep axons similarly. Thus, we might expect a bias in the optogenetic activation to influencing superficial layers more strongly than the chemogenetic activation does.
- The effects of locomotion and optogenetic stimulation on the latency of L5 responses in Figure 7 are very large - ~100 ms. Indeed, typical latencies in mouse V1 measured using electrophysiology are themselves shorter than 100 ms (see e.g. Durand et al., 2016). Visual response latencies in stationary conditions or without optogenetic stimulation appear surprisingly long - much longer than reported in previous studies even under anaesthesia. Such large and surprising results require careful analysis to ensure they are not confounded by artefacts. However, as in Figure 4, this analysis is based only on average responses across all gratings and no individual examples are shown.
This is correct and we speculate this is the consequence of a combination of different reasons.
Calcium imaging is inherently slower than electrophysiological recordings. While measuring spiking responses using electrophysiology, response latencies of on the order of 100 ms have indeed been reported, as the reviewer points out. Using calcium imaging these latencies are typically 4 times longer (Kuznetsova et al., 2021). This is likely a combination of a) calcium signals that are slower than electrical changes, b) delays in the calcium sensor itself, and c) temporal sampling used for imaging that is about 3 orders of magnitude slower than what typically used for electrophysiology.
Different neurons included in analysis. The calcium imaging likely has very different biases than electrophysiological recordings. Historically, the fraction of visually responsive neurons in visual cortex based on extracellular electrophysiological recordings has been systematically overestimated (Olshausen and Field, 2005). One key contributor to this is the fact that recordings are biased to visually responsive neurons. The criteria for inclusion of “responsive neurons” strongly influences the “average” response latency. In addition, calcium imaging has biases that relate to the vertical position of the somata in cortex. Both layer 2/3 and layer 5 recordings are likely biased to superficial layer 2/3 and superficial layer 5 neurons. Conversely, electrical recordings are likely biased to layer 4 and layer 5 neurons. Thus, comparisons at this level of resolution between data obtained with these two methods are difficult to make.
We have added example neurons as Figure S12, as suggested.
Reviewer #1 (Recommendations For The Authors):
While the study showcases valuable insights, I have a couple of concerns regarding the novelty of their research and the interpretation of results. By addressing these concerns, the authors can clarify the positioning of their research and strengthen the significance of their findings.
(Major comments)
- Page 1, Line 21: The authors claim, "Our results suggest that acetylcholine augments the responsiveness of layer 5 neurons to inputs from outside of the local network, enabling faster switching between internal representations during locomotion." However, it is not clear which specific data or results support the claim of "switching between internal representations." Overall, their study primarily presents responses averaged across all neurons imaged, lacking a detailed exploration of individual neuron response patterns. Population analysis, such as PCA and decoding, can be used to assess the encoding of each stimulus by V1 neurons - "internal representation."
To strengthen their claim regarding "switching between internal representations," the authors could consider an experiment measuring the speed at which the population activity pattern A transitions to the population activity pattern B when the visual stimulus switches from A to B. Such experiments would significantly enhance the impact of their study, providing a clearer understanding of how BF cholinergic input influences the dynamic representation of stimuli during locomotion.
We thank the reviewer for bringing this up. That acetylcholine enables a faster switching between internal representations in layer 5 is a speculation. We have attempted to make this clearer in the discussion. Our speculation is based on the finding that the population response in layer 5 to sensory input is faster under high levels of acetylcholine (Figures 4D and 7B). In line with the reviewer’s intuition, the neuronal response to a change in visual stimulus, in our experiment from a uniform grey visual stimulus to a sinusoidal grating stimulus, is indeed faster. Based on evidence in favor of layer 5 encoding internal representation (Heindorf and Keller, 2023; Keller and Mrsic-Flogel, 2018; Suzuki and Larkum, 2020), we interpret the decrease in latency of the population response as a faster change in internal representation. We are not sure a decoding analysis would add much to this, given that a trivial decoder simply based on mean population response would already find a faster transition. We have expanded on our explanation of these points in the manuscript.
- Page 4, Line 103: "..., a direct measurement of the activity of cholinergic projection from basal forebrain to the visual cortex during locomotion has not been made." This statement is incorrect. An earlier study by Reimer et al. indeed imaged cholinergic axons in the visual cortex of mice running on a wheel. They found that "After walking onset, ... ACh activation, and a large pupil diameter, were sustained throughout the walking period in both cortical areas V1 and A1." Their findings are very similar to the results presented by Yogesh and Keller - that is, BF cholinergic axons exhibited locomotion statedependent activity. The authors should clarify the positioning of this study relative to previous studies.
Reimer, J., McGinley, M., Liu, Y. et al. Pupil fluctuations track rapid changes in adrenergic and cholinergic activity in cortex. Nat Commun 7, 13289 (2016). https://doi.org/10.1038/ncomms13289
We have clarified this as suggested. However, we disagree slightly with the reviewer here. The key question is whether the cholinergic axons imaged originate in basal forebrain. While Reimer et al. 2016 did set out to do this, we believe a number of methodological considerations prevent this conclusion:
In their analysis, Reimer et al. 2016 combine data from mice with cholinergic axons labeled with either viral injection to basal forebrain or germline cross of ChAT-cre mice with reporter line. Unfortunately, it is unclear what the exact number of mice labeled with either strategy was. Based on the information in the paper, we can conclude that of the 6 mice used for experiments between 2 and 5 were germline cross. The problem with germline labeling of ChAT positive neurons is that when using a cross, VIP-ChAT+ neurons in cortex are also labeled. Based on the fact that Reimer et al. 2016 find an anticipatory increase in activity on locomotion onset, that is also seen by Larsen et al. 2018 (they use a germline cross strategy), an effect we do not see in our data, we speculate that a significant part of the signals reported in the Reimer et al. 2016 paper are from local VIP-ChAT+ neurons.
In their analysis, Reimer et al. 2016 also combine all imaging data obtained from both primary auditory cortex and primary visual cortex. Given the heterogeneity in the basal forebrain cholinergic neuronal population and their projection selectivity, to better understand these signals, it’s important to acquire the signals from cholinergic axons selectively in specific cortical regions, which we do in visual cortex. Based on the information provided in their paper, we were unfortunately not able to discern the injection location for their viral labeling strategy. Given the topographic selectivity in projection from basal forebrain, this could give hints as to the relative contribution of cholinergic projections to A1 vs V1 in their data. The injection coordinates given in the methods of the Reimer paper, of 4 mm lateral and 0.5 mm posterior to bregma to target basal forebrain, are likely wrong (they fall outside the head of the mouse).
Given the heterogeneity in the basal forebrain cholinergic neuronal population and their projection selectivity, to better understand these signals, it’s important to acquire the signals from cholinergic axons both selectively in a cortical region, as we do in visual cortex, and purely originating from basal forebrain. Collins et al. 2023 inject more laterally and thus characterize cholinergic input to S1 and A1, while Lohani et al. 2022 use GRAB sensors which complement our findings. Please note, we don’t think there is any substantial disagreement in the results of previous studies and ours, with very few exceptions, like the anticipatory increase in cholinergic activity that precedes locomotion onset in the Reimer et al. 2016 data, but not in ours. This is a rather critical point in the context of the literature of motor-related neuronal activity in mouse V1. Based on early work on the topic, it is frequently assumed that motor-related activity in V1 is driven by a cholinergic input. This is very likely incorrect given our results, hence we feel it is important to highlight this methodological caveat of earlier work.
- Fig. 4H: The authors found that L5 neurons exhibit positive responses at the onset of locomotion in a closed-loop configuration. Moreover, these responses are further enhanced by photostimulation of BF axons.
In a previous study from the same authors' group (Heindorf and Keller, 2023), they reported 'negative' responses in L5a IT neurons during closed-loop locomotion. This raises a question about the potential influence of different L5 neuron types on the observed results between the two studies. Do the author think that the involvement of the other neuronal type in L5, the PT neurons, might explain the positive responses seen in the present study? Discussing this point in the paper would provide valuable insights into the underlying mechanisms.
Yes, we do think the positive response observed on locomotion onset in closed loop is due to non-Tlx3+ neurons. Given that Tlx3-cre only labels a subset of inter-telencephalic (IT) neurons (Gerfen et al., 2013; Heindorf and Keller, 2023), it’s not clear whether the positive response is explained by the pyramidal tract (PT) neurons, or the non-Tlx3+ IT neurons. Dissecting the response profiles of different subsets of layer 5 neurons is an active area of research in the lab and we hope to be able to answer these points more comprehensively in future publications. We have expanded on this in the discussion as suggested.
Furthermore, it would be valuable to investigate whether the effects of photostimulation of BF axons vary depending on neuronal responsiveness. This could help elucidate how neurons with positive responses, potentially putative PT neurons, differ from neurons with negative responses, putative IT neurons, in their response to BF axon photostimulation during locomotion.
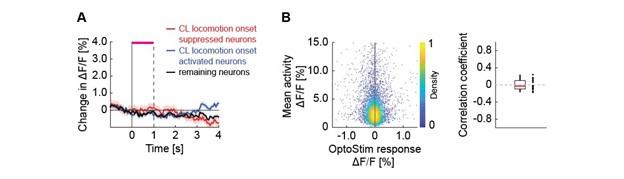
We have attempted an analysis of the form suggested. In short, we found no relationship between a neuron’s response to optogenetic stimulation of ChAT axons and its response to locomotion onset, or its mean activity. Based on their response to locomotion onset in closed loop, we split layer 5 neurons into three groups, 30% most strongly decreasing (putative Tlx3+), 30% most strongly increasing, and the rest. We did not see a response to optogenetic stimulation of basal forebrain cholinergic axons in any of the three groups (Author response image 4A). We also found no obvious relationship between the mean activity of neurons and their response to optogenetic stimulation (Author response image 4B).
Author response image 4.
Neither putative layer 5 cell types nor neuronal responsiveness correlates with the response to optogenetic stimulation of cholinergic axons. (A) Average calcium response of layer 5 neurons split into putative Tlx3 (closed loop locomotion onset suppressed) and non-Tlx3 like (closed loop locomotion onset activated) to optogenetic stimulation of cholinergic axons. (B) Average calcium response of layer 5 neurons to optogenetic stimulation of cholinergic axons as a function of their mean response throughout the experimental session. Left: Each dot is a neuron. Right: Average correlation in the response of layer 5 to optogenetic stimulation and mean activity over all neurons per imaging site. Each dot is an imaging site.
(Minor comments)
- It is unclear which BF subregion(s) were targeted in this study.
Thanks for pointing this out. We targeted the entire basal forebrain (medial septum, vertical and horizontal limbs of the diagonal band, and nucleus basalis) with our viral injections. All our axonal imaging data comes from visual cortex and given the sensory modality-selectivity of cholinergic projections to cortex, the labeled axons originate from medial septum and the diagonal bands (Kim et al., 2016). We have now added the labels for basal forebrain subregions targeted next to the injection coordinates in the manuscript.
- Page 43, Line 818: The journal name of the cited paper Collins et al. is missing.
Fixed.
- In the optogenetic experiments, how long is the inter-trial interval? Simulation of BF is known to have long-lasting effects on cortical activity and plasticity. It is, therefore, important to have a sufficient interval between trials.
The median inter-trial interval for different stimulation events are as follows:
Optogenetic stimulation only : 15 s
Optogenetic stimulation + grating : 12 s
Optogenetic stimulation + mismatch: 35 s
Optogenetic stimulation + locomotion onset: 45 s
We have added this information to the methods in the manuscript.
Assuming locomotion is the primary driver of acetylcholine release (as we argue in Figures 1 and 2), the frequency of stimulation roughly corresponds to the frequency of acetylcholine release experienced endogenously. It is of course possible that being awake and mobile puts the entire system in a longlasting acetylcholine driven state different from what would be observed during long-term quite wakefulness or during sleep. But the main focus of the optogenetic stimulation experiments we performed was to investigate the consequences of the rapid acetylcholine release driven by locomotion.
- Page 11, Line 313: "..., we cannot exclude the possibility of a systemic contribution to the effects we observe through shared projections between different cortical and subcortical target." This possibility can be tested by examining the effect of optogenetic stimulation of cholinergic axons on locomotor activity, as they did for the chemogenetic experiments (Fig. S7). If the optogenetic manipulation changes locomotor activity, it is likely that this manipulation has some impact on subcortical activity and systemic contribution to the changes in cortical responses observed.
Based on the reviewer suggestion we tested this and found no change in the locomotor activity of the mice on optogenetic stimulation of cholinergic axons locally in visual cortex (we have added this as Figure S5 to the manuscript). Please note however, we can of course not exclude a systemic contribution based on this.
- Fig. 4 and 5: In a closed-loop configuration, L2/3 neurons exhibit a transient increase in response at the onset of locomotion, while in an open-loop configuration, their response is more prolonged. On the other hand, L5 neurons show a sustained response in both configurations. Do the authors have any speculation on this difference?
This is correct. Locomotion onset responses in layer 2/3 are strongly modulated by whether the locomotion onset occurs in closed loop or open loop configurations (Widmer et al., 2022). This difference is absent in our layer 5 data here. We suspect this is a function of a differential within-layer cell type bias in the different recordings. In the layer 2/3 recordings we are likely biased strongly towards superficial L2/3 neurons that tend to be negative prediction error neurons (top-down excited and bottom-up inhibited), see e.g. (O’Toole et al., 2023). A reduction of locomotion onset responses in closed loop is what one would expect for negative prediction error neurons. While layer 5 neurons exhibit mismatch responses, they do not exhibit opposing top-down and bottom-up input that would result in such a suppression (Jordan and Keller, 2020).
We can illustrate this by splitting all layer 2/3 neurons based on their response to gratings and to visuomotor mismatch into a positive prediction error (PE) type (top 30% positive grating response), a negative prediction error type (top 30% positive visuomotor mismatch response), and the rest (remaining neurons and neurons responsive to both grating and visuomotor mismatch). Plotting the response of these neurons to locomotion onset in closed loop and open loop, we find that negative PE neurons have a transient response to locomotion onset in closed loop while positive PE neurons have a sustained increase in response in closed loop. In open loop the response of the two populations is indistinguishable. Splitting the layer 5 neurons using the same criteria, we don’t find a striking difference between closed and open loop between the two groups of neurons. We have added this as Figure S8.
Reviewer #2 (Recommendations For The Authors):
Major concerns:
- As a ubiquitous promoter was used to drive GCaMP expression, please explain how excitatory neurons were identified.
- As the data cover a very small range of running speeds, it is important to confirm that the binary locomotion signal model still applies when mice run at higher speeds - either by selecting recordings where mice have a wider range of running speeds or conducting additional experiments. In addition, please show the running speed tuning of individual axons.
- Please provide a more detailed analysis of the effects of locomotion and cholinergic modulation on visual responses. How does cholinergic modulation affect orientation and direction tuning? Are the effects multiplicative or additive? How does this compare to the effects of locomotion on single neurons?
- To ensure that the analyses in Figure 5 are not confounded by differences in the visual stimulus, please include average visual flow speed traces for each condition.
- Please clarify why chemogenetic manipulations of cholinergic inputs had no effect on pairwise correlations in L2/3.
- The latency effect is quite an extraordinary claim and requires careful analysis. Please provide examples of single neurons illustrating the latency effect - including responses across individual grating orientations/directions. One possible confound is that grating presentation could itself trigger locomotion or other movements. In the stationary / noOpto conditions, the grating response might not be apparent in the average trace until the animal begins to move. Thus the large latency in the stationary / noOpto conditions may reflect movement-related rather than visual responses.
Please see our responses to these points in the public review part above.
There are some minor points where text and figures could be improved:
- When discussing the decorrelation of neuronal responses by cholinergic axon activation, it is important to make it clear that Figure 6D quantifies the responses of layer 5 apical dendrites rather than neurons.
We have added this information to the results section.
- In Figure S7, please clarify why velocity is in arbitrary units.
This was an oversight and has been fixed.
- Please clarify how locomotion and stational trials are selected in Figure 4.
We thank the reviewers for pointing this out. Trials were classified as occurring during locomotion or while mice were stationary as follows. We used a time-window of -0.5 s to +1 s around stimulus onset. If mice exhibited uninterrupted locomotion above a threshold of 0.25 cm/s in this time-window, we considered the stimulus as occurring during locomotion, otherwise it was defined as occurring while the mice were stationary. Note, the same criteria to define locomotion state was used to isolate visuomotor mismatch events, and also during control optogenetic stimulation experiments. We have added this information to the methods.
- When testing whether cholinergic activation is sufficient to explain locomotion-induced decorrelation in Figure 6G-H, please show pre-CNO and post-CNO delta-correlation, not just their difference.
We can do that, but the results are harder to parse this way. We have added this as Figure S11 to the manuscript. The problem with parsing the figure is that the pre-CNO levels are different in different groups. This is likely a function of mouse-to-mouse variability and makes it harder to identify what the CNO induced changes are. Using the pre-post difference removes the batch influence. Hence, we have left this as the main analysis in Figure 6G and 6H.
-
eLife assessment
This important study by Yogesh and Keller provides a set of results describing the response properties of cholinergic input and its functional impacts in the mouse visual cortex. They found that cholinergic inputs are elevated by locomotion in a binary manner regardless of locomotor speeds, and activation of cholinergic input differently modulated the activity of Later 2/3 and Layer 5 visual cortex neurons induced by bottom-up (visual stimuli) and top-down (visuomotor mismatch) inputs. The reviewers found that the experiments are cutting-edge and well executed, and the results to be mostly convincing.
-
Reviewer #1 (Public Review):
The paper submitted by Yogesh and Keller explores the role of cholinergic input from the basal forebrain (BF) in the mouse primary visual cortex (V1). The study aims to understand the signals conveyed by BF cholinergic axons in the visual cortex, their impact on neurons in different cortical layers, and their computational significance in cortical visual processing. The authors employed two-photon calcium imaging to directly monitor cholinergic input from BF axons expressing GCaMP6 in mice running through a virtual corridor, revealing a strong correlation between BF axonal activity and locomotion. This persistent activation during locomotion suggests that BF input provides a binary locomotion state signal. To elucidate the impact of cholinergic input on cortical activity, the authors conducted optogenetic …
Reviewer #1 (Public Review):
The paper submitted by Yogesh and Keller explores the role of cholinergic input from the basal forebrain (BF) in the mouse primary visual cortex (V1). The study aims to understand the signals conveyed by BF cholinergic axons in the visual cortex, their impact on neurons in different cortical layers, and their computational significance in cortical visual processing. The authors employed two-photon calcium imaging to directly monitor cholinergic input from BF axons expressing GCaMP6 in mice running through a virtual corridor, revealing a strong correlation between BF axonal activity and locomotion. This persistent activation during locomotion suggests that BF input provides a binary locomotion state signal. To elucidate the impact of cholinergic input on cortical activity, the authors conducted optogenetic and chemogenetic manipulations, with a specific focus on L2/3 and L5 neurons. They found that cholinergic input modulates the responses of L5 neurons to visual stimuli and visuomotor mismatch, while not significantly affecting L2/3 neurons. Moreover, the study demonstrates that BF cholinergic input leads to decorrelation in the activity patterns of L2/3 and L5 neurons.
This topic has garnered significant attention in the field, drawing the interest of many researchers actively investigating the role of BF cholinergic input in cortical activity and sensory processing. The experiments and analyses were thoughtfully designed and conducted with rigorous standards, leading to convincing results which align well with findings in previous studies. In other words, some of the main findings, such as the correlation between cholinergic input and locomotor activity and the effects of cholinergic input on V1 cortical activity, have been previously demonstrated by other labs (Goard and Dan, 2009; Pinto et al., 2013; Reimer et al., 2016). However, the study by Yogesh and Keller stands out by combining cutting-edge calcium imaging and optogenetics to provide compelling evidence of layer-specific differences in the impact of cholinergic input on neuronal responses to bottom-up (visual stimuli) and top-down inputs (visuomotor mismatch).
-
Reviewer #2 (Public Review):
The manuscript investigates the function of basal forebrain cholinergic axons in mouse primary visual cortex (V1) during locomotion using two-photon calcium imaging in head-fixed mice. Cholinergic modulation has previously been proposed to mediate the effects of locomotion on V1 responses. The manuscript concludes that the activity of basal forebrain cholinergic axons in visual cortex provides a signal which is more correlated with binary locomotion state than locomotion velocity of the animal. Cholinergic axons did not seem to respond to grating stimuli or visuomotor prediction error. Optogenetic stimulation of these axons increased the amplitude of responses to visual stimuli and decreased the response latency of layer 5 excitatory neurons, but not layer 2/3 neurons. Moreover, optogenetic or chemogenetic …
Reviewer #2 (Public Review):
The manuscript investigates the function of basal forebrain cholinergic axons in mouse primary visual cortex (V1) during locomotion using two-photon calcium imaging in head-fixed mice. Cholinergic modulation has previously been proposed to mediate the effects of locomotion on V1 responses. The manuscript concludes that the activity of basal forebrain cholinergic axons in visual cortex provides a signal which is more correlated with binary locomotion state than locomotion velocity of the animal. Cholinergic axons did not seem to respond to grating stimuli or visuomotor prediction error. Optogenetic stimulation of these axons increased the amplitude of responses to visual stimuli and decreased the response latency of layer 5 excitatory neurons, but not layer 2/3 neurons. Moreover, optogenetic or chemogenetic stimulation of cholinergic inputs reduced pairwise correlation of neuronal responses. These results provide insight into the role of cholinergic modulation to visual cortex and demonstrate that it affects different layers of visual cortex in a distinct manner. The experiments are well executed and the data appear to be of high quality. However, further analyses are required to fully support some of the study's conclusions.
The manuscript concludes that cholinergic axons convey a binary locomotion signal and are not tuned to running speed. Getting head-fixed animals to run at the speeds typical of freely moving animals can require training, which was not undertaken in this study. Consequently, the typically low running velocity of mice is a potential limitation of this study.
The analyses of the effects of locomotion and stimulation of cholinergic inputs present grand averages of responses across all neurons, and therefore may mask heterogeneity across layer 2/3 and layer 5 neurons.
-
-
eLife assessment
Yogesh and Keller provide a set of important results describing the response properties of cholinergic input and its functional impacts in the mouse visual cortex. They found that cholinergic inputs are elevated by locomotion in a binary manner regardless of locomotor speeds, and activation of cholinergic input modulated the activity of visual cortex neurons in a layer dependent manner. The experiments are well executed and the results are relatively convincing although further analyses are required to fully support some conclusions.
-
Reviewer #1 (Public Review):
The paper submitted by Yogesh and Keller explores the role of cholinergic input from the basal forebrain (BF) in the mouse primary visual cortex (V1). The study aims to understand the signals conveyed by BF cholinergic axons in the visual cortex, their impact on neurons in different cortical layers, and their computational significance in cortical visual processing. The authors employed two-photon calcium imaging to directly monitor cholinergic input from BF axons expressing GCaMP6 in mice running through a virtual corridor, revealing a strong correlation between BF axonal activity and locomotion. This persistent activation during locomotion suggests that BF input provides a binary locomotion state signal. To elucidate the impact of cholinergic input on cortical activity, the authors conducted optogenetic …
Reviewer #1 (Public Review):
The paper submitted by Yogesh and Keller explores the role of cholinergic input from the basal forebrain (BF) in the mouse primary visual cortex (V1). The study aims to understand the signals conveyed by BF cholinergic axons in the visual cortex, their impact on neurons in different cortical layers, and their computational significance in cortical visual processing. The authors employed two-photon calcium imaging to directly monitor cholinergic input from BF axons expressing GCaMP6 in mice running through a virtual corridor, revealing a strong correlation between BF axonal activity and locomotion. This persistent activation during locomotion suggests that BF input provides a binary locomotion state signal. To elucidate the impact of cholinergic input on cortical activity, the authors conducted optogenetic and chemogenetic manipulations, with a specific focus on L2/3 and L5 neurons. They found that cholinergic input modulates the responses of L5 neurons to visual stimuli and visuomotor mismatch, while not significantly affecting L2/3 neurons. Moreover, the study demonstrates that BF cholinergic input leads to decorrelation in the activity patterns of L2/3 and L5 neurons.
This topic has garnered significant attention in the field, drawing the interest of many researchers actively investigating the role of BF cholinergic input in cortical activity and sensory processing. The experiments and analyses were thoughtfully designed and conducted with rigorous standards, leading to convincing results which align well with findings in previous studies. In other words, some of the main findings, such as the correlation between cholinergic input and locomotor activity and the effects of cholinergic input on V1 cortical activity, have been previously demonstrated by other labs (Goard and Dan, 2009; Pinto et al., 2013; Reimer et al., 2016). However, the study by Yogesh and Keller stands out by combining cutting-edge calcium imaging and optogenetics to provide compelling evidence of layer-specific differences in the impact of cholinergic input on neuronal responses to bottom-up (visual stimuli) and top-down inputs (visuomotor mismatch).
-
Reviewer #2 (Public Review):
The manuscript investigates the function of basal forebrain cholinergic axons in mouse primary visual cortex (V1) during locomotion using two-photon calcium imaging in head-fixed mice. Cholinergic modulation has previously been proposed to mediate the effects of locomotion on V1 responses. The manuscript concludes that the activity of basal forebrain cholinergic axons in visual cortex provides a signal which is more correlated with binary locomotion state than locomotion velocity of the animal. Cholinergic axons did not seem to respond to grating stimuli or visuomotor prediction error. Optogenetic stimulation of these axons increased the amplitude of responses to visual stimuli and decreased the response latency of layer 5 excitatory neurons, but not layer 2/3 neurons. Moreover, optogenetic or chemogenetic …
Reviewer #2 (Public Review):
The manuscript investigates the function of basal forebrain cholinergic axons in mouse primary visual cortex (V1) during locomotion using two-photon calcium imaging in head-fixed mice. Cholinergic modulation has previously been proposed to mediate the effects of locomotion on V1 responses. The manuscript concludes that the activity of basal forebrain cholinergic axons in visual cortex provides a signal which is more correlated with binary locomotion state than locomotion velocity of the animal. Cholinergic axons did not seem to respond to grating stimuli or visuomotor prediction error. Optogenetic stimulation of these axons increased the amplitude of responses to visual stimuli and decreased the response latency of layer 5 excitatory neurons, but not layer 2/3 neurons. Moreover, optogenetic or chemogenetic stimulation of cholinergic inputs reduced pairwise correlation of neuronal responses. These results provide insight into the role of cholinergic modulation to visual cortex and demonstrate that it affects different layers of visual cortex in a distinct manner. The experiments are well executed and the data appear to be of high quality. However, further analyses are required to fully support several of the study's conclusions.
In experiments analysing the activity of V1 neurons, GCaMP6f was expressed using a ubiquitous Ef1a promoter, which is active in all neuronal cell types as well as potentially non-neuronal cells. The manuscript specifically refers to responses of excitatory neurons but it is unclear how excitatory neuron somata were identified and distinguished from that of inhibitory neurons or other cell types.
The manuscript concludes that cholinergic axons convey a binary locomotion signal and are not tuned to running speed. The average running velocity of mice in this study is very slow - slower than 15 cm/s in the example trace in Figure 1D and speeds <6 cm/s were quantified in Figure 2E. However, mice can run at much faster speeds both under head-fixed and freely moving conditions (see e.g. Jordan and Keller, 2020, where example running speeds are ~35 cm/s). Given that the data in the present manuscript cover such a narrow range of running speeds, it is not possible to determine whether cholinergic axons are tuned to running speed or convey a binary locomotion signal.
The analyses in Figure 4 only consider the average response to all grating orientations and directions. Without further analysing responses to individual grating directions it is unclear how stimulation of cholinergic inputs affects visual responses. Previous work (e.g. Datarlat and Stryker, 2017) has shown that locomotion can have both additive and multiplicative effects and it would be valuable to determine the type of modulation provided by cholinergic stimulation.
The difference between the effects of locomotion and optogenetic stimulation of cholinergic axons in Figure 5 may be confounded by differences in the visual stimulus. These experiments are carried out under open-loop conditions, where mice may adapt their locomotion based on the speed of the visual stimulus. Consequently, locomotion onsets are likely to occur during periods of higher visual flow. Since optogenetic stimulation is presented randomly, it is likely to occur during periods of lower visual flow speed. Consequently, the difference between the effect of locomotion and optogenetic stimulation may be explained by differences in visual flow speed and it is important to exclude this possibility.
It is unclear why chemogenetic manipulations of cholinergic inputs had no effect on pairwise correlations of L2/3 neuronal responses while optogenetic stimulation did.
The effects of locomotion and optogenetic stimulation on the latency of L5 responses in Figure 7 are very large - ~100 ms. Indeed, typical latencies in mouse V1 measured using electrophysiology are themselves shorter than 100 ms (see e.g. Durand et al., 2016). Visual response latencies in stationary conditions or without optogenetic stimulation appear surprisingly long - much longer than reported in previous studies even under anaesthesia. Such large and surprising results require careful analysis to ensure they are not confounded by artefacts. However, as in Figure 4, this analysis is based only on average responses across all gratings and no individual examples are shown.
-
