Automated cell annotation in multi-cell images using an improved CRF_ID algorithm
Curation statements for this article:-
Curated by eLife

eLife Assessment
This Research Advance describes a valuable image analysis method to identify individual neurons within a population of fluorescently labeled cells in the nematode C. elegans. The findings are solid and the method succeeds to identify cells with high precision. The method will be be of interest to the C. elegans research community.
This article has been Reviewed by the following groups
Discuss this preprint
Start a discussion What are Sciety discussions?Listed in
- Evaluated articles (eLife)
Abstract
Cell identification is an important yet difficult process in data analysis of biological images. Previously, we developed an automated cell identification method called CRF_ID and demonstrated its high performance in Caenorhabditis elegans whole-brain images (Chaudhary et al., 2021). However, because the method was optimized for whole-brain imaging, comparable performance could not be guaranteed for application in commonly used C. elegans multi-cell images that display a subpopulation of cells. Here, we present an advancement, CRF_ID 2.0, that expands the generalizability of the method to multi-cell imaging beyond whole-brain imaging. To illustrate the application of the advance, we show the characterization of CRF_ID 2.0 in multi-cell imaging and cell-specific gene expression analysis in C. elegans . This work demonstrates that high-accuracy automated cell annotation in multi-cell imaging can expedite cell identification and reduce its subjectivity in C. elegans and potentially other biological images of various origins.
Article activity feed
-

-
-
-

Author Response
The following is the authors’ response to the previous reviews.
Public Reviews:
Reviewer #1 (Public Review):
In this paper, the authors developed an image analysis pipeline to automacally idenfy individual neurons within a populaon of fluorescently tagged neurons. This applicaon is opmized to deal with mul-cell analysis and builds on a previous soware version, developed by the same team, to resolve individual neurons from whole-brain imaging stacks. Using advanced stascal approaches and several heuriscs tailored for C. elegans anatomy, the method successfully idenfies individual neurons with a fairly high accuracy. Thus, while specific to C. elegans, this method can become instrumental for a variety of research direcons such as in-vivo single-cell gene expression analysis and calcium-based neural acvity studies.
Tha…
Author Response
The following is the authors’ response to the previous reviews.
Public Reviews:
Reviewer #1 (Public Review):
In this paper, the authors developed an image analysis pipeline to automacally idenfy individual neurons within a populaon of fluorescently tagged neurons. This applicaon is opmized to deal with mul-cell analysis and builds on a previous soware version, developed by the same team, to resolve individual neurons from whole-brain imaging stacks. Using advanced stascal approaches and several heuriscs tailored for C. elegans anatomy, the method successfully idenfies individual neurons with a fairly high accuracy. Thus, while specific to C. elegans, this method can become instrumental for a variety of research direcons such as in-vivo single-cell gene expression analysis and calcium-based neural acvity studies.
Thank you.
Reviewer #2 (Public Review):
The authors succeed in generalizing the pre-alignment procedure for their cell idenficaon method to allow it to work effecvely on data with only small subsets of cells labeled. They convincingly show that their extension accurately idenfies head angle, based on finding auto florescent ssue and looking for a symmetric l/r axis. They demonstrate method works to allow the idenficaon of a parcular subset of neurons. Their approach should be a useful one for researchers wishing to idenfy subsets of head neurons in C. elegans, and the ideas might be useful elsewhere.
The authors also assess the relave usefulness of several atlases for making identy predicons. They atempt to give some addional general insights on what makes a good atlas, but here insights seem less clear as available data does not allow for experiments that cleanly decouple: 1. the number of examples in the atlas 2. the completeness of the atlas. and 3. the match in strain and imaging modality discussed. In the presented experiments the custom atlas, besides the strain and imaging modality mismatches discussed is also the only complete atlas with more than one example. The neuroPAL atlas, is an imperfect stand in, since a significant fracon of cells could not be idenfied in these data sets, making it a 60/40 mix of Openworm and a hypothecal perfect neuroPAL comparison. This waters down general insights since it is unclear if the performance is driven by strain/imaging modality or these difficules creang a complete neuroPal atlas. The experiments do usefully explore the volume of data needed. Though generalizaon remains to be shown the insight is useful for future atlas building that for the specific (small) set of cells labeled in the experiments 5-10 examples is sufficient to build a accurate atlas.
The reviewer brings up an interesting point. As the reviewer noted, given the imperfection of the datasets (ours and others’), it is possible that artifacts from incomplete atlases can interfere with the assessment of the performances of different atlases. To address this, as the reviewer suggested, we have searched the literature and found two sets of data that give specific coordinates of identified neurons (both using NeuroPAL). We compared the performance of the atlases derived from these datasets to the strain-specific atlases, and the original conclusion stands. Details are now included in the revised manuscript (Figure 3- figure supplement 2).
Recommendaons for the authors:
Reviewer #1 (Recommendaons For The Authors):
I appreciate the new mosaic analysis (Fig. 3 -figure suppl 2). Please fix the y-axis ck label that I believe should be 0.8 (instead of 0.9).
We thank the reviewer for spotting the typo. We have fixed the error.
**Reviewer #2 (Recommendaons For The Authors):
Though I'm not familiar with the exact quality of GT labels in available neuroPAL data I know increasing volumes of published data is available. Comparison with a complete neuroPAL atlas, and a similar assessment on atlas size as made with the custom atlas would to my mind qualitavely increase the general insights on atlas construcon.
We thank the reviewer for the insightful suggestion. We have newly constructed several other NeuroPAL atlases by incorporating neuron positional data from two other published data: [Yemini E. et al. NeuroPAL: A Multicolor Atlas for Whole-Brain Neuronal Identification in C. elegans. Cell. 2021 Jan 7;184(1):272-288.e11] and [Skuhersky, M. et al. Toward a more accurate 3D atlas of C. elegans neurons. BMC Bioinformatics 23, 195 (2022)].
Interestingly, we found that the two new atlases (NP-Yemini and NP-Skuhersky) have significantly different values of PA, LR, DV, and angle relationships for certain cells compared to the OpenWorm and glr-1 atlases. For example, in both the NP atlases, SMDD is labeled as being anterior to AIB, which is the opposite of the SMDD-AIB relationship in the glr-1 atlas.
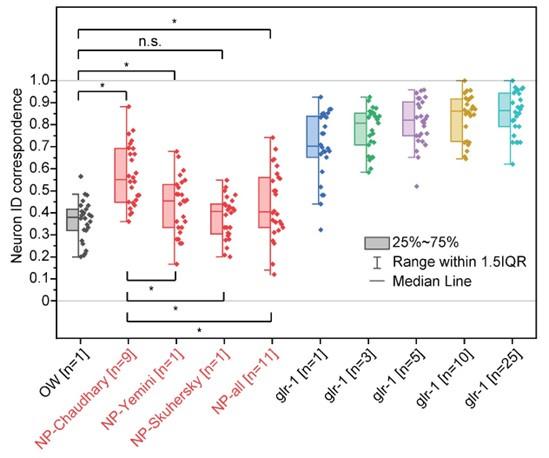
Because this relationship (and other similar cases) were missing in our original NeuroPAL atlas (NP-Chaudhary), the addition of these two NeuroPAL datasets to our NeuroPAL atlas dramatically changed the atlas. As a result, incorporating the published data sets into the NeuroPAL atlas (NP-all) actually decreased the average prediction accuracy to 44%, while the average accuracy of original NeuroPAL atlas (NP-Chaudhary) was 57%. The atlas based on the Yemini et al. data alone (NP-Yemini) had 43% accuracy, and the atlas based on the Skuhersky et al. data alone (NP-Skuhersky) had 38% accuracy.
For the rest of our analysis, we focused on comparing the NeuroPAL atlas that resulted in the highest accuracy against other atlases in figure 3 (NP-Chaudhary). Therefore, we have added Figure 3- figure supplement 2 and the following sentence in the discussion. “Several other NeuroPAL atlases from different data sources were considered, and the atlas that resulted in the highest neuron ID correspondence was selected (Figure 3- figure supplement 2).”
Author response image 1.
Figure3- figure supplement 2. Comparison of neuron ID correspondences resulng from addional atlases- atlases driven from NeuroPAL neuron posional data from mulple sources (Chaudhary et al., Yemini et al., and Skuhersky et al.) in red compared to other atlases in Figure 3. Two sample t-tests were performed for stascal analysis. The asterisk symbol denotes a significance level of p<0.05, and n.s. denotes no significance. OW: atlas driven by data from OpenWorm project, NP-source: NeuroPAL atlas driven by data from the source. NP-Chaudhary atlas corresponds to NeuroPAL atlas in Figure 3.
80% agreement among manual idenficaons seems low to me for a relavely small, (mostly) known set of cells, which seems to cast into doubt ground truth idenes based on a best 2 out of 3 vote. The authors menon 3% of cell idenes had total disagreement and were excluded, what were the fracon unanimous and 2/3? Are there any further insights about what limited human performance in the context of this parcular idenficaon task?
We closely looked into the manual annotation data. The fraction of cells in unanimous, two thirds, and no agreement are approximately 74%, 20%, and 6%, respectively. We made the corresponding change in the manuscript from 3% to 6%. Indeed, we identified certain patterns in labels that were more likely to be disagreed upon. First, cells in close proximity to each other, such as AVE and RMD, were often switched from annotator to annotator. Second, cells in the posterior part of the cluster, such as RIM, AVD, AVB, were more variable in positions, so their identities were not clear at times. Third, annotators were more likely to disagree on cells whose expressions are rare and low, and these include AIB, AVJ, and M1. These observations agree with our results in figure 4c.
-
eLife Assessment
This Research Advance describes a valuable image analysis method to identify individual neurons within a population of fluorescently labeled cells in the nematode C. elegans. The findings are solid and the method succeeds to identify cells with high precision. The method will be be of interest to the C. elegans research community.
-
Reviewer #1 (Public Review):
In this paper, the authors developed an image analysis pipeline to automatically identify individual neurons within a population of fluorescently tagged neurons. This application is optimized to deal with multi-cell analysis and builds on a previous software version, developed by the same team, to resolve individual neurons from whole-brain imaging stacks. Using advanced statistical approaches and several heuristics tailored for C. elegans anatomy, the method successfully identifies individual neurons with a fairly high accuracy. Thus, while specific to C. elegans, this method can become instrumental for a variety of research directions such as in-vivo single-cell gene expression analysis and calcium-based neural activity studies.
-
Reviewer #2 (Public Review):
The authors succeed in generalizing the pre-alignment procedure for their cell identification method to allow it to work effectively on data with only small subsets of cells labeled. They convincingly show that their extension accurately identifies head angle, based on finding auto florescent tissue and looking for a symmetric l/r axis. Their demonstrated method works to allow the identification of a particular subset of neurons. Their approach should be a useful one for researchers wishing to identify subsets of head neurons in C. elegans, and the ideas might be useful elsewhere.
The authors also assess the relative usefulness of several atlases for making identity predictions. They attempt to give some additional general insights on what makes a good atlas, and clearly demonstrate the value of more data. …
Reviewer #2 (Public Review):
The authors succeed in generalizing the pre-alignment procedure for their cell identification method to allow it to work effectively on data with only small subsets of cells labeled. They convincingly show that their extension accurately identifies head angle, based on finding auto florescent tissue and looking for a symmetric l/r axis. Their demonstrated method works to allow the identification of a particular subset of neurons. Their approach should be a useful one for researchers wishing to identify subsets of head neurons in C. elegans, and the ideas might be useful elsewhere.
The authors also assess the relative usefulness of several atlases for making identity predictions. They attempt to give some additional general insights on what makes a good atlas, and clearly demonstrate the value of more data. Some insights seem less clear as available data do not allow for experiments that cleanly decouple: 1) the number of examples in the atlas; 2) the completeness of the atlas; and 3) the match in strain and imaging modality discussed. In the presented experiments the custom atlas, besides the strain and imaging modality congruence discussed is also the only complete atlas with more than one example. The main neuroPAL atlas is an imperfect stand-in since a significant fraction of cells could not be identified in these data sets, making it a 60/40 mix of Openworm and a hypothetical perfect neuroPAL comparison. The alternate neuroPal atlases shown in supplemental figure 4 are complete but provide only one point cloud.
It is striking that in the best available apples to apples match the single data set glr-1 atlas produces qualitatively better results than the single (complete) neuroPAL atlas. This is a clear performance advantage given the ground truth. This is as good an evaluation as is possible given current data however given the inexact nature of assigning ground truth identities I think it is difficult from results to tease out if this is due to strain, imaging conditions or systematically different identifications of cells from different sources.
The experiments do usefully explore the volume of data needed. Though generalization to other arbitrary cell subsets remains to be shown the insight is useful for future atlas building that for the specific (small) set of cells labeled in the experiments 5-10 examples is sufficient to build an accurate atlas.
-
-
Author Response
The following is the authors’ response to the original reviews.
eLife assessment
This research advance arctile describes a valuable image analysis method to identify individual cells (neurons) within a population of fluorescently labeled cells in the nematode C. elegans. The findings are solid and the method succeeds to identify cells with high precision. The method will be valuable to the C. elegans research community.
Public Reviews:
Reviewer #1 (Public Review):
In this paper, the authors developed an image analysis pipeline to automatically identify individual neurons within a population of fluorescently tagged neurons. This application is optimized to deal with multi-cell analysis and builds on a previous software version, developed by the same team, to resolve individual neurons from whole-brain imaging …
Author Response
The following is the authors’ response to the original reviews.
eLife assessment
This research advance arctile describes a valuable image analysis method to identify individual cells (neurons) within a population of fluorescently labeled cells in the nematode C. elegans. The findings are solid and the method succeeds to identify cells with high precision. The method will be valuable to the C. elegans research community.
Public Reviews:
Reviewer #1 (Public Review):
In this paper, the authors developed an image analysis pipeline to automatically identify individual neurons within a population of fluorescently tagged neurons. This application is optimized to deal with multi-cell analysis and builds on a previous software version, developed by the same team, to resolve individual neurons from whole-brain imaging stacks. Using advanced statistical approaches and several heuristics tailored for C. elegans anatomy, the method successfully identifies individual neurons with a fairly high accuracy. Thus, while specific to C. elegans, this method can become instrumental for a variety of research directions such as in-vivo single-cell gene expression analysis and calcium-based neural activity studies.
The analysis procedure depends on the availability of an accurate atlas that serves as a reference map for neural positions. Thus, when imaging a new reporter line without fair prior knowledge of the tagged cells, such an atlas may be very difficult to construct. Moreover, usage of available reference atlases, constructed based on other databases, is not very helpful (as shown by the authors in Fig 3), so for each new reporter line a de-novo atlas needs to be constructed.
We thank the reviewer for pointing out a place where we can use some clarification. While in principle that every new reporter line would need fair prior knowledge, atlases are either already available or not difficult to construct. If one can make the assumption that the anatomy of a particular line is similar to existing atlases (Yemini 2021,Nejatbakhsh 2023,Toyoshima 2020), the cell ID can be immediately performed. Even in the case that one suspects the anatomy may have changes from existing atlases (e.g. in the case of examining mutants), existing atlases can serve as a starting point to provide a draft ID, which facilitates manual annotation. Once manual annotations on ~5 animals are available as we have shown in this work (which is a manageable number in practice), this new dataset can be used to build an updated atlas that can be used for future inferences. We have added this discussion in the manuscript: “If one determines that the anatomy of a particular animal strain is substantially different from existing atlases, new atlases can be easily constructed using existing atlases as starting points.” (page 18).
I have a few comments that may help to better understand the potential of the tool to become handy.
- I wonder the degree by which strain mosaicism affects the analysis (Figs 1-4) as it was performed on a non-integrated reporter strain. As stated, for constructing the reference atlas, the authors used worms in which they could identify the complete set of tagged neurons. But how senstiive is the analysis when assaying worms with different levels of mosaicism? Are the results shown in the paper stem from animals with a full neural set expression? Could the authors add results for which the assayed worms show partial expression where only 80%, 70%, 50% of the cells population are observed, and how this will affect idenfication accuracy? This may be important as many non-integrated reporter lines show high mosaic patterns and may therefore not be suitable for using this analytic method. In that sense, could the authors describe the mosaic degree of their line used for validating the method.
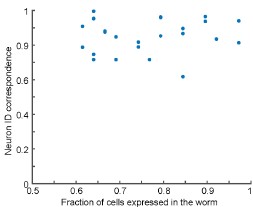
We appreciate the reviewer for this comment. We want to clarify that most of the worms used in the construction of the atlas are indeed affected by mosaicism and thus do not express the full set of candidate neurons. We have added such a plot as requested (Figure 3 – figure supplement 2, copied below). Our data show that there is no correlation between the fraction of cells expressed in a worm and neuron ID correspondence. We agree with the reviewer this additional insight may be helpful; we have modified the text to include this discussion: “Note that we observed no correlation between the degree of mosaicism and neuron ID correspondence (Figure 3- figure supplement 2).” (page 10).
Author response image 1.
No correlation between the degree of mosaicism (fraction of cells expressed in the worm) and neuron ID correspondence.
- For the gene expression analysis (Fig 5), where was the intensity of the GFP extracted from? As it has no nuclear tag, the protein should be cytoplasmic (as seen in Fig 5a), but in Fig 5c it is shown as if the region of interest to extract fluorescence was nuclear. If fluorescence was indeed extracted from the cytoplasm, then it will be helpful to include in the software and in the results description how this was done, as a huge hurdle in dissecting such multi-cell images is avoiding crossreads between adjacent/intersecting neurons.
For this work, we used nuclear-localized RFP co-expressed in the animal, and the GFP intensities were extracted from the same region RFP intensities were extracted. If cytosolic reporters are used, one would imagine a membrane label would be necessary to discern the border of the cells. We clarified our reagents and approach in the text: “The segmentation was done on the nuclear-localized mCherry signals, and GFP intensities were extracted from the same region.” (page21).
- In the same mater: In the methods, it is specified that the strain expressing GCAMP was also used in the gene expression analysis shown in Figure 5. But the calcium indicator may show transient intensities depending on spontaneous neural activity during the imaging. This will introduce a significant variability that may affect the expression correlation analysis as depicted in Figure 5.
We apologize for the error in text. The strain used in the gene expression analysis did not express GCaMP. We did not analyze GCaMP expression in figure 5. We have corrected the error in the methods.
Reviewer #2 (Public Review):
The authors succeed in generalizing the pre-alignment procedure for their cell idenfication method to allow it to work effectively on data with only small subsets of cells labeled. They convincingly show that their extension accurately identifies head angle, based on finding auto fluorescent tissue and looking for a symmetric l/r axis. They demonstrate that the method works to identify known subsets of neurons with varying accuracy depending on the nature of underlying atlas data. Their approach should be a useful one for researchers wishing to identify subsets of head neurons in C. elegans, for example in whole brain recording, and the ideas might be useful elsewhere.
The authors also strive to give some general insights on what makes a good atlas. It is interesting and valuable to see (at least for this specific set of neurons) that 5-10 ideal examples are sufficient. However, some critical details would help in understanding how far their insights generalize. I believe the set of neurons in each atlas version are matched to the known set of cells in the sparse neuronal marker, however this critical detail isn't explicitly stated anywhere I can see.
This is an important point. We have made text modifications to make it clear to the readers that for all atlases, the number of entities (candidate list) was kept consistent as listed in the methods. In the results section under “CRF_ID 2.0 for automatic cell annotation in multi-cell images,” we added the following sentence: “Note that a truncated candidate list can be used for subse-tspecific cell ID if the neuronal expression is known” (page 3). In the methods section, we added the following sentence: “For multi-cell neuron predictions on the glr-1 strain, a truncated atlas containing only the above 37 neurons was used to exclude neuron candidates that are irrelevant for prediction” (Page 20).
In addition, it is stated that some neuron positions are missing in the neuropal data and replaced with the (single) position available from the open worm atlas. It should be stated how many neurons are missing and replaced in this way (providing weaker information).
We modified the text in the result section as follows: “Eight out of 37 candidate neurons are missing in the neuroPAL atlas, which means 40% of the pairwise relationships of neurons expressing the glr-1p::NLS-mcherry transgene were not augmented with the NeuroPAL data but were assigned the default values from the OpenWorm atlas” (page 10).
It also is not explicitly stated that the putative identities for the uncertain cells (designated with Greek letters) are used to sample the neuropal data. Large numbers of openworm single positions or if uncertain cells are misidentified forcing alignment against the positions of nearby but different cells would both handicap the neuropal atlas relative to the matched florescence atlas. This is an important question since sufficient performance from an ideal neuropal atlas (subsampled) would avoid the need for building custom atlases per strain.
The putative identities are not used to sample the NeuroPAL data. They were used in the glr-1 multi-cell case to indicate low confidence in manual identification/annotation. For all steps of manual annotation and CRF_ID predictions, we used real neuron labels, and the Greek labels were used for reporting purposes only. It is true that the OpenWorm values (40% of the atlas) would be a handicap for the neuroPAL atlas. This is mainly due to the difficulty of obtaining NeuroPAL data as it requires 3-color fluorescence microscopy and significant time and labor to annotate the large set of neurons. This is one reason to take a complementary approach as we do in this paper.
Reviewer #1 (Recommendations For The Authors):
- Figure 3, there is a confusion in the legend relating to panels c-e (e.g. panel c is neuron ID accuracy but it is described per panel e in the legend.
We made the necessary changes.
- Figure 3, were statistical tests performed for panels d-e? if so, and the outcome was not significant, then it might be good to indicate this in the legend.
We have added results of statistical tests in the legend as the following sentence: “All distributions in panel d and e had a p-value of less than 0.0001 for one sample t-test against zero.” One sample t-tests were performed because what is plotted already represents each atlas’ differences to the glr-1 25 dataset atlas, we didn’t think the statistical analyses between the other atlases would add significant value.
- Figure 4, no asterisks are shown in the figure so it is possible to remove the sentence in the legend describing what the asterisk stands for.
Thank you. We made the necessary changes.
Reviewer #2 (Recommendations For The Authors):
Comparison with deep learning approaches could be more nuanced and structured, the authors (prior) approach extended here combines a specific set of comparative relationship measurements with a general optimization approach for matching based on comparative expectations. Other measurements could be used whether explicit (like neighbor expectations) or learned differences in embeddings. These alternate measurements would both need to be extensively re-calibrated for different sets of cells but might provide significant performance gains. In addition deep learning approaches don't solve the optimization part of the matching problem, so the authors approach seems to bring something strong to the table even if one is committed to learned methods (necessary I suspect for human level performance in denser cell sets than the relatively small number here). A more complete discussion of these themes might better frame the impact of the work and help readers think about the advantages and disadvantages or different methods for their own data.
We thank the reviewer for bringing up this point. We apologize perhaps not making the point clearer in the original submission. This extension of the original work (Chaudhary et al) is not changing the CRF-based framework, but only augmenting the approach with a better defined set of axes (solely because in multicell and not whole-brain datasets, the sparsity of neurons degrades the axis definition and consequently the neuron ID predictions). We are not fundamentally changing the framework, and therefore all the advantages (over registration-based approaches for example) also apply here. The other purpose of this paper is to demonstrate a couple of use-cases for gene expression analysis, which is common in studies in C. elegans (and other organisms). We hope that by showing a use-case others can see how this approach is useful for their own applications.
We have clarified these points in the paper (page 18). “The fundamental framework has not been changed from CRF_ID 1.0, and therefore the advantages of CRF_ID outlined in the original work apply for CRF_ID 2.0 as well.”
The atribution of anatomical differences to strain is interesting, but seems purely speculative, and somewhat unlikely. I would suspect the fundamentally more difficult nature of aligning N items to M>>N items in an atlas accounts for the differences in using the neuroPAL vs custom atlas here. If this is what is meant, it could be stated more clearly.
It is important to note that the same neuron candidate list (listed in methods) was used for all atlases, so there is no difference among the atlases in terms of the number of cells in the query vs. candidate list. In other words, the same values for M and for N are used regardless of the reference atlas used.
We have preliminary data indicating differences between the NeuroPAL and custom atlas. For instance, the NeuroPAL atlas scales smaller than the custom glr-1 atlas. Since direct comparisons of the different atlases are beyond the scope of this paper, we will leave the exact comparisons for future work. We suspect that the differences are from a combination of differences in anatomy and imaging conditions. While NeuroPAL atlas may not be exactly fitting for the custom dataset, it can serve as a good starting point for guesses when no custom atlases are available, as we have discussed earlier (response to Public Comments from Reviewer 1 Point 1). As explained earlier, we have added these discussions in the paper (see page 18).
I was also left wondering if the random removal of landmarks had to be adjusted in this work given it is (potentially) helping cope with not just occasional weak cells but the systematic loss of most of the cells in the atlas. If the parameters of this part of the algorithm don't influence the success for N to M>>N alignment (here when the neuroPAL or OpenWorm atlas is used) this seems interesting in itself and worth discussing. Conversely, if these parameters were opitmized for the matched atlas and used for the others, this would seem to bias performance results.
We may have failed to make this clear in the main text. As we have stated in our responses in the public review section, we do systematically limit the neuron labels in the candidate list to neurons that are known to be expressed by the promotor. The candidate list, which is kept consistent for all atlases, has more neurons than cells in the query, so it is always an N-to-M matching where M>N. We did not use landmarks, but such usage is possible and will only improve the matching.
We have attempted to clarify these points in the manuscript. In the results section under “CRF_ID 2.0 for automatic cell annotation in multi-cell images,” we added the following sentence: “Note that a truncated candidate list can be used for subset-specific cell ID if the neuronal expression is known” (page 3). In the methods section, we added the following sentence: “For multi-cell neuron predictions on the glr-1 strain, a truncated atlas containing only the above 37 neurons was used to exclude neuron candidates that are irrelevant for prediction” (Page 20).
-
eLife assessment
This research advance article describes a valuable image analysis method to identify individual cells (neurons) within a population of fluorescently labeled cells in the nematode C. elegans. The findings are solid and the method succeeds to identify cells with high precision. The method will be valuable to the C. elegans research community.
-
Reviewer #1 (Public Review):
In this paper, the authors developed an image analysis pipeline to automatically identify individual neurons within a population of fluorescently tagged neurons. This application is optimized to deal with multi-cell analysis and builds on a previous software version, developed by the same team, to resolve individual neurons from whole-brain imaging stacks. Using advanced statistical approaches and several heuristics tailored for C. elegans anatomy, the method successfully identifies individual neurons with a fairly high accuracy. Thus, while specific to C. elegans, this method can become instrumental for a variety of research directions such as in-vivo single-cell gene expression analysis and calcium-based neural activity studies.
-
Reviewer #2 (Public Review):
The authors succeed in generalizing the pre-alignment procedure for their cell identification method to allow it to work effectively on data with only small subsets of cells labeled. They convincingly show that their extension accurately identifies head angle, based on finding auto florescent tissue and looking for a symmetric l/r axis. They demonstrate method works to allow the identification of a particular subset of neurons. Their approach should be a useful one for researchers wishing to identify subsets of head neurons in C. elegans, and the ideas might be useful elsewhere.
The authors also assess the relative usefulness of several atlases for making identity predictions. They attempt to give some additional general insights on what makes a good atlas, but here insights seem less clear as available data …
Reviewer #2 (Public Review):
The authors succeed in generalizing the pre-alignment procedure for their cell identification method to allow it to work effectively on data with only small subsets of cells labeled. They convincingly show that their extension accurately identifies head angle, based on finding auto florescent tissue and looking for a symmetric l/r axis. They demonstrate method works to allow the identification of a particular subset of neurons. Their approach should be a useful one for researchers wishing to identify subsets of head neurons in C. elegans, and the ideas might be useful elsewhere.
The authors also assess the relative usefulness of several atlases for making identity predictions. They attempt to give some additional general insights on what makes a good atlas, but here insights seem less clear as available data does not allow for experiments that cleanly decouple: 1. the number of examples in the atlas 2. the completeness of the atlas. and 3. the match in strain and imaging modality discussed. In the presented experiments the custom atlas, besides the strain and imaging modality mismatches discussed is also the only complete atlas with more than one example. The neuroPAL atlas, is an imperfect stand in, since a significant fraction of cells could not be identified in these data sets, making it a 60/40 mix of Openworm and a hypothetical perfect neuroPAL comparison. This waters down general insights since it is unclear if the performance is driven by strain/imaging modality or these difficulties creating a complete neuroPal atlas. The experiments do usefully explore the volume of data needed. Though generalization remains to be shown the insight is useful for future atlas building that for the specific (small) set of cells labeled in the experiments 5-10 examples is sufficient to build a accurate atlas.
-
-
eLife assessment
This research advance article describes a valuable image analysis method to identify individual cells (neurons) within a population of fluorescently labeled cells in the nematode C. elegans. The findings are solid and the method succeeds to identify cells with high precision. The method will be valuable to the C. elegans research community.
-
Reviewer #1 (Public Review):
In this paper, the authors developed an image analysis pipeline to automatically identify individual neurons within a population of fluorescently tagged neurons. This application is optimized to deal with multi-cell analysis and builds on a previous software version, developed by the same team, to resolve individual neurons from whole-brain imaging stacks. Using advanced statistical approaches and several heuristics tailored for C. elegans anatomy, the method successfully identifies individual neurons with a fairly high accuracy. Thus, while specific to C. elegans, this method can become instrumental for a variety of research directions such as in-vivo single-cell gene expression analysis and calcium-based neural activity studies.
The analysis procedure depends on the availability of an accurate …
Reviewer #1 (Public Review):
In this paper, the authors developed an image analysis pipeline to automatically identify individual neurons within a population of fluorescently tagged neurons. This application is optimized to deal with multi-cell analysis and builds on a previous software version, developed by the same team, to resolve individual neurons from whole-brain imaging stacks. Using advanced statistical approaches and several heuristics tailored for C. elegans anatomy, the method successfully identifies individual neurons with a fairly high accuracy. Thus, while specific to C. elegans, this method can become instrumental for a variety of research directions such as in-vivo single-cell gene expression analysis and calcium-based neural activity studies.
The analysis procedure depends on the availability of an accurate atlas that serves as a reference map for neural positions. Thus, when imaging a new reporter line without fair prior knowledge of the tagged cells, such an atlas may be very difficult to construct. Moreover, usage of available reference atlases, constructed based on other databases, is not very helpful (as shown by the authors in Fig 3), so for each new reporter line a de-novo atlas needs to be constructed.
I have a few comments that may help to better understand the potential of the tool to become handy:
1) I wonder the degree by which strain mosaicism affects the analysis (Figs 1-4) as it was performed on a non-integrated reporter strain. As stated, for constructing the reference atlas, the authors used worms in which they could identify the complete set of tagged neurons. But how sensitive is the analysis when assaying worms with different levels of mosaicism? Are the results shown in the paper stem from animals with a full neural set expression? Could the authors add results for which the assayed worms show partial expression where only 80%, 70%, 50% of the cells population are observed, and how this will affect identification accuracy? This may be important as many non-integrated reporter lines show high mosaic patterns and may therefore not be suitable for using this analytic method. In that sense, could the authors describe the mosaic degree of their line used for validating the method.
- For the gene expression analysis (Fig 5), where was the intensity of the GFP extracted from? As it has no nuclear tag, the protein should be cytoplasmic (as seen in Fig 5a), but in Fig 5c it is shown as if the region of interest to extract fluorescence was nuclear. If fluorescence was indeed extracted from the cytoplasm, then it will be helpful to include in the software and in the results description how this was done, as a huge hurdle in dissecting such multi-cell images is avoiding crossreads between adjacent/intersecting neurons.
- In the same matter: In the methods, it is specified that the strain expressing GCAMP was also used in the gene expression analysis shown in Figure 5. But the calcium indicator may show transient intensities depending on spontaneous neural activity during the imaging. This will introduce a significant variability that may affect the expression correlation analysis as depicted in Figure 5.
- For the gene expression analysis (Fig 5), where was the intensity of the GFP extracted from? As it has no nuclear tag, the protein should be cytoplasmic (as seen in Fig 5a), but in Fig 5c it is shown as if the region of interest to extract fluorescence was nuclear. If fluorescence was indeed extracted from the cytoplasm, then it will be helpful to include in the software and in the results description how this was done, as a huge hurdle in dissecting such multi-cell images is avoiding crossreads between adjacent/intersecting neurons.
-
Reviewer #2 (Public Review):
The authors succeed in generalizing the pre-alignment procedure for their cell identification method to allow it to work effectively on data with only small subsets of cells labeled. They convincingly show that their extension accurately identifies head angle, based on finding auto fluorescent tissue and looking for a symmetric l/r axis. They demonstrate that the method works to identify known subsets of neurons with varying accuracy depending on the nature of underlying atlas data. Their approach should be a useful one for researchers wishing to identify subsets of head neurons in C. elegans, for example in whole brain recording, and the ideas might be useful elsewhere.
The authors also strive to give some general insights on what makes a good atlas. It is interesting and valuable to see (at least for this …
Reviewer #2 (Public Review):
The authors succeed in generalizing the pre-alignment procedure for their cell identification method to allow it to work effectively on data with only small subsets of cells labeled. They convincingly show that their extension accurately identifies head angle, based on finding auto fluorescent tissue and looking for a symmetric l/r axis. They demonstrate that the method works to identify known subsets of neurons with varying accuracy depending on the nature of underlying atlas data. Their approach should be a useful one for researchers wishing to identify subsets of head neurons in C. elegans, for example in whole brain recording, and the ideas might be useful elsewhere.
The authors also strive to give some general insights on what makes a good atlas. It is interesting and valuable to see (at least for this specific set of neurons) that 5-10 ideal examples are sufficient. However, some critical details would help in understanding how far their insights generalize. I believe the set of neurons in each atlas version are matched to the known set of cells in the sparse neuronal marker, however this critical detail isn't explicitly stated anywhere I can see. In addition, it is stated that some neuron positions are missing in the neuropal data and replaced with the (single) position available from the open worm atlas. It should be stated how many neurons are missing and replaced in this way (providing weaker information). It also is not explicitly stated that the putative identities for the uncertain cells (designated with Greek letters) are used to sample the neuropal data. Large numbers of openworm single positions or if uncertain cells are misidentified forcing alignment against the positions of nearby but different cells would both handicap the neuropal atlas relative to the matched florescence atlas. This is an important question since sufficient performance from an ideal neuropal atlas (subsampled) would avoid the need for building custom atlases per strain.
-
