Human-specific lncRNAs contributed critically to human evolution by distinctly regulating gene expression
Curation statements for this article:-
Curated by eLife

eLife Assessment
This valuable study uses tools of population and functional genomics to examine long non-coding RNAs (lncRNAs) in the context of human evolution. Analyses of computationally predicted human-specific lncRNAs and their genomic targets lead to the development of hypotheses regarding the potential roles of these genetic elements in human biology. Compared to previous versions, the conclusions regarding evolutionary acceleration and adaptation have become more solid by more fully taking data and literature on human/chimpanzee genetics and functional genomics into account.
This article has been Reviewed by the following groups
Discuss this preprint
Start a discussion What are Sciety discussions?Listed in
- Evaluated articles (eLife)
Abstract
What genes and regulatory sequences critically differentiate modern humans from apes and archaic humans, which share highly similar genomes but show distinct phenotypes, has puzzled researchers for decades. Previous studies examined species-specific protein-coding genes and related regulatory sequences, revealing that birth, loss, and changes in these genes and sequences drive speciation and evolution. However, investigations of species-specific lncRNA genes and related regulatory sequences, which regulate substantial genes, remain limited. We identified human-specific (HS) lncRNAs from GENCODE-annotated human lncRNAs, predicted their DNA-binding domains (DBDs) and DNA-binding sites (DBSs), analyzed DBS sequences in modern humans (CEU, CHB, and YRI), archaic humans (Altai Neanderthals, Denisovans, and Vindija Neanderthals), and chimpanzees, and investigated how HS lncRNAs and their DBSs have influenced gene expression in archaic and modern humans. Our results suggest that these lncRNAs and DBSs have substantially reshaped gene expression, and this reshaping has evolved continuously from archaic to modern humans, enabling humans to adapt to new environments and lifestyles, promoting brain evolution, and resulting in cross-population differences. The parallel analysis of gene expression in GTEx tissues by HS transcription factors (TFs) and their DBSs indicates that HS lncRNAs have reshaped gene expression in the brain more significantly than HS TFs.
Article activity feed
-

-
-
-

eLife Assessment
This valuable study uses tools of population and functional genomics to examine long non-coding RNAs (lncRNAs) in the context of human evolution. Analyses of computationally predicted human-specific lncRNAs and their genomic targets lead to the development of hypotheses regarding the potential roles of these genetic elements in human biology. Compared to previous versions, the conclusions regarding evolutionary acceleration and adaptation have become more solid by more fully taking data and literature on human/chimpanzee genetics and functional genomics into account.
-
Joint Public Review:
While DNA sequence divergence, differential expression and differential methylation analysis have been conducted between humans and the great apes to study changes that "make us human", the role of lncRNAs and their impact on the human genome and biology has not been fully explored. In this study the authors computationally predict HSlncRNAs as well as their DNA Binding sites using a method they have developed previously and then examine these predicted regions with different types of enrichment analyses. Broadly the analysis are straightforward and after identifying these regions/HSlncRNAs they examined their effects using different external datasets.
Comments on the latest version from Reviewer #2:
I think this is as good as it is going to get, and I do appreciate that the authors are still engaging in good faith …
Joint Public Review:
While DNA sequence divergence, differential expression and differential methylation analysis have been conducted between humans and the great apes to study changes that "make us human", the role of lncRNAs and their impact on the human genome and biology has not been fully explored. In this study the authors computationally predict HSlncRNAs as well as their DNA Binding sites using a method they have developed previously and then examine these predicted regions with different types of enrichment analyses. Broadly the analysis are straightforward and after identifying these regions/HSlncRNAs they examined their effects using different external datasets.
Comments on the latest version from Reviewer #2:
I think this is as good as it is going to get, and I do appreciate that the authors are still engaging in good faith after all these rounds of revision, so I am happy to stop here! I do think the paper is significantly improved from the last time around, and the conclusions have been tempered significantly.
-
Author response:
The following is the authors’ response to the previous reviews
Public Reviews:
Reviewer #2 (Public review):
In this valuable manuscript, Lin et al attempt to examine the role of long non coding RNAs (lncRNAs) in human evolution, through a set of population genetics and functional genomics analyses that leverage existing datasets and tools. Although the methods are incomplete and at times inadequate, the results nonetheless point towards a possible contribution of long non coding RNAs to shaping humans, and suggest clear directions for future, more rigorous study.
Comments on revisions:
I thank the authors for their revision and changes in response to previous rounds of comments. As before, I appreciate the changes made in response to my comments, and I think everyone is approaching this in the spirit of arriving at …
Author response:
The following is the authors’ response to the previous reviews
Public Reviews:
Reviewer #2 (Public review):
In this valuable manuscript, Lin et al attempt to examine the role of long non coding RNAs (lncRNAs) in human evolution, through a set of population genetics and functional genomics analyses that leverage existing datasets and tools. Although the methods are incomplete and at times inadequate, the results nonetheless point towards a possible contribution of long non coding RNAs to shaping humans, and suggest clear directions for future, more rigorous study.
Comments on revisions:
I thank the authors for their revision and changes in response to previous rounds of comments. As before, I appreciate the changes made in response to my comments, and I think everyone is approaching this in the spirit of arriving at the best possible manuscript, but we still have some deep disagreements on the nature of the relevant statistical approach and defining adequate controls. I highlight a couple of places that I think are particularly relevant, but note that given the authors disagree with my interpretation, they should feel free to not respond!
(1) On the subject of the 0.034 threshold, I had previously stated: "I do not agree with the rationale for this claim, and do not agree that it supports the cutoff of 0.034 used below."
In their reply to me, the authors state:
"What we need is a gene number, which (a) indicates genes that effectively differentiate humans from chimpanzees, (b) can be used to set a DBS sequence distance cutoff. Since this study is the first to systematically examine DBSs in humans and chimpanzees, we must estimate this gene number based on studies that identify differentially expressed genes in humans and chimpanzees. We choose Song et al. 2021 (Song et al. Genetic studies of human-chimpanzee divergence using stem cell fusions. PNAS 2021), which identified 5984 differentially expressed genes, including 4377 genes whose differential expression is due to trans-acting differences between humans and chimpanzees. To the best of our knowledge, this is the only published data on trans-acting differences between humans and chimpanzees, and most HS lncRNAs and their DBSs/targets have trans-acting relationships (see Supplementary Table 2). Based on these numbers, we chose a DBS sequence distance cutoff of 0.034, which corresponds to 4248 genes (the top 20%), slightly fewer than 4377."
I have some notes here. First, Agoglia et al, Nature, 2021, also examined the nature of cis vs trans regulatory differences between human and chimps using a very similar set up to Song et al; their Supplementary Table 4 enables the discovery of genes with cis vs trans effects although admittedly this is less straightforward than the Song et al data. Second, I can't actually tell how the 4377 number is arrived at. From Song et al, "Of 4,671 genes with regulatory changes between human-only and chimpanzee-only iPSC lines, 44.4% (2,073 genes) were regulated primarily in cis, 31.4% (1,465 genes) were regulated primarily in trans, and the remaining 1,133 genes were regulated both in cis and in trans (Fig. 2C). This final category was further broken down into a cis+trans category (cis- and transregulatory changes acting in the same direction) and a cis-trans category (cis- and trans-regulatory changes acting in opposite directions)." Even when combining trans-only and cis&trans genes that gives 2,598 genes with evidence for some trans regulation. I cannot find 4,377 in the main text of the Song et al paper.
Elsewhere in their response, the authors respond to my comment that 0.034 is an arbitrary threshold by repeating the analyses using a cutoff of 0.035. I appreciate the sentiment here, but I would not expect this to make any great difference, given how similar those numbers are! A better approach, and what I had in mind when I mentioned this, would be to test multiple thresholds, ranging from, eg,0.05 to 0.01 <DBS dist =0.01 -> 0.034 -> 0.05> at some well-defined step size.
(1) We sincerely thank the reviewer for this critical point. Our initial purpose, based on DBS distances from the human genome to chimpanzee genome and archaic genomes, was that genes with large DBS distances may have contributed more to human evolution. However, our ORA (overrepresentation analysis) explored only genes with large DBS distances (the legend of old Figure 2 was “1256 target genes whose DBSs have the largest distances from modern humans to chimpanzees and Altai Neanderthals are enriched in different Biological Processes GO terms”), with the use of the cutoff (threshold) of 0.034 for defining large distance. The cutoff is not totally unreasonable (as our new results and the following sensitivity analysis indicate), but this approach was indirect and flawed.
(2) We have now performed ORA using two methods. The first uses only DBS distances. Instead of using a cutoff, we now sort genes by DBS distance (human-chimpanzee distances and human-Altai Neanderthal distance, respectively, see Supplementary Table 5) and use the top 25% and bottom 25% of genes to perform ORA. This directly examines whether DBS distances along indicate that genes with large DBS distances contribute more to human evolution than genes with small DBS distances. The second also explores the ASE genes (allele-specific expression, genes undergoing human/chimpanzee-specific regulation in the tetraploid human–chimpanzee hybrid iPS) reported by Agoglia et al. 2021. We select the top 50% and bottom 50% of genes with large and small DBS distances, intersect them with ASE genes from Agoglia et al. 2021 (their Supplementary Table 4), and apply ORA to the intersections. Both the results are that: (a) more GO terms are obtained from genes with large DBS distances, (b) more human evolution-related GO terms are obtained from genes with large DBS distances (Supplementary Table 5,6,7; Figure 2; Supplementary Fig. 15). These results directly suggest that genes with large DBS distances contribute more to human evolution than genes with small DBS distances, which is a key theme of the study.
(3) Regarding Song et al 2021, the statement of “we differentiated…allotetraploid (H1C1a, H1C1b, H2C2a, H2C2b) lines into ectoderm, mesoderm, and endoderm” made us assume that their differentiated hybrid cell lines cover more tissue types than those of Agoglia et al. 2021. Now, upon re-examining Supplementary Table 5 of Song et al. and Supplementary Table 4 of Agoglia et al. 2021, we find that the latter more clearly indicates significant ASE genes (p-adj<0.01 and |LFC>0.5| in GRCh38 and PanTro5).
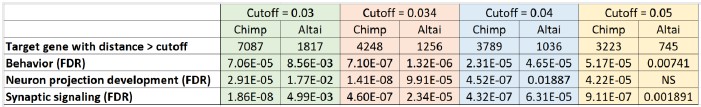
(4) We have also performed two additional analyses in response to the suggestion of “test multiple thresholds, ranging from, eg, 0.05 to 0.01 <DBS dist =0.01 -> 0.034 -> 0.05> at some well-defined step size”. First, we performed a multi-threshold sensitivity analysis using a spectrum of cutoffs (0.03, 0.034, 0.04, 0.05), and tracked the number of genes identified and the enrichment significance of key GO terms (e.g., "neuron projection development," "behavior") across these thresholds. The result confirms that while the absolute number of genes varies with the cutoffs, the core biological conclusion (specifically, the significant enrichment of target genes in neurodevelopmental and cognitive functions) remains stable and significant. For instance, "behavior" maintains strong statistical significance (FDR<0.01) in both the human-chimpanzee and human-Altai Neanderthal comparisons across all tested cutoffs, and "Neuron projection development" also remains significant across three (0.03, 0.034, 0.04) of the four cutoffs in the Altai comparison. This pattern suggests that our core findings regarding neurodevelopmental functions are robust across a range of cutoffs. Nevertheless, we did not extend the analysis to smaller cutoffs (e.g., 0.01 or 0.02) because such values would identify an excessively large number of genes (>10000) for ORA, which would render the GOterm enrichment analysis less meaningful due to a loss of specificity.
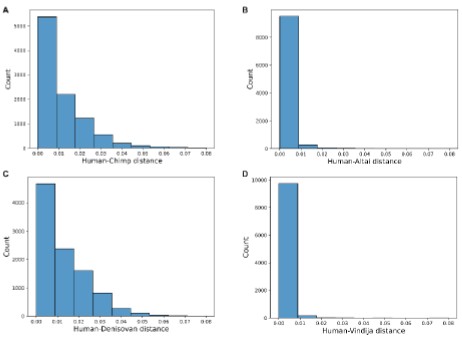
Second, we have performed an additional validation to directly evaluate whether the 0.034 cutoff itself represents a stringent and biologically meaningful value. We sought to empirically determine how often a DBS sequence distance of 0.034 or greater might occur by chance in promoter regions, thereby testing its significance as a marker of potential evolutionary divergence. We randomly sampled 10,000 windows from annotated promoter regions across the hg38 genome, each with a size matching the average length of DBSs (147 bp). We then calculated the per-base sequence distances for these random windows between modern humans and chimpanzees, as well as between modern humans and the three archaic humans (Altai, Denisovan, Vindija). The analysis reveals that a distance of ≥0.034 is a rare event in random promoter sequences: for Human-Chimp, Human-Altai, HumanDenisovan, and Human-Vindija, 5.49% (549/10000), 0.31% (31/10000), 4.47% (447/10000), and0.03% (3/10000) of random windows reach this distance. This empirical evidence suggests that 0.034 is a sufficiently strong cutoff for defining large DBS distance, it would occur very unlikely in a random genomic background (P<0.1 for Chimpanzee and P<0.05 for the archaic humans), and DBSs exceeding this cutoff are significantly enriched for sequences that have undergone substantial evolutionary change instead of being random neutral variations.
(5) We present new Figure 2, Supplementary Table 5,6,7, and Supplementary Fig. 15. We have substantially revised section 2.3, related sections in Results, Supplementary Note 3, and Supplementary Table 8. We have removed related descriptions and explanations in the main text and Supplementary Notes. The results of the above two analyses are presented here as two Author response images.
Author response table 1.
Sensitivity analysis of GO-term enrichment across different DBS sequence distance cutoffs. The table shows the numbers of target genes identified and the false discovery rates (FDR) for the enrichment of three selected GO terms at four different distance cutoffs. Note that, unlike in the old Figure 2, the results for chimpanzees and Altai Neanderthals are not directly comparable here, as the numbers of target genes used for the enrichment analysis differ between them at each cutoff.
Author response image 1.
Distribution of per-base sequence distances for DBS size-matched random genomic windows in Ensembl-annotated promoter regions, calculated between modern humans and (A) chimpanzee, (B) Altai Neanderthal, (C) Denisovan, and (D) Vindija Neanderthal genomes.
(2) The authors have introduced a new TFBS section, as a control for their lncRNAs - this is welcome, though again I would ask for caution when interpreting results. For instance, in their reply to me the authors state: "The number of HS TFs and HS lncRNAs (5 vs 66) alone lends strong evidence suggesting that HS lncRNAs have contributed more significantly to human evolution than HS TFs (note that 5 is the union of three intersections between <many2zero + one2zero> and the three )."
But this assumes the denominator is the same! There are 35899 lncRNAs according to the current GENCOVE build; 66/35899 = 0.0018, so, 0.18% of lncRNAs are HS. The authors compare this to 5 TFs. There are 19433 protein coding genes in the current GENCOVE build, which naively (5/19433) gives a big depletion (0.026%) relative to the lnc number. However, this assumes all protein coding genes are TFs, which is not the case. A quick search suggests that ~2000 protein coding genes are TFs (see, eg, https://pubmed.ncbi.nlm.nih.gov/34755879/); which gives an enrichment (although I doubt it is a statistically significant one!) of HS TFs over HS lncRNAs (5/2000 = 0.0025). Hence my emphasis on needing to be sure the controls are robust and valid throughout!
We thank the reviewer for this comment. While 5 vs 66 reveals a difference, a direct comparison is too simplified. The real take-home message of the new TFBS section is not the numbers but the distributions of HS TFs’ targets and HS lncRNAs’ targets across GTEx organs and tissues (Figure 3 and Supplementary Figures 24, 25) - correlated HS lncRNA-target transcript pairs are highly enriched in brain regions, but correlated HS TF-target transcript pairs are distributed broadly across GTEx tissues and organs. We have now removed the simple comparison of “5 vs 66” and more carefully explained our comparison in section 2.6.
(3) In my original review I said: line 187: "Notably, 97.81% of the 105141 strong DBSs have counterparts in chimpanzees, suggesting that these DBSs are similar to HARs in evolution and have undergone human-specific evolution." I do not see any support for the inference here. Identifying HARs and acceleration relies on a far more thorough methodology than what's being presented here. Even generously, pairwise comparison between two taxa only cannot polarise the direction of differences; inferring human-specific change requires outgroups beyond chimpanzee.
In their reply to me, the authors state:
Here, we actually made an analogy but not an inference; therefore, we used such words as "suggesting" and "similar" instead of using more confirmatory words. We have revised the latter half sentence, saying "raising the possibility that these sequences have evolved considerably during human evolution".
Is the aim here to draw attention to the ~2.2% of DBS that do not have a counterpart? In that case, it would be better to rewrite the sentence to emphasise those, not the ones that are shared between the two species? I do appreciate the revised wording, though.
(1) Our original phrasing may be misleading, and we agree entirely that “pairwise comparison between two taxa only cannot polarise the direction of differences; inferring human-specific change requires outgroups beyond chimpanzee”. As explained in that reply, we know and think that DBSs and HARs are two different classes of sequences, and indeed, identifying HARs and acceleration relies on a far more thorough methodology. Yet, three factors prompted us to compare them. First, both suggest the importance of sequences outside genes. Second, both are quite “old” sequences and have undergone considerable evolution recently (although the references are different). Third, both have contributed greatly to human brain evolution.
(2) Here, our stress is 97.81% but not 2.2%, and we have made this analogy more clearly and cautiously. Relevant revisions have been made in the Results, Discussion, and Methods sections.
(3) We also have further determined whether the 2.2% DBSs are human-specific gains by analyzing them using the UCSC Multiz Alignments of 100 Vertebrates. The result confirms that all 2248 DBSs are present in the human genome but are absent from the chimpanzee genome and all other aligned vertebrate genomes. We add this result into the manuscript.
(4) Finally, Line 408: "Ensembl-annotated transcripts (release 79)" Release 79 is dated to March 2015, which is quite a few releases and genome builds ago. Is this a typo? Both the human and the chimpanzee genome have been significantly improved since then!
(1) We thank the reviewer for this comment, which prompts us to provide further explanation and additional data. First, we began predicting HS lncRNAs’ DBSs when Ensembl release 79 was available, but did not re-predict DBSs when new Ensembl releases were published because (a) these new Ensembl releases are based also on hg38, (b) we did not find any fault in the LongTarget program during our use, nor received any one from users, (c) predicting lncRNAs’ DBSs using the LongTarget program is highly time-consuming.
(2) Second, to assess the influence of newer Ensembl releases, we compared the promoters annotated in release 79 and in release 115. We found that the vast majority (87.3%) of promoters newly annotated in release 115 belong to non-coding genes. Thus, using release 115 may predict more DBSs in non-coding genes, but downstream analyses based on protein-coding genes would be essentially the same (meaning that all figures and tables would be the same).
(3) Third, a key element of this study is GTEx data analysis, and these data were also published years ago.
(4) Finally, some lncRNA genes have new gene symbols in new Ensembl releases. To allow researchers to use our data conveniently, we have added a new column titled "Gene symbol (Ensembl release115)" to Supplementary Tables 2A and 2B.
Summary:
Major changes based on Reviewer’s comments:
(1) The following revisions are made to address the comment on “the 0.034 threshold”: (a) Section 2.3, section 2.4, Supplementary Note 3, and related contents in Discussion and Methods are revised, (b) new Figure 2, Supplementary Figure 15, new Supplementary Table 5,6,7, (c) Table 2 and Supplementary Table 8 are revised.
(2) To address the comment on “new TFBS section”, section 2.6 and section 4.13 are revised.
(3) To address the comment on “97.81% and 2.2% of DBSs”, section 2.3 is revised.
(4) The following revisions are made to address the comment on “release 79”: (a) the old Supplementary Table 2, 3 are merged to Supplementary Table 2AB, and the new column "Gene symbol (Ensembl release115)" is added to Supplementary Table 2AB, (b) accordingly, Supplementary Table 4,5 are renamed to Supplementary Table 3,4.
Additional revisions:
(1) Section 2.5 “Young weak DBSs may have greatly promoted recent human evolution” is moved into Supplementary Note 3 (which now has the subtitle “Target genes with specific DBS features are enriched in specific functions”), because this section is short and lacking sufficient cross-validation.
(2) Considerable minor revisions of sentences have been made.
(3) Since there are many supplementary figures, the main text now cites only Supplementary Notes, as the reader can easily access supplementary figures in Supplementary Notes.
-
-
eLife Assessment
This valuable study uses tools of population and functional genomics to examine long non-coding RNAs (lncRNAs) in the context of human evolution. Analyses of computationally predicted human-specific lncRNAs and their genomic targets lead to the development of hypotheses regarding the potential roles of these genetic elements in human biology. The conclusions regarding evolutionary acceleration and adaptation, however, only incompletely take data and literature on human/chimpanzee genetics and functional genomics into account.
-
Reviewer #2 (Public review):
In this valuable manuscript, Lin et al attempt to examine the role of long non coding RNAs (lncRNAs) in human evolution, through a set of population genetics and functional genomics analyses that leverage existing datasets and tools. Although the methods are incomplete and at times inadequate, the results nonetheless point towards a possible contribution of long non coding RNAs to shaping humans, and suggest clear directions for future, more rigorous study.
Comments on revisions:
I thank the authors for their revision and changes in response to previous rounds of comments. As before, I appreciate the changes made in response to my comments, and I think everyone is approaching this in the spirit of arriving at the best possible manuscript, but we still have some deep disagreements on the nature of the …
Reviewer #2 (Public review):
In this valuable manuscript, Lin et al attempt to examine the role of long non coding RNAs (lncRNAs) in human evolution, through a set of population genetics and functional genomics analyses that leverage existing datasets and tools. Although the methods are incomplete and at times inadequate, the results nonetheless point towards a possible contribution of long non coding RNAs to shaping humans, and suggest clear directions for future, more rigorous study.
Comments on revisions:
I thank the authors for their revision and changes in response to previous rounds of comments. As before, I appreciate the changes made in response to my comments, and I think everyone is approaching this in the spirit of arriving at the best possible manuscript, but we still have some deep disagreements on the nature of the relevant statistical approach and defining adequate controls. I highlight a couple of places that I think are particularly relevant, but note that given the authors disagree with my interpretation, they should feel free to not respond!
(1) On the subject of the 0.034 threshold, I had previously stated:
"I do not agree with the rationale for this claim, and do not agree that it supports the cutoff of 0.034 used below."In their reply to me, the authors state:
"What we need is a gene number, which (a) indicates genes that effectively differentiate humans from chimpanzees, (b) can be used to set a DBS sequence distance cutoff. Since this study is the first to systematically examine DBSs in humans and chimpanzees, we must estimate this gene number based on studies that identify differentially expressed genes in humans and chimpanzees. We choose Song et al. 2021 (Song et al. Genetic studies of human-chimpanzee divergence using stem cell fusions. PNAS 2021), which identified 5984 differentially expressed genes, including 4377 genes whose differential expression is due to trans-acting differences between humans and chimpanzeees. To the best of our knowledge, this is the only published data on trans-acting differences between humans and chimpanzeees, and most HS lncRNAs and their DBSs/targets have trans-acting relationships (see Supplementary Table 2). Based on these numbers, we chose a DBS sequence distance cutoff of 0.034, which corresponds to 4248 genes (the top 20%), slightly fewer than 4377."I have some notes here. First, Agoglia et al, Nature, 2021, also examined the nature of cis vs trans regulatory differences between human and chimps using a very similar set up to Song et al; their Supplementary Table 4 enables the discovery of genes with cis vs trans effects although admittedly this is less straightforward than the Song et al data. Second, I can't actually tell how the 4377 number is arrived at. From Song et al, "Of 4,671 genes with regulatory changes between human-only and chimpanzee-only iPSC lines, 44.4% (2,073 genes) were regulated primarily in cis, 31.4% (1,465 genes) were regulated primarily in trans, and the remaining 1,133 genes were regulated both in cis and in trans (Fig. 2C). This final category was further broken down into a cis+trans category (cis- and trans-regulatory changes acting in the same direction) and a cis-trans category (cis- and trans-regulatory changes acting in opposite directions)." Even when combining trans-only and cis&trans genes that gives 2,598 genes with evidence for some trans regulation. I cannot find 4,377 in the main text of the Song et al paper.
Elsewhere in their response, the authors respond to my comment that 0.034 is an arbitrary threshold by repeating the analyses using a cutoff of 0.035. I appreciate the sentiment here, but I would not expect this to make any great difference, given how similar those numbers are! A better approach, and what I had in mind when I mentioned this, would be to test multiple thresholds, ranging from, eg, 0.05 to 0.01 at some well-defined step size.
(2) The authors have introduced a new TFBS section, as a control for their lncRNAs - this is welcome, though again I would ask for caution when interpreting results. For instance, in their reply to me the authors state:
"The number of HS TFs and HS lncRNAs (5 vs 66) alone lends strong evidence suggesting that HS lncRNAs have contributed more significantly to human evolution than HS TFs (note that 5 is the union of three intersections between and the three )."But this assumes the denominator is the same! There are 35899 lncRNAs according to the current GENCOVE build; 66/35899 = 0.0018, so, 0.18% of lncRNAs are HS. The authors compare this to 5 TFs. There are 19433 protein coding genes in the current GENCOVE build, which naively (5/19433) gives a big depletion (0.026%) relative to the lnc number. However, this assumes all protein coding genes are TFs, which is not the case. A quick search suggests that ~2000 protein coding genes are TFs (see, eg, https://pubmed.ncbi.nlm.nih.gov/34755879/); which gives an enrichment (although I doubt it is a statistically significant one!) of HS TFs over HS lncRNAs (5/2000 = 0.0025). Hence my emphasis on needing to be sure the controls are robust and valid throughout!
(3) In my original review I said:
line 187: "Notably, 97.81% of the 105141 strong DBSs have counterparts in chimpanzees, suggesting that these DBSs are similar to HARs in evolution and have undergone human-specific evolution." I do not see any support for the inference here. Identifying HARs and acceleration relies on a far more thorough methodology than what's being presented here. Even generously, pairwise comparison between two taxa only cannot polarise the direction of differences; inferring human-specific change requires outgroups beyond chimpanzee.In their reply to me, the authors state:
Here, we actually made an analogy but not an inference; therefore, we used such words as "suggesting" and "similar" instead of using more confirmatory words. We have revised the latter half sentence, saying "raising the possibility that these sequences have evolved considerably during human evolution".Is the aim here to draw attention to the ~2.2% of DBS that do not have a counterpart? In that case, it would be better to rewrite the sentence to emphasise those, not the ones that are shared between the two species? I do appreciate the revised wording, though.
(4) Finally, Line 408: "Ensembl-annotated transcripts (release 79)" Release 79 is dated to March 2015, which is quite a few releases and genome builds ago. Is this a typo? Both the human and the chimpanzee genome have been significantly improved since then!
-
Author response:
The following is the authors’ response to the previous reviews
Public Reviews:
Reviewer #2 (Public review):
In this valuable manuscript, Lin et al attempt to examine the role of long non coding RNAs (lncRNAs) in human evolution, through a set of population genetics and functional genomics analyses that leverage existing datasets and tools. Although the methods are incomplete and at times inadequate, the results nonetheless point towards a possible contribution of long non coding RNAs to shaping humans, and suggest clear directions for future, more rigorous study.
Comments on revisions:
I thank the authors for their revision and changes in response to previous rounds of comments. As it had been nearly two years since I last saw the manuscript, I reread the full text to familiarise myself again with the findings …
Author response:
The following is the authors’ response to the previous reviews
Public Reviews:
Reviewer #2 (Public review):
In this valuable manuscript, Lin et al attempt to examine the role of long non coding RNAs (lncRNAs) in human evolution, through a set of population genetics and functional genomics analyses that leverage existing datasets and tools. Although the methods are incomplete and at times inadequate, the results nonetheless point towards a possible contribution of long non coding RNAs to shaping humans, and suggest clear directions for future, more rigorous study.
Comments on revisions:
I thank the authors for their revision and changes in response to previous rounds of comments. As it had been nearly two years since I last saw the manuscript, I reread the full text to familiarise myself again with the findings presented. While I appreciate the changes made and think they have strengthened the manuscript, I still find parts of it a bit too speculative or hyperbolic. In particular, I think claims of evolutionary acceleration and adaptation require more careful integration with existing human/chimpanzee genetics and functional genomics literature.
We thank the reviewer heartfully for the great patience and valuable comments, which have helped us further improve the manuscript. Before responding to comments point by point, we provide a summary here.
(1) On parameters and cutoffs.
Parameters and cutoffs influence data analysis. The large number of Supplementary Notes, Supplementary Figures, and Supplementary Tables indicates that we paid great attention to the influence of parameters and robustness of analyses. Specifically, here we explain the DBS sequence distance cutoff of 0.034, which determines the top 20% genes that most differentiate humans from chimpanzees and influences the gene set enrichment analysis (Figure 2). As described in the revised manuscript, we estimated this cutoff based on Song et al., verified its rationality based on Prufer et al. (Song et al. 2021; Prufer et al. 2017), and measured its influence by examining slightly different cutoff values (e.g., 0.035).
(2) Analyses of HS TFs and HS TF DBSs.
It is desirable to compare the contribution of HS lncRNAs and HS TFs to human evolution. Identifying HS TFs faces the challenges that different institutions (e.g., NCBI and Ensembl) annotate orthologous genes using different criteria, and that multiple human TF lists have been published by different research groups. Recently, Kirilenko et al. identified orthologous genes in hundreds of placental mammals and birds and organized different types of genes into datasets of parewise comparison (e.g., hg38-panTro6) using humans and mice as references (Kirilenko et al. Integrating gene annotation with orthology inference at scale. Science 2023). Based on (a) the many2zero and one2zero gene lists in the “hg38-panTro6” dataset, (b) three human TF lists reported by two studies (Bahram et al. 2015; Lambert et al. 2018) and used in the SCENIC package, we identified HS TFs. The number of HS TFs and HS lncRNAs (5 vs 66) alone lends strong evidence suggesting that HS lncRNAs have contributed more significantly to human evolution than HS TFs (note that 5 is the union of three intersections between <many2zero + one2zero> and the three ).
TF DBS (i.e., TFBS) prediction has also been challenging because they are very short (mostly about 10 bp) and TF-DNA binding involves many cofactors (Bianchi et al. Zincore, an atypical coregulator, binds zinc finger transcription factors to control gene expression. Science 2025). We used two TF DBS prediction programs to predict HS TF DBSs, including the well-established FIMO program (whose results have been incorporated into the JASPAR database) (Rauluseviciute et al. JASPAR 2024: 20th anniversary of the open-access database of transcription factor binding profiles Open Access. NAR 2023) and the recently reported CellOracle program (Kamimoto et al. Dissecting cell identity via network inference and in silico gene perturbation. Nature 2023). Then, we performed downstream analyses and obtained two major results. One is that on average (per base), fewer selection signals are detected in HS TF DBSs (anyway, caution is needed because TF DBSs are very short); the other is that HS TFs and HS lncRNAs contribute to human evolution in quite different ways (Supplementary Figs. 25 and 26).
(3) On genes with more transcripts may appear as spurious targets of HS lncRNAs.
Now, the results of HS TF DBSs allow us to address the question of whether genes with more transcripts may appear as spurious targets of HS lncRNAs. We note that (a) we predicted HS lncRNA DBSs and HS TF DBSs in the same promoter regions before the same 179128 Ensembl-annotated transcripts (release 79), (b) we used the same GTEx transcript expression matrices in the analyses of HS TF DBSs and HS lncRNA DBSs (the GTEx database includes gene expression matrices and transcript expression matrices, the latter includes multiple transcripts of a gene). Thus, the analyses of HS TF DBSs provide an effective control for examining the question of whether genes with more transcripts may appear as spurious targets of HS lncRNAs, and consequently, cause the high percentages of HS lncRNA-target transcript pairs that show correlated expression in the brain (Figure 3). We find that the percentages of HS TF-target transcript pairs that show correlated expression are also high in the brain, but the whole profile in GTEx tissues is significantly different from that of HS lncRNA DBSs (Figure 3A; Supplementary Figure 25). On the other hand, on the distribution of significantly changed DBSs in GTEx tissues, the difference between HS lncRNA DBSs and HS TF DBSs is more apparent (Figure 3B; Supplementary Figure 26). Together, these suggest that the brain-enriched distribution of co-expressed HS lncRNA-target transcript pairs must arise from HS lncRNA-mediated transcriptional regulation rather than from the transcript number difference.
(4) Additional notes on HS TFs and HS TF DBSs.
First, the “many2zero” and “one2zero” gene lists in the “hg38-panTro6” dataset of Kirilenko et al. provide the most update, but not most complete, data on human-specific genes because “hg38-panTro6” is a pairwise comparison. On the other hand, the Ensembl database also annotates orthologous genes, but lacks such pairwise comparisons as “hg38-panTro6”. Therefore, not all HS genes based on “hg38-panTro6” agree with orthologous genes in the Ensembl database. Second, if HS genes are identified based on both Ensembl and Kirilenko et al., HS TFs will be fewer.
(5) On speculative or hyperbolic claims.
First, the title “Human-specific lncRNAs contributed critically to human evolution by distinctly regulating gene expression” is now further supported by HS TF DBSs analyses. Second, we have carefully revised the entire manuscript, trying to make it more readable, accurate, logically reasonable, and biologically acceptable. Third, specifically, in the revision, we avoid speculative or hyperbolic claims in results, interpretations, and discussions as possible as we can. This includes the tone-down of statements and claims, for example, using “reshape” to replace “rewire” and using “suggest” to replace “indicate”. Since the revisions are pervasive, we do not mark all of them, except those that are directly relevant to the reviewer’s comments.
(1) Line 155: "About 5% of genes have significant sequence differences in humans and chimpanzees," This statement needs a citation, and a definition of what is meant by 'significant', especially as multiple lines below instead mention how it's not clear how many differences matter, or which of them, etc.
Different studies give different estimates, from 1.24% (Ebersberger et al. Genomewide Comparison of DNA Sequences between Humans and Chimpanzees. Am J Hum Genet. 2002) to 5% (Britten RJ. Divergence between samples of chimpanzee and human DNA sequences is 5%, counting indels. PNAS 2002). The 5% for significant gene sequence differences arises when considering a broader range of genetic variations, particularly insertions and deletions of genetic material (indels). To provide more accurate information, we have replaced this simple statement with a more comprehensive one and cited the above two papers.
(2) line 187: "Notably, 97.81% of the 105141 strong DBSs have counterparts in chimpanzees, suggesting that these DBSs are similar to HARs in evolution and have undergone human-specific evolution." I do not see any support for the inference here. Identifying HARs and acceleration relies on a far more thorough methodology than what's being presented here. Even generously, pairwise comparison between two taxa only cannot polarise the direction of differences; inferring human-specific change requires outgroups beyond chimpanzee.
Here, we actually made an analogy but not an inference; therefore, we used such words as “suggesting” and “similar” instead of using more confirmatory words. We have revised the latter half sentence, saying “raising the possibility that these sequences have evolved considerably during human evolution”.
(3) line 210: "Based on a recent study that identified 5,984 genes differentially expressed between human-only and chimpanzee-only iPSC lines (Song et al., 2021), we estimated that the top 20% (4248) genes in chimpanzees may well characterize the human-chimpanzee differences". I do not agree with the rationale for this claim, and do not agree that it supports the cutoff of 0.034 used below. I also find that my previous concerns with the very disparate numbers of results across the three archaics have not been suitably addressed.
(1) Indeed, “we estimated that the top 20% (4248) genes in chimpanzees may well characterize the human-chimpanzee differences” is an improper claim; we made this mistake due to the flawed use of English.
(2) What we need is a gene number, which (a) indicates genes that effectively differentiate humans from chimpanzees, (b) can be used to set a DBS sequence distance cutoff. Since this study is the first to systematically examine DBSs in humans and chimpanzees, we must estimate this gene number based on studies that identify differentially expressed genes in humans and chimpanzees. We choose Song et al. 2021 (Song et al. Genetic studies of human–chimpanzee divergence using stem cell fusions. PNAS 2021), which identified 5984 differentially expressed genes, including 4377 genes whose differential expression is due to trans-acting differences between humans and chimpanzeees. To the best of our knowledge, this is the only published data on trans-acting differences between humans and chimpanzeees, and most HS lncRNAs and their DBSs/targets have trans-acting relationships (see Supplementary Table 2). Based on these numbers, we chose a DBS sequence distance cutoff of 0.034, which corresponds to 4248 genes (the top 20%), slightly fewer than 4377.
(3) If we chose DBS sequence distance cutoff=0.033 or 0.035, slightly more or fewer genes would be determined, raising the question of whether they would significantly influence the downstream gene set enrichment analysis (Figure 2). We found that 91 genes have a DBS sequence distance of 0.034. Thus, if cutoff=0.035, 4248-91=4157 genes were determined, and the influence on gene set enrichment analysis was very limited.
(4) On the disparate numbers of results across the three archaics. Figure 1A is based on Figure 2 in Prufer et al. 2017. At first glance, our Figure 1A indicates that Altai Neanderthal is older than Denisovan (upon kya), making our result “identified 1256, 2514, and 134 genes in Altai Neanderthals, Denisovans, and Vindija Neanderthals” unreasonable. However, Prufer et al. (2017) reported that “It has been suggested that Denisovans received gene flow from a hominin lineage that diverged prior to the common ancestor of modern humans, Neandertals, and Denisovans……In agreement with these studies, we find that the Denisovan genome carries fewer derived alleles that are fixed in Africans, and thus tend to be older, than the Altai Neandertal genome”. This note by Prufer et al. provides an explanation for our result, which is that more genes with large DBS sequence distances were identified in Denisovans than in Altai Neanderthals. Of course, the 1256, 2514, and 134 depend on the cutoff of 0.034. If cutoff=0.035, these numbers change slightly, but their relationships remain (i.e., more genes in Denisovans). We examined multiple cutoff values and found that more genes in Denisovans have large DBS sequence distances than in Altai Neanderthals.
(4) I also think that there is still too much of a tendency to assume that adaptive evolutionary change is the only driving force behind the observed results in the results. As I've stated before, I do not doubt that lncRNAs contribute in some way to evolutionary divergence between these species, as do other gene regulatory mechanisms; the manuscript leans down on it being the sole, or primary force, however, and that requires much stronger supporting evidence. Examples include, but are not limited to:
(1) Indeed, the observed results are also caused by other genomic elements and mechanisms (but it is hardly feasible to identify and differentiate them in a single study), and we do not assume that adaptive evolutionary change is the only driving force. Careful revisions have been made to avoid leaving readers the impression that we have this tendency or hold the simple assumption.
(2) Comparing HS lncRNAs to HS TFs is critical, and we have done this.
(5) line 230: "These results reveal when and how HS lncRNA-mediated epigenetic regulation influences human evolution." This statement is too speculative.
We have toned down the statement, just saying “These results provide valuable insights into when and how HS lncRNA-mediated epigenetic regulation impacts human evolution”.
Line 268: "yet the overall results agree well with features of human evolution." What does this mean? This section is too short and unclear.
(1) First, the sentence “Selection signals in YRI may be underestimated due to fewer samples and smaller sample sizes (than CEU and CHB), yet the overall results agree well with features of human evolution” has been deleted, because CEU, CHB, and YRI samples are comparable (100, 99, and 97, respectively).
(2) Now the sentence has been changed to “These results agree well with findings reported in previous studies, including that fewer selection signals are detected in YRI (Sabeti et al., 2007; Voight et al., 2006)”.
(3) On “This section is too short and unclear” - To make the manuscript more readable, we adopt short sections instead of long ones. This section expresses that (a) our finding that more selection signals were detected in CEU and CHB than in YRI agrees with well-established findings (Voight et al. A Map of Recent Positive Selection in the Human Genome. PLoS Biology 2006; Sabeti et al. Genome-wide detection and characterization of positive selection in human populations. Nature 2007), (b) in considerable DBSs, selection signals were detected by multiple tests.
Line 325: "and form 198876 HS lncRNA-DBS pairs with target transcripts in all tissues." This has not been shown in this paper - sequence based analyses simply identify the “potential” to form pairs.
This section describes transcriptomic analysis using the GTEx data. Indeed, target transcripts of HS lncRNAs are results of sequence-based analysis, and a predicted target is not necessarily regulated by the HS lncRNA in a tissue. Here, “pair” means a pair of HS lncRNA-target transcript whose expression shows significant Pearson correlation in a GTEx tissue (by the way, we do not mean correlation equals regulation; actually, we identified HS lncRNA-mediated transcriptional regulation upon both DBS-targeting relationship and correlation relationship).
Line 423: "Our analyses of these lncRNAs, DBSs, and target genes, including their evolution and interaction, indicate that HS lncRNAs have greatly promoted human evolution by distinctly rewiring gene expression." I do not agree that this conclusion is supported by the findings presented - this would require significant additional evidence in the form of orthogonal datasets.
(1) As mentioned above, we have used “reshape” to replace “rewire” and used “suggest” to replace “indicate”. In addition, we have substantially revised the Discussion, in which this sentence is replaced by “our results suggest that HS lncRNAs have greatly reshaped (or even rewired) gene expression in humans”.
(2) Multiple citations have been added, including Voight et al. 2006 (Voight et al. A Map of Recent Positive Selection in the Human Genome. PLoS Biology 2006) and Sabeti et al. 2007 (Sabeti et al. Genome-wide detection and characterization of positive selection in human populations. Nature 2007).
(3) We have analyzed HS TF DBSs, and the obtained results also support the critical contribution of HS lncRNAs.
I also return briefly to some of my comments before, in particular on the confounding effects of gene length and transcript/isoform number. In their rebuttal the authors argued that there was no need to control for this, but this does in fact matter. A gene with 10 transcripts that differ in the 5' end has 10 times as many chances of having a DBS than a gene with only 1 transcript, or a gene with 10 transcripts but a single annotated TSS. When the analyses are then performed at the gene level, without taking into account the number of transcripts, this could introduce a bias towards genes with more annotated isoforms. Similarly, line 246 focuses on genes with "SNP numbers in CEU, CHB, YRI are 5 times larger than the average." Is this controlled for length of the DBS? All else being equal a longer DBS will have more SNPs than a shorter one. It is therefore not surprising that the same genes that were highlighted above as having 'strong' DBS, where strength is impacted by length, show up here too.
(1) In gene set enrichment analysis (Figure 2, which is a gene-level analysis), when determining genes differentiating humans from chimpanzees based on DBS sequence distance, if a gene has multiple transcripts/DBSs, we choose the DBS with the largest distance. That is, the input to g:Profiler is a non-redundant gene list.
(2) In GTEx data analysis (Figure 3, which is a transcriptome-level analysis), the analyses of HS TF DBSs using the GTEx data provide evidence suggesting that different DBS/transcript numbers of genes are unlikely to cause confounding effects. As explained above, we predicted HS TF DBSs in the same promoter regions of 179128 Ensembl-annotated transcripts (release 79), but Supplementary Figures 25 and 26 are distinctly different from Figure 3AB.
(3) In evolutionary analysis, a gene with 10 DBSs has a higher chance of having selection signals than a gene with 1 DBS. This is biologically plausible, because many conserved genes have novel transcripts whose expression is species-, tissue-, or developmental period-specific, and DBSs before these novel transcripts may differ from DBSs before conserved transcripts.
(4) “line 246 focuses on genes with "SNP numbers in CEU, CHB, YRI are 5 times larger than the average." Is this controlled for the length of the DBS?” - This is a defect. We have now computed SNP numbers per base and used the new table to replace the old Supplementary Table 8. After examining the new table, we find that the major results of SNP analysis remain.
(5) On “Is this controlled for length of the DBS? All else being equal a longer DBS will have more SNPs than a shorter one” - We do not think there are reasons to control for the length of DBSs; also, what “All else being equal” means matters. First, DBS sequences have specific features; thus, the feature of a long DBS is stronger than the feature of a short one, making a long DBS less likely to be generated by chance in the genome and less likely to be predicted wrongly than a short one. This means that longer DBSs are less likely to be false ones (note our explanation that the chance of a DBS of 147 bp, the mean length of DBSs, to be wrongly predicted is extremely low, p<8.2e-19 to 1.5e-48). Second, the difference in length suggests a difference in binding affinity, which in turn influences the regulation of the specific transcripts and influences the analysis of GTEx data. Third, it cannot be excluded that some SNPs may be selection signals (detecting selection signal is challenging, and many selection signals cannot be detected by statistical tests, see Grossman et al. A composite of multiple signals distinguishes causal variants in regions of positive selection. Science 2010).
(6) On “It is therefore not surprising that the same genes that were highlighted above as having 'strong' DBS, where strength is impacted by length” - Indeed, strength is influenced by length, see the above response.
Recommendations for the authors:
Reviewer #2 (Recommendations for the authors):
Finally, figure 1 panels D and F are not legible - the font is tiny! There's also a typo in panel A, where "Homo Sapien" should be "Homo sapiens".
(1) “Homo sapien” is changed to “Homo sapiens”.
(2) Even if we double the font size, they are still too small. Inserting a very large panel D into Figure 1 will make Figure 1 ugly, and converting Figure 1D into an independent figure is unnecessary. Actually, panels 1D and F are illustrative figures; the full Fig.1D is Supplementary Figure 6, and the full Fig.1F is Figure 3. We have revised Fig.1’s legend to explain these.
-
eLife Assessment
This valuable study uses tools of population and functional genomics to examine long non-coding RNAs (lncRNAs) in the context of human evolution. Analyses of computationally predicted human-specific lncRNAs and their genomic targets lead to the development of hypotheses regarding the potential roles of these genetic elements in human biology. The conclusions regarding evolutionary acceleration and adaptation, however, only incompletely take data and literature on human/chimpanzee genetics and functional genomics into account.
-
Reviewer #2 (Public review):
In this valuable manuscript, Lin et al attempt to examine the role of long non coding RNAs (lncRNAs) in human evolution, through a set of population genetics and functional genomics analyses that leverage existing datasets and tools. Although the methods are incomplete and at times inadequate, the results nonetheless point towards a possible contribution of long non coding RNAs to shaping humans, and suggest clear directions for future, more rigorous study.
Comments on revisions:
I thank the authors for their revision and changes in response to previous rounds of comments. As it had been nearly two years since I last saw the manuscript, I reread the full text to familiarise myself again with the findings presented. While I appreciate the changes made and think they have strengthened the manuscript, I still …
Reviewer #2 (Public review):
In this valuable manuscript, Lin et al attempt to examine the role of long non coding RNAs (lncRNAs) in human evolution, through a set of population genetics and functional genomics analyses that leverage existing datasets and tools. Although the methods are incomplete and at times inadequate, the results nonetheless point towards a possible contribution of long non coding RNAs to shaping humans, and suggest clear directions for future, more rigorous study.
Comments on revisions:
I thank the authors for their revision and changes in response to previous rounds of comments. As it had been nearly two years since I last saw the manuscript, I reread the full text to familiarise myself again with the findings presented. While I appreciate the changes made and think they have strengthened the manuscript, I still find parts of it a bit too speculative or hyperbolic. In particular, I think claims of evolutionary acceleration and adaptation require more careful integration with existing human/chimpanzee genetics and functional genomics literature. For example:
Line 155: "About 5% of genes have significant sequence differences in humans and chimpanzees," This statement needs a citation, and a definition of what is meant by 'significant', especially as multiple lines below instead mention how it's not clear how many differences matter, or which of them, etc.
line 187: "Notably, 97.81% of the 105141 strong DBSs have counterparts in chimpanzees, suggesting that these DBSs are similar to HARs in evolution and have undergone human-specific evolution." I do not see any support for the inference here. Identifying HARs and acceleration relies on a far more thorough methodology than what's being presented here. Even generously, pairwise comparison between two taxa only cannot polarise the direction of differences; inferring human-specific change requires outgroups beyond chimpanzee.
line 210: "Based on a recent study that identified 5,984 genes differentially expressed between human-only and chimpanzee-only iPSC lines (Song et al., 2021), we estimated that the top 20% (4248) genes in chimpanzees may well characterize the human-chimpanzee differences" I do not agree with the rationale for this claim, and do not agree that it supports the cutoff of 0.034 used below. I also find that my previous concerns with the very disparate numbers of results across the three archaics have not been suitably addressed.
I also think that there is still too much of a tendency to assume that adaptive evolutionary change is the only driving force behind the observed results in the results. As I've stated before, I do not doubt that lncRNAs contribute in some way to evolutionary divergence between these species, as do other gene regulatory mechanisms; the manuscript leans down on it being the sole, or primary force, however, and that requires much stronger supporting evidence. Examples include, but are not limited to:
line 230: "These results reveal when and how HS lncRNA-mediated epigenetic regulation influences human evolution." This statement is too speculative.
Line 268: "yet the overall results agree well with features of human evolution." What does this mean? This section is too short and unclear.
Line 325: "and form 198876 HS lncRNA-DBS pairs with target transcripts in all tissues." This has not been shown in this paper - sequence based analyses simply identify the *potential* to form pairs.
Line 423: "Our analyses of these lncRNAs, DBSs, and target genes, including their evolution and interaction, indicate that HS lncRNAs have greatly promoted human evolution by distinctly rewiring gene expression." I do not agree that this conclusion is supported by the findings presented - this would require significant additional evidence in the form of orthogonal datasets.
I also return briefly to some of my comments before, in particular on the confounding effects of gene length and transcript/isoform number. In their rebuttal the authors argued that there was no need to control for this, but this does in fact matter. A gene with 10 transcripts that differ in the 5' end has 10 times as many chances of having a DBS than a gene with only 1 transcript, or a gene with 10 transcripts but a single annotated TSS. When the analyses are then performed at the gene level, without taking into account the number of transcripts, this could introduce a bias towards genes with more annotated isoforms. Similarly, line 246 focuses on genes with "SNP numbers in CEU, CHB, YRI are 5 times larger than the average." Is this controlled for length of the DBS? All else being equal a longer DBS will have more SNPs than a shorter one. It is therefore not surprising that the same genes that were highlighted above as having 'strong' DBS, where strength is impacted by length, show up here too.
-
Author Response:
The following is the authors’ response to the previous reviews
Reviewer #1 (Public Review):
Summary
While DNA sequence divergence, differential expression, and differential methylation analysis have been conducted between humans and the great apes to study changes that "make us human", the role of lncRNAs and their impact on the human genome and biology has not been fully explored. In this study, the authors computationally predict HSlncRNAs as well as their DNA Binding sites using a method they have developed previously and then examine these predicted regions with different types of enrichment analyses. Broadly, the analysis is straightforward and after identifying these regions/HSlncRNAs the authors examined their effects using different external datasets.
I no longer have any concerns about the manuscript as the …
Author Response:
The following is the authors’ response to the previous reviews
Reviewer #1 (Public Review):
Summary
While DNA sequence divergence, differential expression, and differential methylation analysis have been conducted between humans and the great apes to study changes that "make us human", the role of lncRNAs and their impact on the human genome and biology has not been fully explored. In this study, the authors computationally predict HSlncRNAs as well as their DNA Binding sites using a method they have developed previously and then examine these predicted regions with different types of enrichment analyses. Broadly, the analysis is straightforward and after identifying these regions/HSlncRNAs the authors examined their effects using different external datasets.
I no longer have any concerns about the manuscript as the authors have addressed my comments in the first round of review.
We thank the reviewer for the valuable comments, which have helped us improve the manuscript.
Reviewer #2 (Public Review):
Lin et al attempt to examine the role of lncRNAs in human evolution in this manuscript. They apply a suite of population genetics and functional genomics analyses that leverage existing data sets and public tools, some of which were previously built by the authors, who clearly have experience with lncRNA binding prediction. However, I worry that there is a lack of suitable methods and/or relevant controls at many points and that the interpretation is too quick to infer selection. While I don't doubt that lncRNAs contribute to the evolution of modern humans, and certainly agree that this is a question worth asking, I think this paper would benefit from a more rigorous approach to tackling it.
I thank the authors for their revisions to the manuscript; however, I find that the bulk of my comments have not been addressed to my satisfaction. As such, I am afraid I cannot say much more than what I said last time, emphasising some of my concerns with regards to the robustness of some of the analyses presented. I appreciate the new data generated to address some questions, but think it could be better incorporated into the text - not in the discussion, but in the results.
We thank the reviewer for the careful reading and valuable comments. In this round of revision, we address the two main concerns: (1) there is a lack of suitable methods and/or relevant controls at many points, and (2) the interpretation is too quick to infer selection. Based on these comments, we have carefully revised all sections of the manuscript, including the Introduction, Results, Discussion, and Materials and Methods.
In addition, we have performed two new analyses. Based on the two analyses, we have added one figure and two sections to Results, two sections to Materials and Methods, one figure to Supplementary Notes, and two tables to Supplementary Tables. These results were obtained using new methods and provided more support to the main conclusion.
To be more responsible, we re-look into the comments made in the first round and respond to them further. The following are point-to-point responses to comments.
Since many of the details in the Responses-To-Comments are available in published papers and eLife publishes Responses-To-Comments, we do not greatly revise supplementary notes to avoid ostensibly repeating published materials.
“lack of suitable methods and/or relevant controls”.
We carefully chose the methods, thresholds, and controls in the study; now, we provide clearer descriptions and explanations.
(1) We have expanded the last paragraph in Introduction to briefly introduce the methods, thresholds, and controls.
(2) In many places in Results and Materials and Methods, revisions are made to describe and justify methods, thresholds, and controls.
(3) Some methods, thresholds, and controls have good consensus, such as FDR and genome-wide background, but others may not, such as the number of genes that greatly differ between humans and chimpanzees. Now, we describe our reasons for the latter situation. For example, we explain that “About 5% of genes have significant sequence differences in humans and chimpanzees, but more show expression differences due to regulatory sequences. We sorted target genes by their DBS affinity and, to be prudential, chose the top 2000 genes (DBS length>252 bp and binding affinity>151) and bottom 2000 genes (DBS length<60 bp but binding affinity>36) to conduct over-representation analysis”.
(4) We also carefully choose proper words to make descriptions more accurate.
Responses to the suggestion “new data generated could be better incorporated into the text”.
(1) We think that this sentence “The occurrence of HS lncRNAs and their DBSs may have three situations – (a) HS lncRNAs preceded their DBSs, (b) HS lncRNAs and their DBSs co-occurred, (c) HS lncRNAs succeeded their DBSs. Our results support the third situation and the rewiring hypothesis”, previously in Discussion, should be better in section 2.3. We have revised it and moved it into the second paragraph of section 2.3.
(2) Our two new analyses generated new data, and we describe them in Results.
(3) It is possible to move more materials from Supplementary Notes to the main text, but it is probably unnecessary because the main text currently has eight sub-sections, two tables, and four figures.
Responses to the comment “the interpretation is too quick to infer selection”.
(1) When using XP-CLR, iSAFE, Tajima's D, Fay-Wu's H, the fixation index (Fst), and linkage disequilibrium (LD) to detect selection signals, we used the widely adopted parameters and thresholds but did not mention this clearly in the original manuscript. Now, in the first sentence of the second paragraph of section 2.4, we add the phrase “with widely-used parameters and thresholds” (more details are available in section 4.7 and Supplementary Notes).
(2) It is not the first time we used these tests. Actually, we used these tests in two other studies (Tang et al. Uncovering the extensive trade-off between adaptive evolution and disease susceptibility. Cell Rep. 2022; Tang et al. PopTradeOff: A database for exploring population-specificity of adaptive evolution, disease susceptibility, and drug responsiveness. Comput Struct Biotechnol J. 2023). In this manuscript, section 2.5 and section 4.12 describe how we use these tests to detect signals and infer selection. We also cite the above two published papers from which the reader can obtain more details.
(3) Also, in section 2.4, we stress that “Signals in considerable DBSs were detected by multiple tests, indicating the reliability of the analysis”.
To further respond to the comments of “lack of suitable methods” and “this paper would benefit from a more rigorous approach to tackling it”, we have performed two new analyses. The results of the new analyses agree well with previous results and provide new support for the main conclusion. The result of section 2.5 is novel and interesting.
We write in Discussion “Two questions are how mouse-specific lncRNAs specifically rewire gene expression in mice and how human- and mouse-specific rewiring influences the cross-species transcriptional differences”. To investigate whether the rewiring of gene expression by HS lncRNA in humans is accidental in evolution, we have made further genomic and transcriptomic analyses (Lin et al. Intrinsically linked lineage-specificity of transposable elements and lncRNAs reshapes transcriptional regulation species- and tissue-specifically. doi: https://doi.org/10.1101/2024.03.04.583292). To verify the obtained conclusions, we analyzed the spermatogenesis data from multiple species and obtained supporting evidence (not published).
I note some specific points that I think would benefit from more rigorous approaches, and suggest possible ways forward for these.
Much of this work is focused on comparing DNA binding domains in human-unique long-noncoding RNAs and DNA binding sites across the promoters of genes in the human genome, and I think the authors can afford to be a bit more methodical/selective in their processing and filtering steps here. The article begins by searching for orthologues of human lncRNAs to arrive at a set of 66 human-specific lncRNAs, which are then characterised further through the rest of the manuscript. Line 99 describes a binding affinity metric used to separate strong DBS from weak DBS; the methods (line 432) describe this as being the product of the DBS or lncRNA length times the average Identity of the underlying TTSs. This multiplication, in fact, undoes the standardising value of averaging and introduces a clear relationship between the length of a region being tested and its overall score, which in turn is likely to bias all downstream inference, since a long lncRNA with poor average affinity can end up with a higher score than a short one with higher average affinity, and it's not quite clear to me what the biological interpretation of that should be. Why was this metric defined in this way?
(1) Using RNA:DNA base-pairing rules, other DBS prediction programs return just DBSs with lengths. Using RNA:DNA base-pairing rules and a variant of Smith-Waterman local alignment, LongTarget returns DBSs with lengths and identity values together with DBDs (local alignment makes DBDs and DBSs predicted simultaneously). Thus, instead of measuring lncRNA/DNA binding based on DBS length, we measure lncRNA/DNA binding based on both DBS length and DBD/DBS identity (simply called identity, which is the percentage of paired nucleotides in the RNA and DNA sequences). This allows us to define “binding affinity”. One may think that binding affinity is a more complex function of length and identity. But, according to in vitro studies (see the review Abu Almakarem et al. 2012 and citations therein, and see He et al. 2015 and citations therein), the strength of a triplex is determined by all paired nucleotides (i.e., triplet). Thus, binding affinity=length * identity is biologically reasonable.
(2) Further, different from predicting DBS upon individual base-pairing rules such as AT-G and CG-C, LongTarget integrates base-pairing rules into rulesets, each covering A, T, C, and G (see the two figures below, which are from He et al 2015). This makes every nucleotide in the RNA and DNA sequences comparable and allows the computation of identity.
(3) On whether LongTarget may predict unreasonably long DBSs. Three technical features of LongTarget make this highly unlikely (and more unlikely than other programs). The three features are (a) local alignment, (b) gap penalty, and (c) TT penalty (He et al. 2015).
(4) Some researchers may think that a higher identity threshold (e.g., 0.8 or even higher) makes the predicted DBSs more reliable. This is not true. To explore plausible identity values, we analyzed the distribution of Kcnq1ot1’s DBSs in the large Kcnq1 imprinting region (which contains many known imprinted genes). We found that a high threshold for identity (e.g., 0.8) will make DBSs in many known imprinted genes fail to be predicted. Upon our analysis of many lncRNAs and upon early in vitro experiments, plausible identity values range from 0.4 to 0.8.
(5) Is it necessary or advisable to define an identity threshold? Since identity values from 0.4 to 0.8 are plausible and identity is a property of a DBS but does not reflect the strength of the whole triplex, it is more reasonable to define a threshold for binding affinity to control predicted DBSs. As explained above, binding affinity = length*identity is a reasonable measure of the strength of a triplex. The default threshold is 60, and given an identity of 0.6 in many triplexes, a DBS with affinity=60 is about 100 bp. Compared with TF binding sites (TFBS), 100 bp is quite long. As we explain in the main text, “taking a DBS of 147 bp as an example, it is extremely unlikely to be generated by chance (p < 8.2e-19 to 1.5e-48)”.
(6) How to validate predicted DBSs? Validation faces these issues. (a) DBDs are predicted on the genome level, but target transcripts are expressed in different tissues and cells. So, no single transcriptomic dataset can validate all predicted DBSs of a lncRNA. No matter using what techniques and what cells, only a small portion of predicted DBSs can be experimentally captured (validated). (b) The resolution of current experimental techniques is limited; thus, experimentally identified DBSs (i.e., “peaks”) are much longer than computationally predicted DBSs. (c) Experimental results contain false positives and false negatives. So, validation (or performance evaluation) should also consider the ROC curves (Wen et al. 2022).
(7) As explained above, a long DBS may have a lower binding affinity than a short DBS. A biological interpretation is that the long DBS may accumulate mutations that decrease its binding ability gradually.
There is also a strong assumption that identified sites will always be bound (line 100), which I disagree is well-supported by additional evidence (lines 109-125). The authors show that predicted NEAT1 and MALAT1 DBS overlap experimentally validated sites for NEAT1, MALAT1, and MEG3, but this is not done systematically, or genome-wide, so it's hard to know if the examples shown are representative, or a best-case scenario.
(1) We did not make this assumption. Apparently, binding depends on multiple factors, including co-expression of genes and specific cellular context.
(2) On the second issue, “this is not done systematically, or genome-wide”. We did genome-wide but did not show all results (supplementary fig 2 shows three genomic regions, which are impressively good). In Wen et al. 2022, we describe the overall results.
It's also not quite clear how overlapping promoters or TSS are treated - are these collapsed into a single instance when calculating genome-wide significance? If, eg, a gene has five isoforms, and these differ in the 3' UTR but their promoter region contains a DBS, is this counted five times, or one? Since the interaction between the lncRNA and the DBS happens at the DNA level, it seems like not correcting for this uneven distribution of transcripts is likely to skew results, especially when testing against genome-wide distributions, eg in the results presented in sections 5 and 6. I do not think that comparing genes and transcripts putatively bound by the 40 HS lncRNAs to a random draw of 10,000 lncRNA/gene pairs drawn from the remaining ~13500 lncRNAs that are not HS is a fair comparison. Rather, it would be better to do many draws of 40 non-HS lncRNAs and determine an empirical null distribution that way, if possible actively controlling for the overall number of transcripts (also see the following point).
(1) We predicted DBSs in the promoter region of 179128 Ensembl-annotated transcripts and did not merge DBSs (there is no need to merge them). If multiple transcripts share the same TSS, they may share the same DBS, which is natural.
(2) If the DBSs of multiple transcripts of a gene overlap, the overlap does not raise a problem for lncRNA/DNA binding analysis in specific tissues because usually only one transcript is expressed in a tissue. Therefore, there is no such situation “If, e.g., a gene has five isoforms, and these differ in the 3' UTR but their promoter region contains a DBS, is this counted five times, or one?”
(3) It is unclear to us what “it seems like not correcting for this uneven distribution of transcripts is likely to skew results” means. Regarding testing against genome-wide distributions, statistically, it is beneficial to make many rounds of random draws genome-wide, but this will take a huge amount of time. Since more variables demand more rounds of drawing, to our knowledge, this is not widely practiced in large-scale transcriptomic data analyses.
(4) If the difference (result) is small thus calls for rigorous statistical testing, making many rounds of random draws genome-wide is necessary. In our results, “45% of these pairs show a significant expression correlation in specific tissues (Spearman's |rho| >0.3 and FDR <0.05). In contrast, when randomly sampling 10000 pairs of lncRNAs and protein-coding transcripts genome-wide, the percent of pairs showing this level of expression correlation (Spearman's |rho| >0.3 and FDR <0.05) is only 2.3%”.
Thresholds for statistical testing are not consistent, or always well justified. For instance, in line 142 GO testing is performed on the top 2000 genes (according to different rankings), but there's no description of the background regions used as controls anywhere, or of why 2000 genes were chosen as a good number to test? Why not 1000, or 500? Are the results overall robust to these (and other) thresholds? Then line 190 the threshold for downstream testing is now the top 20% of genes, etc. I am not opposed to different thresholds in principle, but they should be justified.
(1) We used the g:Profiler program to perform over-representation analysis to identify enriched GO terms. This analysis is used to determine what pre-defined gene sets (GO terms) are more present (over-represented) in a list of “interesting” genes than what would be expected by chance. Specifically, this analysis is often used to examine whether the majority of genes in a pre-defined gene set fall in the extremes of a list: the top and bottom of the list, for example, may correspond to the largest differences in expression between the two cell types. g:Profiler always takes the whole genome as the reference; that is why we did not mention the whole genome reference. We now add in section 2.2 “(with the whole genome as the reference)”.
(2) Why choosing 2000 but not 2500 genes is somewhat subjective. We now explain that “About 5% of genes have significant sequence differences in humans and chimpanzees, but more show expression differences due to regulatory sequences. We sorted target genes by their DBS affinity and, to be prudential, chose the top 2000 genes (DBS length>252 bp and binding affinity>151) and bottom 2000 genes (DBS length<60 bp but binding affinity>36) to conduct over-representation analysis”.
Likewise, comparing Tajima's D values near promoters to genome-wide values is unfair, because promoters are known to be under strong evolutionary constraints relative to background regions; as such it is not surprising that the results of this comparison are significant. A fairer comparison would attempt to better match controls (eg to promoters without HS lncRNA DBS, which I realise may be nearly impossible), or generate empirical p-values via permutation or simulation.
We used these tests to detect selection signals in DBSs but not in the whole promoter regions. Using promoters without HS lncRNA DBS as the control also has risks because promoter regions contain other kinds of regulatory sequences.
There are huge differences in the comparisons between the Vindija and Altai Neanderthal genomes that to me suggest some sort of technical bias or the such is at play here. e.g. line 190 reports 1256 genes to have a high distance between the Altai Neanderthal and modern humans, but only 134 Vindija genes reach the same threshold of 0.034. The temporal separation between the two specimens does not seem sufficient to explain this difference, nor the difference between the Altai Denisovan and Neanderthal results (2514 genes for Denisovan), which makes me wonder if it is a technical artefact relating to the quality of the genome builds? It would be worth checking.
We feel it is hard to know whether or not the temporal separation between these specimens is sufficient to explain the differences because many details of archaic humans and their genomes remain unknown and because mechanisms determining genotype-phenotype relationships remain poorly known. After 0.034 was determined, these numbers of genes were determined accordingly. We chose parameters and thresholds that best suit the most important requirements, but these parameters and thresholds may not best suit other requirements; this is a problem for all large-scale studies.
Inferring evolution: There are some points of the manuscript where the authors are quick to infer positive selection. I would caution that GTEx contains a lot of different brain tissues, thus finding a brain eQTL is a lot easier than finding a liver eQTL, just because there are more opportunities for it. Likewise, claims in the text and in Tables 1 and 2 about the evolutionary pressures underlying specific genes should be more carefully stated. The same is true when the authors observe high Fst between groups (line 515), which is only one possible cause of high Fst - population differentiation and drift are just as capable of giving rise to it, especially at small sample sizes.
(1) We add in Discussion that “Finally, not all detected signals reliably indicate positive selection”.
(2) Our results are that more signals are detected in CEU and CHB than in YRI; this agrees all population genetics studies and implies that our results are not wrongly biased because more samples and larger samples were obtained from CEU and CHB.
-
-
-
Author Response
The following is the authors’ response to the original reviews.
We thank the two reviewers very much for their careful review and valuable comments. Upon these comments, the following revisions have been made. First, we have performed a new analysis on human accelerated regions (HARs) recently reported by the Zoonomia Project. Second, we have presented more data on experimentally detected and computationally predicted DBSs of MALAT1, NEAT1, and MEG3. Third, we have added details on the RNA-seq data processing and subsequent differential expression testing to the Materials and Methods section. Fourth, we have clarified some details on the human ancestor sequence and the use of parameters and thresholds. Six new citations are added. In addition, we have also carefully polished the main text. We hope these revisions, …
Author Response
The following is the authors’ response to the original reviews.
We thank the two reviewers very much for their careful review and valuable comments. Upon these comments, the following revisions have been made. First, we have performed a new analysis on human accelerated regions (HARs) recently reported by the Zoonomia Project. Second, we have presented more data on experimentally detected and computationally predicted DBSs of MALAT1, NEAT1, and MEG3. Third, we have added details on the RNA-seq data processing and subsequent differential expression testing to the Materials and Methods section. Fourth, we have clarified some details on the human ancestor sequence and the use of parameters and thresholds. Six new citations are added. In addition, we have also carefully polished the main text. We hope these revisions, together with the Responses-to-Reviewers, would help the reader better get the information from the paper.
eLife assessment
In this valuable manuscript, the authors attempt to examine the role of long non-coding RNAs (lncRNAs) in human evolution, through a set of population genetics and functional genomics analyses that leverage existing datasets and tools. Although the methods are at times inadequate - for example, suitable methods and/or relevant controls are lacking at many points, and selection is inferred sometimes too quickly - the results nonetheless point towards a possible contribution of long non-coding RNAs to the evolution of human biology and they suggest clear directions for future, more rigorous study.
Public Reviews:
Reviewer #1 (Public Review):
Summary
While DNA sequence divergence, differential expression, and differential methylation analysis have been conducted between humans and the great apes to study changes that "make us human", the role of lncRNAs and their impact on the human genome and biology has not been fully explored. In this study, the authors computationally predict HSlncRNAs as well as their DNA Binding sites using a method they have developed previously and then examine these predicted regions with different types of enrichment analyses. Broadly, the analysis is straightforward and after identifying these regions/HSlncRNAs the authors examined their effects using different external datasets.
Strengths/weaknesses
By and large, the analysis performed is dependent on their ability to identify HSlncRNAs and their DBS. I think that they have done a good job of showing the performance metrics of their methods in previous publications. Thereafter, they perform a series of enrichment-type analyses that have been used in the field for quite a while now to look at tissue-specific enrichment, or region-specific enrichment, or functional enrichment, and I think these have been carried out well. The authors achieved the aims of their work. I think one of the biggest contributions that this paper brings to the field is their annotation of these HSlncRNAs. Thus a major revisionary effort could be spent on applying their method to the latest genomes that have been released so that the community could get a clean annotation of newly identified HSlncRNAs (see comment 2).
Comments
- Though some of their results about certain HSlncRNAs having DBSs in all genes is rather surprising/suspicious, I think that broadly their process to identify and validate DBSs is robust, they have multiple lines of checks to identify such regions, including functional validation. These predictions are bound to have some level of false positive/negative rate and it might be nice to restate those here and on what experiment/validation data these were conducted. However, the rest of their analysis comprises different types of enrichment analysis which shouldn't be affected by outlier HSlncRNAs if indeed their FPR/FNR are low.
- There are now several new genomes available as part of the Zoonomia consortium and 240 Primate consortium papers released. These papers have re-examined some annotations such as Human Accelerated Regions (HARs) and found with a larger dataset as well as better reference genomes, that a large fraction of HARs were actually incorrectly annotated - that is that they were also seen in other lineages outside of just the great apes. If these papers have not already examined HSlncRNAs, the authors should try and re-run the computational predictions with this updated set and then identify HSlncRNAs there. This might help to clarify their signal and remove lncRNAs that might be present in other primates but are somehow missing in the great apes. This might also help to mitigate some results that they see in section 3 of their paper in comparing DBS distances between archaics and humans.
Responses:
(1) Thanks for the good suggestion. We have checked the Zoonomia reported genomes and found that new primate genomes are monkeys and lemurs but not apes (Zoonomia Consortium. Nature 2023. https://doi.org/10.1038/s41586-020-2876-6), and the phylogenetic relationships between monkeys and humans are much more remote than those between apes and humans. In addition, the Zoonomia project did target identifying new lncRNA genes.
(2) We have examined the Zoonomia-reported HARs (Keough et al. Science 2023. DOI: 10.1126/science.abm1696). Of the 312 HARs reported by Keough et al, 8 overlap 26 DBSs of 14 HS lncRNAs; moreover, DBSs greatly outnumber HARs, suggesting that HAR and DBS are different sequences with different functions.
(3) In the revised manuscript, a new paragraph (the second one) has been added to the section “HS lncRNAs regulate diverse genes and transcripts” to describe the HAR analysis result.
- The differences between the archaic hominins in their DBS distances to modern humans are a bit concerning. At some level, we expect these to be roughly similar when examining African modern humans and perhaps the Denisovan being larger when examining Europeans and Asians, but they seem to have distances that aren't expected given the demography. In addition, from their text for section 3, they begin by stating that they are computing two types of distances but then I lost track of which distance they were discussing in paragraph 3 of section 3. Explicitly stating which of the two distances in the text would be helpful for the reader.
Responses:
(1) Upon the archaic human genomes, the genomic distances from the three modern humans are shorter to Denisovan than to Altai Neanderthal; however, upon the related studies we cite, the phylogenetic relationship between the three modern humans is more remote to Denisovan than to Altai Neanderthal. Thus, the finding that 2514 and 1256 DBSs have distances >0.034 in Denisovans and Altai Neanderthals is not unreasonable. The numbers of DBSs, of course, depend on the cutoff of 0.034, which is somewhat subjective but not unreasonable.
(2) The second paragraph is added to the Discussion, discussing parameters and cutoffs.
(3) Regarding the two types of distance, the distances computed in the first way were not further analyzed because, as we note, “This anomaly may be caused by that the human ancestor was built using six primates without archaic humans”.
- Isn't the correct control to examine whether eQTLs are more enriched in HSlncRNA DBSs a set of transcription factor binding sites? I don't think using just promoter regions is a reasonable control here. This does not take away from the broader point however that eQTLs are found in DBSs and I think they can perform this alternate test.
Responses:
Indeed, TFBSs are more comparable to DBSs than promoters. However, many more methods have been developed to predict TFBSs than to predict DBSs, making us concerned about TFBS prediction's reliability. Since most QTLs in DBSs are mQTLs (Supplementary Table 13), but many QTLs in TFBSs are eQTLs (Flynn et al. PLoS Genetics 2021. DOI: 10.1371/journal.pgen.1009719), it is pretty safe to conclude that DBSs are enriched in mQTLs.
- In the Discussion, they highlight the evolution of sugar intake, which I'm not sure is appropriate. This comes not from GO enrichment but rather from a few genes that are found at the tail of their distribution. While these signals may be real, the evolution of traits is often highly polygenic and they don't see this signal in their functional enrichment. I suggest removing that line. Moreover, HSlncRNAs are ones that are unique across a much longer time frame than the transition to agriculture which is when sugar intake rose greatly. Thus, it's unlikely to see enrichment for something that arose in the past 6000-7000 years would in the annotation that is designed to detect human-chimp or human-neanderthal level divergence.
Responses:
(1) The Discussion on human adaptation to high sugar intake is based on both enriched GO terms (Supplementary Table 4, 7) and a set of genes in modern humans with the most SNP-rich DBSs (Table 2). These glucose-related GO terms are not at the tail of the list because, of the 614 enriched GO terms (enriched in genes with strongest DBSs), glucose metabolism-related ones are ranked 208, 212, 246, 264, 504, 522, 591, and of the 409 enriched GO terms (enriched in the top 1256 genes in Altai Neanderthals), glucose metabolism-related ones are ranked 152 and 217.
(2) Indeed, there are other top-ranked enriched GO terms; some (e.g., neuron projection development (GO:0031175) and cell projection morphogenesis (GO:0048858)) have known impact on human evolution, but the impact of others (e.g., cell junction organization (GO:0034330)) remain unclear. We specifically report human adaptation to high sugar intake because the DBSs in related genes show differences in modern humans (Table 2).
Reviewer #2 (Public Review):
Lin et al attempt to examine the role of lncRNAs in human evolution in this manuscript. They apply a suite of population genetics and functional genomics analyses that leverage existing data sets and public tools, some of which were previously built by the authors, who clearly have experience with lncRNA binding prediction. However, I worry that there is a lack of suitable methods and/or relevant controls at many points and that the interpretation is too quick to infer selection. While I don't doubt that lnc RNAs contribute to the evolution of modern humans, and certainly agree that this is a question worth asking, I think this paper would benefit from a more rigorous approach to tackling it.
At this point, my suggestions are mostly focused on tightening and strengthening the methods; it is hard for me to predict the consequence of these changes on the results or their interpretation, but as a general rule I also encourage the authors to not over-interpret their conclusions in terms of what phenotype was selected for when as they do at certain points (eg glucose metabolism).
Responses:
(1) Now, we use more cautious wording to describe the results.
(2) A paragraph (the second one) is added to Discussion to explain parameters and cutoffs.
(3) We make the caution at the end of the third paragraph that “We note that these are findings instead of conclusions, and they indicate, suggest, or support something revealing the primary question of what genomic differences critically determine the phenotypic differences between humans and apes and between modern and archaic humans”.
I note some specific points that I think would benefit from more rigorous approaches, and suggest possible ways forward for these.
- Much of this work is focused on comparing DNA binding domains in human-unique long-noncoding RNAs and DNA binding sites across the promoters of genes in the human genome, and I think the authors can afford to be a bit more methodical/selective in their processing and filtering steps here. The article begins by searching for orthologues of human lncRNAs to arrive at a set of 66 human-specific lncRNAs, which are then characterised further through the rest of the manuscript. Line 99 describes a binding affinity metric used to separate strong DBS from weak DBS; the methods (line 432) describe this as being the product of the DBS or lncRNA length times the average Identity of the underlying TTSs. This multiplication, in fact, undoes the standardising value of averaging and introduces a clear relationship between the length of a region being tested and its overall score, which in turn is likely to bias all downstream inference, since a long lncRNA with poor average affinity can end up with a higher score than a short one with higher average affinity, and it's not quite clear to me what the biological interpretation of that should be. Why was this metric defined in this way?
Responses:
(1) Binding affinity and length of all DBSs of HS lncRNAs are given in Supplementary Table 2 and 3. Since a triplex (say, 100 bp in length) may have 50% or 70% of nucleotides bound, it is necessary to differentiate binding affinity and length, and the two measures can differentiate DBSs of the same length but with different binding affinity and DBSs with the same binding affinity but different length.
(2) Differentiating DBSs into strong and weak ones is somewhat subjective, accurately differentiating them demands experimental data that are currently unavailable, and it is advisable to separately analyze strong and weak DBSs because they may likely influence different aspects of human evolution.
- There is also a strong assumption that identified sites will always be bound (line 100), which I disagree is well-supported by additional evidence (lines 109-125). The authors show that predicted NEAT1 and MALAT1 DBS overlap experimentally validated sites for NEAT1, MALAT1, and MEG3, but this is not done systematically, or genome-wide, so it's hard to know if the examples shown are representative, or a best-case scenario.
Responses:
(1) We do not assume/think that identified sites will always be bound. Instead, lncRNA/DBS binding is highly context-dependent (including tissue-specific).
(2) An extra supplementary table (Supplementary Table 15) is added to show what predicted DBSs overlap experimentally detected DBSs for NEAT1, MALAT1, and MEG3. By the way, it is more accurate to say “experimentally detected” than “experimentally validated”, because experimental data have true/false positives and true/false negatives, and different sequencing protocols (for detecting lncRNA/DNA binding) may generate somewhat different results.
It's also not quite clear how overlapping promoters or TSS are treated - are these collapsed into a single instance when calculating genome-wide significance? If, eg, a gene has five isoforms, and these differ in the 3' UTR but their promoter region contains a DBS, is this counted five times, or one? Since the interaction between the lncRNA and the DBS happens at the DNA level, it seems like not correcting for this uneven distribution of transcripts is likely to skew results, especially when testing against genome-wide distributions, eg in the results presented in sections 5 and 6. I do not think that comparing genes and transcripts putatively bound by the 40 HS lncRNAs to a random draw of 10,000 lncRNA/gene pairs drawn from the remaining ~13500 lncRNAs that are not HS is a fair comparison. Rather, it would be better to do many draws of 40 non-HS lncRNAs and determine an empirical null distribution that way, if possible actively controlling for the overall number of transcripts (also see the following point).
Responses:
(1) We analyzed each and every GENCODE-annotated transcript (Supplementary Table 2). For example, if a gene has N TSS and N transcripts, DBSs are predicted in N promoter regions. When analyzing gene expression in tissues, each and every transcript is analyzed.
(2) Ideally, it would be better to do many draws, but statistically, a huge number is needed due to the number of total genes in the human genome.
(3) We feel that doing many draws of 40 non-HS lncRNAs and determining an empirical null distribution is not as straightforward as comparing HS lncRNA-target transcript pairs (45% show significant expression correlation) with random lncRNA-random transcript pairs (2.3% show significant expression correlation).
- Thresholds for statistical testing are not consistent, or always well justified. For instance, in line 142 GO testing is performed on the top 2000 genes (according to different rankings), but there's no description of the background regions used as controls anywhere, or of why 2000 genes were chosen as a good number to test? Why not 1000, or 500? Are the results overall robust to these (and other) thresholds? Then line 190 the threshold for downstream testing is now the top 20% of genes, etc. I am not opposed to different thresholds in principle, but they should be justified.
Responses:
(1) The over-representation analysis using g:Profiler was applied to the top and bottom 2000 genes with the whole genome as the background. The number “2000” was chosen somewhat subjectively. If more or fewer genes were chosen, more or fewer enriched GO terms would be identified, but GO terms with adjusted P-values <0.05 would be quite stable.
(2) A paragraph (the second one) is added to the Discussion to explain parameters and cutoffs.
Likewise, comparing Tajima's D values near promoters to genome-wide values is unfair, because promoters are known to be under strong evolutionary constraints relative to background regions; as such it is not surprising that the results of this comparison are significant. A fairer comparison would attempt to better match controls (eg to promoters without HS lncRNA DBS, which I realise may be nearly impossible), or generate empirical p-values via permutation or simulation.
Responses:
We examined Tajima’s D in DBSs (Supplementary Figure 9) and in HS lncRNA genes (Supplementary Figure 18). We compared the Tajima’s D values with the genome-wide background in both cases.
- There are huge differences in the comparisons between the Vindija and Altai Neanderthal genomes that to me suggest some sort of technical bias or the such is at play here. e.g. line 190 reports 1256 genes to have a high distance between the Altai Neanderthal and modern humans, but only 134 Vindija genes reach the same cutoff of 0.034. The temporal separation between the two specimens does not seem sufficient to explain this difference, nor the difference between the Altai Denisovan and Neanderthal results (2514 genes for Denisovan), which makes me wonder if it is a technical artefact relating to the quality of the genome builds? It would be worth checking.
Responses:
(1) The cutoff of 0.034 was chosen upon that DBSs in the top 20% (4248) genes in chimpanzees have distances larger than this cutoff, and accordingly, 4248, 1256, 2514, and 134 genes have DBSs distances >0.034 in chimpanzees, Altai Neanderthals, Denisovans, and Vindija Neanderthals. These numbers of genes qualitatively agree with the phylogenetic distances from chimpanzees, archaic humans to modern humans. If a percentage larger or smaller than 20% (e.g., 10% or 30%) is chosen, and so is a cutoff X, the numbers of genes with DBSs distance >X would not be 4248, 1256, 2514, and 134, but could still qualitatively agree with the phylogenetic distances from chimpanzees, archaic humans to modern humans.
(2) The second paragraph in the Discussion now explains the parameters and cutoffs.
- Inferring evolution: There are some points of the manuscript where the authors are quick to infer positive selection. I would caution that GTEx contains a lot of different brain tissues, thus finding a brain eQTL is a lot easier than finding a liver eQTL, just because there are more opportunities for it. Likewise, claims in the text and in Tables 1 and 2 about the evolutionary pressures underlying specific genes should be more carefully stated. The same is true when the authors observe high Fst between groups (line 515), which is only one possible cause of high Fst - population differentiation and drift are just as capable of giving rise to it, especially at small sample sizes.
Responses:
(1) We analyzed brain tissues separately instead of taking the whole brain as a tissue, see Supplementary Table 12 and Figure 3.
(2) We make the caution at the end of the third paragraph that “We note that these are findings instead of conclusions, and they indicate, suggest, or support something revealing the primary question of what genomic differences critically determine the phenotypic differences between humans and apes and between modern and archaic humans”.
Reviewer #1 (Recommendations For The Authors):
Some figures are impossible to see/read so I wasn't able to evaluate them - Fig, 1B, 1E, 1F are small and blurry.
Responses:
High-quality figures are provided.
Typo in line 178: in these archaic humans, the distances of HS lncRNAs are smaller than the distances of DBSs.
Responses:
This is not a typo. We use “distance per base” to measure whether HS lncRNAs or their DBSs have evolved more from archaic humans to modern humans. See also Supplementary Note 4 and 5.
Reviewer #2 (Recommendations For The Authors):
- There's some inconsistency in the genome builds and the database versions used, eg, sometimes panTro4 is used and sometimes panTro5 (line 456). Likewise, the version of GENCODE used is very old (18), the current version is 43. The current version contains 19928 lncRNAs, which is a big difference relative to what is being tested!
Responses:
(1) panTro4 was used to search orthologues of human lncRNAs; this time-consuming work started several years ago when the version of GENCODE was V18 (see Lin et al., 2019).
(2) Regarding “the version of GENCODE used is very old (V18)”, we have later examined the 4396 human lncRNAs reported in GENCODE V36 and found that the set of 66 HS lncRNAs remains the same.
(3) The counterparts of HS lncRNAs’ DBSs in chimpanzees were predicted recently using panTro5.
- Table 1: What does 'mostly' mean in this context? I understand that it refers to sequence differences between humans and the other genomes, but what is the actual threshold, and how is it defined?
Responses:
The title of Table 1 is “Genes with strongest DBSs and mostly changed sequence distances from modern humans to archaic humans and chimpanzees”. Instead of using two cutoffs, choosing genes with the two features seems easy and sensible.
- Line 117: The methods do not include information on the RNA-seq data processing and subsequent DE testing.
Responses:
The details are added to the section “Experimentally validating DBS predictiom” (The reads were aligned to the human GRCh38 genome using Hiasat2 (Kim et al., 2019), and the resulting sam files were converted to bam files using Samtools (Li et al., 2009). Stringtie was used to quantify gene expression level (Pertea et al., 2015). Fold change of gene expression was computed using the edgeR package (Robinson et al., 2010), and significant up- and down-regulation of target genes after DBD knockout was determined upon |log2(fold change)| > 1 with FDR < 0.1).
- Line 180: I looked at the EPO alignment and it's not clear to me what 'human ancestor' means, but it may well explain the issues the authors have with calculating distances (I agree those numbers are weird). Is it the reconstructed ancestral state of humans at around 300-200,000 years ago (coalescence of most human uniparental lineages), or the inferred sequence of the human-chimpanzee most recent common ancestor? If it's the former, it's not surprising it skews results towards shorter distances for modern humans, since the tree distance from that point to archaic hominins is significantly larger than to modern humans.
Responses:
The “human ancestor” is constructed by the EBI team upon the genomes of six primates in the Ensembl website. We find that the reconstructed ancestral state of humans may be unlikely around 300,000-200,000 years, and may be much earlier. We also find that many DNA sequences of the “human ancestor” are low-confidence calls (i.e., the ancestral states are supported by only one primate’s sequence).
- Line 221: SNP-rich DBS: Is this claim controlled for the length of the DBS?
Responses:
No. Long DBSs tend to have more SNPs. When comparing the same DBS in modern humans, archaic humans, and chimpanzees, both the length and SNP number reflect evolution, so it is not necessary to control for the length.
- Given that GTEx is primarily built off short-read data and it is impossible to link binding of a lncRNA to a DBS with its impact with a specific transcript
Responses:
As written in the section “Examining the tissue-specific impact of HS lncRNA-regulated gene expression”, we calculated the pairwise Spearman's correlation coefficient between the expression of an HS lncRNA (the representative transcript, median TPM value > 0.1) and the expression of each of its target transcripts (median TPM value > 0.1) using the scipy.stats.spearmanr program in the scipy package. The expression of an HS lncRNA gene and a target transcript was considered to be significantly correlated if the |Spearman's rho| > 0.3, with Benjamini-Hochberg FDR < 0.05.
- Line 429: should TTO be TFO?
Responses:
Here TTO should be TFO; the typo is corrected.
- Methods, section 7: Some of the text in this section should perhaps be moved to the results section?
Responses:
Each of the two paragraphs in Methods’ section 7 is quite large, and some contents in Supplementary Notes are also very relevant. Thus, moving them to the Results section could make the Results too lengthy and specific.
- Line 587: GTEx is built from samples of primarily European ancestry and has poor representation of African ancestry and negligible representation of Asian ancestry (see the GTEx v8 paper supplement). This means that it is basically impossible to find a non-European population-specific eQTL in GTEx, which in turn impacts these results.
Responses:
(1) Indeed, this is a serious issue of data analysis, and this issue cannot be solved until more Africans are sequenced.
(2) Anyway, one can still find considerable African-specific eQTLs in GTEx, such as rs28540058 (with frequency of 0, 0, 0.13 in CEU, CHB, YRI) and rs58772997 (with frequency of 0, 0, 0.12 in CEU, CHB, YRI (see Supplementary Table12 and Supplementary Figure 22).
-
eLife assessment
This valuable study uses population and functional genomics to examine long non-coding RNAs (lncRNAs) in the context of human evolution. Computational prediction of human-specific lncRNAs and their DNA binding sites and analyses of these loci lead to the development of hypotheses regarding the potential roles of these genetic elements in human biology. The evidence supporting the conclusions is, however, still incomplete, as key details regarding the methodology and analyses are lacking.
-
Reviewer #1 (Public Review):
Summary
While DNA sequence divergence, differential expression, and differential methylation analysis have been conducted between humans and the great apes to study changes that "make us human", the role of lncRNAs and their impact on the human genome and biology has not been fully explored. In this study, the authors computationally predict HSlncRNAs as well as their DNA Binding sites using a method they have developed previously and then examine these predicted regions with different types of enrichment analyses. Broadly, the analysis is straightforward and after identifying these regions/HSlncRNAs the authors examined their effects using different external datasets.I no longer have any concerns about the manuscript as the authors have addressed my comments in the first round of review.
-
Reviewer #2 (Public Review):
Lin et al attempt to examine the role of lncRNAs in human evolution in this manuscript. They apply a suite of population genetics and functional genomics analyses that leverage existing data sets and public tools, some of which were previously built by the authors, who clearly have experience with lncRNA binding prediction. However, I worry that there is a lack of suitable methods and/or relevant controls at many points and that the interpretation is too quick to infer selection. While I don't doubt that lnc RNAs contribute to the evolution of modern humans, and certainly agree that this is a question worth asking, I think this paper would benefit from a more rigorous approach to tackling it.
I thank the authors for their revisions to the manuscript; however, I find that the bulk of my comments have not been …
Reviewer #2 (Public Review):
Lin et al attempt to examine the role of lncRNAs in human evolution in this manuscript. They apply a suite of population genetics and functional genomics analyses that leverage existing data sets and public tools, some of which were previously built by the authors, who clearly have experience with lncRNA binding prediction. However, I worry that there is a lack of suitable methods and/or relevant controls at many points and that the interpretation is too quick to infer selection. While I don't doubt that lnc RNAs contribute to the evolution of modern humans, and certainly agree that this is a question worth asking, I think this paper would benefit from a more rigorous approach to tackling it.
I thank the authors for their revisions to the manuscript; however, I find that the bulk of my comments have not been addressed to my satisfaction. As such, I am afraid I cannot say much more than what I said last time, emphasising some of my concerns with regards to the robustness of some of the analyses presented. I appreciate the new data generated to address some questions, but think it could be better incorporated into the text - not in the discussion, but in the results.
-
-
Author Response
Reviewer #1 (Public Review):
Summary
While DNA sequence divergence, differential expression, and differential methylation analysis have been conducted between humans and the great apes to study changes that "make us human", the role of lncRNAs and their impact on the human genome and biology has not been fully explored. In this study, the authors computationally predict HSlncRNAs as well as their DNA Binding sites using a method they have developed previously and then examine these predicted regions with different types of enrichment analyses. Broadly, the analysis is straightforward and after identifying these regions/HSlncRNAs the authors examined their effects using different external datasets.
Strengths/weaknesses
By and large, the analysis performed is dependent on their ability to identify HSlncRNAs and …
Author Response
Reviewer #1 (Public Review):
Summary
While DNA sequence divergence, differential expression, and differential methylation analysis have been conducted between humans and the great apes to study changes that "make us human", the role of lncRNAs and their impact on the human genome and biology has not been fully explored. In this study, the authors computationally predict HSlncRNAs as well as their DNA Binding sites using a method they have developed previously and then examine these predicted regions with different types of enrichment analyses. Broadly, the analysis is straightforward and after identifying these regions/HSlncRNAs the authors examined their effects using different external datasets.
Strengths/weaknesses
By and large, the analysis performed is dependent on their ability to identify HSlncRNAs and their DBS. I think that they have done a good job of showing the performance metrics of their methods in previous publications. Thereafter, they perform a series of enrichment-type analyses that have been used in the field for quite a while now to look at tissue-specific enrichment, or region-specific enrichment, or functional enrichment, and I think these have been carried out well. The authors achieved the aims of their work. I think one of the biggest contributions that this paper brings to the field is their annotation of these HSlncRNAs. Thus a major revisionary effort could be spent on applying their method to the latest genomes that have been released so that the community could get a clean annotation of newly identified HSlncRNAs (see comment 2).
Comments
- Though some of their results about certain HSlncRNAs having DBSs in all genes is rather surprising/suspicious, I think that broadly their process to identify and validate DBSs is robust, they have multiple lines of checks to identify such regions, including functional validation. These predictions are bound to have some level of false positive/negative rate and it might be nice to restate those here and on what experiment/validation data these were conducted. However, the rest of their analysis comprises different types of enrichment analysis which shouldn't be affected by outlier HSlncRNAs if indeed their FPR/FNR are low.
- There are now several new genomes available as part of the Zoonomia consortium and 240 Primate consortium papers released. These papers have re-examined some annotations such as Human Accelerated Regions (HARs) and found with a larger dataset as well as better reference genomes, that a large fraction of HARs were actually incorrectly annotated - that is that they were also seen in other lineages outside of just the great apes. If these papers have not already examined HSlncRNAs, the authors should try and re-run the computational predictions with this updated set and then identify HSlncRNAs there. This might help to clarify their signal and remove lncRNAs that might be present in other primates but are somehow missing in the great apes. This might also help to mitigate some results that they see in section 3 of their paper in comparing DBS distances between archaics and humans.
- The differences between the archaic hominins in their DBS distances to modern humans are a bit concerning. At some level, we expect these to be roughly similar when examining African modern humans and perhaps the Denisovan being larger when examining Europeans and Asians, but they seem to have distances that aren't expected given the demography. In addition, from their text for section 3, they begin by stating that they are computing two types of distances but then I lost track of which distance they were discussing in paragraph 3 of section 3. Explicitly stating which of the two distances in the text would be helpful for the reader.
(1) According to Figure 1A (according actually to Meyer et al., 2012, Prufer et al., 2017, and Prüfer et al., 2013), the phylogenetic distance from modern humans to Denisovan is shorter than the distance to Altai Neanderthal. However, also according to these studies, the branch of Denisovan is more remote to modern humans than Altai Neanderthal. Thus, it is not unreasonable to find that 2514 and 1256 DBSs have distances > 0.034 in genes in Denisovans and Altai Neanderthals, respectively. Probably, both the phylogenetic distances and DBS distances depend considerably on the sampled genomes of Altai and Denisovan who lived on the earth for quite long. When new samples are obtained, these distances may be somewhat changed.
(2) Regarding “they are computing two types of distances but then I lost track of which distance they were discussing in paragraph 3 of section 3”, the second type of distances were discussed in section 3, and the distances computed in the first way were not further analyzed because “This defect may be caused by that the human ancestor was built using six primates without archaic humans”.
- Isn't the correct control to examine whether eQTLs are more enriched in HSlncRNA DBSs a set of transcription factor binding sites? I don't think using just promoter regions is a reasonable control here. This does not take away from the broader point however that eQTLs are found in DBSs and I think they can perform this alternate test.
Indeed, the TFs-TFBSs and lncRNAs-DBSs relationships are comparable, and which one contains more QTLs is an interesting question. In this sense, it is reasonable to use TFBSs as the control. However, for three reasons, we did not perform the comparison and use TFBSs as the control. First, most TFBSs are predicted by varied methods, making us concern the reliability of comparing two sets of predictions. Second, most QTLs in DBSs are mQTLs but most QTLs in TFBSs are eQTLs. Third, probably a greater portion of TFBSs than DBSs are not in promoters, and the time consumption of LongTarget made us unable to predict DBSs truly genome-wide. Nevertheless, this is an interesting question deserving further exploring.
- In the discussion, they highlight the evolution of sugar intake, which I'm not sure is appropriate. This comes not from GO enrichment but rather from a few genes that are found at the tail of their distribution. While these signals may be real, the evolution of traits is often highly polygenic and they don't see this signal in their functional enrichment. I suggest removing that line. Moreover, HSlncRNAs are ones that are unique across a much longer time frame than the transition to agriculture which is when sugar intake rose greatly. Thus, it's unlikely to see enrichment for something that arose in the past 6000-7000 years would in the annotation that is designed to detect human-chimp or human-neanderthal level divergence.
Multiple sugar metabolism-related pathways, including “glucose homeostasis” and “glucose metabolic process”, are found to be enriched only in Altai Neanderthal but not in chimpanzees (Figure 2). Indeed, HS lncRNAs are across a much longer time frame than the transition to agriculture. However, given that apes and monkeys know picking the ripe, sugar-rich fruits at the right time and place, we conjecture that archaic humans as hunter-gatherer could effectively explore natural sugars.
Reviewer #2 (Public Review):
Lin et al attempt to examine the role of lncRNAs in human evolution in this manuscript. They apply a suite of population genetics and functional genomics analyses that leverage existing data sets and public tools, some of which were previously built by the authors, who clearly have experience with lncRNA binding prediction. However, I worry that there is a lack of suitable methods and/or relevant controls at many points and that the interpretation is too quick to infer selection. While I don't doubt that lnc RNAs contribute to the evolution of modern humans, and certainly agree that this is a question worth asking, I think this paper would benefit from a more rigorous approach to tackling it.
At this point, my suggestions are mostly focused on tightening and strengthening the methods; it is hard for me to predict the consequence of these changes on the results or their interpretation, but as a general rule I also encourage the authors to not over-interpret their conclusions in terms of what phenotype was selected for when as they do at certain points (eg glucose metabolism).
I note some specific points that I think would benefit from more rigorous approaches, and suggest possible ways forward for these.
- Much of this work is focused on comparing DNA binding domains in human-unique long-noncoding RNAs and DNA binding sites across the promoters of genes in the human genome, and I think the authors can afford to be a bit more methodical/selective in their processing and filtering steps here. The article begins by searching for orthologues of human lncRNAs to arrive at a set of 66 human-specific lncRNAs, which are then characterised further through the rest of the manuscript. Line 99 describes a binding affinity metric used to separate strong DBS from weak DBS; the methods (line 432) describe this as being the product of the DBS or lncRNA length times the average Identity of the underlying TTSs. This multiplication, in fact, undoes the standardising value of averaging and introduces a clear relationship between the length of a region being tested and its overall score, which in turn is likely to bias all downstream inference, since a long lncRNA with poor average affinity can end up with a higher score than a short one with higher average affinity, and it's not quite clear to me what the biological interpretation of that should be. Why was this metric defined in this way?
Length is an important metric of DBS, but it has a defect – a triplex of 100 bp may have 50% or 70% of nucleotides bound; in the two situations, the binding affinity of DBD and DBS is very different.
- There is also a strong assumption that identified sites will always be bound (line 100), which I disagree is well-supported by additional evidence (lines 109-125). The authors show that predicted NEAT1 and MALAT1 DBS overlap experimentally validated sites for NEAT1, MALAT1, and MEG3, but this is not done systematically, or genome-wide, so it's hard to know if the examples shown are representative, or a best-case scenario.
More details are described in the citation Wen et al. 2022. We will put the sites into Supplementary Tables in the revised version.
It's also not quite clear how overlapping promoters or TSS are treated - are these collapsed into a single instance when calculating genome-wide significance? If, eg, a gene has five isoforms, and these differ in the 3' UTR but their promoter region contains a DBS, is this counted five times, or one? Since the interaction between the lncRNA and the DBS happens at the DNA level, it seems like not correcting for this uneven distribution of transcripts is likely to skew results, especially when testing against genome-wide distributions, eg in the results presented in sections 5 and 6. I do not think that comparing genes and transcripts putatively bound by the 40 HS lncRNAs to a random draw of 10,000 lncRNA/gene pairs drawn from the remaining ~13500 lncRNAs that are not HS is a fair comparison. Rather, it would be better to do many draws of 40 non-HS lncRNAs and determine an empirical null distribution that way, if possible actively controlling for the overall number of transcripts (also see the following point).
(1) If, say, three transcripts of a gene share the same promoter region (i.e., they have the same TSS) but differ only in 3’UTR, the promoter region was used to predict DBSs just for once. Otherwise, if the three transcripts have different TSS, the three promoter regions were used to predict DBSs.
(2) A gene may have many DBSs if it has many transcripts, or few ones if it has just a few transcripts. We did not correct for this uneven distribution of transcripts, because our GTEx analysis was on the transcript level; it is well recognized that transcripts of the same gene can be expressed in different tissues.
(3) We randomly sampled a pair of non-HS lncRNA and a transcript for 10000 times (i.e., 10000 pairs). It is a point that multiple draws of 40 non-HS lncRNAs should be made to make the statistics more robust.
- Thresholds for statistical testing are not consistent, or always well justified. For instance, in line 142 GO testing is performed on the top 2000 genes (according to different rankings), but there's no description of the background regions used as controls anywhere, or of why 2000 genes were chosen as a good number to test? Why not 1000, or 500? Are the results overall robust to these (and other) thresholds? Then line 190 the threshold for downstream testing is now the top 20% of genes, etc. I am not opposed to different thresholds in principle, but they should be justified.
The over-representation analysis using g:Profiler was performed taking the whole genome as the background. Analyzing more DBSs (especially weak DBSs) would generate more results, but the results could be less reliable. Thus, there is a trade-off between analyzing fewer DBSs with relatively high reliability and analyzing more DBSs with relatively low reliability. Inevitably, the handling of this trade-off is somewhat subjective, and to carefully compare the two classes of DBSs per can be an independent question. Although weak DBSs were not systematically analyzed, the results from the strong DBSs undoubtedly suggest that HS lncRNAs have contributed greatly to human evolution.
Likewise, comparing Tajima's D values near promoters to genome-wide values is unfair, because promoters are known to be under strong evolutionary constraints relative to background regions; as such it is not surprising that the results of this comparison are significant. A fairer comparison would attempt to better match controls (eg to promoters without HS lncRNA DBS, which I realise may be nearly impossible), or generate empirical p-values via permutation or simulation.
We examined Tajima’s D in DBSs (Supplementary Figure 9) and in HS lncRNA genes (Supplementary Figure 18). In both cases, we compared the Tajima’s D values with the genome-wide background.
- There are huge differences in the comparisons between the Vindija and Altai Neanderthal genomes that to me suggest some sort of technical bias or the such is at play here. e.g. line 190 reports 1256 genes to have a high distance between the Altai Neanderthal and modern humans, but only 134 Vindija genes reach the same cutoff of 0.034. The temporal separation between the two specimens does not seem sufficient to explain this difference, nor the difference between the Altai Denisovan and Neanderthal results (2514 genes for Denisovan), which makes me wonder if it is a technical artefact relating to the quality of the genome builds? It would be worth checking.
We used the same workflow (and the same cutoff 0.034) to analyze Vindija and Altai Neanderthal and Denisovan. If a smaller cutoff was used, one would see more Vindija genes. The question again is that there is a trade-off. Analyzing epigenome and epigenetic regulation in archaic genomes is an interesting direction, and much more studies are needed before more reasonably setting related parameters and cutoffs.
- Inferring evolution: There are some points of the manuscript where the authors are quick to infer positive selection. I would caution that GTEx contains a lot of different brain tissues, thus finding a brain eQTL is a lot easier than finding a liver eQTL, just because there are more opportunities for it. Likewise, claims in the text and in Tables 1 and 2 about the evolutionary pressures underlying specific genes should be more carefully stated. The same is true when the authors observe high Fst between groups (line 515), which is only one possible cause of high Fst - population differentiation and drift are just as capable of giving rise to it, especially at small sample sizes.
-
eLife assessment
In this valuable manuscript, the authors attempt to examine the role of long non-coding RNAs (lncRNAs) in human evolution, through a set of population genetics and functional genomics analyses that leverage existing datasets and tools. Although the methods are at times inadequate - for example, suitable methods and/or relevant controls are lacking at many points, and selection is inferred sometimes too quickly - the results nonetheless point towards a possible contribution of long non-coding RNAs to the evolution of human biology and they suggest clear directions for future, more rigorous study.
-
Reviewer #1 (Public Review):
Summary
While DNA sequence divergence, differential expression, and differential methylation analysis have been conducted between humans and the great apes to study changes that "make us human", the role of lncRNAs and their impact on the human genome and biology has not been fully explored. In this study, the authors computationally predict HSlncRNAs as well as their DNA Binding sites using a method they have developed previously and then examine these predicted regions with different types of enrichment analyses. Broadly, the analysis is straightforward and after identifying these regions/HSlncRNAs the authors examined their effects using different external datasets.Strengths/weaknesses
By and large, the analysis performed is dependent on their ability to identify HSlncRNAs and their DBS. I think that …Reviewer #1 (Public Review):
Summary
While DNA sequence divergence, differential expression, and differential methylation analysis have been conducted between humans and the great apes to study changes that "make us human", the role of lncRNAs and their impact on the human genome and biology has not been fully explored. In this study, the authors computationally predict HSlncRNAs as well as their DNA Binding sites using a method they have developed previously and then examine these predicted regions with different types of enrichment analyses. Broadly, the analysis is straightforward and after identifying these regions/HSlncRNAs the authors examined their effects using different external datasets.Strengths/weaknesses
By and large, the analysis performed is dependent on their ability to identify HSlncRNAs and their DBS. I think that they have done a good job of showing the performance metrics of their methods in previous publications. Thereafter, they perform a series of enrichment-type analyses that have been used in the field for quite a while now to look at tissue-specific enrichment, or region-specific enrichment, or functional enrichment, and I think these have been carried out well. The authors achieved the aims of their work. I think one of the biggest contributions that this paper brings to the field is their annotation of these HSlncRNAs. Thus a major revisionary effort could be spent on applying their method to the latest genomes that have been released so that the community could get a clean annotation of newly identified HSlncRNAs (see comment 2).Comments
Though some of their results about certain HSlncRNAs having DBSs in all genes is rather surprising/suspicious, I think that broadly their process to identify and validate DBSs is robust, they have multiple lines of checks to identify such regions, including functional validation. These predictions are bound to have some level of false positive/negative rate and it might be nice to restate those here and on what experiment/validation data these were conducted. However, the rest of their analysis comprises different types of enrichment analysis which shouldn't be affected by outlier HSlncRNAs if indeed their FPR/FNR are low.
There are now several new genomes available as part of the Zoonomia consortium and 240 Primate consortium papers released. These papers have re-examined some annotations such as Human Accelerated Regions (HARs) and found with a larger dataset as well as better reference genomes, that a large fraction of HARs were actually incorrectly annotated - that is that they were also seen in other lineages outside of just the great apes. If these papers have not already examined HSlncRNAs, the authors should try and re-run the computational predictions with this updated set and then identify HSlncRNAs there. This might help to clarify their signal and remove lncRNAs that might be present in other primates but are somehow missing in the great apes. This might also help to mitigate some results that they see in section 3 of their paper in comparing DBS distances between archaics and humans.
The differences between the archaic hominins in their DBS distances to modern humans are a bit concerning. At some level, we expect these to be roughly similar when examining African modern humans and perhaps the Denisovan being larger when examining Europeans and Asians, but they seem to have distances that aren't expected given the demography. In addition, from their text for section 3, they begin by stating that they are computing two types of distances but then I lost track of which distance they were discussing in paragraph 3 of section 3. Explicitly stating which of the two distances in the text would be helpful for the reader.
Isn't the correct control to examine whether eQTLs are more enriched in HSlncRNA DBSs a set of transcription factor binding sites? I don't think using just promoter regions is a reasonable control here. This does not take away from the broader point however that eQTLs are found in DBSs and I think they can perform this alternate test.
In the discussion, they highlight the evolution of sugar intake, which I'm not sure is appropriate. This comes not from GO enrichment but rather from a few genes that are found at the tail of their distribution. While these signals may be real, the evolution of traits is often highly polygenic and they don't see this signal in their functional enrichment. I suggest removing that line. Moreover, HSlncRNAs are ones that are unique across a much longer time frame than the transition to agriculture which is when sugar intake rose greatly. Thus, it's unlikely to see enrichment for something that arose in the past 6000-7000 years would in the annotation that is designed to detect human-chimp or human-neanderthal level divergence.
-
Reviewer #2 (Public Review):
Lin et al attempt to examine the role of lncRNAs in human evolution in this manuscript. They apply a suite of population genetics and functional genomics analyses that leverage existing data sets and public tools, some of which were previously built by the authors, who clearly have experience with lncRNA binding prediction. However, I worry that there is a lack of suitable methods and/or relevant controls at many points and that the interpretation is too quick to infer selection. While I don't doubt that lnc RNAs contribute to the evolution of modern humans, and certainly agree that this is a question worth asking, I think this paper would benefit from a more rigorous approach to tackling it.
At this point, my suggestions are mostly focused on tightening and strengthening the methods; it is hard for me to …
Reviewer #2 (Public Review):
Lin et al attempt to examine the role of lncRNAs in human evolution in this manuscript. They apply a suite of population genetics and functional genomics analyses that leverage existing data sets and public tools, some of which were previously built by the authors, who clearly have experience with lncRNA binding prediction. However, I worry that there is a lack of suitable methods and/or relevant controls at many points and that the interpretation is too quick to infer selection. While I don't doubt that lnc RNAs contribute to the evolution of modern humans, and certainly agree that this is a question worth asking, I think this paper would benefit from a more rigorous approach to tackling it.
At this point, my suggestions are mostly focused on tightening and strengthening the methods; it is hard for me to predict the consequence of these changes on the results or their interpretation, but as a general rule I also encourage the authors to not over-interpret their conclusions in terms of what phenotype was selected for when as they do at certain points (eg glucose metabolism).
I note some specific points that I think would benefit from more rigorous approaches, and suggest possible ways forward for these.
1. Much of this work is focused on comparing DNA binding domains in human-unique long-noncoding RNAs and DNA binding sites across the promoters of genes in the human genome, and I think the authors can afford to be a bit more methodical/selective in their processing and filtering steps here. The article begins by searching for orthologues of human lncRNAs to arrive at a set of 66 human-specific lncRNAs, which are then characterised further through the rest of the manuscript. Line 99 describes a binding affinity metric used to separate strong DBS from weak DBS; the methods (line 432) describe this as being the product of the DBS or lncRNA length times the average Identity of the underlying TTSs. This multiplication, in fact, undoes the standardising value of averaging and introduces a clear relationship between the length of a region being tested and its overall score, which in turn is likely to bias all downstream inference, since a long lncRNA with poor average affinity can end up with a higher score than a short one with higher average affinity, and it's not quite clear to me what the biological interpretation of that should be. Why was this metric defined in this way?
2. There is also a strong assumption that identified sites will always be bound (line 100), which I disagree is well-supported by additional evidence (lines 109-125). The authors show that predicted NEAT1 and MALAT1 DBS overlap experimentally validated sites for NEAT1, MALAT1, and MEG3, but this is not done systematically, or genome-wide, so it's hard to know if the examples shown are representative, or a best-case scenario.
It's also not quite clear how overlapping promoters or TSS are treated - are these collapsed into a single instance when calculating genome-wide significance? If, eg, a gene has five isoforms, and these differ in the 3' UTR but their promoter region contains a DBS, is this counted five times, or one? Since the interaction between the lncRNA and the DBS happens at the DNA level, it seems like not correcting for this uneven distribution of transcripts is likely to skew results, especially when testing against genome-wide distributions, eg in the results presented in sections 5 and 6. I do not think that comparing genes and transcripts putatively bound by the 40 HS lncRNAs to a random draw of 10,000 lncRNA/gene pairs drawn from the remaining ~13500 lncRNAs that are not HS is a fair comparison. Rather, it would be better to do many draws of 40 non-HS lncRNAs and determine an empirical null distribution that way, if possible actively controlling for the overall number of transcripts (also see the following point).
3. Thresholds for statistical testing are not consistent, or always well justified. For instance, in line 142 GO testing is performed on the top 2000 genes (according to different rankings), but there's no description of the background regions used as controls anywhere, or of why 2000 genes were chosen as a good number to test? Why not 1000, or 500? Are the results overall robust to these (and other) thresholds? Then line 190 the threshold for downstream testing is now the top 20% of genes, etc. I am not opposed to different thresholds in principle, but they should be justified.
Likewise, comparing Tajima's D values near promoters to genome-wide values is unfair, because promoters are known to be under strong evolutionary constraints relative to background regions; as such it is not surprising that the results of this comparison are significant. A fairer comparison would attempt to better match controls (eg to promoters without HS lncRNA DBS, which I realise may be nearly impossible), or generate empirical p-values via permutation or simulation.
4. There are huge differences in the comparisons between the Vindija and Altai Neanderthal genomes that to me suggest some sort of technical bias or the such is at play here. e.g. line 190 reports 1256 genes to have a high distance between the Altai Neanderthal and modern humans, but only 134 Vindija genes reach the same cutoff of 0.034. The temporal separation between the two specimens does not seem sufficient to explain this difference, nor the difference between the Altai Denisovan and Neanderthal results (2514 genes for Denisovan), which makes me wonder if it is a technical artefact relating to the quality of the genome builds? It would be worth checking.
5. Inferring evolution: There are some points of the manuscript where the authors are quick to infer positive selection. I would caution that GTEx contains a lot of different brain tissues, thus finding a brain eQTL is a lot easier than finding a liver eQTL, just because there are more opportunities for it. Likewise, claims in the text and in Tables 1 and 2 about the evolutionary pressures underlying specific genes should be more carefully stated. The same is true when the authors observe high Fst between groups (line 515), which is only one possible cause of high Fst - population differentiation and drift are just as capable of giving rise to it, especially at small sample sizes.
-
