Comparative brain-wide mapping of ketamine- and isoflurane-activated nuclei and functional networks in the mouse brain
Curation statements for this article:-
Curated by eLife

eLife assessment
This important study used single-cell whole-brain imaging of the immediate early gene Fos to identify the brain areas recruited by two anesthetics, ketamine and isoflurane. The utilization of a custom software package to align and analyze brain images for c-Fos positive cells stands out as an impressive component of the approach. The results provide solid evidence that these anesthetics might induce anesthesia via different brain regions and pathways, and raw fos showed shared and distinct activation patterns after ketamine- v. isoflurane-based anesthesia. Though differences could also be due, as the authors note, to differences in dose and route of administration. This paper may be of interest to preclinical and clinical scientists working with anesthetic and dissociative drugs.
This article has been Reviewed by the following groups
Discuss this preprint
Start a discussion What are Sciety discussions?Listed in
- Evaluated articles (eLife)
Abstract
Ketamine (KET) and isoflurane (ISO) are two widely used general anesthetics, yet their distinct and shared neurophysiological mechanisms remain elusive. In this study, we conducted a comparative analysis of the effects of KET and ISO on c-Fos expression across the mouse brain, utilizing hierarchical clustering and c-Fos-based functional network analysis to evaluate the responses of individual brain regions to each anesthetic. Our findings reveal that KET activates a wide range of brain regions, notably in the cortical and subcortical nuclei involved in sensory, motor, emotional, and reward processing, with the temporal association areas (TEa) as a strong hub, suggesting a top-down mechanism affecting consciousness by primarily targeting higher order cortical networks. In contrast, ISO predominantly influences brain regions in the hypothalamus, impacting neuroendocrine control, autonomic function, and homeostasis, with the locus coeruleus (LC) as a connector hub, indicating a bottom-up mechanism in anesthetic-induced unconsciousness. KET and ISO both activate brain areas involved in sensory processing, memory and cognition, reward and motivation, as well as autonomic and homeostatic control, highlighting their shared effects on various neural pathways. In conclusion, our results highlight the distinct but overlapping effects of KET and ISO, enriching our understanding of the mechanisms underlying general anesthesia.
Article activity feed
-

-
-
-

Author Response
The following is the authors’ response to the previous reviews.
Reviewer #2 (Public Review):
Summary:
In the revised manuscript, the authors aim to investigate brain-wide activation patterns following administration of the anesthetics ketamine and isoflurane, and conduct comparative analysis of these patterns to understand shared and distinct mechanisms of these two anesthetics. To this end, they perform Fos immunohistochemistry in perfused brain sections to label active nuclei, use a custom pipeline to register images to the ABA framework and quantify Fos+ nuclei, and perform multiple complementary analyses to compare activation patterns across groups.
In the latest revision, the authors have made some changes in response to our previous comments on how to fix the analyses. However, the revised analyses were not …
Author Response
The following is the authors’ response to the previous reviews.
Reviewer #2 (Public Review):
Summary:
In the revised manuscript, the authors aim to investigate brain-wide activation patterns following administration of the anesthetics ketamine and isoflurane, and conduct comparative analysis of these patterns to understand shared and distinct mechanisms of these two anesthetics. To this end, they perform Fos immunohistochemistry in perfused brain sections to label active nuclei, use a custom pipeline to register images to the ABA framework and quantify Fos+ nuclei, and perform multiple complementary analyses to compare activation patterns across groups.
In the latest revision, the authors have made some changes in response to our previous comments on how to fix the analyses. However, the revised analyses were not changed correctly and remain flawed in several fundamental ways.
Critical problems:
(1) Before one can perform higher level analyses such as hiearchal cluster or network hub (or PC) analysis, it is fundamental to validate that you have significant differences of the raw Fos expression values in the first place. First of all, this means showing figures with the raw data (Fos expression levels) in some form in Figures 2 and 3 before showing the higher level analyses in Figures 4 and 5; this is currently switched around. Second and most importantly, when you have a large number of brain areas with large differences in mean values and variance, you need to account for this in a meaningful way. Changing to log values is a step in the right direction for mean values but does not account well for differences in variance. Indeed, considering the large variances in brain areas with high mean values and variance, it is a little difficult to believe that all brain regions, especially brain areas with low mean values, passed corrections for multiple comparisons test. We suggested Z-scores relative to control values for each brain region; this would have accounted for wide differences in mean values and variance, but this was not done. Overall, validation of anesthesia-induced differences in Fos expression levels is not yet shown.
(a) Reordering the figures.
Thank you for your suggestion. We have added Figure 2 (for 201 brain regions) and Figure 2—figure supplement 1 (for 53 brain regions) to demonstrate the statistical differences in raw Fos expression between KET and ISO compared to their respective control groups. These figures specifically present the raw c-Fos expression levels for both KET and ISO in the same brain areas, providing a fundamental basis for the subsequent analyses. Additionally, we have moved the original Figures 4 and 5 to Figures 3 and 4.
(b) Z-score transformation and validation of anesthesia-induced differences in Fos expression.
Thank you for your suggestion. Before multiple comparisons, we transformed the data into log c-Fos density and then performed Z-scores relative to control values for each brain region. Indeed, through Z-score transformation, we have identified a larger number of significantly activated brain regions in Figure 2. The number of brain regions showing significant activation increased by 100 for KET and by 39 for ISO. We have accordingly updated the results section to include these findings in Line 80-181. Besides, we have added the following content in the Statistical Analysis section in Line 489: "…In Figure 2 and Figure 2–figure supplement 1, c-Fos densities in both experimental and control groups were log-transformed. Z-scores were calculated for each brain region by normalizing these log-transformed values against the mean and standard deviation of its respective control group. This involved subtracting the control mean from the experimental value and dividing the result by the control standard deviation. For statistical analysis, Z-scores were compared to a null distribution with a zero mean, and adjustments were made for multiple comparisons using the Benjamini–Hochberg method with a 5% false discovery rate (Q)..…".
Author response image 1.
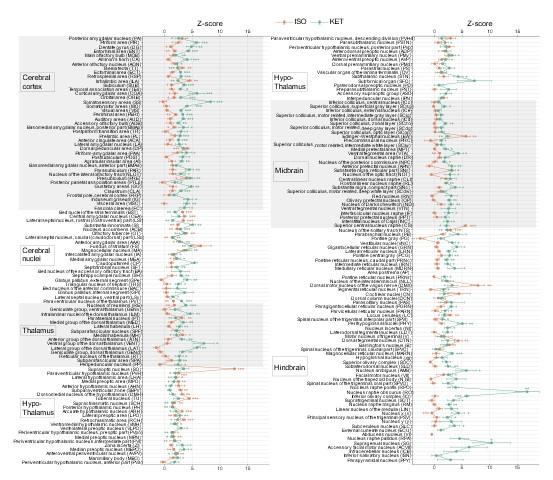
KET and ISO induced c-Fos expression relative to their respective control group across 201 distinct brain regions. Z-scores represent the normalized c-Fos expression in the KET and ISO groups, calculated against the mean and standard deviation from their respective control groups. Statistical analysis involved the comparison of Z-scores to a null distribution with a zero mean and adjustment for multiple comparisons using the Benjamini–Hochberg method at a 5% false discovery rate (*p < 0.05, **p < 0.01, ***p < 0.001). n = 6, 6, 8, 6 for the home cage, ISO, saline, and KET, respectively. Missing values resulted from zero standard deviations in control groups. Brain regions are categorized into major anatomical subdivisions, as shown on the left side of the graph.
Author response image 2.
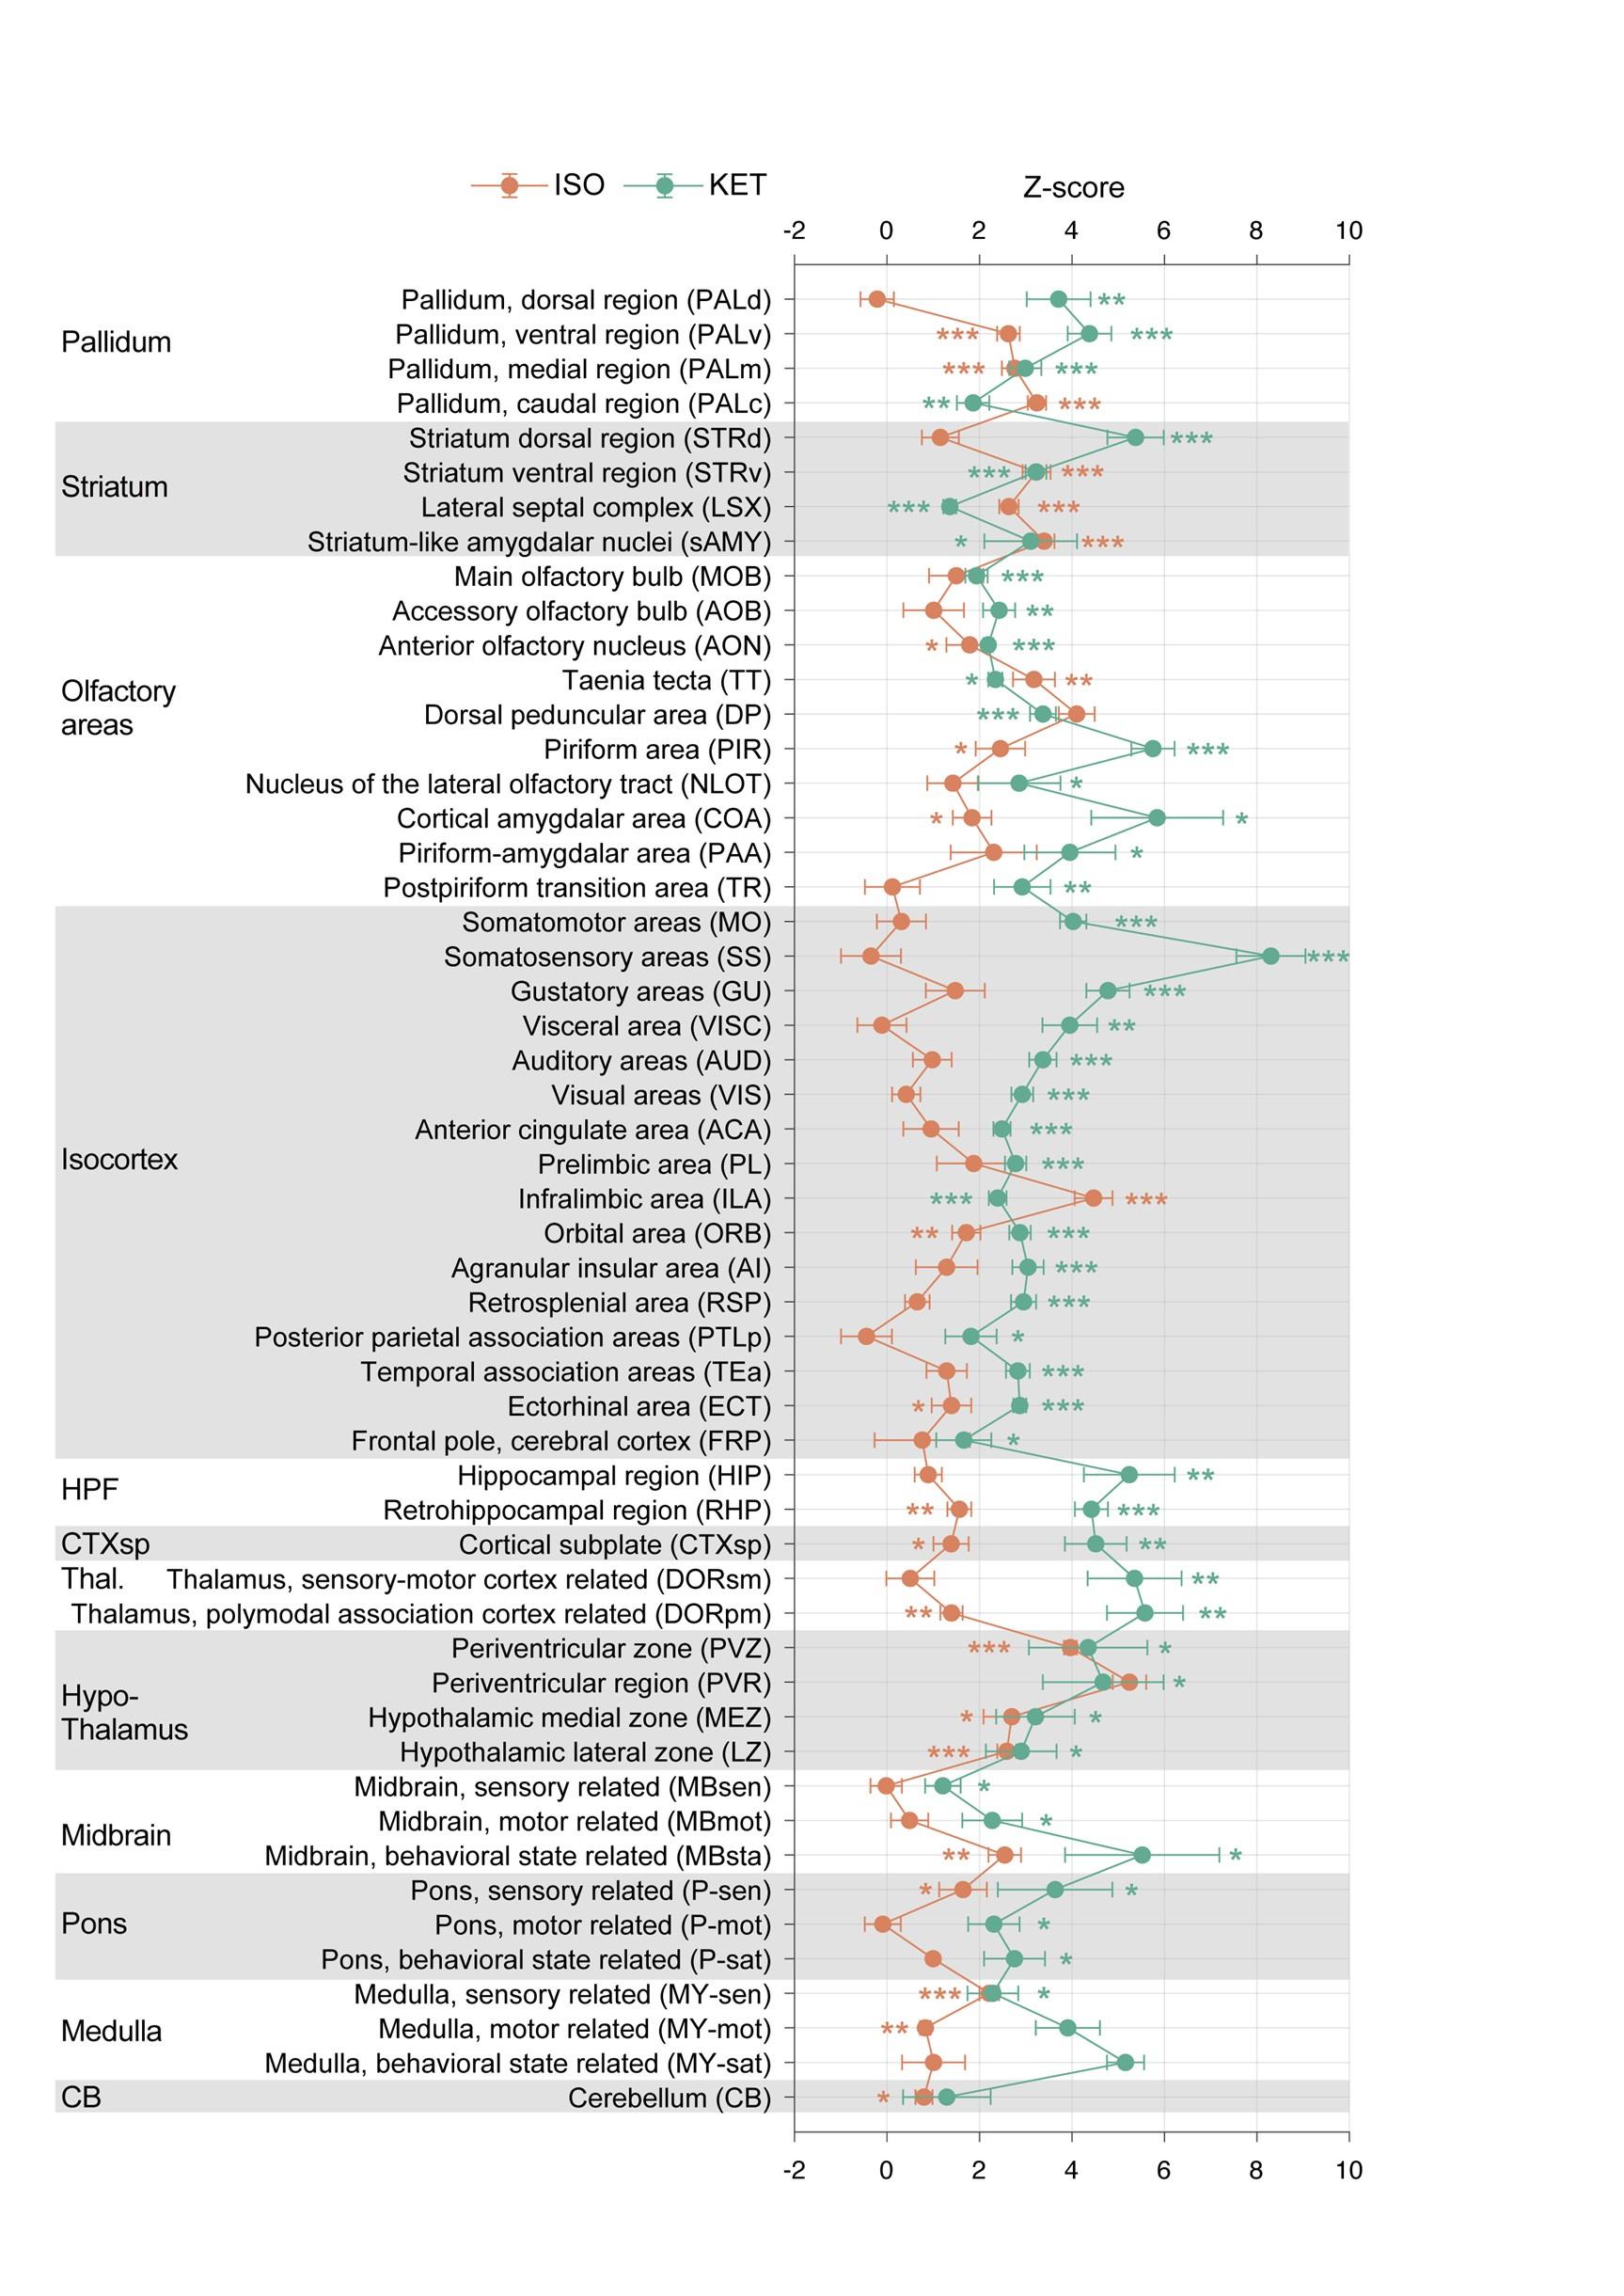
KET and ISO induced c-Fos expression relative to their respective control group across 53 distinct brain regions. Z-scores for c-Fos expression in the KET and ISO groups were normalized to the mean and standard deviation of their respective control groups. Statistical analysis involved the comparison of Z-scores to a null distribution with a zero mean and adjustment for multiple comparisons using the Benjamini–Hochberg method at a 5% false discovery rate (*p < 0.05, **p < 0.01, ***p < 0.001). Brain regions are organized into major anatomical subdivisions, as indicated on the left side of the graph.
(2) Let's assume for a moment that the raw Fos expression analyses indicate significant differences. They used hierarchal cluster analyses as a rationale for examining 53 brain areas in all subsequent analyses of Fos expression following isoflurane versus home cage or ketamine versus saline. Instead, the authors changed to 201 brain areas with no validated rationale other than effectively saying 'we wanted to look at more brain areas'. And then later, when they examined raw Fos expression values in Figures 4 and 5, they assess 43 brain areas for ketamine and 20 brain areas for isoflurane, without any rationale for why choosing these numbers of brain areas. This is a particularly big problem when they are trying to compare effects of isoflurane versus ketamine on Fos expression in these brain areas - they did not compare the same brain areas.
(a) Changing to 201 brain areas with validated rationale.
Thank you for your question. We have revised the original text from “To enhance our analysis of c-Fos expression patterns induced by KET and ISO, we expanded our study to 201 subregions.” to Line 100: "…To enable a more detailed examination and facilitate clearer differentiation and comparison of the effects caused by KET and ISO, we subdivided the 53 brain regions into 201 distinct areas. This approach, guided by the standard mouse atlas available at http://atlas.brain-map.org/atlas, allowed for an in-depth analysis of the responses in various brain regions…". For hierarchal cluster analyses from 53 to 201 brain regions, Line 215: "…To achieve a more granular analysis and better discern the responses between KET and ISO, we expanded our study from the initial 53 brain regions to 201 distinct subregions…"
(b) Compare the same brain areas for KET and ISO and the rationale for why choosing these numbers of brain areas in Figures 3 and 4.
We apologize for the confusion and lack of clarity regarding the selection of brain regions for analysis. In Figure 2 and Figure 2—figure supplement 1, we display the c-Fos expression in the same brain regions affected by KET and ISO. In Figures 3 and 4, we applied a uniform standard to specifically report the brain areas most prominently activated by KET and ISO, respectively. As specified in Line 104: "…Compared to the saline group, KET activated 141 out of a total of 201 brain regions (Figure 2). To further identify the brain regions that are most significantly affected by KET, we calculated Cohen's d for each region to quantify the magnitude of activation and subsequently focused on those regions that had a corrected p-value below 0.05 and effect size in the top 40% (Figure 3, Figure 3—figure supplement 1)…" and Line 142: "…Using the same criteria applied to KET, which involved selecting regions with Cohen's d values in the top 40% of significantly activated areas from Figure 2, we identified 32 key brain regions impacted by ISO (Figure 4, Figure 4—figure supplement 1).…".
Moreover, we illustrate the co-activated brain regions by KET and ISO in Figure 4C. As detailed in Lines 167-180:"…The co-activation of multiple brain regions by KET and ISO indicates that they have overlapping effects on brain functions. Examples of these effects include impacts on sensory processing, as evidenced by the activation of the PIR, ENT 1, and OT2, pointing to changes in sensory perception typical of anesthetics. Memory and cognitive functions are influenced, as indicated by the activation of the subiculum (SUB) 3, dentate gyrus (DG) 4, and RE 5. The reward and motivational systems are engaged, involving the ACB and ventral tegmental area (VTA), signaling the modulation of reward pathways 6. Autonomic and homeostatic control are also affected, as shown by areas like the lateral hypothalamic area (LHA) 7 and medial preoptic area (MPO) 8, emphasizing effects on functions such as feeding and thermoregulation. Stress and arousal responses are impacted through the activation of the paraventricular hypothalamic nucleus (PVH) 10,11 and LC 12. This broad activation pattern highlights the overlap in drug effects and the complexity of brain networks in anesthesia…". Below are the revised Figures 3 and 4.
(1) Chapuis, J. et al. Lateral entorhinal modulation of piriform cortical activity and fine odor discrimination. J. Neurosci. 33, 13449-13459 (2013). https://doi.org:10.1523/jneurosci.1387-13.2013
(2) Giessel, A. J. & Datta, S. R. Olfactory maps, circuits and computations. Curr. Opin. Neurobiol. 24, 120-132 (2014). https://doi.org:10.1016/j.conb.2013.09.010
(3) Roy, D. S. et al. Distinct Neural Circuits for the Formation and Retrieval of Episodic Memories. Cell 170, 1000-1012.e1019 (2017). https://doi.org:10.1016/j.cell.2017.07.013
(4) Sun, X. et al. Functionally Distinct Neuronal Ensembles within the Memory Engram. Cell 181, 410-423.e417 (2020). https://doi.org:10.1016/j.cell.2020.02.055
(5) Huang, X. et al. A Visual Circuit Related to the Nucleus Reuniens for the Spatial-Memory-Promoting Effects of Light Treatment. Neuron (2021).
(6) Al-Hasani, R. et al. Ventral tegmental area GABAergic inhibition of cholinergic interneurons in the ventral nucleus accumbens shell promotes reward reinforcement. Nat. Neurosci. 24, 1414-1428 (2021). https://doi.org:10.1038/s41593-021-00898-2
(7) Mickelsen, L. E. et al. Single-cell transcriptomic analysis of the lateral hypothalamic area reveals molecularly distinct populations of inhibitory and excitatory neurons. Nat. Neurosci. 22, 642-656 (2019). https://doi.org:10.1038/s41593-019-0349-8
(8) McGinty, D. & Szymusiak, R. Keeping cool: a hypothesis about the mechanisms and functions of slow-wave sleep. Trends Neurosci. 13, 480-487 (1990). https://doi.org:10.1016/0166-2236(90)90081-k
(9) Mullican, S. E. et al. GFRAL is the receptor for GDF15 and the ligand promotes weight loss in mice and nonhuman primates. Nat. Med. 23, 1150-1157 (2017). https://doi.org:10.1038/nm.4392
(10) Rasiah, N. P., Loewen, S. P. & Bains, J. S. Windows into stress: a glimpse at emerging roles for CRH(PVN) neurons. Physiol. Rev. 103, 1667-1691 (2023). https://doi.org:10.1152/physrev.00056.2021
(11) Islam, M. T. et al. Vasopressin neurons in the paraventricular hypothalamus promote wakefulness via lateral hypothalamic orexin neurons. Curr. Biol. 32, 3871-3885.e3874 (2022). https://doi.org:10.1016/j.cub.2022.07.020
(12) Ross, J. A. & Van Bockstaele, E. J. The Locus Coeruleus- Norepinephrine System in Stress and Arousal: Unraveling Historical, Current, and Future Perspectives. Front Psychiatry 11, 601519 (2020). https://doi.org:10.3389/fpsyt.2020.601519
Author response image 3.
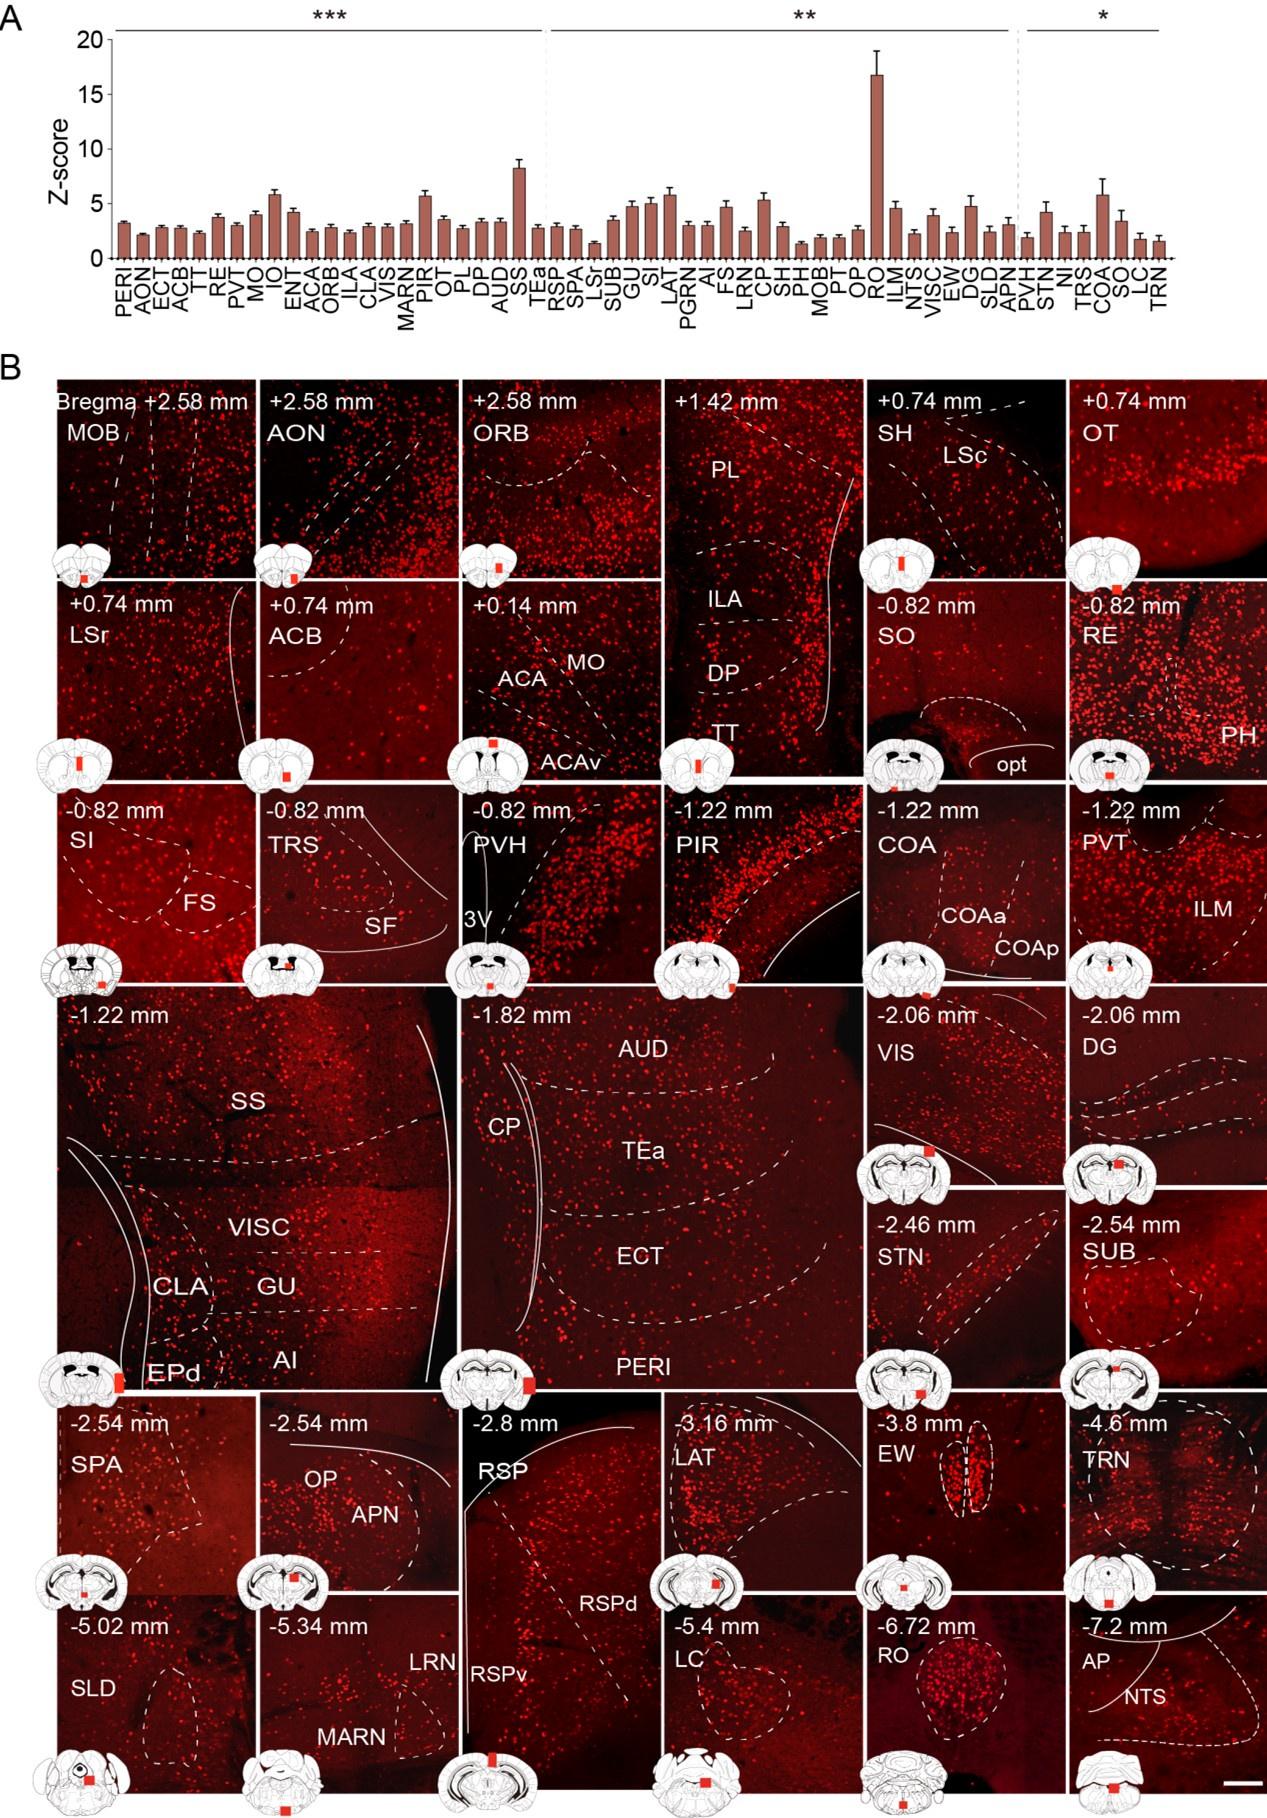
Brain regions exhibiting significant activation by KET. (A) Fifty-five brain regions exhibited significant KET activation. These were chosen from the 201 regions analyzed in Figure 2, focusing on the top 40% ranked by effect size among those with corrected p values less than 0.05. Data are presented as mean ± SEM, with p-values adjusted for multiple comparisons (*p < 0.05, **p < 0.01, ***p < 0.001). (B) Representative immunohistochemical staining of brain regions identified in Figure 3A, with control group staining available in Figure 3—figure supplement 1. Scale bar: 200 µm.
Author response image 4.
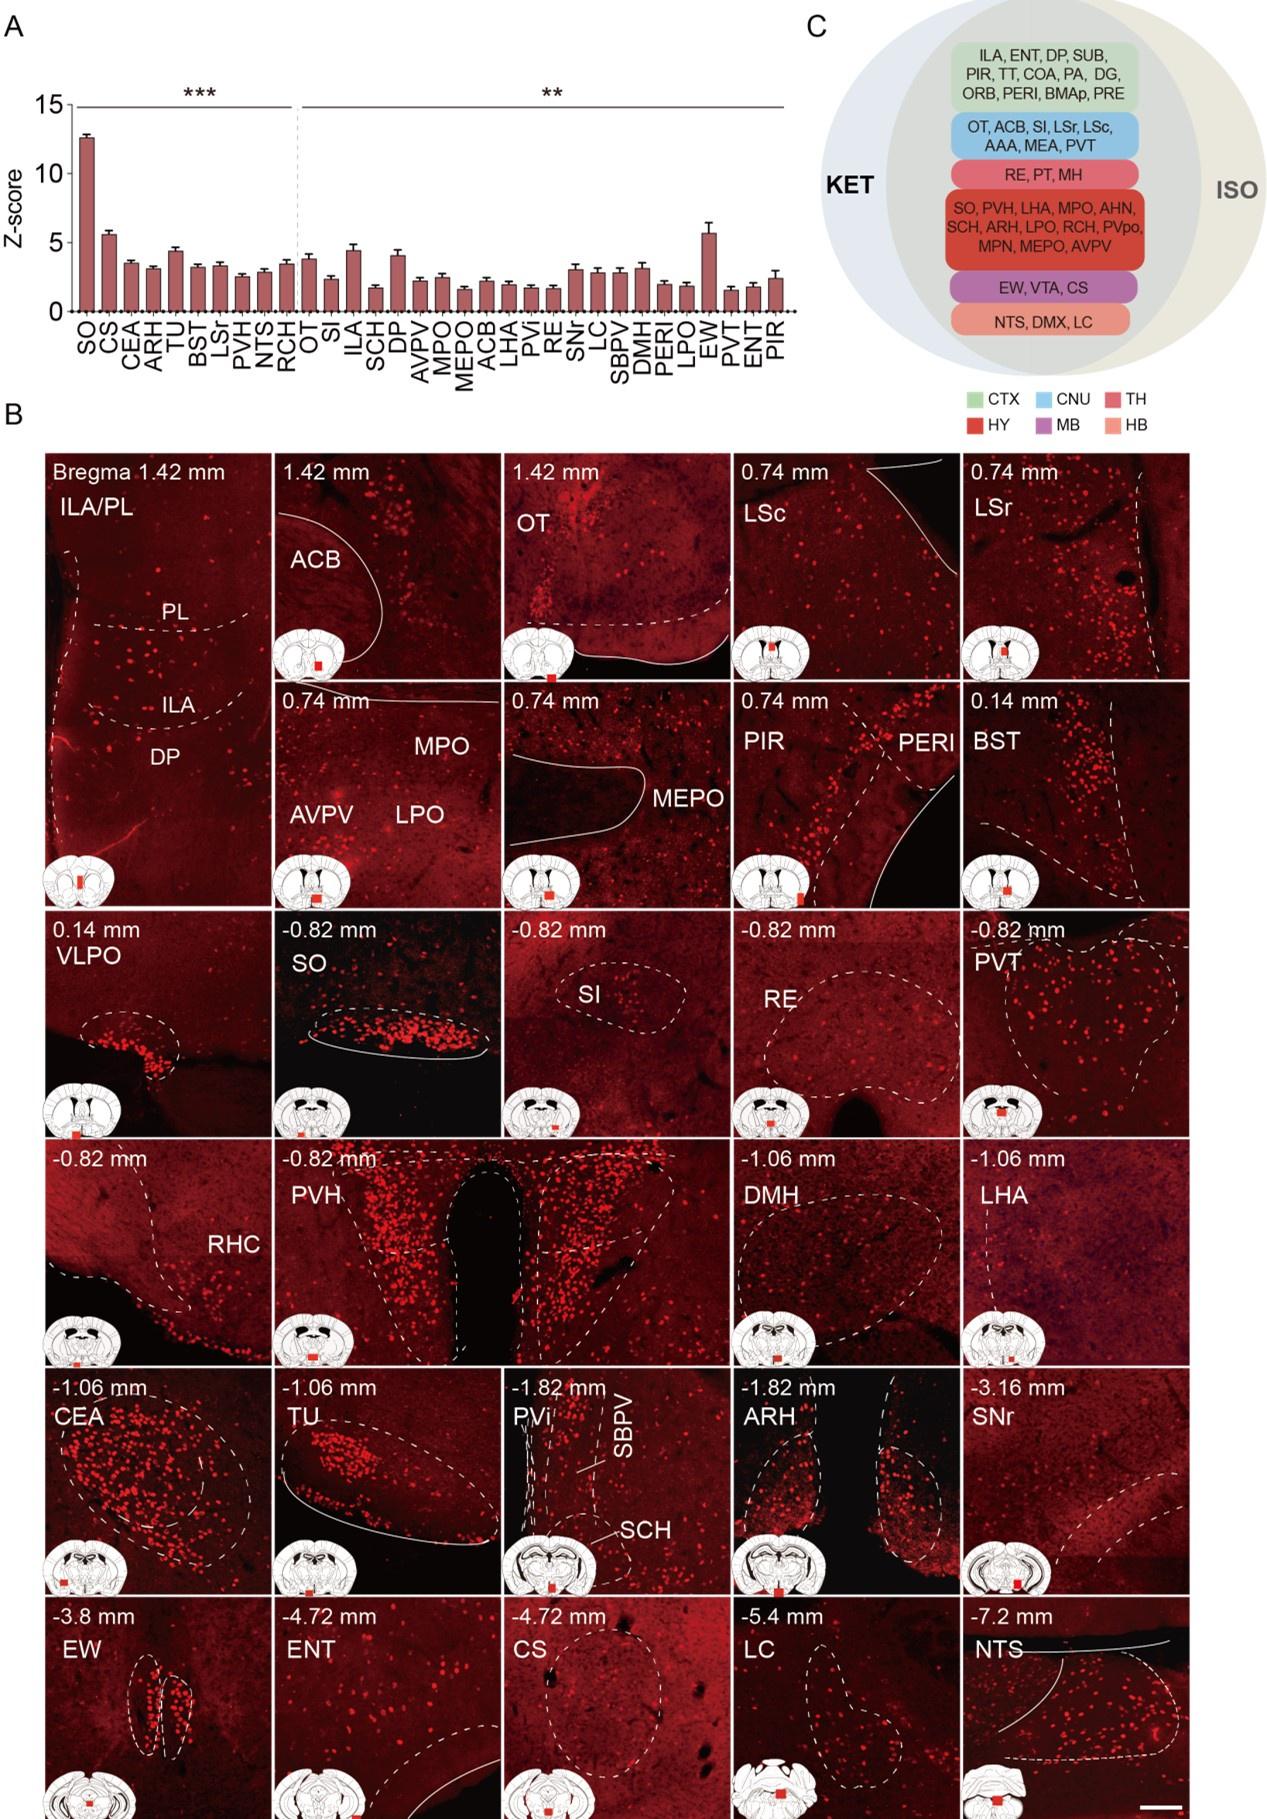
Brain regions exhibiting significant activation by ISO. (A) Brain regions significantly activated by ISO were initially identified using a corrected p-value below 0.05. From these, the top 40% in effect size (Cohen’s d) were further selected, resulting in 32 key areas. p-values are adjusted for multiple comparisons (**p < 0.01, ***p < 0.001). (B) Representative immunohistochemical staining of brain regions identified in Figure 4A. Control group staining is available in Figure 4—figure supplement 1. Scale bar: 200 µm. Scale bar: 200 µm. (C) A Venn diagram displays 43 brain regions co-activated by KET and ISO, identified by the adjusted p-values (p < 0.05) for both KET and ISO. CTX: cerebral cortex; CNU: cerebral nuclei; TH: thalamus; HY: hypothalamus; MB: midbrain; HB: hindbrain.
Less critical comments:
(3) The explanation of hierarchical level's in lines 90-95 did not make sense.
We have revised the section that initially stated in lines 90-95, "…Based on the standard mouse atlas available at http://atlas.brain-map.org/, the mouse brain was segmented into nine hierarchical levels, totaling 984 regions. The primary level consists of grey matter, the secondary of the cerebrum, brainstem, and cerebellum, and the tertiary includes regions like the cerebral cortex and cerebellar nuclei, among others, with some regions extending to the 8th and 9th levels. The fifth level comprises 53 subregions, with detailed expression levels and their respective abbreviations presented in Supplementary Figure 2…". Our revised description, now in line 91: "…Building upon the framework established in previous literature, our study categorizes the mouse brain into 53 distinct subregions1…"
(1) Do JP, Xu M, Lee SH, Chang WC, Zhang S, Chung S, Yung TJ, Fan JL, Miyamichi K, Luo L et al: Cell type-specific long-range connections of basal forebrain circuit. Elife 2016, 5.
(4) I am still perplexed by why the authors consider the prelimbic and infralimbic cortex 'neuroendocrine' brain areas in the abstract. In contrast, the prelimbic and infralimbic were described better in the introduction as "associated information processing" areas.
Thank you for bringing this to our attention. We agree that classifying the prelimbic and infralimbic cortex as 'neuroendocrine' in the abstract was incorrect, which was an oversight on our part. In the revised version, as detailed in line 167, we observed an increased number of brain regions showing overlapping activation by both KET and ISO, which is depicted in Figure 4C. This extensive co-activation across various regions makes it challenging to narrowly define the functional classification of each area. Consequently, we have revised the abstract, updating this in line 21: "…KET and ISO both activate brain areas involved in sensory processing, memory and cognition, reward and motivation, as well as autonomic and homeostatic control, highlighting their shared effects on various neural pathways.…".
(5) It looks like overall Fos levels in the control group Home (ISO) are a magnitude (~10-fold) lower than those in the control group Saline (KET) across all regions shown. This large difference seems unlikely to be due to a biologically driven effect and seems more likely to be due to a technical issue, such as differences in staining or imaging between experiments. The authors discuss this issue but did not answer whether the Homecage-ISO experiment or at least the Fos labeling and imaging performed at the same time as for the Saline-Ketamine experiment?
Thank you for highlighting this important point. The c-Fos labeling and imaging for the Home (ISO) and Saline (KET) groups were carried out in separate sessions due to the extensive workload involved in these processes. This study processed a total of 26 brain samples. Sectioning the entire brain of each mouse required approximately 3 hours, yielding 5 slides, with each slide containing 12 to 16 brain sections. We were able to stain and image up to 20 slides simultaneously, typically comprising 2 experimental groups and 2 corresponding control groups. Imaging these 20 slides at 10x magnification took roughly 7 hours, while additional time was required for confocal imaging of specific areas of interest at 20x magnification. Given the complexity of these procedures, to ensure consistency across all experiments, they were conducted under uniform conditions. This included the use of consistent primary and secondary antibody concentrations, incubation times, and imaging parameters such as fixed light intensity and exposure time. Furthermore, in the saline and KET groups, intraperitoneal injections might have evoked pain and stress responses in mice despite four days of pre-experiment acclimation, which could have contributed to the increased c-Fos expression observed. This aspect, along with the fact that procedures were conducted in separate sessions, might have introduced some variations. Thus, we have included a note in our discussion section in Line 353: "…Despite four days of acclimation, including handling and injections, intraperitoneal injections in the saline and KET groups might still elicit pain and stress responses in mice. This point is corroborated by the subtle yet measurable variations in brain states between the home cage and saline groups, characterized by changes in normalized EEG delta/theta power (home cage: 0.05±0.09; saline: -0.03±0.11) and EMG power (home cage: -0.37±0.34; saline: 0.04±0.13), as shown in Figure 1–figure supplement 1. These changes suggest a relative increase in brain activity in the saline group compared to the home cage group, potentially contributing to the higher c-Fos expression. Additionally, despite the use of consistent parameters for c-Fos labeling and imaging across all experiments, the substantial differences observed between the saline and home cage groups might be partly attributed to the fact that the operations were conducted in separate sessions.…"
Reviewer #3 (Public Review):
The present study presents a comprehensive exploration of the distinct impacts of Isoflurane and Ketamine on c-Fos expression throughout the brain. To understand the varying responses across individual brain regions to each anesthetic, the researchers employ principal component analysis (PCA) and c-Fos-based functional network analysis. The methodology employed in this research is both methodical and expansive. Notably, the utilization of a custom software package to align and analyze brain images for c-Fos positive cells stands out as an impressive addition to their approach. This innovative technique enables effective quantification of neural activity and enhances our understanding of how anesthetic drugs influence brain networks as a whole.
The primary novelty of this paper lies in the comparative analysis of two anesthetics, Ketamine and Isoflurane, and their respective impacts on brain-wide c-Fos expression. The study reveals the distinct pathways through which these anesthetics induce loss of consciousness. Ketamine primarily influences the cerebral cortex, while Isoflurane targets subcortical brain regions. This finding highlights the differing mechanisms of action employed by these two anesthetics-a top-down approach for Ketamine and a bottom-up mechanism for Isoflurane. Furthermore, this study uncovers commonly activated brain regions under both anesthetics, advancing our knowledge about the mechanisms underlying general anesthesia.
We are thankful for your positive and insightful comments on our study. Your recognition of the study's methodology and its significance in advancing our understanding of anesthetic mechanisms is greatly valued. By comprehensively mapping c-Fos expression across a wide range of brain regions, our study reveals the distinct and overlapping impacts of these anesthetics on various brain functions, providing a valuable foundation for future research into the mechanisms of general anesthesia, potentially guiding the development of more targeted anesthetic agents and therapeutic strategies. Thus, we are confident that our work will captivate the interest of our readers.
-
eLife assessment
This important study used single-cell whole-brain imaging of the immediate early gene Fos to identify the brain areas recruited by two anesthetics, ketamine and isoflurane. The utilization of a custom software package to align and analyze brain images for c-Fos positive cells stands out as an impressive component of the approach. The results provide solid evidence that these anesthetics might induce anesthesia via different brain regions and pathways, and raw fos showed shared and distinct activation patterns after ketamine- v. isoflurane-based anesthesia. Though differences could also be due, as the authors note, to differences in dose and route of administration. This paper may be of interest to preclinical and clinical scientists working with anesthetic and dissociative drugs.
-
Reviewer #2 (Public Review):
Summary: In the revised manuscript, the authors aim to investigate brain-wide activation patterns following administration of the anesthetics ketamine and isoflurane, and conduct comparative analysis of these patterns to understand shared and distinct mechanisms of these two anesthetics. To this end, they perform Fos immunohistochemistry in perfused brain sections to label active nuclei, use a custom pipeline to register images to the ABA framework and quantify Fos+ nuclei, and perform multiple complementary analyses to compare activation patterns across groups.
In the latest revision, I am happy to say that the authors have greatly improved their manuscript. The data are now well analyzed and the experiments fully described. They addressed all of my concerns. It is an interesting study.
-
Reviewer #3 (Public Review):
The present study presents a comprehensive exploration of the distinct impacts of Isoflurane and Ketamine on c-Fos expression throughout the brain. To understand the varying responses across individual brain regions to each anesthetic, the researchers employ principal component analysis (PCA) and c-Fos-based functional network analysis. The methodology employed in this research is both methodical and expansive. Notably, the utilization of a custom software package to align and analyze brain images for c-Fos positive cells stands out as an impressive addition to their approach. This innovative technique enables effective quantification of neural activity and enhances our understanding of how anesthetic drugs influence brain networks as a whole.
The primary novelty of this paper lies in the comparative …
Reviewer #3 (Public Review):
The present study presents a comprehensive exploration of the distinct impacts of Isoflurane and Ketamine on c-Fos expression throughout the brain. To understand the varying responses across individual brain regions to each anesthetic, the researchers employ principal component analysis (PCA) and c-Fos-based functional network analysis. The methodology employed in this research is both methodical and expansive. Notably, the utilization of a custom software package to align and analyze brain images for c-Fos positive cells stands out as an impressive addition to their approach. This innovative technique enables effective quantification of neural activity and enhances our understanding of how anesthetic drugs influence brain networks as a whole.
The primary novelty of this paper lies in the comparative analysis of two anesthetics, Ketamine and Isoflurane, and their respective impacts on brain-wide c-Fos expression. The study reveals the distinct pathways through which these anesthetics induce loss of consciousness. Ketamine primarily influences the cerebral cortex, while Isoflurane targets subcortical brain regions. This finding highlights the differing mechanisms of action employed by these two anesthetics-a top-down approach for Ketamine and a bottom-up mechanism for Isoflurane. Furthermore, this study uncovers commonly activated brain regions under both anesthetics, advancing our knowledge about the mechanisms underlying general anesthesia.
-
-
Author Response
The following is the authors’ response to the previous reviews.
We appreciate the reviewers for their insightful feedback, which has substantially improved our manuscript. Following the suggestions of the reviewers, we have undertaken the following major revisions:
a. Concerning data transformation, we have adjusted the methodology in Figures 2 and 3. Instead of normalizing c-Fos density to the whole brain c-Fos density as initially described, we now normalize to the c-Fos density of the corresponding brain region in the control group. b. We have substituted the PCA approach with hierarchical clustering in Figures 2 and 3.
c. In the discussion section, we added a subsection on study limitations, focusing on the variations in drug administration routes and anesthesia depth.
Enclosed are our detailed responses to each …
Author Response
The following is the authors’ response to the previous reviews.
We appreciate the reviewers for their insightful feedback, which has substantially improved our manuscript. Following the suggestions of the reviewers, we have undertaken the following major revisions:
a. Concerning data transformation, we have adjusted the methodology in Figures 2 and 3. Instead of normalizing c-Fos density to the whole brain c-Fos density as initially described, we now normalize to the c-Fos density of the corresponding brain region in the control group. b. We have substituted the PCA approach with hierarchical clustering in Figures 2 and 3.
c. In the discussion section, we added a subsection on study limitations, focusing on the variations in drug administration routes and anesthesia depth.
Enclosed are our detailed responses to each of the reviewer's comments.
Reviewer #1:
1a. The addition of the EEG/EMG is useful, however, this information is not discussed. For instance, there are differences in EEG/EMG between the two groups (only Ket significantly increased delta/theta power, and only ISO decreased EMG power). These results should be discussed as well as the limitation of not having physiological measures of anesthesia to control for the anesthesia depth.
1b. The possibility that the differences in fos observed may be due to the doses used should be discussed.
1c. The possibility that the differences in fos observed may be due kinetic of anesthetic used should be discussed.
Thank you for your suggestions. We have now discussed EEG/EMG result, limitation of not having physiological measures of anesthesia to control for the anesthesia depth, The possibility that the differences in fos observed may be due to the doses, The possibility that the differences in Fos observed may be due kinetic of anesthetic in the revised manuscript (Lines 308-331, also shown below).
Lines 308-331: "...Our findings indicate that c-Fos expression in the KET group is significantly elevated compared to the ISO group, and the saline group exhibits notably higher c-Fos expression than the home cage group, as seen in Supplementary Figures 2 and 3. Intraperitoneal saline injections in the saline group, despite pre-experiment acclimation with handling and injections for four days, may still evoke pain and stress responses in mice. Subtle yet measurable variations in brain states between the home cage and saline groups were observed, characterized by changes in normalized EEG delta/theta power (home cage: 0.05±0.09; saline: -0.03±0.11) and EMG power (home cage: -0.37±0.34; saline: 0.04±0.13), as shown in Supplementary Figure 1. These changes suggest a relative increase in overall brain activity in the saline group compared to the home cage group, potentially contributing to the higher c-Fos expression. Although the difference in EEG power between the ISO group and the home cage control was not significant, the increase in EEG power observed in the ISO group was similar to that of KET (0.47 ± 0.07 vs 0.59 ± 0.10), suggesting that both agents may induce loss of consciousness in mice. Regarding EMG power, ISO showed a significant decrease in EMG power compared to its control group. In contrast, the KET group showed a lesser reduction in EMG power (ISO: -1.815± 0.10; KET: -0.96 ± 0.21), which may partly explain the higher overall c-Fos expression levels in the KET group. This is consistent with previous studies where ketamine doses up to 150 mg/kg increase delta power while eliciting a wakefulness-like pattern of c-Fos expression across the brain [1]. Furthermore, the observed differences in c-Fos expression may arise in part from the dosages, routes of administration, and their distinct pharmacokinetic profiles. This variation is compounded by the lack of detailed physiological monitoring, such as blood pressure, heart rate, and respiration, affecting our ability to precisely assess anesthesia depth. Future studies incorporating comprehensive physiological monitoring and controlled dosing regimens are essential to further elucidate these relationships and refine our understanding of the effects of anesthetics on brain activity"
- Lu J, Nelson LE, Franks N, Maze M, Chamberlin NL, Saper CB: Role of endogenous sleep-wake and analgesic systems in anesthesia. J Comp Neurol 2008, 508(4):648-662.
2b. I am confused because Fig 2C seems to show significant decrease in %fos in the hypothalamus, midbrain and cerebellum after KET, while the author responded that " in our analysis, we did not detect regions with significant downregulation when comparing anesthetized mice with controls." Moreover the new figure in the rebuttal in response to reviewer 2 suggests that Ket increases Fos in almost every single region (green vs blue) which is not the conclusion of the paper.
Your concern regarding the apparent discrepancy is well-founded. The inconsistency arose due to an inappropriate data transformation, which affected the interpretation. We have now rectified this by adjusting the data transformation in Figures 2 and 3. Specifically, we have recalculated the log relative c-Fos density values relative to the control group for each brain region. This revision has resolved the issue, confirming that our analysis did not detect any regions with significant downregulation in the anesthetized mice compared to controls. We have also updated the results, discussion, and methods sections of Figures 2 and 3 to accurately reflect these changes and ensure consistency with our findings.
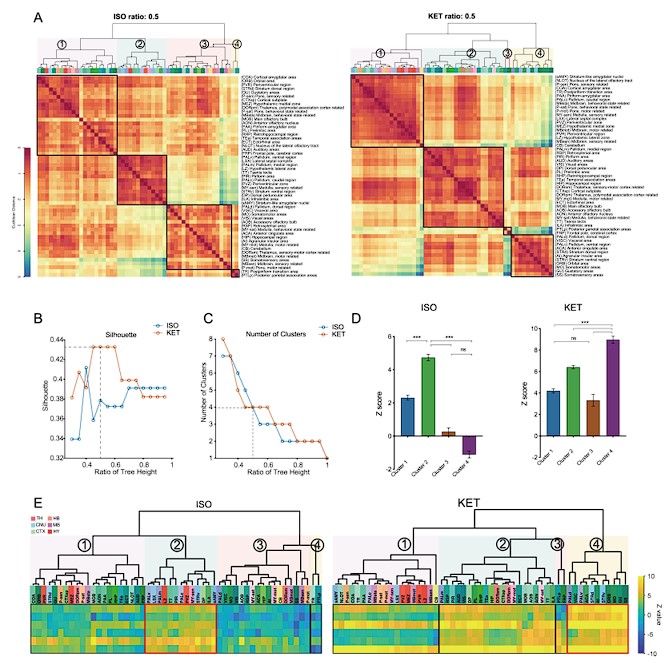
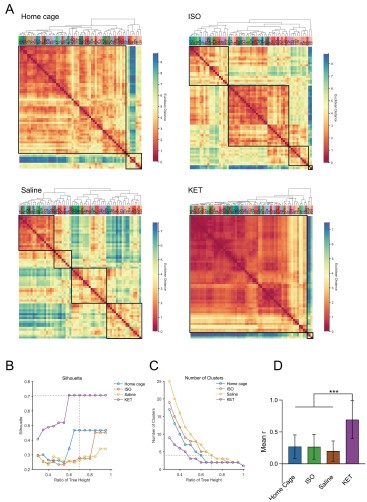
Author response image 1.
Figure 2. Whole-brain distributions of c-Fos+ cells induced by ISO and KET. (A) Hierarchical clustering was performed on the log relative c-Fos density data for ISO and KET using the complete linkage method based on the Euclidean distance matrix, with clusters identified by a dendrogram cut-off ratio of 0.5. Numerical labels correspond to distinct clusters within the dendrogram. (B) Silhouette values plotted against the ratio of tree height for ISO and KET, indicating relatively higher Silhouette values at 0.5 (dashed line), which is associated with optimal clustering. (C) The number of clusters identified in each treatment condition at different ratios of the dendrogram tree height, with a cut-off level of 0.5 corresponding to 4 clusters for both ISO and KET (indicated by the dashed line). (D) The bar graph depicts Z scores for clusters in ISO and KET conditions, represented with mean values and standard errors. One-way ANOVA with Tukey's post hoc multiple comparisons. ns: no significance; ***P < 0.001. (E) Z-scored log relative density of c-Fos expression in the clustered brain regions. The order and abbreviations of the brain regions and the numerical labels correspond to those in Figure 2A. The red box denotes the cluster with the highest mean Z score in comparison to other clusters. CTX: cortex; TH: thalamus; HY: hypothalamus; MB: midbrain; HB: hindbrain.
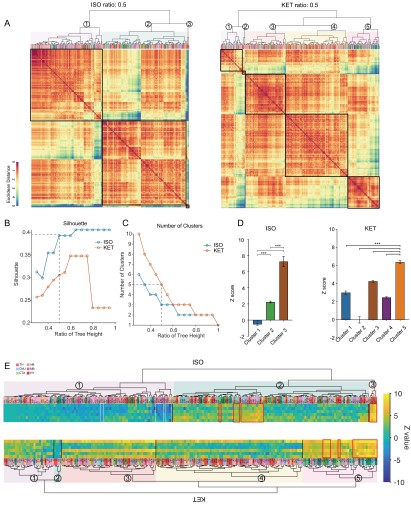
Author response image 2.
Figure 3. Similarities and differences in ISO and KET activated c-Fos brain areas. (A) Hierarchical clustering was performed on the log-transformed relative c-Fos density data for ISO and KET using the complete linkage method based on the Euclidean distance matrix, with clusters identified by a dendrogram cut-off ratio of 0.5. (B) Silhouette values are plotted against the ratio of tree height from the hierarchical clustered dendrogram in Figure 3A. (C) The relationship between the number of clusters and the tree height ratio of the dendrogram for ISO and KET, with a cut-off ratio of 0.5 resulting in 3 clusters for ISO and 5 for KET (indicated by the dashed line). (D) The bar graph depicts Z scores for clusters in ISO and KET conditions, represented with mean values and standard errors. One-way ANOVA with Tukey's post hoc multiple comparisons. ns: no significance; ***P < 0.001. (E) Z-scored log relative density of c-Fos expression within the identified brain region clusters. The arrangement, abbreviations of the brain regions, and the numerical labels are in accordance with Figure 3A. The red boxes highlight brain regions that rank within the top 10 percent of Z score values. The white boxes denote brain regions with an Z score less than -2.
- There are still critical misinterpretations of the PCA analysis. For instance, it is mentioned that " KET is associated with the activation of cortical regions (as evidenced by positive PC1 coefficients in MOB, AON, MO, ACA, and ORB) and the inhibition of subcortical areas (indicated by negative coefficients) " as well as " KET displays cortical activation and subcortical inhibition, whereas ISO shows a contrasting preference, activating the cerebral nucleus (CNU) and the hypothalamus while inhibiting cortical areas. To reduce inter-individual variability." These interpretations are in complete contradiction with the answer 2b above that there was no region that had decreased Fos by either anesthetic.
Thank you for bringing this to our attention. In response to your concerns, we have made significant revisions to our data analysis. We have updated our input data to incorporate log-transformed relative c-Fos density values, normalized against the control group for each brain region, as illustrated in Figures 2 and 3. Instead of PCA, we have applied this updated data to hierarchical clustering analysis. The results of these analyses are consistent with our original observation that neither anesthetic led to a decrease in Fos expression in any region.
- I still do not understand the rationale for the use of that metric. The use of a % of total Fos makes the data for each region dependent on the data of the other regions which wrongly leads to the conclusion that some regions are inhibited while they are not when looking at the raw data. Moreover, the interdependence of the variable (relative density) may affect the covariance structure which the PCA relies upon. Why not using the PCA on the logarithm of the raw data or on a relative density compared to the control group on a region-per-region basis instead of the whole brain?
Thank you for your insightful suggestion. Following your advice, we have revised our approach and now utilize the logarithm of the relative density compared to the control group on a region-by-region basis. We attempted PCA analyses using the logarithm of the raw data, the logarithm of the Z-score, and the logarithm of the relative density compared to control, but none yielded distinct clusters.
Author response image 3.
As a result, we employed hierarchical cluster analysis. We then examined the Z-scores of the log-transformed relative c-Fos densities (Figures 2E and 3E) to assess expression levels across clusters. Our analysis revealed that neither ISO nor KET treatments led to a significant suppression of c-Fos expression in the 53 brain regions examined. In the ISO group alone, there were 10 regions that demonstrated relative suppression (Z-score < -2, indicated by white boxes) as shown in Figure 3.
Fig. 2B: it's unclear to me why the regions are connected by a line. Such representation is normally used for time series/within-subject series. What is the rationale for the order of the regions and the use of the line? The line connecting randomly organized regions is meaningless and confusing.
Thank you for your suggestion. We have discontinued the use of PCA calculations and have removed this figure.
Fig 6A. The correlation matrices are difficult to interpret because of the low resolution and arbitrary order of brain regions. I recommend using hierarchical clustering and/or a combination of hierarchical clustering and anatomical organization (e.g. PMID: 31937658). While it is difficult to add the name of the regions on the graph I recommend providing supplementary figures with large high-resolution figures with the name of each brain region so the reader can actually identify the correlation between specific brain regions and the whole brain, Rationale for Metric Choice: Note that I do not dispute the choice of the log which is appropriate, it is the choice of using the relative density that I am questioning.
Thank you for your constructive feedback. In line with your suggestion, we have implemented hierarchical clustering combined with anatomical organization as per the referenced literature. Additionally, we have updated the vector diagrams in Figure 6A to present them with greater clarity.
Furthermore, we have revised our network modular division method based on cited literature recommendations. We used hierarchical clustering with correlation coefficients to segment the network into modules, illustrated in Figure 6—figure supplement 1. Due to the singular module structure of the KET network and the sparsity of intermodular connections in the home cage and saline networks, the assessment of network hub nodes did not employ within-module degree Z-score and participation coefficients, as these measures predominantly underscore the importance of connections within and between modules. Instead, we used degree, betweenness centrality, and eigenvector centrality to detect the hub nodes, as detailed in Figure 6—figure supplement 2. With this new approach, the hub node for the KET condition changed from SS to TeA. Corresponding updates have been made to the results section for Figure 6, as well as to the related discussions and the abstract of our paper.
Author response image 4.
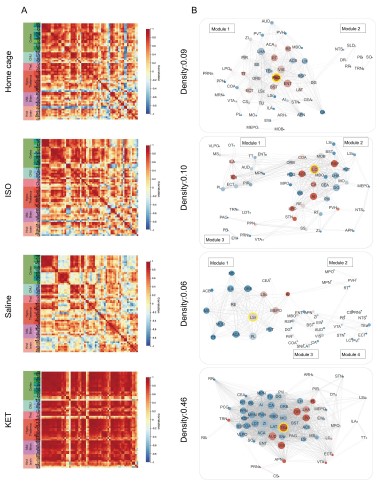
Figure 6. Generation of anesthetics-induced networks and identification of hub regions. (A) Heatmaps display the correlations of log c-Fos densities within brain regions (CTX, CNU, TH, HY, MB, and HB) for various states (home cage, ISO, saline, KET). Correlations are color-coded according to Pearson's coefficients. The brain regions within each anatomical category are organized by hierarchical clustering of their correlation coefficients. (B) Network diagrams illustrate significant positive correlations (P < 0.05) between regions, with Pearson’s r exceeding 0.82. Edge thickness indicates correlation magnitude, and node size reflects the number of connections (degree). Node color denotes betweenness centrality, with a spectrum ranging from dark blue (lowest) to dark red (highest). The networks are organized into modules consistent with the clustering depicted in Supplementary Figure 8. Figure 6—figure supplement 1
Author response image 5.
Figure 6—figure supplement 1. Hierarchical clustering of brain regions under various conditions: home cage, ISO, saline, and KET. (A) Heatmaps show the relative distances among brain regions assessed in naive mice. Modules were identified by sectioning each dendrogram at a 0.7 threshold. (B) Silhouette scores plotted against the dendrogram tree height ratio for each condition, with optimal cluster definition indicated by a dashed line at a 0.7 ratio. (C) The number of clusters formed at different cutoff levels. At a ratio of 0.7, ISO and saline treatments result in three clusters, whereas home cage and KET conditions yield two clusters. (D) The mean Pearson's correlation coefficient (r) was computed from interregional correlations displayed in Figure 6A. Data were analyzed using one-way ANOVA with Tukey’s post hoc test, ***P < 0.001.
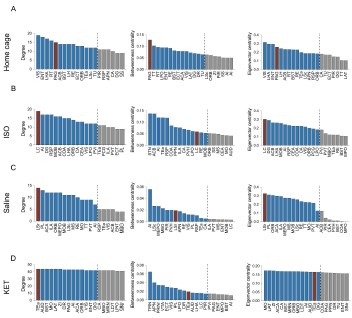
Author response image 6.
Figure 6—figure supplement 2. Hub region characterization across different conditions: home cage (A), ISO (B), saline (C), and KET (D) treatments. Brain regions are sorted by degree, betweenness centrality, and eigenvector centrality, with each metric presented in separate bar graphs. Bars to the left of the dashed line indicate the top 20% of regions by rank, highlighting the most central nodes within the network. Red bars signify regions that consistently appear within the top rankings for both degree and betweenness centrality across the metrics.
- I am still having difficulties understanding Fig. 3.
Panel A: The lack of identification for the dots in panel A makes it impossible to understand which regions are relevant.
Panel B: what is the metric that the up/down arrow summarizes? Fos density? Relative density? PC1/2?
Panel C: it's unclear to me why the regions are connected by a line. Such representation is normally used for time series/within-subject series. What is the rationale for the order of the regions?
Thank you for your patience and for reiterating your concerns regarding Figure 3.
a. In Panel A, we have substituted the original content with a display of hierarchical clustering results, which now clearly marks each brain region. This change aids readers in identifying regions with similar expression patterns and facilitates a more intuitive understanding of the data.
a. Acknowledging that our analysis did not reveal any significantly inhibited brain regions, we have decided to remove the previous version of Panel B from the figure.
b. We have discontinued the use of PCA calculations and have removed this figure to avoid any confusion it may have caused. Our revised analysis focuses on hierarchical clustering, which are presented in the updated figures.
Reviewer #2:
- Aside from issues with their data transformation (see below), (a) I think they have some interesting Fos counts data in Figures 4B and 5B that indicate shared and distinct activation patterns after KET vs. ISO based anesthesia. These data are far closer to the raw data than PC analyses and need to be described and analyzed in the first figures long before figures with the more abstracted PC analyses. In other words, you need to show the concrete raw data before describing the highly transformed and abstracted PC analyses. (b) This gets to the main point that when selecting brain areas for follow up analyses, these should be chosen based on the concrete Fos counts data, not the highly transformed and abstracted PC analyses.
Thank you for your suggestions.
a. We have added the original c-Fos cell density distribution maps for Figures 2, 3, 4, and 5 in Supplementary Figures 2 and 3 (also shown below). To maintain consistency across the document, we have updated both the y-axis label and the corresponding data in Figures 4B and 5B from 'c-Fos cell count' to 'c-Fos density'.
b. The analyses in Figures 2 and 3 include all brain regions. Figures 4 and 5 present the brain regions with significant differences as shown in Figure 3—figure supplement 1.
Author response image 7.
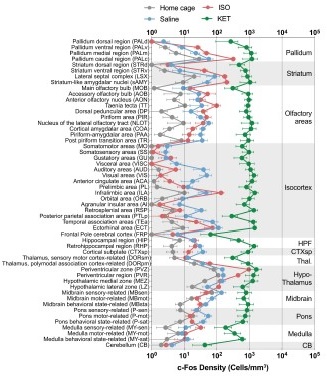
Figure 2—figure supplement 1. The c-Fos density in 53 brain areas for different conditions. (home cage, n = 6; ISO, n = 6 mice; saline, n = 8; KET, n = 6). Each point represents the c-Fos density in a specific brain region, denoted on the y-axis with both abbreviations and full names. Data are shown as mean ± SEM. Brain regions are categorized into 12 brain structures, as indicated on the right side of the graph.
Author response image 8.
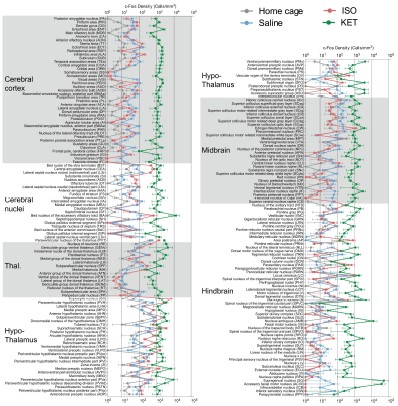
Figure 3—figure supplement 1. c-Fos density visualization across 201 distinct brain regions under various conditions. The graph depicts the c-Fos density levels for each condition, with data presented as mean and standard error. Brain regions with statistically significant differences are featured in Figures 4 and 5. Brain regions are organized into major anatomical subdivisions, as indicated on the left side of the graph.
- Now, the choice of data transformation for Fos counts is the most significant problem. First, the authors show in the response letter that not using this transformation (region density/brain density) leads to no clustering. However, they also showed the region-densities without transformation (which we appreciate) and it looks like overall Fos levels in the control group Home (ISO) are a magnitude (~10-fold) higher than those in the control group Saline (KET) across all regions shown. This large difference seems unlikely to be due to a biologically driven effect and seems more likely to be due to a technical issue, such as differences in staining or imaging between experiments. Was the Homecage-ISO experiment or at least the Fos labeling and imaging performed at the same time as for the Saline-Ketamine experiment? Please state the answer to this question in the Results section one way or the other.
a. “Home (ISO) are a magnitude (~10-fold) higher than those in the control group saline (KET) across all regions shown.” We believe you might be indicating that compared to the home cage group (gray), the saline group (blue) shows a 10-fold higher expression (Supplementary Figure 2/3). Indeed, we observed that the total number of c-Fos cells in the home cage group is significantly lower than in the saline group. This difference may be due to reduced sleep during the light-on period (ZT 6- ZT 7.5) in the saline mice or the pain and stress response caused by intraperitoneal injection of saline. We have explained this discrepancy in the discussion section.Line 308-317(also see below)
“…Our findings indicate that c-Fos expression in the KET group is significantly elevated compared to the ISO group, and the saline group exhibits notably higher c-Fos expression than the home cage group, as seen in Supplementary Figures 2 and 3. Intraperitoneal saline injections in the saline group, despite pre-experiment acclimation with handling and injections for four days, may still evoke pain and stress responses in mice. Subtle yet measurable variations in brain states between the home cage and saline groups were observed, characterized by changes in normalized EEG delta/theta power (home cage: 0.05±0.09; saline: -0.03±0.11) and EMG power (home cage: -0.37±0.34; saline: 0.04±0.13), as shown in Figure 1—figure supplement 1. These changes suggest a relative increase in overall brain activity in the saline group compared to the home cage group, potentially contributing to the higher c-Fos expression…”
b. Drug administration and tissue collection for both Homecage-ISO and Saline-Ketamine groups were consistently scheduled at 13:00 and 14:30, respectively. Four mice were administered drugs and had tissues collected each day, with two from the experimental group and two from the control group, to ensure consistent sampling. The 4% PFA fixation time, sucrose dehydration time, primary and secondary antibody concentrations and incubation times, staining, and imaging parameters and equipment (exposure time for VS120 imaging was fixed at 100ms) were all conducted according to a unified protocol.
We have included the following statement in the results section: Line 81-83, “Sample collection for all mice was uniformly conducted at 14:30 (ZT7.5), and the c-Fos labeling and imaging were performed using consistent parameters throughout all experiments. ”
- Second, they need to deal with this large difference in overall staining or imaging for these two (Home/ISO and Saline/KET) experiments more directly; their current normalization choice does not really account for the large overall differences in mean values and variability in Fos counts (e.g. due to labeling and imaging differences).
3a. I think one option (not perfect but I think better than the current normalization choice) could be z-scoring each treatment to its respective control. They can analyze these z-scored data first, and then in later figures show PC analyses of these data and assess whether the two treatments separate on PC1/2. And if they don't separate, then they don't separate, and you have to go with these results.
3b. Alternatively, they need to figure out the overall intensity distributions from the different runs (if that the main reason of markedly different counts) and adjust their thresholds for Fos-positive cell detection based on this. I would expect that the saline and HC groups should have similar levels of activation, so they could use these as the 'control' group to determine a Fos-positive intensity threshold that gets applied to the corresponding 'treatment' group.
3c. If neither 3a nor 3b is an option then they need to show the outcomes of their analysis when using the untransformed data in the main figures (the untransformed data plots in their responses to reviewer are currently not in the main or supplementary figs) and discuss these as well.
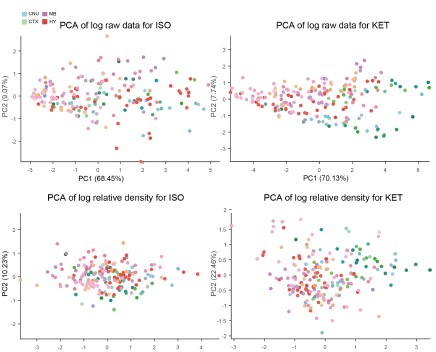
a. Thank you very much for your valuable suggestion. We conducted PCA analysis on the ISO and KET data after Z-scoring them with their respective control groups and did not find any significant separation.
Author response image 9.
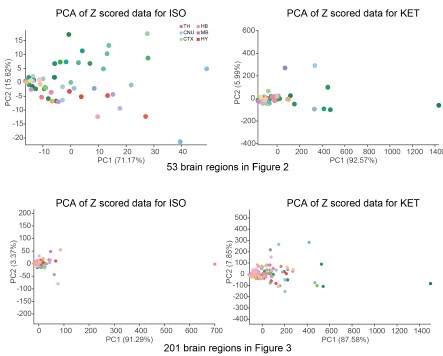
As mentioned in our response to reviewer #1, we have reprocessed the raw data. Firstly, we divided the ISO and KET data by their respective control brain regions and then performed a logarithmic transformation to obtain the log relative c-Fos density. The purpose of this is to eliminate the impact of baseline differences and reduce variability. We then performed hierarchical clustering, and finally, we Z-scored the log relative c-Fos density data. The aim is to facilitate comparison of ISO and KET on the same data dimension (Figure 2 and 3).
b. We appreciate your concerns regarding the detection thresholds for Fos-positive cells. The enclosed images, extracted from supplementary figures for Figures 4 and 5, demonstrate notable differences in c-Fos expression between saline and home cage groups in specific brain regions. These regions exhibit a discernible difference in staining intensity, with the saline group showing enhanced c-Fos expression in the PVH and PVT regions compared to the home cage group. An examination of supplementary figures for Figures 4 and 5 shows that c-Fos expression in the home cage group is consistently lower than in the saline group. This comparative analysis confirms that the discrepancies in c-Fos levels are not due to varying detection thresholds.
Author response image 10.
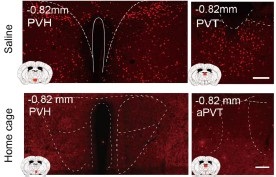
b. We have added the corresponding original data graphs to Supplementary Figures 2 and 3, and discussed the potential reasons for the significant differences between these groups in the discussion section (also shown below).
Lines 308-317: "...Our findings indicate that c-Fos expression in the KET group is significantly elevated compared to the ISO group, and the saline group exhibits notably higher c-Fos expression than the home cage group, as seen in Supplementary Figures 2 and 3. Intraperitoneal saline injections in the saline group, despite pre-experiment acclimation with handling and injections for four days, may still evoke pain and stress responses in mice. Subtle yet measurable variations in brain states between the home cage and saline groups were observed, characterized by changes in normalized EEG delta/theta power (home cage: 0.05±0.09; saline: -0.03±0.11) and EMG power (home cage: -0.37±0.34; saline: 0.04±0.13), as shown in Figure 3—figure supplement 1. These changes suggest a relative increase in overall brain activity in the saline group compared to the home cage group, potentially contributing to the higher c-Fos expression.…”
-
eLife assessment
This potentially important study used single-cell whole-brain imaging of the immediate early gene Fos to identify the brain areas recruited by two anesthetics, ketamine and isoflurane. The utilization of a custom software package to align and analyze brain images for c-Fos positive cells stands out as an impressive component of the approach. The results suggest these anesthetics might induce anesthesia via different brain regions and pathways, and raw fos showed shared and distinct activation patterns after ketamine- v. isoflurane-based anesthesia. However, the support for the primary conclusions is incomplete owing largely to concerns with the data transformation. The results could also be influenced by differences in route of administration between the drugs. This paper may be of interest to preclinical and clinical …
eLife assessment
This potentially important study used single-cell whole-brain imaging of the immediate early gene Fos to identify the brain areas recruited by two anesthetics, ketamine and isoflurane. The utilization of a custom software package to align and analyze brain images for c-Fos positive cells stands out as an impressive component of the approach. The results suggest these anesthetics might induce anesthesia via different brain regions and pathways, and raw fos showed shared and distinct activation patterns after ketamine- v. isoflurane-based anesthesia. However, the support for the primary conclusions is incomplete owing largely to concerns with the data transformation. The results could also be influenced by differences in route of administration between the drugs. This paper may be of interest to preclinical and clinical scientists working with anesthetic and dissociative drugs.
-
Reviewer #2 (Public Review):
Summary: In the revised manuscript, the authors aim to investigate brain-wide activation patterns following administration of the anesthetics ketamine and isoflurane, and conduct comparative analysis of these patterns to understand shared and distinct mechanisms of these two anesthetics. To this end, they perform Fos immunohistochemistry in perfused brain sections to label active nuclei, use a custom pipeline to register images to the ABA framework and quantify Fos+ nuclei, and perform multiple complementary analyses to compare activation patterns across groups.
In the latest revision, the authors have made some changes in response to our previous comments on how to fix the analyses. However, the revised analyses were not changed correctly and remain flawed in several fundamental ways.
Critical problems:
(1) …
Reviewer #2 (Public Review):
Summary: In the revised manuscript, the authors aim to investigate brain-wide activation patterns following administration of the anesthetics ketamine and isoflurane, and conduct comparative analysis of these patterns to understand shared and distinct mechanisms of these two anesthetics. To this end, they perform Fos immunohistochemistry in perfused brain sections to label active nuclei, use a custom pipeline to register images to the ABA framework and quantify Fos+ nuclei, and perform multiple complementary analyses to compare activation patterns across groups.
In the latest revision, the authors have made some changes in response to our previous comments on how to fix the analyses. However, the revised analyses were not changed correctly and remain flawed in several fundamental ways.
Critical problems:
(1) Before one can perform higher level analyses such as hiearchal cluster or network hub (or PC) analysis, it is fundamental to validate that you have significant differences of the raw Fos expression values in the first place. First of all, this means showing figures with the raw data (Fos expression levels) in some form in Figures 2 and 3 before showing the higher level analyses in Figures 4 and 5; this is currently switched around. Second and most importantly, when you have a large number of brain areas with large differences in mean values and variance, you need to account for this in a meaningful way. Changing to log values is a step in the right direction for mean values but does not account well for differences in variance. Indeed, considering the large variances in brain areas with high mean values and variance, it is a little difficult to believe that all brain regions, especially brain areas with low mean values, passed corrections for multiple comparisons test. We suggested Z-scores relative to control values for each brain region; this would have accounted for wide differences in mean values and variance, but this was not done. Overall, validation of anesthesia-induced differences in Fos expression levels is not yet shown.
(2) Let's assume for a moment that the raw Fos expression analyses indicate significant differences. They used hierarchal cluster analyses as a rationale for examining 53 brain areas in all subsequent analyses of Fos expression following isoflurane versus home cage or ketamine versus saline. Instead, the authors changed to 201 brain areas with no validated rationale other than effectively saying 'we wanted to look at more brain areas'. And then later, when they examined raw Fos expression values in Figures 4 and 5, they assess 43 brain areas for ketamine and 20 brain areas for isoflurane, without any rationale for why choosing these numbers of brain areas. This is a particularly big problem when they are trying to compare effects of isoflurane versus ketamine on Fos expression in these brain areas - they did not compare the same brain areas.
Less critical comments:
(3) The explanation of hierarchical level's in lines 90-95 did not make sense.
(4) I am still perplexed by why the authors consider the prelimbic and infralimbic cortex 'neuroendocrine' brain areas in the abstract. In contrast, the prelimbic and infralimbic were described better in the introduction as "associated information processing" areas.
5- It looks like overall Fos levels in the control group Home (ISO) are a magnitude (~10-fold) lower than those in the control group Saline (KET) across all regions shown. This large difference seems unlikely to be due to a biologically driven effect and seems more likely to be due to a technical issue, such as differences in staining or imaging between experiments. The authors discuss this issue but did not answer whether the Homecage-ISO experiment or at least the Fos labeling and imaging performed at the same time as for the Saline-Ketamine experiment?
-
Reviewer #3 (Public Review):
The present study presents a comprehensive exploration of the distinct impacts of Isoflurane and Ketamine on c-Fos expression throughout the brain. To understand the varying responses across individual brain regions to each anesthetic, the researchers employ principal component analysis (PCA) and c-Fos-based functional network analysis. The methodology employed in this research is both methodical and expansive. Notably, the utilization of a custom software package to align and analyze brain images for c-Fos positive cells stands out as an impressive addition to their approach. This innovative technique enables effective quantification of neural activity and enhances our understanding of how anesthetic drugs influence brain networks as a whole.
The primary novelty of this paper lies in the comparative …
Reviewer #3 (Public Review):
The present study presents a comprehensive exploration of the distinct impacts of Isoflurane and Ketamine on c-Fos expression throughout the brain. To understand the varying responses across individual brain regions to each anesthetic, the researchers employ principal component analysis (PCA) and c-Fos-based functional network analysis. The methodology employed in this research is both methodical and expansive. Notably, the utilization of a custom software package to align and analyze brain images for c-Fos positive cells stands out as an impressive addition to their approach. This innovative technique enables effective quantification of neural activity and enhances our understanding of how anesthetic drugs influence brain networks as a whole.
The primary novelty of this paper lies in the comparative analysis of two anesthetics, Ketamine and Isoflurane, and their respective impacts on brain-wide c-Fos expression. The study reveals the distinct pathways through which these anesthetics induce loss of consciousness. Ketamine primarily influences the cerebral cortex, while Isoflurane targets subcortical brain regions. This finding highlights the differing mechanisms of action employed by these two anesthetics-a top-down approach for Ketamine and a bottom-up mechanism for Isoflurane. Furthermore, this study uncovers commonly activated brain regions under both anesthetics, advancing our knowledge about the mechanisms underlying general anesthesia.
-
-
Author Response
The following is the authors’ response to the original reviews.
We sincerely thank the editor and reviewers for their constructive feedback on our manuscript. Based on their recommendations, we've conducted additional experiments, made revisions to the text and figures, and provide a point-by-point response below.
Reviewer #1 (Recommendations for the authors):
- The lack of behavioral/physiological measures of the depth of anesthesia (ventilation, heart rate, blood pressure, temperature, O2, pain reflexes, etc...) combined with the lack of dose-response and the use of different routes of administration makes the data difficult to interpret. Sure, there is a clear difference in network activation between KET and ISO, but are those effects due to the depth of the anesthesia, the route of administration, and the dose used? …
Author Response
The following is the authors’ response to the original reviews.
We sincerely thank the editor and reviewers for their constructive feedback on our manuscript. Based on their recommendations, we've conducted additional experiments, made revisions to the text and figures, and provide a point-by-point response below.
Reviewer #1 (Recommendations for the authors):
- The lack of behavioral/physiological measures of the depth of anesthesia (ventilation, heart rate, blood pressure, temperature, O2, pain reflexes, etc...) combined with the lack of dose-response and the use of different routes of administration makes the data difficult to interpret. Sure, there is a clear difference in network activation between KET and ISO, but are those effects due to the depth of the anesthesia, the route of administration, and the dose used? The lack of behavioral/physiological measures prevents the identification of brain regions responsible for some of the physiological effects and different effects of anesthetics.
We greatly appreciate the insightful feedback you have provided.
In response to the concerns about anesthesia depth:
a. We recorded EEG and EMG data both before and after drug administration. Supplementary Figure 1 showcases the changes in EEG and EMG power observed 30 minutes post-drug administration, normalized to a 5-minute baseline taken prior to the drug's administration. Notably, no significant differences were detected in the normalized EEG and EMG power between the ISO and KET groups. Given the marked statistical differences observed between the EEG power in the KET and saline groups, and the EMG power in the home cage and ISO groups, we infer that both anesthetics effectively induced a loss of consciousness.
b. We used standard methods and doses for inducing c-Fos expression with anesthetics, as documented in prior studies (Hua, T, et al., Nat Neurosci, 2020; 23(7): 854-868; Jiang-Xie, L F, et al., Neuron, 2019; 102(5): 1053-1065.e4; Lu, J, et al., J Comp Neurol, 2008; 508(4): 648-62). In future research, it might be more optimal to adopt continuous intraperitoneal or intravenous administration of ketamine.
c. Within the scope of our study, while disparities in anesthesia duration might potentially influence the direct statistical comparison of ISO and KET, such disparities wouldn't compromise the identification of brain regions activated by KET or ISO when assessed as distinct stimuli (ISO vs. home cage; KET vs. saline) or in relation to their individual functional network hub node results.
We hope these additions and clarifications adequately address your concerns and enhance the comprehensibility of our data.
- Under anesthesia there should be an overall reduction of activity, is that the case? There is no mention of significantly downregulated regions. The authors use multiple transformations of the data to interpret the results (%, PC1 values, logarithm) without much explanation or showing the full raw data in Fig 1. It would be helpful to interpret the data to compare the average fos+ neurons in each region between treatment and control for each drug.
Absence of Significantly Downregulated Regions Under Anesthesia: There are two primary reasons for this observation:
a. Our study's sampling time for the home cage, ISO, saline, and KET groups was during Zeitgeber Time (ZT) 6-7.5. During this period, mice in both the home cage and saline groups typically showed reduced spontaneous activity or were in a sleep state. Our Supplementary Figure 1 EEG and EMG data corroborate this, revealing no significant statistical variations in EEG power between the home cage and ISO groups, nor in EMG power between the saline and KET groups.
b. Our immunohistochemical data showed that the total number of c-Fos positive cells in the two control groups was notably lower than in the experimental groups (Saline group vs KET group: 11808±2386 versus 308705±106131, P = 0.006; Home cage vs ISO group: 3371±840 vs 12326±1879, P = 0.001). This is in line with previous studies, like the one by Cirelli C and team, which found minimal c-Fos expression throughout the mouse brain during physiological sleep (Cirelli, C, and G Tononi, Sleep, 2000; 23(4): 453-69). Thus, in our analysis, we did not detect regions with significant downregulation when comparing anesthetized mice with controls.
Interpreting Raw Data from Figure 1: Regarding the average Fos+ neurons:
In Figures 4 and 5, we utilized raw data (c-Fos cell count) to assess cell expression differences across 201 brain regions within each group. Only brain regions that had significant statistical differences after multiple comparison corrections are shown in the figures.
- I do not understand their interpretation of the PCA analyses. For instance, in Fig 2 they claim that KET is associated with PC1 while ISO is associated with PC2. Looking at the distribution of points it's clear that the KET animals are all grouped at around +2.5 on PC1 and -2.0 on PC2, this means that KET is associated with both PC1 and PC2 to a similar degree (2 to 2.5). Moreover, I'm confused about why they use PCA to represent the animals/group. PCA is a powerful technique to reduce dimensionality and identify groups of variables that may represent the same underlying construct; however, it is not the best way to identify clusters of individuals or groups.
Clarification on PCA Analyses in Figure 2: Thank you for pointing out the ambiguities in our initial presentation of the PCA analyses. We are grateful for the opportunity to address these concerns.
KET and ISO Associations with PC1 and PC2: You rightly observed that KET samples manifest both a positive value on PC1 (around +2.5) and a negative one on PC2 (around -2.0), suggesting that KET has a substantial influence on both principal components. In PCA, a positive score implies a positive association with that component, whereas a negative score suggests a negative association. Contrarily, ISO samples predominantly exhibit values around +2.5 on PC2, with nearly neutral values for PC1, underlining its stronger association with PC2 and lack of significant correlation with PC1. To ensure transparency and clarity, we've adjusted the corresponding descriptions in our manuscript, which can be found on Line 100.
Rationale Behind Using PCA to Represent Animals/Groups: Our initial step was to conduct PCA clustering analysis on the 201 brain regions within both the ISO and KET groups. In the accompanying chart, varying colors denote different brain regions, while distinct shapes represent separate clusters. There wasn't a pronounced distribution pattern within the ISO and KET groups, which led us to adopt the current computational method presented in the paper. This approach was chosen to directly contrast the relative differential expressions between ISO and KET.
We deeply value your feedback, which has steered us toward a clearer and more accurate presentation of our data. We genuinely appreciate your meticulous review.
Author response image 1.

- The actual metric used for the first PCA is unclear, is it the FOS density in each of the regions (some of those regions are large and consist of many subregions, how does that affect the analysis) is it the %-fos, or normalized cells? The wording describing this is variable causing some confusion. How would looking at these different metrics influence the analysis?
Thank you for raising concerns about the metrics used in our PCA analysis. We recognize the need for clearer exposition and appreciate the opportunity to clarify.
PCA Metrics: The metric for our PCA is calculated by obtaining the ratio of the Fos density within a specific brain region to the global Fos density across the brain. Briefly, this entails dividing the number of Fos-positive cells in a given region by its volume, and then comparing this to the Fos density of the whole brain. The logarithm of this ratio provides our PCA metric. We've elaborated on this in the Materials and Methods section (Lines 401) and enhanced clarity in our revised manuscript, particularly at Line 96.
In Figure 2A, we employed 53 larger, mutually exclusive brain regions based on the reference from the study by Do et al. (eLife, 2016;5:e13214). However, in Figure 3A, we used a more detailed segmentation, incorporating 201 distinct brain areas that are more granular than those in Figure 2A. Notably, the PCA results from both representations were consistent. The rationale behind selecting either the 53 or 201 brain regions can be found in our response to Question 10.
Rationale for Metric Choice: The log ratio of regional c-Fos densities relative to the global brain density was chosen due to:
a. Notable disparities in c-Fos cell expression across the groups.
b. A significant non-normal distribution of density values across animals within the group. Employing the log ratio effectively mitigates the impact of extreme values and outliers, achieving a more standardized data distribution.
We've added PCA plots based on c-Fos densities, depicted in Author response image 2. However, the data dispersion has resulted in a significantly spread-out horizontal scale for these visuals.
Author response image 2.

- Based on Fig 3 the authors concludes that ISO activates the hypothalamic regions and inhibits the cortex, however, Fig 1 shows neither an activation of the hypothalamus in the ISO nor an inhibition of the cortex when compared to home cage control. If anything it suggests the opposite.
Thank you for your insightful observations regarding the discrepancies between Figures 2 and 3. We believe that when you refer to Figure 1, you are actually referencing Figure 2C.
ISO activation in Hypothalamus: In Figure 2C, we regret the oversight where we inadvertently interchanged the positions of ISO and Saline. When accurately represented, Figure 2C indeed shows that ISO notably activates the periventricular zone (PVZ) and the lateral zone (LZ) of the hypothalamus compared to the home cage group. Moreover, there's a discernible difference in the hypothalamic response between ISO and KET.
ISO's Effect on the Cortex: The main aim of Figure 3 was to highlight the differing responses between ISO and KET in the cortex. Notably, KET demonstrates a positive correlation with PC1 (+7 on PC1), whereas ISO shows a negative association (-3 on PC1). Given that the coefficient of PC1 for the cortical region is positive, it suggests that the cortical areas activated by KET are inhibited by ISO (with KET's distribution around 0 on PC2). However, the divergence between ISO and the home cage is most apparent in PC2, with ISO clusters at +4 and the home cage approximately at -2, suggesting that ISO activates a different set of cortical nuclei. In alignment with this, Figure 2C also illustrates that ISO activates specific cortical areas, such as ILA and PIR, in contrast to the home cage.
Thus, Figure 3 primarily employs PCA to delineate the contrasts between ISO and KET, whereas Figure 2C emphasizes the comparison of each against their respective controls.
- Control for isoflurane should be air in the induction chamber rather than home cage. It is possible that Fos activation reflects handling/stress pre-anesthesia in the animals, which would increase Fos expression in the stress-related regions such as the BST, striatum (CeA), hypothalamus (PVH) and potentially the LC.
Thank you for emphasizing the importance of an appropriate control for Isoflurane.
In our efforts to minimize the potential impact of stress-induced c-Fos expression, we implemented several precautionary measures. Prior to the experiment, both groups of mice were subjected to handling and acclimatization within the induction chamber over four days. By the day of the experiment, for the mice in the experimental group, we ensured they were comfortable and exhibited no signs of distress or fear—such as cowering or evading. With care, we slowly relocated them to the nearby anesthesia induction chamber. Using 5% ISO, anesthesia was induced promptly, following a meticulously devised protocol to reduce stress impacts on c-Fos expression.
Moreover, existing studies have shown Isoflurane's activation of BST/CeA (Hua, T, et al., Nat Neurosci, 2020, 23: 854-868), PVH (Xu, Z, et al., British Journal of Anaesthesia, 2023, 130: 446-458), and LC (Lu, J, et al., J Comp Neurol, 2008, 508: 648-62), even when using oxygen controls. Such literature supports our findings, indicating that the activation we observed was indeed due to Isoflurane and not purely stress-related.
- In the Ket network there are a few anticorrelated regions, most of which are amongst the list of the most activated regions, does this mean that the strong correlation results from an overall decreased activation? And if so, is it possible that the ketamine anesthesia was stronger than the isoflurane, causing a more general reduction in activity?
The pronounced correlations observed within the ketamine (KET) network do not signify a generalized decrease in activation. Instead, these correlations reflect significantly enhanced activity in specific regions under KET anesthesia. This amplified correlation is an indication of a more widespread increase in activity, rather than a decrease. These findings are consistent with previous research, which showed that anesthetic doses of ketamine produce patterns of Fos expression in the CNS similar to wakefulness (Lu, J, et al., J Comp Neurol, 2008; 508(4): 648-62).
Regarding the comparative strength of KET versus ISO anesthesia, our electroencephalographic evidence confirms that both agents induce a loss of consciousness. No significant differences were observed in EEG and EMG readings within the first 30 minutes post-administration. In future research, a continuous intravenous or intraperitoneal administration of KET might be a preferable method.
- Since they have established networks it would be easy and useful to look at how the different regions identified (sleep, pain, neuroendocrine, motor-related, ...) work together to maintain analgesia, are they within the same module? Do they become functionally connected and is this core network of functional connections similar for KET and ISO?
Thank you for your suggestion. In response to your inquiry, we undertook analysis of the core functional networks for KET and ISO, using a set threshold at r>0.82 and P<0.05. For evaluating the modularity of each network, we utilized Newman's spectral community detection algorithm.
(A) The ISO’s core functional network (56 nodes, 372 edges) predominantly divides into two modules with a modularity quotient of 0.345. ISO-active regions include arousal-associated regions (PL, ILA, PVT), analgesia-related (CeA, LC, PB), neuroendocrine function nuclei (TU, PVi, ARH, PVH, SON) as detailed in Figure 5. Notably, ARH and SON weren't incorporated into the core network. Analgesia-associated regions, such as CeA, LC, and PB, reside within module 1, while neuroendocrine nuclei are spread between modules 1 and 2.
(B) In contrast, KET's core functional network (61 nodes, 1820 edges) splits into three distinct modules, but its low modularity quotient (0.06) indicates a lack of clear functional modularization, suggesting denser interconnections among brain regions. Furthermore, functionally-related regions such as arousal (PL, ILA, PVT, DR), analgesia-related (ACA, APN, PAG, LC), and neuroendocrine regulation (PVH, SON),etc., as seen in Figure 4, are distributed across different modules. This distribution may implies that functions like analgesia and neuroendocrine regulation are not governed by simple, linear processes, but arise from complex, overlapping pathways spanning various modules and functional zones.
In summary, the core functional networks of ISO and KET differ, with functionally-related regions spanning multiple modules, reflecting their diverse roles in varied physiological regulations.
Author response image 3.
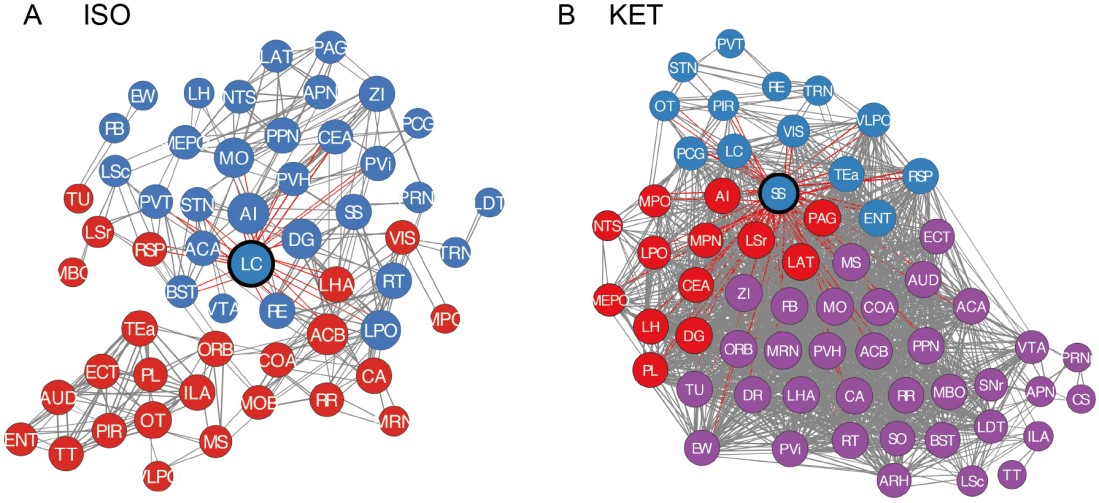
- The naming of the function of some of the regions is very much debatable. For instance, PL/ILA are named "sleep-wakefulness regulation" regions in the paper. I can think of many more important functions of the PL/IL including executive functions, behavioral flexibility, and emotional control. It is unclear how the functions of all the regions were attributed. I am not sure that this biased labeling of structure-function is useful to the reports, it may instead suggest wrong conclusions.
Thank you for your thoughtful feedback regarding our classification of the functions of the PL/ILA regions in our manuscript.
We recognize the challenge in accurately defining the functions of brain regions. While there is evidence highlighting the role of PL/ILA in arousal pathways, we also acknowledge their documented roles in executive functions, behavioral flexibility, and emotional control. In response to your comments, we have refined our description, changing "sleep-wakefulness regulation" to "wake-promoting pathways" (see Line: 159, 164).
It's worth noting that many brain regions, including the PL/ILA, have multiple functions. We agree that a single label might not capture the entirety of their roles. To provide a broader perspective, we will add a section in our manuscript that sheds light on the varied functions of these regions (Line: 181).
- A point of concern and confusion is the number of brain regions analyzed. In the introduction, it is mentioned that 987 brain regions are considered, but this is reduced to 53 selected brain regions in Figure 2, then 201 brain regions in Figure 3, and reduced again to 63 for the network analysis. The rationale for selecting different brain regions is not clear.
For the 987 brain regions: Using the standard mouse atlas available at http://atlas.brain-map.org/, the mouse brain is organized into nine levels. The broadest category is the grey matter, which then progresses to more specific subdivisions, totaling 987 unique regions.
For the 53 brain regions: To effectively understand the activation patterns of ISO and KET, we started with a broad approach, looking at larger brain areas like the thalamus and hypothalamus. This broad view, presented in Figure 2, focuses on the 5th-level brain regions, encompassing 53 primary areas. This methodology is also employed in the study by Do et al. (Elife, 2016; 5: e13214). We have added the rationale for selecting these brain regions in the main text (Line: 92).
Regarding the 201 brain regions in Figures 3, 4, and 5: We delved deeper, examining the 6th-level brain regions, a common granularity in neuroscience research. This detailed view allowed us to highlight specific areas, like the CeA and PVH (Line:129).
Finally, for Figures 6 and 7, we selected 63 regions that were activated by both ISO and KET, as well as regions previously reported to be related to the mechanism of general anesthesia(Leung, L, et al., Progress in neurobiology, 2014; 122: 24-44) (Line: 220). Using these regions, we analyzed the correlation of c-Fos expression, aiming to construct a functional brain network with strong positive connections.
We hope this clarifies our approach and the rationale behind our region selection at each stage of the study. Thank you for your attention to this detail.
- The statistical analysis does not seem appropriate considering the high number of comparisons. They use simple t-tests without correction for multiple comparisons.
Thank you for pointing out the concern regarding our statistical analysis. In the revised manuscript, we addressed the issue of multiple comparisons correction in our t-tests. We adopted the statistical methods detailed in the papers by Renier, N, et al., Cell, 2016; and Benjamini, Y, and Y Hochberg, 1995. P-values were adjusted for multiple comparisons using the two-stage linear step-up procedure of Benjamini, Krieger, and Yekutieli, with a false discovery rate (FDR) threshold (Q) of 0.05. This approach is now explained in the Materials and Methods section (Line: 434). After this adjustment, the brain regions we initially identified remained statistically significant. Furthermore, we revisited the original immunohistochemical images to confirm the differences in c-Fos cell expression between the experimental and control groups, reinforcing our conclusions.
- There is no statistical analysis in Fig 2C。
Thank you for bringing to our attention the lack of statistical analysis in Fig 2C. We have now added the relevant statistical data in Supplementary Table 1 and provided annotations in Fig 2C to reflect this.
Reviewer #2
- The authors report 987 brain regions in the introduction, but I cannot find any analysis that incorporates these or even which regions they are. Very little rationale is provided for the regions included in any of the analyses and numbers range from 53 in Figure 1, to 201 in Figure 3, to 63 in Figure 6. It would help if the authors could first survey Fos+ counts across all regions to identify a subset that is of interest (significantly changed by either condition compared to control) for follow up analysis.
Thank you for your insightful comments on the number of brain regions analyzed in our study.
987 Brain Regions: The reference to 987 brain regions from the standard mouse atlas (http://atlas.brain-map.org/) represents the entire categorization of the mouse brain across nine levels. We recognize that a comprehensive analysis of all these regions would be valuable, but to ensure clarity and depth, we took a focused approach.
Region Selection Rationale:
Figure 2: Concentrated on 5th-level brain regions (53 areas), inspired by methods from Do et al. (eLife, 2016;5:e13214). This provided a broad overview of c-Fos expression differences. Figures 4 and 5: Delved into 6th-level brain regions (201 areas), a common practice in neuroscience for more detailed study. Figure 6: We focused on 63 regions, which encompass not only the regions activated by both ISO and KET but also those previously reported to be associated with the mechanisms of general anesthesia. Methodological Approach: Our region selection was rooted in identifying areas with significant changes under anesthetic conditions compared to controls. This staged approach allowed a targeted analysis of the most affected regions, ensuring robust conclusions.
Enhancements: We've incorporated comparative analyses of activated brain regions at different hierarchical levels in Figures 4 and 5. For clearer comprehension, we’ve added clarifications in the manuscript at Lines: 92, 130, and 220.
- Different data transformations are used for each analysis. One that is especially confusing is the 'normalization' of brain regions by % of total brain activation for each animal prior to PCA analysis in Figures 2 and 3. This would obscure any global differences in activation and make it unlikely to observe decreases in activation (which I think is likely here) that could be identified using the Fos+ counts after normalizing for region size (ie. Fos+ count / mm3) which is standard practice in such Fos-based activity mapping studies. While PCA can be powerful approach to identify global patterns, the purpose of the analysis in its current form is unclear. It would be more meaningful to show that regional activation patterns (measured as counts/mm3) are on separate PCs by group.
Thank you for your thoughtful comments. We regret any confusion caused by our initial presentation. For the PCA analysis in Figures 2A and 3A, we calculated the ratio of cell density in each brain region to the overall brain density, and then applied a logarithmic transformation to this ratio. Our approach in Figure 2C was to use the proportion of c-Fos cell counts in individual brain regions to the total cell counts throughout the brain. This methodology considers variations in overall c-Fos cell counts across animals, effectively mitigating potential biases due to differential global activation levels across subjects.
Furthermore, our direct comparison of differences in c-Fos cell counts between ISO, KET, and their respective control groups in Figures 4 and 5 addresses your concerns about potential decreases in activation. Notably, we did not identify any brain regions with significant suppression in these figures, which is consistent with the trends observed post-normalization in Figure 2C.
Given your feedback, we conducted another PCA using cell densities for each region (counts/mm3). However, we found significant variability and non-normal distribution of c-Fos density across the groups, leading to extensive data dispersion. Consequently, normalizing the cell counts across regions and then applying a logarithmic transformation before PCA might be more appropriate.
Author response image 4.

Additionally, our exploration of regional activation patterns using PCA analysis for ISO and KET separately, based on the logarithm ratio of the c-Fos density, revealed that there was no distinct clustering feature among the different brain regions (as illustrated in Author response image 5: colors represented distinct brain regions, while the shapes were indicative of different clusters). This observation further suggests that our original statistical approach might be more suitable.
Author response image 5.
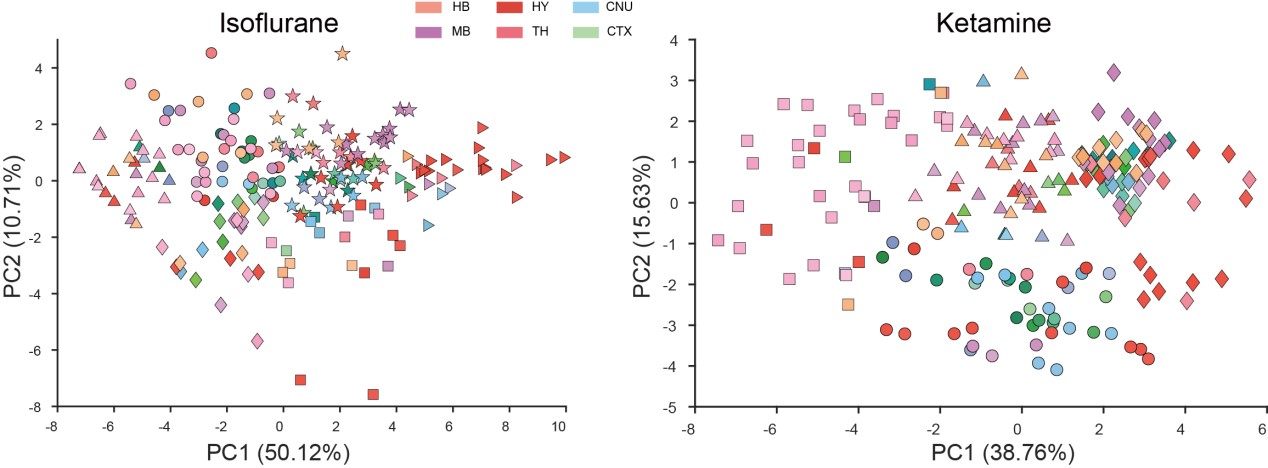
- Critical problem: The authors include a control group for each anesthetic (ketamine vs. saline, isofluorane vs. homecage) but most analyses do not make use of the control groups or directly compare Fos+ counts across the groups. Strictly speaking, they should have compared relative levels of induction by ketamine versus induction by isoflurane using ANOVAs. Instead, each type of induction was separate from the other. This does not account for increased variability in the ketamine versus isoflurane groups. There is no mention in the Statistics section or in Results section that any multiple comparison corrections were used. It appears that the authors only used Students t-test for each region and did not perform any corrections.
We appreciate the reviewer's insights and have addressed your concerns:
Given the pronounced difference in c-Fos cell count expression between the KET and ISO groups, a direct comparison of Fos+ counts may not effectively capture their inherent disparities. To better highlight these distinctions, we used the logarithm ratio of c-Fos density in our PCA analysis (Figure 3), mitigating potential disparities in overall cell counts between samples and emphasizing relative variations. However, in response to your feedback, we've included additional analyses. Author response image 6 depicts the c-Fos density (cells/mm^3) across different brain regions for the home cage, ISO, saline, and KET groups, with regions like the cerebral cortex, cerebral nuclei, thalamus, and others differentiated by shaded backgrounds. Data are represented as mean ± SEM. We performed a one-way ANOVA followed by Tukey’s post hoc test, marking significant differences between ISO and KET with asterisks: ***P < 0.001, **P < 0.01, *P < 0.05.
Regarding multiple comparison corrections, we've conducted thorough analyses on the data in Figure 2C and Figures 4, 5, and 6, implementing multiple comparison corrections. The detailed methodology is provided in the “Statistical analysis” section.
Author response image 6.
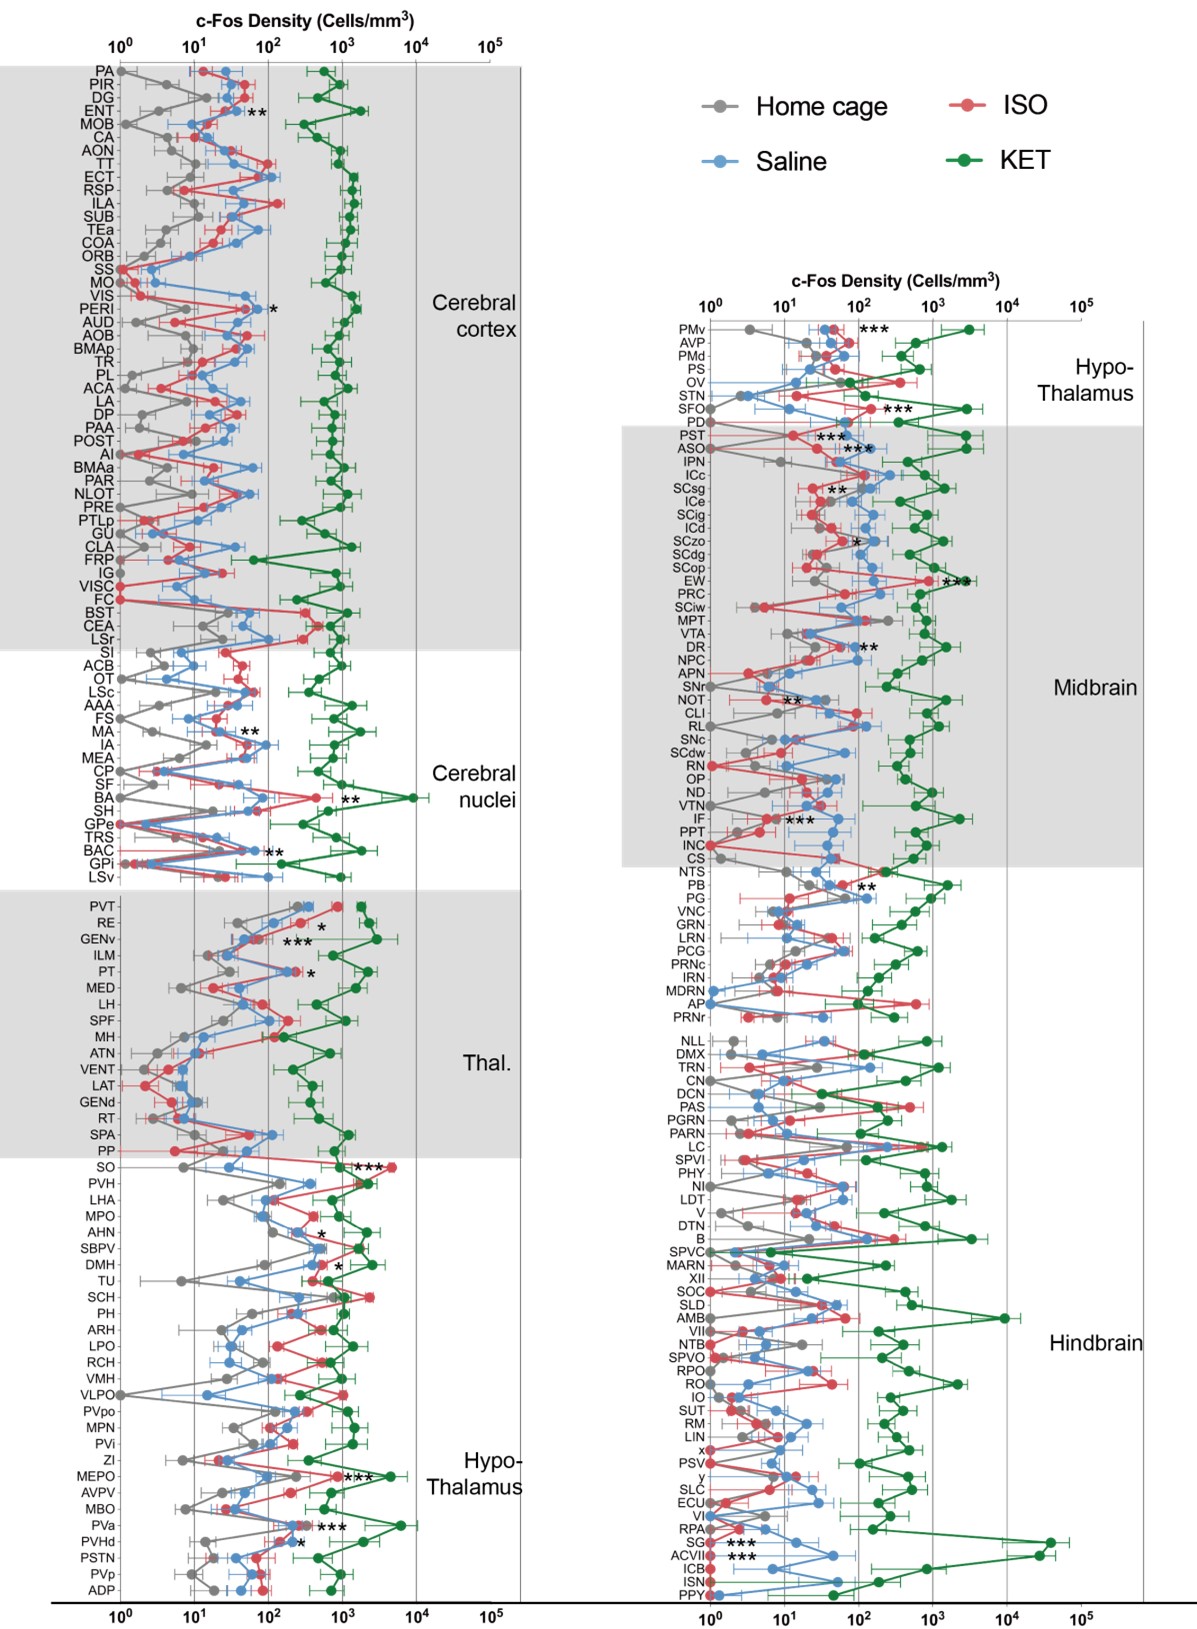
- Figures 4 and 5 show brain regions 'significantly activated' following KET or ISO respectively, but again a subset of regions are shown and the stats seem to be t-tests with no multiple comparisons correction. It would help to show these two figures side by side, include the same regions, and keep the y axis ranges similar so the reader can easily compare the 'activation patterns' across the two treatments. Indeed, it looks like KET/Saline induced activation is an order or magnitude or two higher than ISO/Homecage. I would also recommend that this be the first data figure before any other analyses and maybe further analysis could be restricted to regions that are significantly changed in following KET or ISO here.
Thank you for your constructive feedback regarding Figures 4 and 5.
Comparison and Presentation of Figures 4 and 5: We acknowledge your suggestion to present these figures side by side for easier comparison. In the supplementary figure provided in the previous question, we've placed Figures 4 and 5 adjacent to each other, with consistent y-axis ranges, ensuring that readers can make direct comparisons between the activation patterns elicited by KET and ISO.
Statistical Concerns and Region Selection: As mentioned in our previous response, we have conducted multiple comparison corrections on the data presented in Figures 4 and 5. Detailed procedures are elaborated in the “Statistical analysis” section. We believe this approach addresses your concerns regarding the use of t-tests without corrections for multiple comparisons.
Difference in Activation Levels: We observed that the c-Fos activation due to KET is significantly higher than that from ISO. When presented side-by-side using the same scale, ISO activations appear less prominent, potentially mask subtle differences in the activation patterns of ISO, particularly if both KET and ISO showed changes in the same direction in certain brain regions but differed in magnitude. To address this, we used the proportion of c-Fos cell counts in Figure 2C, the logarithm ratio of c-Fos density in Figure 2A and Figure 3. This method emphasizes the relative changes, rather than absolute values, giving a more balanced view of the effects of each treatment.
- Analyses in Figure 6 and 7 are interesting but again the choice of regions to include is unclear and makes interpreting the results impossible. For example, in Figure 7 it is unclear why the list of regions in bar graphs showing Degree and Betweenness Centrality are not the same even within a single row?
Thank you for your pertinent observation. The choice of brain regions in Figures 6 and 7 was carefully determined based on two main criteria: regions that were significantly activated by ISO or KET within the scope of our study, and those previously reported to be associated with anesthesia mechanisms and sleep-wake regulation.
Regarding your second concern on Figure 7, the discrepancies observed in the x-axes of the bar graphs arise from our methodological approach. We prioritized presenting the top 20% of regions based on their Degree or Betweenness Centrality values. By separately ranking these regions from highest to lowest, the regions presented for each metric inherently differ. This approach was taken to elucidate nodes that consistently emerge as significant across both metrics, thereby highlighting core nodes in the functional network. Were we to use a consistent x-axis without this ranking, it would not only necessitate a more extensive presentation but might also dilute the emphasis on key information. To clarify this methodology and its rationale for our readers, we have expanded upon this in the manuscript at Line 243.
We hope these clarifications address your concerns and facilitate a clearer understanding of our findings.
Reviewer #1 (Recommendations For The Authors):
Minor points
- In Table 1: the separation of which substructures belong to which brain structure is not clear
- Line 132 on page 3 seems to repeat the sentence earlier in the paragraph "KET predominantly affects brain regions within the cerebral cortex (CTX), while significantly inhibiting the hypothalamus, midbrain, and hindbrain."
- Typos
a) Line 99/100 and 130 Central nucleus (CNU) should be cerebral nucleus
b) Comma on line 166
c) Fig. 4D: KET instead of Keta
d) Line 263 "ep"
e) Line 332: 35" "ml (add space)
- Will data and code be made available?
Thank you for your detailed feedback.
We have revised Table 1 to clarify which substructures belong to which brain structures.
We acknowledge the redundancy and have now edited line 139 on page 3 to remove the repeated sentence regarding the effects of KET on brain regions.
We have addressed the typos you pointed out:
a. The terms "Central nucleus (CNU)" have been corrected to "cerebral nucleus."
b. The comma issue on line 166 has been rectified.
c. In Fig. 4D, we have corrected "Keta" to "KET."
d. We have corrected the typo "ep" on line 263.
e. A space has been added between "35" and "ml" on line 332 as you indicated.
- Regarding the availability of data and code, we are currently conducting additional analyses related to this study. Once these analyses are completed, we will be more than happy to make the data and code available.
Thank you for assisting us in improving our manuscript.
Reviewer #2 (Recommendations For The Authors):
Minor comments:
- The term 'whole-brain mapping' in the title suggests that the mapping was performed on 'intact brains' where in fact serial sections were used here. Maybe the authors could change to 'brain-wide mapping' to align better with the study.
Thank you for your insightful comments.
We have revised the title as suggested, changing "whole-brain mapping" to "brain-wide mapping".
- It is unclear if the mice were kept under anesthesia for the 90-min duration and how the authors monitored the level of sedation. Additionally, if the KET mice were already sedated why were they further sedated with ISO before perfusions and tissue extraction? The methods should be clarified and any potential confounds discussed.
To maintain consistency in the experimental protocol and to reduce stress reactions in the mice, ISO was used before perfusion in all cases. However, this does not affect c-Fos expression as the expression of c-Fos protein starts 20-30 minutes after stimulation (Lara Aparicio, S Y, et al., NeuroSci, 2022; 3(4): 687-702).
We appreciate your guidance in enhancing the clarity of our manuscript.
Reviewer #3 (Recommendations For The Authors):
Recommendation: Minor corrections.
- The authors should delve deeper into the molecular mechanisms underlying the observed effects, particularly the changes associated with NMDA and GABA receptors. Exploring these mechanisms would provide a more comprehensive understanding of how Ketamine and Isoflurane modulate neural activity and induce anesthesia.
- The clinical relevance of these findings has not been sufficiently addressed. It would be valuable to elaborate on how the current research outcomes could potentially lead to changes in current anesthesia practices. For instance, identifying the distinct pathways of action for Ketamine and Isoflurane could aid anesthesiologists in selecting the most appropriate anesthetic based on the specific needs of individual patients or surgical procedures.
- Both Ketamine and Isoflurane have been associated with neurotoxicity. It is important to discuss how the c-Fos activation induced by these anesthetics could contribute, at least partially, to anesthesia-related neurotoxicity. Examining the potential neurotoxic effects would provide a more comprehensive understanding of the risks associated with these anesthetics and aid in the development of safer anesthesia protocols.
Thank you for your valuable suggestions.
Regarding the three points (1, 2, and 3) you've raised, we fully recognize their significance. In the current study, our primary focus was on the differential impacts of Isoflurane and Ketamine on widespread c-Fos expression in the brain. However, we indeed acknowledge the importance of delving deeper into these mechanisms and their clinical relevance. Therefore, we intend to explore these critical issues in greater detail in our future research endeavors.
We appreciate your feedback, which provides constructive guidance for our subsequent research directions.
-
eLife assessment
This potentially important study used single-cell whole-brain imaging of the immediate early gene Fos to identify the brain areas recruited by two anesthetics, ketamine and isoflurane. The utilization of a custom software package to align and analyze brain images for c-Fos positive cells stands out as an impressive component of the approach. The results suggest these anesthetics might induce anesthesia via different brain regions and pathways, and raw fos showed shared and distinct activation patterns after ketamine- v. isoflurane- vs. based anesthesia. However, the support for the primary conclusions is incomplete owing largely to concerns with the data transformation. The results could also be influenced by differences in route of administration between the drugs and depth of anesthesia. With these issues addressed, …
eLife assessment
This potentially important study used single-cell whole-brain imaging of the immediate early gene Fos to identify the brain areas recruited by two anesthetics, ketamine and isoflurane. The utilization of a custom software package to align and analyze brain images for c-Fos positive cells stands out as an impressive component of the approach. The results suggest these anesthetics might induce anesthesia via different brain regions and pathways, and raw fos showed shared and distinct activation patterns after ketamine- v. isoflurane- vs. based anesthesia. However, the support for the primary conclusions is incomplete owing largely to concerns with the data transformation. The results could also be influenced by differences in route of administration between the drugs and depth of anesthesia. With these issues addressed, this paper would be of interest to preclinical and clinical scientists working with anesthetic and dissociative drugs.
-
Reviewer #1 (Public Review):
Overall, the manuscript has been improved by addressing some of the concerns, however, I am still very confused about the data analysis due to the use of data transformation (relative %fos), the fact that some graphs only show regions that are significant and the interpretation of the PCA analysis which I find inappropriate. Moreover, many answers in the rebuttal did not make it to the final manuscript and are not discussed and limitations raised by the reviewers are not discussed either.
1a. The addition of the EEG/EMG is useful, however, this information is not discussed. For instance, there are differences in EEG/EMG between the two groups (only Ket significantly increased delta/theta power, and only ISO decreased EMG power). These results should be discussed as well as the limitation of not having …
Reviewer #1 (Public Review):
Overall, the manuscript has been improved by addressing some of the concerns, however, I am still very confused about the data analysis due to the use of data transformation (relative %fos), the fact that some graphs only show regions that are significant and the interpretation of the PCA analysis which I find inappropriate. Moreover, many answers in the rebuttal did not make it to the final manuscript and are not discussed and limitations raised by the reviewers are not discussed either.
1a. The addition of the EEG/EMG is useful, however, this information is not discussed. For instance, there are differences in EEG/EMG between the two groups (only Ket significantly increased delta/theta power, and only ISO decreased EMG power). These results should be discussed as well as the limitation of not having physiological measures of anesthesia to control for the anesthesia depth.
1b. The possibility that the differences in fos observed may be due to the doses used should be discussed.
1c. The possibility that the differences in fos observed may be due kinetic of anesthetic used should be discussed.2b. I am confused because Fig 2C seems to show significant decrease in %fos in the hypothalamus, midbrain and cerebellum after KET, while the author responded that " in our analysis, we did not detect regions with significant downregulation when comparing anesthetized mice with controls." Moreover the new figure in the rebuttal in response to reviewer 2 suggests that Ket increases Fos in almost every single region (green vs blue) which is not the conclusion of the paper.
3. There are still critical misinterpretations of the PCA analysis. For instance, it is mentioned that "KET is associated with the activation of cortical regions (as evidenced by positive PC1 coefficients in MOB, AON, MO, ACA, and ORB) and the inhibition of subcortical areas (indicated by negative coefficients) " as well as "KET displays cortical activation and subcortical inhibition, whereas ISO shows a contrasting preference, activating the cerebral nucleus (CNU) and the hypothalamus while inhibiting cortical areas. To reduce inter-individual variability." These interpretations are in complete contradiction with the answer 2b above that there was no region that had decreased Fos by either anesthetic.
4. I still do not understand the rationale for the use of that metric. The use of a % of total Fos makes the data for each region dependent on the data of the other regions which wrongly leads to the conclusion that some regions are inhibited while they are not when looking at the raw data. Moreover, the interdependence of the variable (relative density) may affect the covariance structure which the PCA relies upon. Why not using the PCA on the logarithm of the raw data or on a relative density compared to the control group on a region-per-region basis instead of the whole brain?
Fig. 2B: it's unclear to me why the regions are connected by a line. Such representation is normally used for time series/within-subject series. What is the rationale for the order of the regions and the use of the line? The line connecting randomly organized regions is meaningless and confusing.
Fig 6A. the correlation matrices are difficult to interpret because of the low resolution and arbitrary order of brain regions. I recommend using hierarchical clustering and/or a combination of hierarchical clustering and anatomical organization (e.g. PMID: 31937658). While it is difficult to add the name of the regions on the graph I recommend providing supplementary figures with large high-resolution figures with the name of each brain region so the reader can actually identify the correlation between specific brain regions and the whole brain,
Rationale for Metric Choice: Note that I do not dispute the choice of the log which is appropriate, it is the choice of using the relative density that I am questioning.
5. I am still having difficulties understanding Fig. 3.
Panel A: The lack of identification for the dots in panel A makes it impossible to understand which regions are relevant.
Panel B: what is the metric that the up/down arrow summarizes? Fos density? Relative density? PC1/2?
Panel C: it's unclear to me why the regions are connected by a line. Such representation is normally used for time series/within-subject series. What is the rationale for the order of the regions? -
Reviewer #2 (Public Review):
In the revised manuscript, the authors aim to investigate brain-wide activation patterns following administration of the anesthetics ketamine and isoflurane, and conduct comparative analysis of these patterns to understand shared and distinct mechanisms of these two anesthetics. To this end, they perform Fos immunohistochemistry in perfused brain sections to label active nuclei, use a custom pipeline to register images to the ABA framework and quantify Fos+ nuclei, and perform multiple complementary analyses to compare activation patterns across groups. This is an interesting line of research and a tour de force in brain-wide Fos quantification.
I appreciate many of the changes that were made in the revised manuscript, including FDR correction and transparency in showing their results with and without …
Reviewer #2 (Public Review):
In the revised manuscript, the authors aim to investigate brain-wide activation patterns following administration of the anesthetics ketamine and isoflurane, and conduct comparative analysis of these patterns to understand shared and distinct mechanisms of these two anesthetics. To this end, they perform Fos immunohistochemistry in perfused brain sections to label active nuclei, use a custom pipeline to register images to the ABA framework and quantify Fos+ nuclei, and perform multiple complementary analyses to compare activation patterns across groups. This is an interesting line of research and a tour de force in brain-wide Fos quantification.
I appreciate many of the changes that were made in the revised manuscript, including FDR correction and transparency in showing their results with and without transformation. However, several key issues described in our first review have not been addressed.
1-Aside from issues with their data transformation (see below), (a) I think they have some interesting Fos counts data in Figures 4B and 5B that indicate shared and distinct activation patterns after KET vs. ISO based anesthesia. These data are far closer to the raw data than PC analyses and need to be described and analyzed in the first figures long before figures with the more abstracted PC analyses. In other words, you need to show the concrete raw data before describing the highly transformed and abstracted PC analyses. (b) This gets to the main point that when selecting brain areas for follow up analyses, these should be chosen based on the concrete Fos counts data, not the highly transformed and abstracted PC analyses.
2-Now, the choice of data transformation for Fos counts is the most significant problem. First, the authors show in the response letter that not using this transformation (region density/brain density) leads to no clustering. However, they also showed the region-densities without transformation (which we appreciate) and it looks like overall Fos levels in the control group Home (ISO) are a magnitude (~10-fold) higher than those in the control group Saline (KET) across all regions shown. This large difference seems unlikely to be due to a biologically driven effect and seems more likely to be due to a technical issue, such as differences in staining or imaging between experiments. Was the Homecage-ISO experiment or at least the Fos labeling and imaging performed at the same time as for the Saline-Ketamine experiment? Please state the answer to this question in the Results section one way or the other.
3-Second, they need to deal with this large difference in overall staining or imaging for these two (Home/ISO and Saline/KET) experiments more directly; their current normalization choice does not really account for the large overall differences in mean values and variability in Fos counts (e.g. due to labeling and imaging differences).
3a-I think one option (not perfect but I think better than the current normalization choice) could be z-scoring each treatment to its respective control. They can analyze these z-scored data first, and then in later figures show PC analyses of these data and assess whether the two treatments separate on PC1/2. And if they don't separate, then they don't separate, and you have to go with these results.
3b-Alternatively, they need to figure out the overall intensity distributions from the different runs (if that the main reason of markedly different counts) and adjust their thresholds for Fos-positive cell detection based on this. I would expect that the saline and HC groups should have similar levels of activation, so they could use these as the 'control' group to determine a Fos-positive intensity threshold that gets applied to the corresponding 'treatment' group.
3c- If neither 3a nor 3b is an option then they need to show the outcomes of their analysis when using the untransformed data in the main figures (the untransformed data plots in their responses to reviewer are currently not in the main or supplementary figs) and discuss these as well.
-
Reviewer #3 (Public Review):
The present study presents a comprehensive exploration of the distinct impacts of Isoflurane and Ketamine on c-Fos expression throughout the brain. To understand the varying responses across individual brain regions to each anesthetic, the researchers employ principal component analysis (PCA) and c-Fos-based functional network analysis. The methodology employed in this research is both methodical and expansive. Notably, the utilization of a custom software package to align and analyze brain images for c-Fos positive cells stands out as an impressive addition to their approach. This innovative technique enables effective quantification of neural activity and enhances our understanding of how anesthetic drugs influence brain networks as a whole.
The primary novelty of this paper lies in the comparative …
Reviewer #3 (Public Review):
The present study presents a comprehensive exploration of the distinct impacts of Isoflurane and Ketamine on c-Fos expression throughout the brain. To understand the varying responses across individual brain regions to each anesthetic, the researchers employ principal component analysis (PCA) and c-Fos-based functional network analysis. The methodology employed in this research is both methodical and expansive. Notably, the utilization of a custom software package to align and analyze brain images for c-Fos positive cells stands out as an impressive addition to their approach. This innovative technique enables effective quantification of neural activity and enhances our understanding of how anesthetic drugs influence brain networks as a whole.
The primary novelty of this paper lies in the comparative analysis of two anesthetics, Ketamine and Isoflurane, and their respective impacts on brain-wide c-Fos expression. The study reveals the distinct pathways through which these anesthetics induce loss of consciousness. Ketamine primarily influences the cerebral cortex, while Isoflurane targets subcortical brain regions. This finding highlights the differing mechanisms of action employed by these two anesthetics-a top-down approach for Ketamine and a bottom-up mechanism for Isoflurane. Furthermore, this study uncovers commonly activated brain regions under both anesthetics, advancing our knowledge about the mechanisms underlying general anesthesia.
-
-
eLife assessment
This potentially important study used single-cell whole-brain imaging of the immediate early gene Fos to identify the brain areas recruited by two anesthetics, ketamine and isoflurane. The results suggest these anesthetics might induce anesthesia via different brain regions and pathways. However, the support for the primary conclusions is incomplete owing to differences in route of administration between the drugs, lack of a dose response curve and behavioral/physiological measures of the depth of anesthesia, and statistical analysis that does not correct for multiple comparisons. With these issues addressed, this paper would be of interest to preclinical and clinical scientists working with anesthetic and dissociative drugs.
-
Reviewer #1 (Public Review):
The authors performed a comparative study of the effect of the anesthetics isoflurane and ketamine on whole-brain network activation by mapping whole-brain c-fos expression in mice. Principle component analysis on the normalized Fos density showed opposite effects of the 2 anesthetics, consistent with top-down functioning for ketamine and bottom-up functioning for isoflurane. Based on the network analysis the authors suggest that isoflurane mediates anesthesia through a bottom-up mechanism activating subcortical regions and inactivating cortical regions with the locus coeruleus being the most important region while ketamine produced anesthesia through a top-down mechanism activating the cortex and subcortical nuclei with the somatosensory cortex as the most important region. Overall they show that these two …
Reviewer #1 (Public Review):
The authors performed a comparative study of the effect of the anesthetics isoflurane and ketamine on whole-brain network activation by mapping whole-brain c-fos expression in mice. Principle component analysis on the normalized Fos density showed opposite effects of the 2 anesthetics, consistent with top-down functioning for ketamine and bottom-up functioning for isoflurane. Based on the network analysis the authors suggest that isoflurane mediates anesthesia through a bottom-up mechanism activating subcortical regions and inactivating cortical regions with the locus coeruleus being the most important region while ketamine produced anesthesia through a top-down mechanism activating the cortex and subcortical nuclei with the somatosensory cortex as the most important region. Overall they show that these two anesthetics have two opposite mechanisms to induce unconsciousness, although they also have overlapping coactivation of central sleep-wake, pain, and neuroendocrine regulating areas. This manuscript highlights some interesting findings through interesting analysis. The results are likely to have a significant impact on the field of anesthesia but also on the much larger field of neuropsychopharmacology as the tools and analyses used in this report will be useful for researchers investigating the effects of any psychoactive drugs on the brain. However, there are several issues that should be addressed to support their conclusions. The two main issues of this report are the lack of behavioral/physiological measures of the depth of anesthesia produced by ketamine/isoflurane and inadequate data analysis/interpretations for some of the results.
Strengths
Comparison of two different anesthetics
Use of single-cell whole-brain imaging
Advanced network analysisWeaknesses
Lack of behavioral/physiological measures
Interpretation of the data is sometimes confusing/unclear
Some statistical tests are missing and others are not controlled for multiple comparisonsMajor concerns
1. The lack of behavioral/physiological measures of the depth of anesthesia (ventilation, heart rate, blood pressure, temperature, O2, pain reflexes, etc...) combined with the lack of dose-response and the use of different routes of administration makes the data difficult to interpret. Sure, there is a clear difference in network activation between KET and ISO, but are those effects due to the depth of the anesthesia, the route of administration, and the dose used? The lack of behavioral/physiological measures prevents the identification of brain regions responsible for some of the physiological effects and different effects of anesthetics.
2. Under anesthesia there should be an overall reduction of activity, is that the case? There is no mention of significantly downregulated regions. The authors use multiple transformations of the data to interpret the results (%, PC1 values, logarithm) without much explanation or showing the full raw data in Fig 1. It would be helpful to interpret the data to compare the average fos+ neurons in each region between treatment and control for each drug.
3. I do not understand their interpretation of the PCA analyses. For instance, in Fig 2 they claim that KET is associated with PC1 while ISO is associated with PC2. Looking at the distribution of points it's clear that the KET animals are all grouped at around +2.5 on PC1 and -2.0 on PC2, this means that KET is associated with both PC1 and PC2 to a similar degree (2 to 2.5). Moreover, I'm confused about why they use PCA to represent the animals/group. PCA is a powerful technique to reduce dimensionality and identify groups of variables that may represent the same underlying construct; however, it is not the best way to identify clusters of individuals or groups.
4. The actual metric used for the first PCA is unclear, is it the FOS density in each of the regions (some of those regions are large and consist of many subregions, how does that affect the analysis) is it the %-fos, or normalized cells? The wording describing this is variable causing some confusion. How would looking at these different metrics influence the analysis?
5. Based on Fig 3 the authors concludes that ISO activates the hypothalamic regions and inhibits the cortex, however, Fig 1 shows neither an activation of the hypothalamus in the ISO nor an inhibition of the cortex when compared to home cage control. If anything it suggests the opposite.
6. Control for isoflurane should be air in the induction chamber rather than home cage. It is possible that Fos activation reflects handling/stress pre-anesthesia in the animals, which would increase Fos expression in the stress-related regions such as the BST, striatum (CeA), hypothalamus (PVH) and potentially the LC.
7. In the Ket network there are a few anticorrelated regions, most of which are amongst the list of the most activated regions, does this mean that the strong correlation results from an overall decreased activation? And if so, is it possible that the ketamine anesthesia was stronger than the isoflurane, causing a more general reduction in activity?
8. Since they have established networks it would be easy and useful to look at how the different regions identified (sleep, pain, neuroendocrine, motor-related, ...) work together to maintain analgesia, are they within the same module? Do they become functionally connected and is this core network of functional connections similar for KET and ISO?
9. The naming of the function of some of the regions is very much debatable. For instance, PL/ILA are named "sleep-wakefulness regulation" regions in the paper. I can think of many more important functions of the PL/IL including executive functions, behavioral flexibility, and emotional control. It is unclear how the functions of all the regions were attributed. I am not sure that this biased labeling of structure-function is useful to the reports, it may instead suggest wrong conclusions.
10. A point of concern and confusion is the number of brain regions analyzed. In the introduction, it is mentioned that 987 brain regions are considered, but this is reduced to 53 selected brain regions in Figure 2, then 201 brain regions in Figure 3, and reduced again to 63 for the network analysis. The rationale for selecting different brain regions is not clear.
11. The statistical analysis does not seem appropriate considering the high number of comparisons. They use simple t-tests without correction for multiple comparisons.
12. There is no statistical analysis in Fig 2C, -
Reviewer #2 (Public Review):
In this paper the authors aim to investigate brain-wide activation patterns following administration of the anesthetics ketamine and isoflurane, and conduct comparative analysis of these patterns to understand shared and distinct mechanisms of these two anesthetics.
To this end, they perform Fos immunohistochemistry in perfused brain section to label active nuclei, use a custom pipeline to register images to the ABA framework and quantify Fos+ nuclei, and perform multiple complementary analyses to compare activation patterns across groups.
This is an interesting line of research and a tour de force in brain-wide Fos quantification. However, there are several issues with the analysis, and overall integration that dampen my enthusiasm for the article in its current form.
Major comments:
1- The authors report …
Reviewer #2 (Public Review):
In this paper the authors aim to investigate brain-wide activation patterns following administration of the anesthetics ketamine and isoflurane, and conduct comparative analysis of these patterns to understand shared and distinct mechanisms of these two anesthetics.
To this end, they perform Fos immunohistochemistry in perfused brain section to label active nuclei, use a custom pipeline to register images to the ABA framework and quantify Fos+ nuclei, and perform multiple complementary analyses to compare activation patterns across groups.
This is an interesting line of research and a tour de force in brain-wide Fos quantification. However, there are several issues with the analysis, and overall integration that dampen my enthusiasm for the article in its current form.
Major comments:
1- The authors report 987 brain regions in the introduction, but I cannot find any analysis that incorporates these or even which regions they are. Very little rationale is provided for the regions included in any of the analyses and numbers range from 53 in Figure 1, to 201 in Figure 3, to 63 in Figure 6. It would help if the authors could first survey Fos+ counts across all regions to identify a subset that is of interest (significantly changed by either condition compared to control) for follow up analysis.
2- Different data transformations are used for each analysis. One that is especially confusing is the 'normalization' of brain regions by % of total brain activation for each animal prior to PCA analysis in Figures 2 and 3. This would obscure any global differences in activation and make it unlikely to observe decreases in activation (which I think is likely here) that could be identified using the Fos+ counts after normalizing for region size (ie. Fos+ count / mm3) which is standard practice in such Fos-based activity mapping studies. While PCA can be powerful approach to identify global patterns, the purpose of the analysis in its current form is unclear. It would be more meaningful to show that regional activation patterns (measured as counts/mm3) are on separate PCs by group.
3- Critical problem: The authors include a control group for each anesthetic (ketamine vs. saline, isofluorane vs. homecage) but most analyses do not make use of the control groups or directly compare Fos+ counts across the groups. Strictly speaking, they should have compared relative levels of induction by ketamine versus induction by isoflurane using ANOVAs. Instead, each type of induction was separate from the other. This does not account for increased variability in the ketamine versus isoflurane groups. There is no mention in the Statistics section or in Results section that any multiple comparison corrections were used. It appears that the authors only used Students t-test for each region and did not perform any corrections.
4- Figures 4 and 5 show brain regions 'significantly activated' following KET or ISO respectively, but again a subset of regions are shown and the stats seem to be t-tests with no multiple comparisons correction. It would help to show these two figures side by side, include the same regions, and keep the y axis ranges similar so the reader can easily compare the 'activation patterns' across the two treatments. Indeed, it looks like KET/Saline induced activation is an order or magnitude or two higher than ISO/Homecage. I would also recommend that this be the first data figure before any other analyses and maybe further analysis could be restricted to regions that are significantly changed in following KET or ISO here.
5- Analyses in Figure 6 and 7 are interesting but again the choice of regions to include is unclear and makes interpreting the results impossible. For example, in Figure 7 it is unclear why the list of regions in bar graphs showing Degree and Betweenness Centrality are not the same even within a single row?
-
Reviewer #3 (Public Review):
The present study presents a comprehensive exploration of the distinct impacts of Isoflurane and Ketamine on c-Fos expression throughout the brain. To understand the varying responses across individual brain regions to each anesthetic, the researchers employ principal component analysis (PCA) and c-Fos-based functional network analysis. The methodology employed in this research is both methodical and expansive. Notably, the utilization of a custom software package to align and analyze brain images for c-Fos positive cells stands out as an impressive addition to their approach. This innovative technique enables effective quantification of neural activity and enhances our understanding of how anesthetic drugs influence brain networks as a whole.
The primary novelty of this paper lies in the comparative …
Reviewer #3 (Public Review):
The present study presents a comprehensive exploration of the distinct impacts of Isoflurane and Ketamine on c-Fos expression throughout the brain. To understand the varying responses across individual brain regions to each anesthetic, the researchers employ principal component analysis (PCA) and c-Fos-based functional network analysis. The methodology employed in this research is both methodical and expansive. Notably, the utilization of a custom software package to align and analyze brain images for c-Fos positive cells stands out as an impressive addition to their approach. This innovative technique enables effective quantification of neural activity and enhances our understanding of how anesthetic drugs influence brain networks as a whole.
The primary novelty of this paper lies in the comparative analysis of two anesthetics, Ketamine and Isoflurane, and their respective impacts on brain-wide c-Fos expression. The study reveals the distinct pathways through which these anesthetics induce loss of consciousness. Ketamine primarily influences the cerebral cortex, while Isoflurane targets subcortical brain regions. This finding highlights the differing mechanisms of action employed by these two anesthetics-a top-down approach for Ketamine and a bottom-up mechanism for Isoflurane. Furthermore, this study uncovers commonly activated brain regions under both anesthetics, advancing our knowledge about the mechanisms underlying general anesthesia.
-
