Exploratory mass cytometry analysis reveals immunophenotypes of cancer treatment-related pneumonitis
Curation statements for this article:-
Curated by eLife

eLife assessment
This study presents a valuable inventory of immune signatures that are correlated with cancer treatment-related pneumonitis. The data were collected and analysed using validated methodology and can be used as a starting point for further prospective studies. The authors have provided a scRNA-Seq analysis with an HD baseline using publicly available dataset and the evidence for their claims is convincing.
This article has been Reviewed by the following groups
Discuss this preprint
Start a discussion What are Sciety discussions?Listed in
- Evaluated articles (eLife)
Abstract
Anticancer treatments can result in various adverse effects, including infections due to immune suppression/dysregulation and drug-induced toxicity in the lung. One of the major opportunistic infections is Pneumocystis jirovecii pneumonia (PCP), which can cause severe respiratory complications and high mortality rates. Cytotoxic drugs and immune-checkpoint inhibitors (ICIs) can induce interstitial lung diseases (ILDs). Nonetheless, the differentiation of these diseases can be difficult, and the pathogenic mechanisms of such diseases are not yet fully understood. To better comprehend the immunophenotypes, we conducted an exploratory mass cytometry analysis of immune cell subsets in bronchoalveolar lavage fluid from patients with PCP, cytotoxic drug-induced ILD (DI-ILD), and ICI-associated ILD (ICI-ILD) using two panels containing 64 markers. In PCP, we observed an expansion of the CD16 + T cell population, with the highest CD16 + T proportion in a fatal case. In ICI-ILD, we found an increase in CD57 + CD8 + T cells expressing immune checkpoints (TIGIT + LAG3 + TIM-3 + PD-1 + ), FCRL5 + B cells, and CCR2 + CCR5 + CD14 + monocytes. These findings uncover the diverse immunophenotypes and possible pathomechanisms of cancer treatment-related pneumonitis.
Article activity feed
-

-
-
-

Author Response
The following is the authors’ response to the previous reviews.
eLife assessment
This study presents a useful inventory of immune signatures that are correlated with cancer treatment-related pneumonitis. The data were collected and analysed using solid and validated methodology and can be used as a starting point for further functional studies.
We sincerely thank the editor for their encouraging comments regarding our study. As rightly pointed out, this study indeed serves as a pivotal starting point for subsequent functional studies.
Reviewer #2 (Recommendations For The Authors):
I greatly appreciate the authors diligence in addressing all the suggested points. The paper now presents significantly stronger evidence to support the findings.
I do have one final question: Could you clarify how the correlation …
Author Response
The following is the authors’ response to the previous reviews.
eLife assessment
This study presents a useful inventory of immune signatures that are correlated with cancer treatment-related pneumonitis. The data were collected and analysed using solid and validated methodology and can be used as a starting point for further functional studies.
We sincerely thank the editor for their encouraging comments regarding our study. As rightly pointed out, this study indeed serves as a pivotal starting point for subsequent functional studies.
Reviewer #2 (Recommendations For The Authors):
I greatly appreciate the authors diligence in addressing all the suggested points. The paper now presents significantly stronger evidence to support the findings.
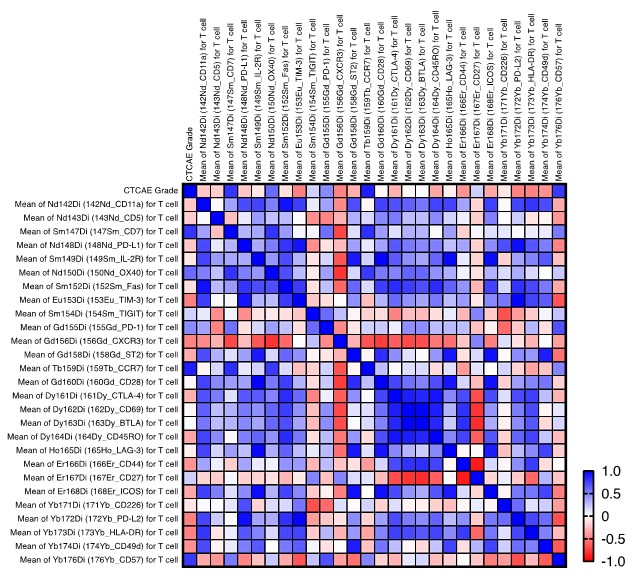
I do have one final question: Could you clarify how the correlation presented in Supplementary Figure 3 was calculated? Is it a Pearson correlation of CTCAE grade directly to marker expression? Additionally, could you explain how the significance was determined? The authors mention a significant correlation for CCR7, but the heatmap displays similarly high values for CD7 and CD57. Finally, I'm curious about the absence of CD16 in the heatmap.
Thank you for your insightful query. To clarify, the correlation shown in Supplementary Figure 3 was indeed calculated using the Pearson correlation coefficient. This involved correlating the CTCAE grade directly with the mean expression levels of each marker. The computations were conducted using GraphPad Prism version 9. Regarding the statistical significance, we defined a threshold of P < 0.05 as significant. Specifically, the P-values for CCR7, CD7, and CD57 were found to be 0.009, 0.035, and 0.039, respectively. Hence, while CCR7 showed a significant correlation, CD7 and CD57 also exhibited relatively high values, as correctly observed. We have added CD7 and CD57 along with CCR7 in the discussion section, though not to mention much for better focusing on CD16.
CD16 was initially omitted from Supplementary Figure 3 to prevent redundancy and preserve data clarity. Nonetheless, in light of your query, we have included CD16 in the correlation matrix to provide a comprehensive view of its association with other markers.
We hope this adequately addresses your question and further clarifies our findings.
Reviewer #3 (Recommendations For The Authors):
General suggestions for presentation in the future:
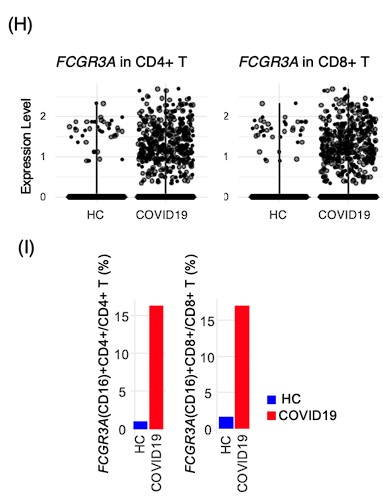
It is essential to concretely define the numbers presented in all figures and plots. For example, in Figure 6 (I), what does it mean by "percentage representation of FCGR3A (CD16)"? Percentage of what? How did you calculate that? It is also important to show more statistics in general, for example, in dot plots like Figure 6 (H), where are the means and p-values? Little things like that completely change the impact of the figures. For the narrative of this paper, it is OK, but in the future, fine-tuning the presentation would massively improve the impact of the work which the contents deserve.
Thank you for your insightful feedback. Addressing your concerns, I have revised Figure 6H and Figure 6I to provide a more precise and informative presentation of our data. In Figure 6H, the violin plots illustrate the expression intensity of FCGR3A (CD16) on CD4+ and CD8+ T cells. Each dot represents an individual cell within the BALF from both healthy controls (HC) and COVID-19 patients. This data was derived from the single-cell RNA-seq dataset GSE145926. To enhance clarity and statistical robustness, I have now included p-values directly in Figure 6H. Additionally, for a more comprehensive understanding, the means ± standard deviation (SD) have been incorporated into the main text of the manuscript.
Regarding Figure 6I, it depicts the proportion of FCGR3A (CD16)-positive cells within the CD4+ and CD8+ T cell populations in BALF from HC and COVID-19 patients. The threshold for FCGR3A expression was set at 0.5. Upon further review and in response to your feedback, I realized an error in the calculation of the proportion of FCGR3A-positive cells among CD4+ and CD8+ T cells. Initially, the proportion of FCGR3A-positive CD4+ T cells was calculated in relation to the entire CD4+ T cell population, without differentiation between the groups. This has now been corrected, and the adjusted figures are presented in Figure 6I.
I am grateful for the opportunity to refine these figures, as your suggestions have not only helped to correct the error but have also significantly enhanced the impact and clarity of our work. Your guidance has been instrumental in improving the overall quality and presentation of our research, ensuring that the findings are communicated effectively and accurately.
-
eLife assessment
This study presents a valuable inventory of immune signatures that are correlated with cancer treatment-related pneumonitis. The data were collected and analysed using validated methodology and can be used as a starting point for further prospective studies. The authors have provided a scRNA-Seq analysis with an HD baseline using publicly available dataset and the evidence for their claims is convincing.
-
Reviewer #2 (Public Review):
Yanagihara and colleagues investigated the immune cell composition of bronchoalveolar lavage fluid (BALF) samples in a cohort of patients with malignancy undergoing chemotherapy and with lung adverse reactions including Pneumocystis jirovecii pneumonia (PCP) and immune-checkpoint inhibitors (ICIs) or cytotoxic drug induced interstitial lung diseases (ILDs). Using mass cytometry, their aim was to characterize the cellular and molecular changes in BAL to improve our understanding of their pathogenesis and identify potential biomarkers and therapeutic targets. In this regard, the authors identify a correlation between CD16 expression in T cells and the severity of PCP and an increased infiltration of CD57+ CD8+ T cells expressing immune checkpoints and FCLR5+ B cells in ICI-ILD patients.
The conclusions of this …
Reviewer #2 (Public Review):
Yanagihara and colleagues investigated the immune cell composition of bronchoalveolar lavage fluid (BALF) samples in a cohort of patients with malignancy undergoing chemotherapy and with lung adverse reactions including Pneumocystis jirovecii pneumonia (PCP) and immune-checkpoint inhibitors (ICIs) or cytotoxic drug induced interstitial lung diseases (ILDs). Using mass cytometry, their aim was to characterize the cellular and molecular changes in BAL to improve our understanding of their pathogenesis and identify potential biomarkers and therapeutic targets. In this regard, the authors identify a correlation between CD16 expression in T cells and the severity of PCP and an increased infiltration of CD57+ CD8+ T cells expressing immune checkpoints and FCLR5+ B cells in ICI-ILD patients.
The conclusions of this paper are mostly well supported by data, but some aspects of the data analysis need to be clarified and extended.
The authors should elaborate on why different sets of markers were selected for each analysis step. E.g., Different sets of markers were used for UMAP, CITRUS and viSNE in the T cell and myeloid analysis.
-
Reviewer #3 (Public Review):
The authors collected BALF samples from lung cancer patients newly diagnosed with PCP, DI-ILD or ICI-ILD. CyTOF was performed on these samples, using two different panels (T-cell and B-cell/myeloid cell panels). Results were collected, cleaned-up, manually gated and pre-processed prior to visualisation with manifold learning approaches t-SNE (in the form of viSNE) or UMAP, and analysed by CITRUS (hierarchical clustering followed by feature selection and regression) for population identification - all using Cytobank implementation - in an attempt to identify possible biomarkers for these disease states. By comparing cell abundances from CITRUS results and qualitative inspection of a small number of marker expressions, the authors claimed to have identified an expansion of CD16+ T-cell population in PCP cases …
Reviewer #3 (Public Review):
The authors collected BALF samples from lung cancer patients newly diagnosed with PCP, DI-ILD or ICI-ILD. CyTOF was performed on these samples, using two different panels (T-cell and B-cell/myeloid cell panels). Results were collected, cleaned-up, manually gated and pre-processed prior to visualisation with manifold learning approaches t-SNE (in the form of viSNE) or UMAP, and analysed by CITRUS (hierarchical clustering followed by feature selection and regression) for population identification - all using Cytobank implementation - in an attempt to identify possible biomarkers for these disease states. By comparing cell abundances from CITRUS results and qualitative inspection of a small number of marker expressions, the authors claimed to have identified an expansion of CD16+ T-cell population in PCP cases and an increase in CD57+ CD8+ T-cells, FCRL5+ B-cells and CCR2+ CCR5+ CD14+ monocytes in ICI-ILD cases.
By the authors' own admission, there is an absence of healthy donor samples and, perhaps as a result of retrospective experimental design and practical clinical reasons, also an absence of pre-treatment samples. The entire analysis effectively compares three yet-established disease states with no common baseline - what really constitutes a "biomarker" in such cases? These are very limited comparisons among three, and only these three, states.
By including a new scRNA-Seq analysis using a publicly available dataset, the authors addressed this fundamental problem. Though a more thorough and numerical analysis would be appreciated for a deeper and more impactful analysis, this is adequate for the intended objectives of the study.
-
-
Author Response
The following is the authors’ response to the original reviews.
eLife assessment
This study presents a valuable finding on the immunophenotypes of cancer treatment-related pneumonitis. The evidence supporting the claims of the authors is solid, although the inclusion of controls, as suggested by one of the reviewers, strengthened the study. The work will be of interest to cancer immunologists.
Response: We are thankful for the editor's recognition of the contribution our study makes to understanding the immunophenotypes associated with cancer treatment-related pneumonitis. We agree that the inclusion of control data is pivotal for benchmarking biomarkers. While our initial study design was constrained by the availability of BALF from healthy individuals within clinical settings, we addressed this limitation by …
Author Response
The following is the authors’ response to the original reviews.
eLife assessment
This study presents a valuable finding on the immunophenotypes of cancer treatment-related pneumonitis. The evidence supporting the claims of the authors is solid, although the inclusion of controls, as suggested by one of the reviewers, strengthened the study. The work will be of interest to cancer immunologists.
Response: We are thankful for the editor's recognition of the contribution our study makes to understanding the immunophenotypes associated with cancer treatment-related pneumonitis. We agree that the inclusion of control data is pivotal for benchmarking biomarkers. While our initial study design was constrained by the availability of BALF from healthy individuals within clinical settings, we addressed this limitation by incorporating scRNA-seq data from healthy control and COVID-19 BALF cells sourced from the GSE145926 dataset. This additional analysis has provided a baseline for comparison, revealing that CD16 is expressed in a minority of T cells in healthy BALF, specifically 1.0% of CD4+ T cells and 1.6% of CD8+ T cells. The inclusion of this data as Figures 6H and 6I in our manuscript offers a robust context for the significant increase in CD16-expressing T cells observed in patients with PCP, thus enhancing the robustness of our study's conclusions.
Author response image 1.
Reviewer #1 (Recommendations For The Authors):
Many thanks for giving me the opportunity to review your paper. I really enjoyed the way you carried out this work - for example, your use of a wide panel of markers and the use of two analytical methods - you have clearly given great thought to bias avoidance. I also greatly appreciated your paragraph on the limitations, as there are several, but you do not 'over-sell' your conclusions so there is no issue here for me.
To improve the piece, there are a few typos (eg 318 - specific to alpha-myosin) and I was briefly confused about the highlighted clusters in Figure 4. Perhaps mention why they are highlighted when they first appear in 4D instead of E?
Response: We have corrected the typos, and we have rearranged the sequence of Figures 3E and 3F, as well as 4D and 4E, to ensure a logical flow. Citrus-generated violin plots are now presented prior to the heatmap of the clusters, which better illustrates the progression of our analysis and the derivation of the clusters.
In terms of improvements to the data, obviously it would have been ideal if you had had some sort of healthy control as a point of reference for all cohorts, but working in the field I understand the difficulties in getting healthy BAL. It would be worth your while however trying to find more supportive data in the literature in general. There are studies which assess various immune markers in healthy BAL eg https://journal-inflammation.biomedcentral.com/articles/10.1186/1476-9255-11-9. and so I think it is worth looking wrt the main findings. For example, are CD16+ T cells seen in healthy BAL or any other conditions (at present the COVID study is being over-relied on)? Could these cells be gamma deltas? (gamma deltas frequently express CD8 and CD16, and can switch to APC like phenotypes).
Response: We are grateful for the reviewer's consideration of the practical challenges associated with collecting BALF from healthy individuals. Alternatively, we have supplemented our analysis with single-cell RNA sequencing data from BALF cells of healthy controls, as found in existing literature (Nature Medicine 2020; 26: 842-844). We have accessed to GSE145926 and downloaded data of BALF cells from healthy control (n=3) and severe COVID19 (n=6). The filtered gene-barcode matrix was first normalized using ‘NormalizeData’ methods in Seurat v.4 with default parameters. The top 2,000 variable genes were then identified using the ‘vst’ method in Seurat FindVariableFeatures function. Then PCA and UMAP was performed. T cells were identified as CD2 >1 and CD3E >1, and FCGR3A expression was explored using an expression threshold of 0.5. Violin plots and bar plots were generated by ggplot function.
Regarding the pivotal finding of increased CD16-expressing T cells in patients with PCP, the scRNA-seq data mining indicates that CD16 is expressed by a minority of T cells in healthy BALF—1.0% of CD4+ T cells and 1.6% of CD8+ T cells. These figures, now incorporated into our revised manuscript as Figures 6H and 6I, substantiate our findings. These cells could be gamma delta T cells, but we could not confirm it with the limited data. We will investigate in the future study. The main text has been updated to reflect these findings.
Author response image 2.
I would agree with your approach of not going down the transcript route, so just focus on protein expression.
I think you need to mention more about the impact of ICI on PD1 expression - in the methods you lose one approach owing to low T cell expression (132) but in the discussion you mention ICI induced high expression (311) as previously reported. This apparent contradiction needs an explanation.
Response: We acknowledge the need for clarification regarding the impact of ICIs on PD-1 expression. In the methods section, the low detection of PD-1 expression on T cells in patients treated with nivolumab was indeed noted; this was due to the competitive nature of the PD-1 detection antibody EH12.2 with nivolumab. As reported by Suzuki et al. (International Immunology 2020; 32: 547-557), T cells from patients with ICI-induced ILD, including those treated with nivolumab, exhibit upregulated PD-1 expression, where the PD-1 detection antibody (clone: MIH4). Conversely, as outlined by Yanagihara et al. (BBRC 2020; 527: 213-217), the PD-1 detection antibody clone EH12.2 conjugated with 155Gd (#3155009B) used in our study is unable to detect PD-1 when patients are under nivolumab treatment due to competitive inhibition. The absence of a metal-conjugated PD-1 antibody with the MIH4 clone presented a limitation in our study. Ideally, we would have conjugated the MIH4 antibody with 155Gd for our analysis, which is a refinement we aim to incorporate in future research. We have now included this discussion in our manuscript to clarify the contradiction between the methodological limitations and the high PD-1 expression induced by ICIs, as reported in the literature. This addition will guide readers through the nuances of antibody selection and its implications for detecting PD-1 expression in the context of ICI treatment.
Finally, since you have the severity data, it would be good to assess all the significantly different clusters against this metric, as you have done for CD16+ T cells. Not only may this reveal more wrt the impact of other immune populations, but it'll also give a point of reference for the CD16+ T cell data.
Response: Thank you for the suggestion to assess all significantly different clusters against the disease severity metric. We have expanded our analysis to include a thorough correlation study between the disease severity and intensity of various T-cell markers. Notably, we observed that intensity of CCR7 expression correlates with the disease severity. Although the precise biological significance of this correlation remains to be elucidated, it may suggest a role for CCR7+ T cells in the pathogenesis or progression of the disease. We have considered the potential implications of this finding and included it as Supplementary Figure 5. We have also discussed this observation in the discussion section.
Author response image 3.
Overall though I think this is a really nice study, with a potentially very significant finding in linking CD16+ T cells with severity. Congratulations.
Response: We would like to thank the reviewer’s heartful comments on our manuscript.
Reviewer #2 (Recommendations For The Authors):
General:
- The fact that this is a retrospective study should be indicated earlier in the paper.
Response: Now we have mentioned the retrospective nature of the study in the method section as follows: In this retrospective study, patients who were newly diagnosed with PCP, DI-ILD, and ICI-ILD and had undergone BALF collection at Kyushu University Hospital from January 2017 to April 2022 were included. The retrospective study was approved by the Ethics Committee of Kyushu University Hospital (reference number 22117-00).
- tSNE and UMAP are dimensionality reduction techniques that don't cluster the cells, the authors should specify what clustering algorithm was used subsequently (e.g FlowSOM)
Response: The cluster was determined manually by their expression pattern.
- With regards to the role of CD16 in a potential exacerbated cytotoxicity in the fatal PCP case, the authors could measure the levels of C3a related proteins in patient serum to link to a common immunopathogenic pathway with COVID.
Response: We did not collect serum from the patients in this study as our research protocol was approved by the Ethics committee for the use of BALF only. However, we agree with your assessment that the measurement of serum C3a levels would be informative. In future studies, we will incorporate the measurement of serum C3a levels to provide more comprehensive insights into the impact of C3a on immune function. Thank you for your valuable feedback and for helping us to improve the quality of our research.
Line-specific:
101 The authors should provide some information on how the cryopreservation of the BALF was carried out.
Response: Upon collection, BALF samples were immediately centrifuged at 300 g for 5 minutes to pellet the cells. The resultant cell pellets were then resuspended in Cellbanker 1 cryopreservation solution (Takara, catalog #210409). This suspension was aliquoted into cryovials and gradually frozen to –80ºC using a controlled rate freezing method to ensure cell viability. The samples were stored at –80ºC until required for experimental analysis. We have added the information in the method section.
Fig 3B: It would be very helpful if the authors could add a supplementary figure with marker expression on the UMAP projection.
Response: We have added Supplementary Figure 4 with marker expression on the UMAP projection in Figure 3B.
Fig 4A: Same as Fig 3B
Response: We have added Supplementary Figure 5 with marker expression on the UMAP projection in Figure 4A.
Fig 5B: Same as Fig 3B
Response: We have added Supplementary Figure 6 with marker expression on the tSNE projection in Figure 5B.
266 Authors should state if the data is not shown with regards to differences in myeloid cell fractions
430 Marker intensity is not shown in panel D
Re: Corrected as follows: “Citrus network tree visualizing the hierarchical relationship of each marker between identified T cell ~”
446 The legend says patients have IPF, CTD-ILD, sarcoidosis but the figure shows PCP, DI-ILD, ICI-ILD.
Re: Corrected.
451 What do the authors mean in "Graphical plots represent individual samples"? Panel B is a dot plot of all samples.
Response: Corrected as “Dot plots represent ~”.
472 What do the authors mean in "Graphical plots represent individual samples"? Panel C is a dot plot of all samples.
Response: Corrected as “Dot plots represent ~”.
Reviewer #3 (Recommendations For The Authors):
An important thing is to add comparisons against healthy donors, at least. A common baseline is needed to firmly establish any biomarkers.
Response: We acknowledge the reviewer's concern regarding the comparison with healthy donors. Although our study did not initially include BALF collection from healthy controls due to the constraints of clinical practice, we recognize the importance of a control baseline to validate biomarkers. To address this, we have integrated scRNA-seq data from healthy control BALF cells available in public datasets (Nature Medicine 2020; 26: 842-844), accessed from GSE145926. This dataset includes BALF cells from healthy controls (n=3) alongside severe COVID-19 patients (n=6). Data mining confirmed that CD16 expression is in a minority of T cells in healthy BALF—1.0% of CD4+ T cells and 1.6% of CD8+ T cells. We have included this comparative data in our manuscript as Figures 6H and 6I to provide context for the observed increase in CD16-expressing T cells in PCP patients, which substantiates our findings.
Author response image 4.
Data analysis needs to go deeper. There are several other tools on Cytobank alone that would allow a more quantitative analysis of the data. Fold changes in marker expressions would be very important as measurements of phenotypic changes.
Response: We thank the reviewer for their constructive feedback on the depth of our data analysis. We acknowledge the value of a more quantitative approach, including the use of fold change measurements to assess phenotypic alterations, and recognize the potential insights such tools on Cytobank could provide. Due to the scope and limited space of the current study, we have focused our analysis on the most pertinent findings relevant to our research questions. We believe the present analysis serves the immediate objectives of this study. However, we agree that further quantitative analysis would enhance the understanding of the data. We have expanded our analysis to include a thorough correlation study between the disease severity of PCP and intensity of various T-cell markers. Notably, we observed that intensity of CCR7 expression correlates with the disease severity of PCP. Although the precise biological significance of this correlation remains to be elucidated, it may suggest a role for CCR7+ T cells in the pathogenesis or progression of the disease. We have considered the potential implications of this finding and included it as Supplementary Figure 5. We have also discussed this observation in the discussion section. We aim to consider these approaches in future work to build upon the foundation laid by this study. Your suggestions are invaluable and will be kept at the forefront as we plan subsequent research phases.
Author response image 5.
Reviewer #1 (Public Review):
Cytotoxic agents and immune checkpoint inhibitors are the most commonly used and efficacious treatments for lung cancers. However their use brings two significant pulmonary side-effects; namely Pneumocystis jirovecii infection and resultant pneumonia (PCP), and interstitial lung disease (ILD). To observe the potential immunological drivers of these adverse events, Yanagihara et al. analysed and compared cells present in the bronchoalveolar lavage of three patient groups (PCP, cytotoxic drug-induced ILD [DI-ILD], and ICI-associated ILD [ICI-ILD]) using mass cytometry (64 markers). In PCP, they observed an expansion of the CD16+ T cell population, with the highest CD16+ T proportion (97.5%) in a fatal case, whilst in ICI-ILD, they found an increase in CD57+ CD8+ T cells expressing immune checkpoints (TIGIT+ LAG3+ TIM-3+ PD-1+), FCRL5+ B cells, and CCR2+ CCR5+ CD14+ monocytes. Given the fatal case, the authors also assessed for, and found, a correlation between CD16+ T cells and disease severity in PCP, postulating that this may be owing to endothelial destruction. Although n numbers are relatively small (n=7-9 in each cohort; common numbers for CyTOF papers), the authors use a wide panel (n=65) and two clustering methodologies giving greater strength to the conclusions. The differential populations discovered using one or two of the analytical methods are robust: whole population shifts with clear and significant clustering. These data are an excellent resource for clinical disease specialists and pan-disease immunologists, with a broad and engaging contextual discussion about what they could mean.
Strengths:
• The differences in immune cells in BAL in these specific patient subgroups is relatively unexplored.
• This is an observational study, with no starting hypothesis being tested.
• Two analytical methods are used to cluster the data.
• A relatively wide panel was used (64 markers), with particular strength in the alpha beta T cells and B cells.
• Relevant biomarkers, beta-D-glucan and KL-6 were also analysed
• Appropriate statistics were used throughout.
• Numbers are low (7 cases of PCP, 9 of DI-ILD, and 9 of ICI-ILD) but these are difficult samples to collect and so in relative terms, and considering the use of CyTOF, these are good numbers.
• Beta-D-glucan shows potential as a biomarker for PCP (as previously reported) whilst KL-6 shows potential as a biomarker for ICI-ILD (not reported before). Interestingly, KL-6 was not seen to be increased in DI-ILD patients.
• Despite the relatively low n numbers and lack of matching there are some clear differentials. The CD4/CD8+CD16+HLA-DR+CXCR3+CD14- T cell result is striking - up in PCP (with EM CD4s significantly down) - whilst the CD8 EMRA population is clear in ICI-ILD and 'non-exhausted' CD4s, with lower numbers of EMRA CD8s in DI-ILD.
• The authors identify 17/31 significantly differentiated clusters of myeloid cells, eg CD11bhi CD11chi CD64+ CD206+ alveolar macrophages with HLA-DRhi in PCP.
• With respect to B cells, the authors found that FCRL5+ B cells were more abundant in patients with ICI-ILD compared to those with PCP and DI-ILD, suggesting these FCRL5+ B cells may have a role in irAE.
• One patient's extreme CD16+ T cell (97.5% positive) and death, led the authors to consider CD16+ T cells as an indicator of disease severity in PCP. This was then tested and found to be correct.
• Authors discuss results in context of literature leading them to suggest that CD16+ T cells may target endothelial cells and wonder if anti-complement therapy may be efficacious in PCP.
• Great discussion on auto-reactive T cell clones where the authors suggest that in ICI-ILD CD8s may react against healthy lung, driving ILD.
• An observation of CXCR3 in different CD8 populations in ICI-ILD and PCP lead the authors to hypothesise on the chemoattractants in the microenvironment.
• Excellent point suggesting CD57 may not always be a marker of senescence on T cells - reflective of growing change within the community.
• Well considered suggestion that FCRL5+ B cells may be involved in ICI-ILD driven autoimmunity.
• The authors discuss the main weaknesses in the discussion and stress that the findings detailed in the paper "demonstrate a correlation rather than proof of causation".
• Figures and legends are clear and pleasing to the eye.
Weaknesses:
• This is an observational study, with no starting hypothesis being tested.
• Only patients who were able to have a lavage taken have been recruited.
• One set of analysis wasn't carried out for one subgroup (ICI-ILD) as PD1 expression was negative owing to the use of nivolumab.
• Some immune cell subsets wouldn't be picked up with the markers and gating strategies used; e.g. NK cells.
• Some immune cells would be disproportionately damaged by the storage, thawing and preparation of the samples; e.g. granulocytes.
• Numbers are low (7 cases of PCP, 9 of DI-ILD, and 9 of ICI-ILD), sex, age and adverse event matching wasn't performed, and treatment regimen are varied and 'suspected' (suggesting incomplete clinical data) - but these are difficult samples to collect. These numbers drop further for some analyses e.g. T cell clustering owing to factors such as low cell number.
• The disease comparisons are with each other, there is no healthy control.
• Samples are taken at one time point.
• The discussion on probably the stand out result - the CD16+ T cells in PCP - relies on two papers - leading to a slightly skewed emphasis on one paper on CD16+ cells in COVID. There are other papers out there that have observed CD16+ T cells in other conditions. It is also worth being in mind that given the markers used, these CD16+ T cell may be gamma deltas.
• The discussion on ICI patient consistently showing increased PD1, could have been greater, as given the ICI is targeting PD1, one would expect the opposite as commented on, and observed, in the methods section.
Reviewer #2 (Public Review):
Yanagihara and colleagues investigated the immune cell composition of bronchoalveolar lavage fluid (BALF) samples in a cohort of patients with malignancy undergoing chemotherapy and with with lung adverse reactions including Pneumocystis jirovecii pneumonia (PCP) and immune-checkpoint inhibitors (ICIs) or cytotoxic drug induced interstitial lung diseases (ILDs). Using mass cytometry, their aim was to characterize the cellular and molecular changes in BAL to improve our understanding of their pathogenesis and identify potential biomarkers and therapeutic targets. In this regard, the authors identify a correlation between CD16 expression in T cells and the severity of PCP and an increased infiltration of CD57+ CD8+ T cells expressing immune checkpoints and FCLR5+ B cells in ICI-ILD patients.
The conclusions of this paper are mostly well supported by data, but some aspects of the data analysis need to be clarified and extended.
- The authors should elaborate on why different set of markers were selected for each analysis step. E.g., Different set of markers were used for UMAP, CITRUS and viSNE in the T cell and myeloid analysis.
- The authors should state if a normality test for the distribution of the data was performed. If not, non-parametric tests should be used.
- The authors should explore the correlation between CD16 intensity and the CTCAE grade in T cell subsets such as EMRA CD8 T cells, effector memory CD4, etc as identified in Figure 1B.
- The authors could use CITRUS to better assess the B cell compartment.
Reviewer #3 (Public Review):
The authors collected BALF samples from lung cancer patients newly diagnosed with PCP, DI-ILD or ICI-ILD. CyTOF was performed on these samples, using two different panels (T-cell and B-cell/myeloid cell panels). Results were collected, cleaned-up, manually gated and pre-processed prior to visualisation with manifold learning approaches t-SNE (in the form of viSNE) or UMAP, and analysed by CITRUS (hierarchical clustering followed by feature selection and regression) for population identification - all using Cytobank implementation - in an attempt to identify possible biomarkers for these disease states. By comparing cell abundances from CITRUS results and qualitative inspection of a small number of marker expressions, the authors claimed to have identified an expansion of CD16+ T-cell population in PCP cases and an increase in CD57+ CD8+ T-cells, FCRL5+ B-cells and CCR2+ CCR5+ CD14+ monocytes in ICI-ILD cases.
By the authors' own admission, there is an absence of healthy donor samples and, perhaps as a result of retrospective experimental design, also an absence of pre-treatment samples. The entire analysis effectively compares three yet-established disease states with no common baseline - what really constitutes a "biomarker" in such cases? The introduction asserts that "y characterizing the cellular and molecular changes in BAL from patients with these complications, we aim to improve our understanding of their pathogenesis and identify potential therapeutic targets" (lines 82-84). Given these obvious omissions, no real "changes" have been studied in the paper. These are very limited comparisons among three, and only these three, states.
Even assuming more thorough experimental design, the data analysis is unfortunately too shallow and has not managed to explore the wealth of information that could potentially be extracted from the results. CITRUS is accessible and convenient, but also make a couple of big assumptions which could affect data analysis - 1) Is it justified to concatenate all FCS files to analyse the data in one batch / small batches? Could there be batch effects or otherwise other biological events that could confuse the algorithm? 2) With a relatively small number of samples, and after internal feature selection of CITRUS, is the regression model suitable for population identification or would it be too crude and miss out rare populations? There are plenty of other established methods that could be used instead. Have those methods been considered?
Colouring t-SNE or UMAP (e.g. Figure 6C) plots by marker expression is useful for quick identification of cell populations but it is not a quantitative analysis. In a CyTOF analysis like this, it is common to work out fold changes of marker expressions between conditions. It is inadequate to judge expression levels and infer differences simply by looking at colours.
The relatively small number of samples also mean that most results presented in the paper are not statistical significant. Whilst it is understandable that it is not always possible to collect a large number of patient samples for studies like this, having several entire major figures showing "n.s." (e.g. Figures 3A, 4B and 5C), together with limitations in the comparisons themselves and inadequate analysis, make the observations difficult to be convincing, and even less so for the single fatal PCP case where N = 1.
It would also be good scientific practice to show evidence of sample data quality control. Were individual FCS files examined? Did the staining work? Some indication of QC would also be great.
This dataset generated and studied by the authors have the potential to address the question they set out to answer and thus potentially be useful for the field. However, in the current state of presentation, more evidence and more thorough data analysis are needed to draw any conclusions, or correlations, as the authors would like to frame them.
-
eLife assessment
This study presents a useful inventory of immune signatures that are correlated with cancer treatment-related pneumonitis. The data were collected and analysed using solid and validated methodology and can be used as a starting point for further functional studies.
-
Reviewer #2 (Public Review):
Yanagihara and colleagues investigated the immune cell composition of bronchoalveolar lavage fluid (BALF) samples in a cohort of patients with malignancy undergoing chemotherapy and with with lung adverse reactions including Pneumocystis jirovecii pneumonia (PCP) and immune-checkpoint inhibitors (ICIs) or cytotoxic drug induced interstitial lung diseases (ILDs). Using mass cytometry, their aim was to characterize the cellular and molecular changes in BAL to improve our understanding of their pathogenesis and identify potential biomarkers and therapeutic targets. In this regard, the authors identify a correlation between CD16 expression in T cells and the severity of PCP and an increased infiltration of CD57+ CD8+ T cells expressing immune checkpoints and FCLR5+ B cells in ICI-ILD patients.
The conclusions of …
Reviewer #2 (Public Review):
Yanagihara and colleagues investigated the immune cell composition of bronchoalveolar lavage fluid (BALF) samples in a cohort of patients with malignancy undergoing chemotherapy and with with lung adverse reactions including Pneumocystis jirovecii pneumonia (PCP) and immune-checkpoint inhibitors (ICIs) or cytotoxic drug induced interstitial lung diseases (ILDs). Using mass cytometry, their aim was to characterize the cellular and molecular changes in BAL to improve our understanding of their pathogenesis and identify potential biomarkers and therapeutic targets. In this regard, the authors identify a correlation between CD16 expression in T cells and the severity of PCP and an increased infiltration of CD57+ CD8+ T cells expressing immune checkpoints and FCLR5+ B cells in ICI-ILD patients.
The conclusions of this paper are mostly well supported by data, but some aspects of the data analysis need to be clarified and extended.
The authors should elaborate on why different set of markers were selected for each analysis step. E.g., Different set of markers were used for UMAP, CITRUS and viSNE in the T cell and myeloid analysis.
The authors should state if a normality test for the distribution of the data was performed. If not, non-parametric tests should be used.
The authors should explore the correlation between CD16 intensity and the CTCAE grade in T cell subsets such as EMRA CD8 T cells, effector memory CD4, etc as identified in Figure 1B.
The authors could use CITRUS to better assess the B cell compartment.
-
Reviewer #3 (Public Review):
The authors collected BALF samples from lung cancer patients newly diagnosed with PCP, DI-ILD or ICI-ILD. CyTOF was performed on these samples, using two different panels (T-cell and B-cell/myeloid cell panels). Results were collected, cleaned-up, manually gated and pre-processed prior to visualisation with manifold learning approaches t-SNE (in the form of viSNE) or UMAP, and analysed by CITRUS (hierarchical clustering followed by feature selection and regression) for population identification - all using Cytobank implementation - in an attempt to identify possible biomarkers for these disease states. By comparing cell abundances from CITRUS results and qualitative inspection of a small number of marker expressions, the authors claimed to have identified an expansion of CD16+ T-cell population in PCP cases …
Reviewer #3 (Public Review):
The authors collected BALF samples from lung cancer patients newly diagnosed with PCP, DI-ILD or ICI-ILD. CyTOF was performed on these samples, using two different panels (T-cell and B-cell/myeloid cell panels). Results were collected, cleaned-up, manually gated and pre-processed prior to visualisation with manifold learning approaches t-SNE (in the form of viSNE) or UMAP, and analysed by CITRUS (hierarchical clustering followed by feature selection and regression) for population identification - all using Cytobank implementation - in an attempt to identify possible biomarkers for these disease states. By comparing cell abundances from CITRUS results and qualitative inspection of a small number of marker expressions, the authors claimed to have identified an expansion of CD16+ T-cell population in PCP cases and an increase in CD57+ CD8+ T-cells, FCRL5+ B-cells and CCR2+ CCR5+ CD14+ monocytes in ICI-ILD cases.
By the authors' own admission, there is an absence of healthy donor samples and, perhaps as a result of retrospective experimental design and practical clinical reasons, also an absence of pre-treatment samples. The entire analysis effectively compares three yet-established disease states with no common baseline - what really constitutes a "biomarker" in such cases? These are very limited comparisons among three, and only these three, states.
By including a new scRNA-Seq analysis using publicly available dataset, the authors addressed this fundamental problem. Though more thorough and numerical analysis would be appreciated for a deeper and more impactful analysis, this is adequate for the intended objectives of the study.
-
-
eLife assessment
This study presents a valuable finding on the immunophenotypes of cancer treatment-related pneumonitis. The evidence supporting the claims of the authors is solid, although the inclusion of controls, as suggested by one of the reviewers, strengthened the study. The work will be of interest to cancer immunologists
-
Reviewer #1 (Public Review):
Cytotoxic agents and immune checkpoint inhibitors are the most commonly used and efficacious treatments for lung cancers. However their use brings two significant pulmonary side-effects; namely Pneumocystis jirovecii infection and resultant pneumonia (PCP), and interstitial lung disease (ILD). To observe the potential immunological drivers of these adverse events, Yanagihara et al. analysed and compared cells present in the bronchoalveolar lavage of three patient groups (PCP, cytotoxic drug-induced ILD [DI-ILD], and ICI-associated ILD [ICI-ILD]) using mass cytometry (64 markers). In PCP, they observed an expansion of the CD16+ T cell population, with the highest CD16+ T proportion (97.5%) in a fatal case, whilst in ICI-ILD, they found an increase in CD57+ CD8+ T cells expressing immune checkpoints (TIGIT+ …
Reviewer #1 (Public Review):
Cytotoxic agents and immune checkpoint inhibitors are the most commonly used and efficacious treatments for lung cancers. However their use brings two significant pulmonary side-effects; namely Pneumocystis jirovecii infection and resultant pneumonia (PCP), and interstitial lung disease (ILD). To observe the potential immunological drivers of these adverse events, Yanagihara et al. analysed and compared cells present in the bronchoalveolar lavage of three patient groups (PCP, cytotoxic drug-induced ILD [DI-ILD], and ICI-associated ILD [ICI-ILD]) using mass cytometry (64 markers). In PCP, they observed an expansion of the CD16+ T cell population, with the highest CD16+ T proportion (97.5%) in a fatal case, whilst in ICI-ILD, they found an increase in CD57+ CD8+ T cells expressing immune checkpoints (TIGIT+ LAG3+ TIM-3+ PD-1+), FCRL5+ B cells, and CCR2+ CCR5+ CD14+ monocytes. Given the fatal case, the authors also assessed for, and found, a correlation between CD16+ T cells and disease severity in PCP, postulating that this may be owing to endothelial destruction. Although n numbers are relatively small (n=7-9 in each cohort; common numbers for CyTOF papers), the authors use a wide panel (n=65) and two clustering methodologies giving greater strength to the conclusions. The differential populations discovered using one or two of the analytical methods are robust: whole population shifts with clear and significant clustering. These data are an excellent resource for clinical disease specialists and pan-disease immunologists, with a broad and engaging contextual discussion about what they could mean.
Strengths:
• The differences in immune cells in BAL in these specific patient subgroups is relatively unexplored.
• This is an observational study, with no starting hypothesis being tested.
• Two analytical methods are used to cluster the data.
• A relatively wide panel was used (64 markers), with particular strength in the alpha beta T cells and B cells.
• Relevant biomarkers, beta-D-glucan and KL-6 were also analysed
• Appropriate statistics were used throughout.
• Numbers are low (7 cases of PCP, 9 of DI-ILD, and 9 of ICI-ILD) but these are difficult samples to collect and so in relative terms, and considering the use of CyTOF, these are good numbers.
• Beta-D-glucan shows potential as a biomarker for PCP (as previously reported) whilst KL-6 shows potential as a biomarker for ICI-ILD (not reported before). Interestingly, KL-6 was not seen to be increased in DI-ILD patients.
• Despite the relatively low n numbers and lack of matching there are some clear differentials. The CD4/CD8+CD16+HLA-DR+CXCR3+CD14- T cell result is striking - up in PCP (with EM CD4s significantly down) - whilst the CD8 EMRA population is clear in ICI-ILD and 'non-exhausted' CD4s, with lower numbers of EMRA CD8s in DI-ILD.
• The authors identify 17/31 significantly differentiated clusters of myeloid cells, eg CD11bhi CD11chi CD64+ CD206+ alveolar macrophages with HLA-DRhi in PCP.
• With respect to B cells, the authors found that FCRL5+ B cells were more abundant in patients with ICI-ILD compared to those with PCP and DI-ILD, suggesting these FCRL5+ B cells may have a role in irAE.
• One patient's extreme CD16+ T cell (97.5% positive) and death, led the authors to consider CD16+ T cells as an indicator of disease severity in PCP. This was then tested and found to be correct.
• Authors discuss results in context of literature leading them to suggest that CD16+ T cells may target endothelial cells and wonder if anti-complement therapy may be efficacious in PCP.
• Great discussion on auto-reactive T cell clones where the authors suggest that in ICI-ILD CD8s may react against healthy lung, driving ILD.
• An observation of CXCR3 in different CD8 populations in ICI-ILD and PCP lead the authors to hypothesise on the chemoattractants in the microenvironment.
• Excellent point suggesting CD57 may not always be a marker of senescence on T cells - reflective of growing change within the community.
• Well considered suggestion that FCRL5+ B cells may be involved in ICI-ILD driven autoimmunity.
• The authors discuss the main weaknesses in the discussion and stress that the findings detailed in the paper "demonstrate a correlation rather than proof of causation".
• Figures and legends are clear and pleasing to the eye.Weaknesses:
• This is an observational study, with no starting hypothesis being tested.
• Only patients who were able to have a lavage taken have been recruited.
• One set of analysis wasn't carried out for one subgroup (ICI-ILD) as PD1 expression was negative owing to the use of nivolumab.
• Some immune cell subsets wouldn't be picked up with the markers and gating strategies used; e.g. NK cells.
• Some immune cells would be disproportionately damaged by the storage, thawing and preparation of the samples; e.g. granulocytes.
• Numbers are low (7 cases of PCP, 9 of DI-ILD, and 9 of ICI-ILD), sex, age and adverse event matching wasn't performed, and treatment regimen are varied and 'suspected' (suggesting incomplete clinical data) - but these are difficult samples to collect. These numbers drop further for some analyses e.g. T cell clustering owing to factors such as low cell number.
• The disease comparisons are with each other, there is no healthy control.
• Samples are taken at one time point.
• The discussion on probably the stand out result - the CD16+ T cells in PCP - relies on two papers - leading to a slightly skewed emphasis on one paper on CD16+ cells in COVID. There are other papers out there that have observed CD16+ T cells in other conditions. It is also worth being in mind that given the markers used, these CD16+ T cell may be gamma deltas.
• The discussion on ICI patient consistently showing increased PD1, could have been greater, as given the ICI is targeting PD1, one would expect the opposite as commented on, and observed, in the methods section. -
Reviewer #2 (Public Review):
Yanagihara and colleagues investigated the immune cell composition of bronchoalveolar lavage fluid (BALF) samples in a cohort of patients with malignancy undergoing chemotherapy and with with lung adverse reactions including Pneumocystis jirovecii pneumonia (PCP) and immune-checkpoint inhibitors (ICIs) or cytotoxic drug induced interstitial lung diseases (ILDs). Using mass cytometry, their aim was to characterize the cellular and molecular changes in BAL to improve our understanding of their pathogenesis and identify potential biomarkers and therapeutic targets. In this regard, the authors identify a correlation between CD16 expression in T cells and the severity of PCP and an increased infiltration of CD57+ CD8+ T cells expressing immune checkpoints and FCLR5+ B cells in ICI-ILD patients.
The conclusions of …
Reviewer #2 (Public Review):
Yanagihara and colleagues investigated the immune cell composition of bronchoalveolar lavage fluid (BALF) samples in a cohort of patients with malignancy undergoing chemotherapy and with with lung adverse reactions including Pneumocystis jirovecii pneumonia (PCP) and immune-checkpoint inhibitors (ICIs) or cytotoxic drug induced interstitial lung diseases (ILDs). Using mass cytometry, their aim was to characterize the cellular and molecular changes in BAL to improve our understanding of their pathogenesis and identify potential biomarkers and therapeutic targets. In this regard, the authors identify a correlation between CD16 expression in T cells and the severity of PCP and an increased infiltration of CD57+ CD8+ T cells expressing immune checkpoints and FCLR5+ B cells in ICI-ILD patients.
The conclusions of this paper are mostly well supported by data, but some aspects of the data analysis need to be clarified and extended.
The authors should elaborate on why different set of markers were selected for each analysis step. E.g., Different set of markers were used for UMAP, CITRUS and viSNE in the T cell and myeloid analysis.
The authors should state if a normality test for the distribution of the data was performed. If not, non-parametric tests should be used.
The authors should explore the correlation between CD16 intensity and the CTCAE grade in T cell subsets such as EMRA CD8 T cells, effector memory CD4, etc as identified in Figure 1B.
The authors could use CITRUS to better assess the B cell compartment.
-
Reviewer #3 (Public Review):
The authors collected BALF samples from lung cancer patients newly diagnosed with PCP, DI-ILD or ICI-ILD. CyTOF was performed on these samples, using two different panels (T-cell and B-cell/myeloid cell panels). Results were collected, cleaned-up, manually gated and pre-processed prior to visualisation with manifold learning approaches t-SNE (in the form of viSNE) or UMAP, and analysed by CITRUS (hierarchical clustering followed by feature selection and regression) for population identification - all using Cytobank implementation - in an attempt to identify possible biomarkers for these disease states. By comparing cell abundances from CITRUS results and qualitative inspection of a small number of marker expressions, the authors claimed to have identified an expansion of CD16+ T-cell population in PCP cases …
Reviewer #3 (Public Review):
The authors collected BALF samples from lung cancer patients newly diagnosed with PCP, DI-ILD or ICI-ILD. CyTOF was performed on these samples, using two different panels (T-cell and B-cell/myeloid cell panels). Results were collected, cleaned-up, manually gated and pre-processed prior to visualisation with manifold learning approaches t-SNE (in the form of viSNE) or UMAP, and analysed by CITRUS (hierarchical clustering followed by feature selection and regression) for population identification - all using Cytobank implementation - in an attempt to identify possible biomarkers for these disease states. By comparing cell abundances from CITRUS results and qualitative inspection of a small number of marker expressions, the authors claimed to have identified an expansion of CD16+ T-cell population in PCP cases and an increase in CD57+ CD8+ T-cells, FCRL5+ B-cells and CCR2+ CCR5+ CD14+ monocytes in ICI-ILD cases.
By the authors' own admission, there is an absence of healthy donor samples and, perhaps as a result of retrospective experimental design, also an absence of pre-treatment samples. The entire analysis effectively compares three yet-established disease states with no common baseline - what really constitutes a "biomarker" in such cases? The introduction asserts that "y characterizing the cellular and molecular changes in BAL from patients with these complications, we aim to improve our understanding of their pathogenesis and identify potential therapeutic targets" (lines 82-84). Given these obvious omissions, no real "changes" have been studied in the paper. These are very limited comparisons among three, and only these three, states.
Even assuming more thorough experimental design, the data analysis is unfortunately too shallow and has not managed to explore the wealth of information that could potentially be extracted from the results. CITRUS is accessible and convenient, but also make a couple of big assumptions which could affect data analysis - 1) Is it justified to concatenate all FCS files to analyse the data in one batch / small batches? Could there be batch effects or otherwise other biological events that could confuse the algorithm? 2) With a relatively small number of samples, and after internal feature selection of CITRUS, is the regression model suitable for population identification or would it be too crude and miss out rare populations? There are plenty of other established methods that could be used instead. Have those methods been considered?
Colouring t-SNE or UMAP (e.g. Figure 6C) plots by marker expression is useful for quick identification of cell populations but it is not a quantitative analysis. In a CyTOF analysis like this, it is common to work out fold changes of marker expressions between conditions. It is inadequate to judge expression levels and infer differences simply by looking at colours.
The relatively small number of samples also mean that most results presented in the paper are not statistical significant. Whilst it is understandable that it is not always possible to collect a large number of patient samples for studies like this, having several entire major figures showing "n.s." (e.g. Figures 3A, 4B and 5C), together with limitations in the comparisons themselves and inadequate analysis, make the observations difficult to be convincing, and even less so for the single fatal PCP case where N = 1.
It would also be good scientific practice to show evidence of sample data quality control. Were individual FCS files examined? Did the staining work? Some indication of QC would also be great.
This dataset generated and studied by the authors have the potential to address the question they set out to answer and thus potentially be useful for the field. However, in the current state of presentation, more evidence and more thorough data analysis are needed to draw any conclusions, or correlations, as the authors would like to frame them.
-
