Dorsolateral prefrontal activity supports a cognitive space organization of cognitive control
Curation statements for this article:-
Curated by eLife

eLife assessment
Yang et al. investigate whether distinct sources of conflict are represented in a common cognitive space. The study uses an interesting task that mixes different sources of difficulty and reports that the brain appears to represent these sources as a mixture on a continuum in prefrontal areas. While the findings could be valuable to theory in this area, there are some concerns with the design and results, that raise uncertainty regarding the main conclusion of a shared cognitive space. The authors appropriately acknowledge these limitations while also highlighting the valid contributions that the study makes. Thus, while solid evidence is reported here, consistent with the central hypothesis, further experiments are required to support the strictest interpretation.
This article has been Reviewed by the following groups
Discuss this preprint
Start a discussion What are Sciety discussions?Listed in
- Evaluated articles (eLife)
Abstract
Cognitive control resolves conflicts between task-relevant and -irrelevant information to enable goal-directed behavior. As conflicts can arise from different sources (e.g., sensory input, internal representations), how a limited set of cognitive control processes can effectively address diverse conflicts remains a major challenge. Based on the cognitive space theory, different conflicts can be parameterized and represented as distinct points in a (low-dimensional) cognitive space, which can then be resolved by a limited set of cognitive control processes working along the dimensions. It leads to a hypothesis that conflicts similar in their sources are also represented similarly in the cognitive space. We designed a task with five types of conflicts that could be conceptually parameterized. Both human performance and fMRI activity patterns in the right dorsolateral prefrontal cortex support that different types of conflicts are organized based on their similarity, thus suggesting cognitive space as a principle for representing conflicts.
Article activity feed
-

-
-
-

Author Response
The following is the authors’ response to the previous reviews.
Reviewer #1:
Concerns Public Review:
1)The framing of 'infinite possible types of conflict' feels like a strawman. While they might be true across stimuli (which may motivate a feature-based account of control), the authors explore the interpolation between two stimuli. Instead, this work provides confirmatory evidence that task difficulty is represented parametrically (e.g., consistent with literatures like n-back, multiple object tracking, and random dot motion). This parametric encoding is standard in feature-based attention, and it's not clear what the cognitive map framing is contributing.
Suggestion:
- 'infinite combinations'. I'm frankly confused by the authors response. I don't feel like the framing has changed very much, besides a few minor …
Author Response
The following is the authors’ response to the previous reviews.
Reviewer #1:
Concerns Public Review:
1)The framing of 'infinite possible types of conflict' feels like a strawman. While they might be true across stimuli (which may motivate a feature-based account of control), the authors explore the interpolation between two stimuli. Instead, this work provides confirmatory evidence that task difficulty is represented parametrically (e.g., consistent with literatures like n-back, multiple object tracking, and random dot motion). This parametric encoding is standard in feature-based attention, and it's not clear what the cognitive map framing is contributing.
Suggestion:
- 'infinite combinations'. I'm frankly confused by the authors response. I don't feel like the framing has changed very much, besides a few minor replacements. Previous work in MSIT (e.g., by the author Zhongzheng Fu) has looked at whether conflict levels are represented similarly across conflict types using multivariate analyses. In the paper mentioned by Ritz & Shenhav (2023), the authors looked at whether conflict levels are represented similarly across conflict types using multivariate analyses. It's not clear what this paper contributes theoretically beyond the connections to cognitive maps, which feel like an interpretative framework rather than a testable hypothesis (i.e., these previous paper could have framed their work as cognitive maps).
Response: We acknowledge the limitations inherent in our experimental design, which prevents us from conducting a strict test of the cognitive space view. In our previous revision, we took steps to soften our conclusions and emphasize these limitations. However, we still believe that our study offers valuable and novel insights into the cognitive space, and the tests we conducted are not merely strawman arguments.
Specifically, our study aimed to investigate the fundamental principles of the cognitive space view, as we stated in our manuscript that “the representations of different abstract information are organized continuously and the representational geometry in the cognitive space is determined by the similarity among the represented information (Bellmund et al., 2018)”. While previous research has applied multivariate analyses to understand cognitive control representation, no prior studies had directedly tested the two key hypotheses associated with cognitive space: (1) that cognitive control representation across conflict types is continuous, and (2) that the similarity among representations of different conflict types is determined by their external similarity.
Our study makes a unique contribute by directly testing these properties through a parametric manipulation of different conflict types. This approach differs significantly from previous studies in two ways. First, our parametric manipulation involves more than two levels of conflict similarity, enabling us to directly test the two critical hypotheses mentioned above. Unlike studies such as Fu et al. (2022) and other that have treated different conflict types categorically, we introduced a gradient change in conflict similarity. This differentiation allowed us to employ representational similarity analysis (RSA) over the conflict similarity, which goes beyond mere decoding as utilized in prior work (see more explanation below for the difference between Fu et al., 2022 and our study [1]).
Second, our parametric manipulation of conflict types differs from previous studies that have manipulated task difficulty, and the modulation of multivariate pattern similarity observed in our study could not be attributed by task difficulty. Previous research, including the Ritz & Shenhav (2023) (see below explanation[2]), has primarily shown that task difficulty modulates univoxel brain activation. A recent work by Wen & Egner (2023) reported a gradual change in the multivariate pattern of brain activations across a wide range of frontoparietal areas, supporting the reviewer’s idea that “task difficulty is represented parametrically”. However, we do not believe that our results reflect the task difficulty representation. For instance, in our study, the spatial Stroop-only and Simon-only conditions exhibited similar levels of difficulty, as indicated by their relatively comparable congruency effects (Fig. S1). Despite this similarity in difficulty, we found that the representational similarity between these two conditions was the lowest (see revised Fig. S4, the most off-diagonal value). This observation aligns more closely with our hypothesis that these two conditions are most dissimilar in terms of their conflict types.
[1] Fu et al. (2022) offers important insights into the geometry of cognitive space for conflict processing. They demonstrated that Simon and flanker conflicts could be distinguished by a decoder that leverages the representational geometry within a multidimensional space. However, their model of cognitive space primarily relies on categorical definitions of conflict types (i.e., Simon versus flanker), rather than exploring a parametric manipulation of these conflict types. The categorical manipulations make it difficult to quantify conceptual similarity between conflict types and hence limit the ability to test whether neural representations of conflict capture conceptual similarity. To the best of our knowledge, no previous studies have manipulated the conflict types parametrically. This gap highlights a broader challenge within cognitive science: effectively manipulating and measuring similarity levels for conflicts, as well as other high-level cognitive processes, which are inherently abstract. We therefore believe our parametric manipulation of conflict types, despite its inevitable limitations, is an important contribution to the literature.
We have incorporated the above statements into our revised manuscript: Methodological implications. Previous studies with mixed conflicts have applied mainly categorical manipulations of conflict types, such as the multi-source interference task (Fu et al., 2022) and color Stroop-Simon task (Liu et al., 2010). The categorical manipulations make it difficult to quantify conceptual similarity between conflict types and hence limit the ability to test whether neural representations of conflict capture conceptual similarity. To the best of our knowledge, no previous studies have manipulated the conflict types parametrically. This gap highlights a broader challenge within cognitive science: effectively manipulating and measuring similarity levels for conflicts, as well as other high-level cognitive processes, which are inherently abstract. The use of an experimental paradigm that permits parametric manipulation of conflict similarity provides a way to systematically investigate the organization of cognitive control, as well as its influence on adaptive behaviors.
[2] The work by Ritz & Shenhav (2023) indeed applied multivariate analyses, but they did not test the representational similarity across different levels of task difficulty in a similar way as our investigation into different levels of conflict types, neither did they manipulated conflict types as our study. They first estimated univariate brain activations that were parametrically scaled by task difficulty (e.g., target coherence), yielding one map of parameter estimates (i.e., encoding subspace) for each of the target coherence and distractor congruence. The multivoxel patterns from the above maps were correlated to test whether the target coherence and distractor congruence share the similar neural encoding. It is noteworthy that the encoding of task difficulty in their study is estimated at the univariate level, like the univariate parametric modulation analysis in our study. The representational similarity across target coherence and distractor congruence was the second-order test and did not reflect the similarity across different difficulty levels. Though, we have found another study (Wen & Egner, 2023) that has directly tested the representational similarity across different levels of task difficulty, and they observed a higher representational similarity between conditions with similar difficulty levels within a wide range of brain regions.
Reference:
Wen, T., & Egner, T. (2023). Context-independent scaling of neural responses to task difficulty in the multiple-demand network. Cerebral Cortex, 33(10), 6013-6027. https://doi.org/10.1093/cercor/bhac479
Fu, Z., Beam, D., Chung, J. M., Reed, C. M., Mamelak, A. N., Adolphs, R., & Rutishauser, U. (2022). The geometry of domain-general performance monitoring in the human medial frontal cortex. Science (New York, N.Y.), 376(6593), eabm9922. https://doi.org/10.1126/science.abm9922
Ritz, H., & Shenhav, A. (2023). Orthogonal neural encoding of targets and distractors supports multivariate cognitive control. https://doi.org/10.1101/2022.12.01.518771 Another issue is suggesting mixtures between two types of conflict may be many independent sources of conflict. Again, this feels like the strawman. There's a difference between infinite combinations of stimuli on the one hand, and levels of feature on the other hand. The issue of infinite stimuli is why people have proposed feature-based accounts, which are often parametric, eg color, size, orientation, spatial frequency. Mixing two forms of conflict is interesting, but the task limitations (i.e., highly correlated features) prevent an analysis of whether these are truly mixed (or eg reflect variations on just one of the conflict types). Without being able to compare a mixture between types vs levels of only one type, it's not clear what you can draw from these results re: how these are combined (and not clear how it reconciles the debate between general and specific).
Response: As the reviewer pointed out, a feature (or a parameterization) is an efficient way to encode potentially infinite stimuli. This is the same idea as our hypothesis: different conflict types are represented in a cognitive space akin to concrete features such as a color spectrum. This concept can be illustrated in the figure below.
Author response image 1.
We would like to clarify that in our study we have manipulated five levels of conflict types, but they all originated from two fundamental sources: vertically spatial Stroop and horizontally Simon conflicts. We agree that the mixture of these two sources does not inherently generate additional conflict sources. However, this mixture does influence the similarity among different conflict conditions, which provides essential variability that is crucial for testing the core hypotheses (i.e., continuity and similarity modulation, see the response above) of the cognitive space view. This clarification is crucial as the reviewer’s impression might have been influenced by our introduction, where we repeatedly emphasized multiple sources of conflicts. Our aim in the introduction was to outline a broader conceptual framework, which might not directly reflect the specific design of our current study. Recognizing the possibility of misinterpretation, we have adjusted our introduction and discussion to place less emphasis on the variety of possible conflict sources. For example, we have removed the expression “The large variety of conflict sources implies that there may be innumerable number of conflict conditions” from the introduction. As we have addressed in the previous response, the observed conflict similarity effect could not be attributed to merely task difficulty. Similarly, the mixture of spatial Stroop and Simon conflicts should not be attributed to one conflict source only; doing so would oversimplify it to an issue of task difficulty, as it would imply that our manipulation of conflict types merely represented varying levels of a single conflict, akin to manipulating task difficulty when everything else being equal. Importantly, the mixed conditions differ from variations along a single conflict source in that they also incorporate components of the other conflict source, thereby introducing difference beyond that would be found within variances of a single conflict source. There are a few additional evidence challenging the single dimension assumption. In our previous revisions, we compared model fittings between the Cognitive-Space model and the Stroop-/Simon-only models, and results showed that the CognitiveSpace model (BIC = 5377093) outperformed the Stroop-Only (BIC = 5377122) and Simon-Only (BIC = 5377096) models. This suggests that mixed conflicts might not be solely reflective of either Stroop or Simon sources, although we did not include these results due to concerns raised by reviewers about the validity of such comparisons, given the high anticorrelation between the two dimensions. Furthermore, Fu et al. (2022) demonstrated that the mixture of Simon and Flanker conflicts (the sf condition) is represented as the vector sum of the Flanker and Simon dimensions within their space model, indicating a compositional nature. Similarly, our mixed conditions are combinations of Stroop and Simon conflicts, and it is plausible that these mixtures represent a fusion of both Stroop and Simon components, rather than just one. Thus, we disagree that the mixture of conflicts is a strawman. In response to this concern, we have included a statement in our limitation section: “Another limitation is that in our design, the spatial Stroop and Simon effects are highly anticorrelated. This constraint may make the five conflict types represented in a unidimensional space (e.g., a circle) embedded in a 2D space. This limitation also means we cannot conclusively rule out the possibility of a real unidimensional space driven solely by spatial Stroop or Simon conflicts. However, this appears unlikely, as it would imply that our manipulation of conflict types merely represented varying levels of a single conflict, akin to manipulating task difficulty when everything else being equal. If task difficulty were the primary variable, we would expect to see greater representational similarity between task conditions of similar difficulty, such as the Stroop and Simon conditions, which demonstrates comparable congruency effects (see Fig. S1). Contrary to this, our findings reveal that the Stroop-only and Simon-only conditions exhibit the lowest representational similarity (Fig. S4). Furthermore, Fu et al. (2022) has shown that the representation of mixtures of Simon and Flanker conflicts was compositional, rather than reflecting single dimension, which also applies to our cases.”
My recommendation would be to dramatically rewrite to reduce the framing of this providing critical evidence in favor of cognitive maps, and being more overt about the limitations of this task. However, the authors are not required to make further revisions in eLife's new model, and it's not clear how my scores would change if they made those revisions (ie the conceptual limitations would remain, the claims would just now match the more limited scope).
Response: With the above rationales and the adjustments we have made in the manuscripts, we believe that we have thoroughly acknowledged and articulated the limitations of our study. Therefore, we have decided against a complete rewrite of the manuscript.
Public Review:
- The representations within DLPFC appear to treat 100% Stoop and (to a lesser extent) 100% Simon differently than mixed trials. Within mixed trials, the RDM within this region don't strongly match the predictions of the conflict similarity model. It appears that there may be a more complex relationship encoded in this region.
Suggestion:
- RSMs in the key region of interest. I don't really understand the authors response here either. e.g,. 'It is essential to clarify that our conclusions were based on the significant similarity modulation effect identified in our statistical analysis using the cosine similarity model, where we did not distinguish between the within-Stroop condition and the other four within-conflict conditions (Fig. 7A, now Fig. 8A). This means that the representation of conflict type was not biased by the seemingly disparities in the values shown here'. In Figure 1C, it does look like they are testing this model.
It seems like a stronger validation would test just the mixture trials (i.e., ignoring Simon-only and stroop-only). However, simon/stroop-only conditions being qualitatively different does beg the question of whether these are being represented parametrically vs categorically.
Response: We apologize for the confusion caused by our previous response. To clarify, our conclusions have been drawn based on the robust conflict similarity effect.
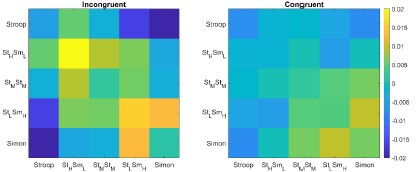
The conflict similarity regressor is defined by higher values in the diagonal cells (representing within-conflict similarity) than the off-diagonal cells (indicating between-conflict similarity), as illustrated in Fig. 1C and Fig. 8A (now Fig. 4B). It is important to note that this regressor may not be particularly sensitive to the variations within the diagonal cells. Our previous response aimed to emphasize that the inconsistencies observed along the diagonal do not contradict our core hypothesis regarding the conflict similarity effect.
We recognized that since the visualization in Fig. S4, based on the raw RSM (i.e., Pearson correlation), may have been influenced by other regressors in our model than the conflict similarity effect. To reflect pattern similarity with confounding factors controlled for, we have visualized the RSM by including only the fixed effect of the conflict similarity and the residual while excluding all other factors. As shown in the revised Figure S4, the difference between the within-Stroop and other diagonal cells was greatly reduced. Instead, it revealed a clear pattern where that the diagonal values were higher than the off-diagonal values in the incongruent condition, aligning with our hypothesis regarding the conflict similarity modulator. Although some visual distinctions persist within the five diagonal cells (e.g., in the incongruent condition, the Stroop, Simon, and StMSmM conditions appear slightly lower than StHSmL and StLSmM conditions), follow-up one-way ANOVAs among these five diagonal conditions showed no significant differences. This held true for both incongruent and congruent conditions, with Fs < 1. Thus, we conclude that there is no strong evidence supporting the notion that Simon- and spatial Stroop-only conditions are systematically different from other conflict types. As a result, we decided not to exclude these two conflict types from analysis.
Author response image 2.
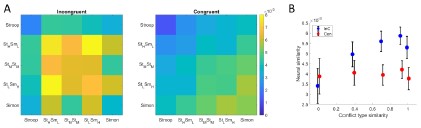
The stronger conflict type similarity effect in incongruent versus congruent conditions. Shown are the summary representational similarity matrices for the right 8C region in incongruent (left) and congruent (right) conditions, respectively. Each cell represents the averaged Pearson correlation (after regressing out all factors except the conflict similarity) of cells with the same conflict type and congruency in the 1400×1400 matrix. Note that the seemingly disparities in the values of withinconflict cells (i.e., the diagonal) did not reach significance for either incongruent or congruent trials, Fs < 1.
Public Review:
- To orthogonalized their variables, the authors need to employ a complex linear mixed effects analysis, with a potential influence of implementation details (e.g., high-level interactions and inflated degrees of freedom).
Suggestion:
- The DF for a mixed model should not be the number of observations minus the number of fixed effects. The gold standard is to use satterthwaite correction (e.g. in Matlab, fixedEffects(lme,'DFMethod','satterthwaite')), or number of subjects - number of fixed effects (i.e. you want to generalize to new subjects, not just new samples from the same subjects). Honestly, running a 4-way interaction probably is probably using more degrees of freedom than are appropriate given the number of subjects.
Response: We concur with the reviewer’s comment that our previous estimation of degrees of freedom (DFs) was inaccurate. Following your suggestion, we have now applied the “Satterthwaite” approach to approximate the DFs for all our linear mixed effect model analyses. This adjustment has led to the correction of both DFs and p values. In the Methods section, we have mentioned this revision.
“We adjusted the t and p values with the degrees of freedom calculated through the Satterthwaite approximation method (Satterthwaite, 1946). Of note, this approach was applied to all the mixed-effect model analyses in this study.”
The application of this method has indeed resulted in a reduction of our statistical significance. However, our overall conclusions remained robust. Instead of the highly stringent threshold used in our previous version (Bonferonni corrected p < .0001), we have now adopted a relatively more lenient threshold of Bonferonni correction at p < 0.05, which is commonly employed in the literature. Furthermore, it is worth noting that the follow-up criteria 2 and 3 are inherently second-order analyses. Criterion 2 involves examining the interaction effect (conflict similarity effect difference between incongruent and congruent conditions), and criterion 3 involves individual correlation analyses. Due to their second-order nature, these criteria inherently have lower statistical power compared to criterion 1 (Blake & Gangestad, 2020). We thus have applied a more lenient but still typically acceptable false discovery rate (FDR) correction to criteria 2 and 3. This adjustment helps maintain the rigor of our analysis while considering the inherent differences in statistical power across the various criteria. We have mentioned this revision in our manuscript:
“We next tested whether these regions were related to cognitive control by comparing the strength of conflict similarity effect between incongruent and congruent conditions (criterion 2) and correlating the strength to behavioral similarity modulation effect (criterion 3). Given these two criteria pertain to second-order analyses (interaction or individual analyses) and thus might have lower statistical power (Blake & Gangestad, 2020), we applied a more lenient threshold using false discovery rate (FDR) correction (Benjamini & Hochberg, 1995) on the above-mentioned regions.”
With these adjustments, we consistently identified similar brain regions as observed in our previous version. Specifically, we found that only the right 8C region met the three criteria in the conflict similarity analysis. In addition, the regions meeting the criteria for the orientation effect included the FEF and IP2 in left hemisphere, and V1, V2, POS1, and PF in the right hemisphere. We have thoroughly revised the description of our results, updated the figures and tables in both the revised manuscript and supplementary material to accurately reflect these outcomes.
Reference:
Blake, K. R., & Gangestad, S. (2020). On Attenuated Interactions, Measurement Error, and Statistical Power: Guidelines for Social and Personality Psychologists. Pers Soc Psychol Bull, 46(12), 1702-1711. https://doi.org/10.1177/0146167220913363
Minor:
- Figure 8 should come much earlier (e.g, incorporated into Figure 1), and there should be consistent terms for 'cognitive map' and 'conflict similarity'.
Response: We appreciate this suggestion. Considering that Figure 7 (“The crosssubject RSA model and the rationale”) also describes the models, we have merged Figure 7 and 8 and moved the new figure ahead, before we report the RSA results. Now you could find it in the new Figure 4, see below. We did not incorporate them into Figure 1 since Figure 1 is already too crowded.
Author response image 3.
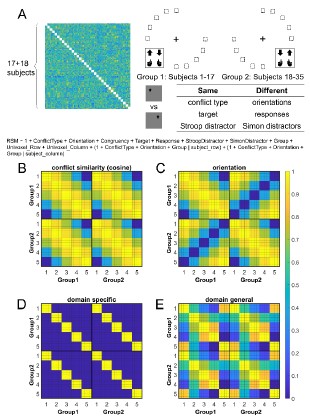
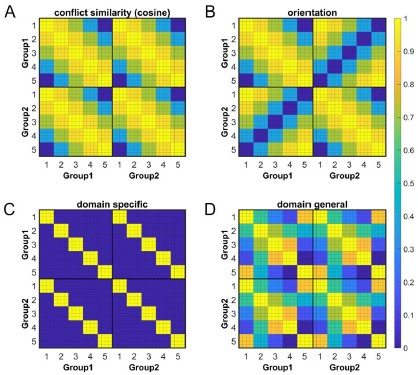
Fig. 4. Rationale of the cross-subject RSA model and the schematic of key RSMs. A) The RSM is calculated as the Pearson’s correlation between each pair of conditions across the 35 subjects. For 17 subjects, the stimuli were displayed on the top-left and bottom-right quadrants, and they were asked to respond with left hand to the upward arrow and right hand to the downward arrow. For the other 18 subjects, the stimuli were displayed on the top-right and bottom-left quadrants, and they were asked to respond with left hand to the downward arrow and right hand to the upward arrow. Within each subject, the conflict type and orientation regressors were perfectly covaried. For instance, the same conflict type will always be on the same orientation. To de-correlate conflict type and orientation effects, we conducted the RSA across subjects from different groups. For example, the bottom-right panel highlights the example conditions that are orthogonal to each other on the orientation, response, and Simon distractor, whereas their conflict type, target and spatial Stroop distractor are the same. The dashed boxes show the possible target locations for different conditions. (B) and (C) show the orthogonality between conflict similarity and orientation RSMs. The within-subject RSMs (e.g., Group1-Group1) for conflict similarity and orientation are all the same, but the cross-group correlations (e.g., Group2-Group1) are different. Therefore, we can separate the contribution of these two effects when including them as different regressors in the same linear regression model. (D) and (E) show the two alternative models. Like the cosine model (B), within-group trial pairs resemble betweengroup trial pairs in these two models. The domain-specific model is an identity matrix. The domaingeneral model is estimated from the absolute difference of behavioral congruency effect, but scaled to 0 (lowest similarity) – 1 (highest similarity) to aid comparison. The plotted matrices in B-E include only one subject each from Group 1 and Group 2. Numbers 1-5 indicate the conflict type conditions, for spatial Stroop, StHSmL, StMSmM, StLSmH, and Simon, respectively. The thin lines separate four different sub-conditions, i.e., target arrow (up, down) × congruency (incongruent, congruent), within each conflict type.
In our manuscript, the term “cognitive map/space” was used when explaining the results in a theoretical perspective, whereas the “conflict similarity” was used to describe the regressor within the RSA. These terms serve distinct purposes in our study and cannot be interchangeably substituted. Therefore, we have retained them in their current format. However, we recognize that the initial introduction of the “Cognitive-Space model” may have appeared somewhat abrupt. To address this, we have included a brief explanatory note: “The model described above employs the cosine similarity measure to define conflict similarity and will be referred to as the Cognitive-Space model.”
-
eLife assessment
Yang et al. investigate whether distinct sources of conflict are represented in a common cognitive space. The study uses an interesting task that mixes different sources of difficulty and reports that the brain appears to represent these sources as a mixture on a continuum in prefrontal areas. While the findings could be valuable to theory in this area, there are some concerns with the design and results, that raise uncertainty regarding the main conclusion of a shared cognitive space. The authors appropriately acknowledge these limitations while also highlighting the valid contributions that the study makes. Thus, while solid evidence is reported here, consistent with the central hypothesis, further experiments are required to support the strictest interpretation.
-
Reviewer #1 (Public Review):
People can perform a wide variety of different tasks, and a long-standing question in cognitive neuroscience is how the properties of different tasks are represented in the brain. The authors develop an interesting task that mixes two different sources of difficulty, and find that the brain appears to represent this mixture on a continuum, in the prefrontal areas involved in resolving task difficulty. While these results are interesting and in several ways compelling, they overlap with previous findings and rely on novel statistical analyses that may require further validation.
Strengths
1. The authors present an interesting and novel task for combining the contributions of stimulus-stimulus and stimulus-response conflict. While this mixture has been measured in the multi-source interference task (MSIT), …Reviewer #1 (Public Review):
People can perform a wide variety of different tasks, and a long-standing question in cognitive neuroscience is how the properties of different tasks are represented in the brain. The authors develop an interesting task that mixes two different sources of difficulty, and find that the brain appears to represent this mixture on a continuum, in the prefrontal areas involved in resolving task difficulty. While these results are interesting and in several ways compelling, they overlap with previous findings and rely on novel statistical analyses that may require further validation.
Strengths
1. The authors present an interesting and novel task for combining the contributions of stimulus-stimulus and stimulus-response conflict. While this mixture has been measured in the multi-source interference task (MSIT), this task provides a more graded mixture between these two sources of difficulty.2. The authors do a good job triangulating regions that encoding conflict similarity, looking for the conjunction across several different measures of conflict encoding. These conflict measures use several best-practice approaches towards estimating representational similarity.
3. The authors quantify several salient alternative hypothesis, and systematically distinguish their core results from these alternatives.
4. The question that the authors tackle is important to cognitive control, and they make a solid contribution.
Concerns
1. The framing of 'infinite possible types of conflict' feels like a strawman. While they might be true across stimuli (which may motivate a feature-based account of control), the authors explore the interpolation between two stimuli. Instead, this work provides confirmatory evidence that task difficulty is represented parametrically (e.g., consistent with literatures like n-back, multiple object tracking, and random dot motion). This parametric encoding is standard in feature-based attention, and it's not clear what the cognitive map framing is contributing.2. The representations within DLPFC appear to treat 100% Stoop and (to a lesser extent) 100% Simon differently than mixed trials. Within mixed trials, the RDM within this region don't strongly match the predictions of the conflict similarity model. It appears that there may be a more complex relationship encoded in this region.
3. To orthogonalized their variables, the authors need to employ a complex linear mixed effects analysis, with a potential influence of implementation details (e.g., high-level interactions and inflated degrees of freedom).
-
Reviewer #2 (Public Review):
Summary
This study examines the construct of "cognitive spaces" as they relate to neural coding schemes present in response conflict tasks. The authors use a novel experimental design in which different types of response conflict (spatial Stroop, Simon) are parametrically manipulated. These conflict types are hypothesized to be encoded jointly, within an abstract "cognitive space", in which distances between task conditions depend only on the similarity of conflict types (i.e., where conditions with similar relative proportions of spatial-Stroop versus Simon conflicts are represented with similar activity patterns). Authors contrast such a representational scheme for conflict with several other conceptually distinct schemes, including a domain-general, domain-specific, and two task-specific schemes. The …Reviewer #2 (Public Review):
Summary
This study examines the construct of "cognitive spaces" as they relate to neural coding schemes present in response conflict tasks. The authors use a novel experimental design in which different types of response conflict (spatial Stroop, Simon) are parametrically manipulated. These conflict types are hypothesized to be encoded jointly, within an abstract "cognitive space", in which distances between task conditions depend only on the similarity of conflict types (i.e., where conditions with similar relative proportions of spatial-Stroop versus Simon conflicts are represented with similar activity patterns). Authors contrast such a representational scheme for conflict with several other conceptually distinct schemes, including a domain-general, domain-specific, and two task-specific schemes. The authors conduct a behavioral and fMRI study to test whether prefrontal cortex activity is correlated to one of these coding schemes. Replicating the authors' prior work, this study demonstrates that sequential behavioral adjustments (the congruency sequence effect) are modulated as a function of the similarity between conflict types. In fMRI data, univariate analyses identified activation in left prefrontal and dorsomedial frontal cortex that was modulated by the amount of Stroop or Simon conflict present, and representational similarity analyses that identified coding of conflict similarity, as predicted under the cognitive space model, in right lateral prefrontal cortex.Strengths
This study addresses an important question regarding how conflict or difficulty might be encoded in the brain within a computationally efficient representational format. Relative to the other models reported in the paper, the evidence in support of the cognitive space model is solid. The ideas postulated by the authors are interesting and valuable ones, worthy of follow-up work that provides additional necessary scrutiny of the cognitive-space account.
Weaknesses
Future, within-subject experiments will be necessary to disentangle the cognitive space model from confounded task variables. A between-subjects manipulation of stimulus orientation/location renders the results difficult to interpret, as the source and spatial scale of the conflict encoding on cortex may differ from more rigorous (and more typical) within-subject manipulations.
Results are also difficult to interpret because Stroop and Simon conflict are confounded with each other. For interpretability, these two sources of conflict need to be manipulated orthogonally, so that each source of conflict (as well as their interaction) could be separately estimated and compared in terms of neural encoding. For example, it is therefore not clear whether the RSA results are due to encoding of only one type of conflict (Stroop or Simon), to a combination of both, and/or to interactive effects.
Finally, the motivation for the use of the term "cognitive space" to describe results is unclear. Evidence for the mere presence of a graded/parametric neural encoding (i.e., the reported conflict RSA effects) would not seem to be sufficient. Indeed, it is discussed in the manuscript that cognitive spaces/maps allow for flexibility through inference and generalization. Future work should therefore focus on linking neural conflict encoding to inference and generalization more directly.
-
-
Author Response
The following is the authors’ response to the previous reviews.
Thank you and the reviewers for further providing constructive comments and suggestions on our manuscript. On behalf of all the co-authors, I have enclosed a revised version of the above referenced paper. Below, I have merged similar public reviews and recommendations (if applicable) from each reviewer and provided point-by-point responses.
Reviewer #1:
People can perform a wide variety of different tasks, and a long-standing question in cognitive neuroscience is how the properties of different tasks are represented in the brain. The authors develop an interesting task that mixes two different sources of difficulty, and find that the brain appears to represent this mixture on a continuum, in the prefrontal areas involved in resolving task difficulty. …
Author Response
The following is the authors’ response to the previous reviews.
Thank you and the reviewers for further providing constructive comments and suggestions on our manuscript. On behalf of all the co-authors, I have enclosed a revised version of the above referenced paper. Below, I have merged similar public reviews and recommendations (if applicable) from each reviewer and provided point-by-point responses.
Reviewer #1:
People can perform a wide variety of different tasks, and a long-standing question in cognitive neuroscience is how the properties of different tasks are represented in the brain. The authors develop an interesting task that mixes two different sources of difficulty, and find that the brain appears to represent this mixture on a continuum, in the prefrontal areas involved in resolving task difficulty. While these results are interesting and in several ways compelling, they overlap with previous findings and rely on novel statistical analyses that may require further validation.
Strengths
- The authors present an interesting and novel task for combining the contributions of stimulus-stimulus and stimulus-response conflict. While this mixture has been measured in the multi-source interference task (MSIT), this task provides a more graded mixture between these two sources of difficulty.
- The authors do a good job triangulating regions that encoding conflict similarity, looking for the conjunction across several different measures of conflict encoding. These conflict measures use several best-practice approaches towards estimating representational similarity.
- The authors quantify several salient alternative hypothesis and systematically distinguish their core results from these alternatives.
- The question that the authors tackle is important to cognitive control, and they make a solid contribution.
The authors have addressed several of my concerns. I appreciate the authors implementing best practices in their neuroimaging stats.
I think that the concerns that remain in my public review reflect the inherent limitations of the current work. The authors have done a good job working with the dataset they've collected.
Response: We would like to thank the reviewer for the positive evaluation of our manuscript and the constructive comments and suggestions. In response to your suggestions and concerns, we have removed the Stroop/Simon-only and the Stroop+Simon models, revised our conclusion and modified the misleading phrases.
We have provided detailed responses to your comments below.
- The evidence from this previous work for mixtures between different conflict sources makes the framing of 'infinite possible types of conflict' feel like a strawman. The authors cite classic work (e.g., Kornblum et al., 1990) that develops a typology for conflict which is far from infinite. I think few people would argue that every possible source and level of difficulty will have to be learned separately. This work provides confirmatory evidence that task difficulty is represented parametrically (e.g., consistent with the n-back, MOT, and random dot motion literature).
notes for my public concerns.
In their response, the authors say:
'If each combination of the Stroop-Simon combination is regarded as a conflict condition, there would be infinite combinations, and it is our major goal to investigate how these infinite conflict conditions are represented effectively in a space with finite dimensions.'
I do think that this is a strawman. The paper doesn't make a strong case that this position ('infinite combinations') is widely held in the field. There is previous work (e.g., n-back, multiple object tracking, MSIT, dot motion) that has already shown parametric encoding of task difficulty. This paper provides confirmatory evidence, using an interesting new task, that demand are parametric, but does not provide a major theoretical advance.
Response: We agree that the previous expression may have seemed somewhat exaggerative. While it is not “infinite”, recent research indeed suggests that the cognitive control shows domain-specificity across various “domains”, including conflict types (Egner, 2008), sensory modalities (Yang et al., 2017), task-irrelevant stimuli (Spape et al., 2008), and task sets (Hazeltine et al., 2011), to name a few.
These findings collectively support the notion that cognitive control is contextspecific (Bream et al., 2014). That is, cognitive control can be tuned and associated with different (and potentially large numbers of) contexts. Recently, Kikumoto and Mayr (2020) demonstrated that combinations of stimulus, rule and response in the same task formed separatable, conjunctive representations. They further showed that these conjunctive representations facilitate performance. This is in line with the idea that each stimulus-location combination in the present task may be represented separately in a domain-specific manner. Moreover, domain-general task representation can also become domain-specific with learning, which further increases the number of domain-specific conjunctive representations (Mill et al., 2023). In line with the domain-specific account of cognitive control, we referred to the “infinite combinations” in our previous response to emphasize the extreme case of domainspecificity. However, recognizing that the term “infinite” may lead to ambiguity, we have replaced it with phrases such as “a large number of”, “hugely varied”, in our revised manuscript.
We appreciate the reviewer for highlighting the potential connection of our work to existing literature that showed the parametric encoding of task difficulty (e.g., Dagher et al., 1999; Ritz & Shenhav, 2023). For instance, in Ritz et al.’s (2023) study, they parametrically manipulated target difficulty based on consistent ratios of dot color, and found that the difficulty was encoded in the caudal part of dorsal anterior cingulate cortex. Analogically, in our study, the “difficulty” pertains to the behavioral congruency effect that we modulated within the spatial Stroop and Simon dimensions. Notably, we did identify univariate effects in the right dmPFC and IPS associated with the difficulty in the Simon dimension. This parametric effect may lend support to our cognitive space hypothesis, although we exercised caution in interpreting their significance due to the absence of a clear brain-behavioral relevance in these regions. We have added the connection of our work to prior literature in the discussion. The parametric encoding of conflict also mirrors prior research showing the parametric encoding of task demands (Dagher et al., 1999; Ritz & Shenhav, 2023).
However, our analyses extend beyond solely testing the parametric encoding of difficulty. Instead, we focused on the multivariate representation of different conflict types, which we believe is independent from the univariate parametric encoding. Unlike the univariate encoding that relies on the strength within one dimension, the multivariate representation of conflict types incorporates both the spatial Stroop and Simon dimensions. Furthermore, we found that similar difficulty levels did not yield similar conflict representation, as indicated by the low similarity between the spatial Stroop and Simon conditions, despite both showing a similar level of congruency effect (Fig. S1). Additionally, we also observed an interaction between conflict similarity and difficulty (i.e., congruency, Fig. 4B/D), such that the conflict similarity effect was more pronounced when conflict was present. Therefore, we believe that our findings make contribution to the literature beyond the difficulty effect.
Reference:
Egner, T. (2008). Multiple conflict-driven control mechanisms in the human brain. Trends in Cognitive Sciences, 12(10), 374-380. https://doi.org/10.1016/j.tics.2008.07.001
Yang, G., Nan, W., Zheng, Y., Wu, H., Li, Q., & Liu, X. (2017). Distinct cognitive control mechanisms as revealed by modality-specific conflict adaptation effects. Journal of Experimental Psychology: Human Perception and Performance, 43(4), 807-818. https://doi.org/10.1037/xhp0000351
Spapé MM, Hommel B (2008). He said, she said: episodic retrieval induces conflict adaptation in an auditory Stroop task. Psychonomic Bulletin Review,15(6):1117-21. https://doi.org/10.3758/PBR.15.6.1117
Hazeltine E, Lightman E, Schwarb H, Schumacher EH (2011). The boundaries of sequential modulations: evidence for set-level control. Journal of Experimental Psychology: Human Perception & Performance. 2011 Dec;37(6):1898-914. https://doi.org/10.1037/a0024662
Braem, S., Abrahamse, E. L., Duthoo, W., & Notebaert, W. (2014). What determines the specificity of conflict adaptation? A review, critical analysis, and proposed synthesis. Frontiers in Psychology, 5, 1134. https://doi.org/10.3389/fpsyg.2014.01134
Kikumoto A, Mayr U. (2020). Conjunctive representations that integrate stimuli, responses, and rules are critical for action selection. Proceedings of the National Academy of Sciences, 117(19):10603-10608. https://doi.org/10.1073/pnas.1922166117.
Mill, R. D., & Cole, M. W. (2023). Neural representation dynamics reveal computational principles of cognitive task learning. bioRxiv. https://doi.org/10.1101/2023.06.27.546751
Dagher, A., Owen, A. M., Boecker, H., & Brooks, D. J. (1999). Mapping the network for planning: a correlational PET activation study with the Tower of London task. Brain, 122 ( Pt 10), 1973-1987. https://doi.org/10.1093/brain/122.10.1973
Ritz, H., & Shenhav, A. (2023). Orthogonal neural encoding of targets and distractors supports multivariate cognitive control. https://doi.org/10.1101/2022.12.01.518771
- (Public Reviews) The degree of Stroop vs Simon conflict is perfectly negatively correlated across conditions. This limits their interpretation of an integrated cognitive space, as they cannot separately measure Stroop and Simon effects. The author's control analyses have limited ability to overcome this task limitation. While these results are consistent with parametric encoding, they cannot adjudicate between combined vs separated representations.
(Recommendations) I think that it is still an issue that the task's two features (stroop and simon conflict) are perfectly correlated. This fundamentally limits their ability to measure the similarity in these features. The authors provide several control analyses, but I think these are limited.
Response: We need to acknowledge that the spatial Stroop and Simon components in the five conflict conditions were not “perfectly” correlated, with r = –0.89. This leaves some room for the preliminary model comparison to adjudicate between these models. However, it’s essential to note that conclusions based on these results must be tempered. In line with the reviewer’s observation, we agree that the high correlation between the two conflict sources posed a potential limitation on our ability to independently investigate the contribution of spatial Stroop and Simon conflicts. Therefore, in addition to the limitation we have previously acknowledged, we have now further revised our conclusion and adjusted our expressions accordingly.
Specifically, we now regard the parametric encoding of cognitive control not as direct evidence of the cognitive space view but as preliminary evidence that led us to propose this hypothesis, which requires further testing. Notably, we have also modified the title from “Conflicts are represented in a cognitive space to reconcile domain-general and domain-specific cognitive control” to “Conflicts are parametrically encoded: initial evidence for a cognitive space view to reconcile the debate of domain-general and domain-specific cognitive control”. Also, we revised the conclusion as: In sum, we showed that the cognitive control can be parametrically encoded in the right dlPFC and guides cognitive control to adjust goal-directed behavior. This finding suggests that different cognitive control states may be encoded in an abstract cognitive space, which reconciles the long-standing debate between the domain-general and domain-specific views of cognitive control and provides a parsimonious and more broadly applicable framework for understanding how our brains efficiently and flexibly represents multiple task settings.
From Recommendations The authors perform control analyses that test stroop-only and simon-only models. However, these analyses use a totally different similarity metric, that's based on set intersection rather than geometry. This metric had limited justification or explanation, and it's not clear whether these models fit worse because of the similarity metric. Even here, Simon-only model fit better than Stroop+Simon model. The dimensionality analyses may reflect the 1d manipulation by the authors (i.e. perfectly corrected stroop and simon effects).
Response: The Jaccard measure is the most suitable method we can conceive of for assessing the similarity between two conflicts when establishing the Stroop-only and Simon-only models, achieved by projecting them onto the vertical or horizontal axes, respectively (Author response image 1A). This approach offers two advantages. First, the Jaccard similarity combines both similarity (as reflected by the numerator) and distance (reflected by the difference between denominator and numerator) without bias towards either. Second, the Jaccard similarity in our design is equivalent to the cosine similarity because the denominator in the cosine similarity is identical to the denominator in the Jaccard similarity (both are the radius of the circle, Author response image 1B).
Author response image 1.
Definition of Jaccard similarity. A) Two conflicts (1 and 2) are projected onto the spatial Stroop/Simon axis in the Stroop/Simon-only model, respectively. The Jaccard similarity for Stroop-only and Simon-only model are
 and
and  respectively. Letters a-d are the projected vectors from the two conflicts to the two axes. Blue and red colors indicate the conflict conditions. Shorter vectors are the intersection and longer vectors are the union. B) According to the cosine similarity model, the similarity is defined as
  , where e is the projected vector from conflict 1 to conflict 2, and g is the vector of conflict 1. The Jaccard similarity for this case is defined by
  , where f is the projector vector from conflict 2 to itself. Because f = g in our design, the Jaccard similarity is equivalent to the cosine similarity.
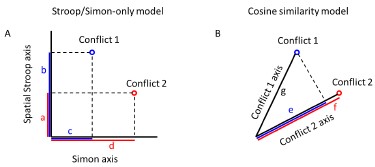
Therefore, we believe that the model comparisons between cosine similarity model and the Stroop/Simon-Only models were equitable. However, we acknowledge the reviewer’s and other reviewers’ concerns about the correlation between spatial Stroop and Simon conflicts, which reduces the space to one dimension (1d) and limits our ability to distinguish between the Stroop-only and Simon-only models, as well as between Stroop+Simon and cosine similarity models. While these distinctions are undoubtedly important for understanding the geometry of the cognitive space, we recognize that they go beyond the major objective of this study, that is, to differentiate the cosine similarity model from domain-general/specific models. Therefore, we have chosen to exclude the Stroop-only, Simon-only and Stroop+Simon models in our revised manuscript.
Something that raised additional concerns are the RSMs in the key region of interest (Fig S5). The pure stroop task appears to be represented very differently from all of the conditions that include simon conflict.
Together, I think these limitations reflect the structure of the task and research goals, not the statistical approach (which has been meaningfully improved).
Response: We appreciate the reviewer for pointing this out. It is essential to clarify that our conclusions were based on the significant similarity modulation effect identified in our statistical analysis using the cosine similarity model, where we did not distinguish between the within-Stroop condition and the other four within-conflict conditions (Fig. 7A, now Fig. 8A). This means that the representation of conflict type was not biased by the seemingly disparities in the values shown here. Moreover, to specifically test the differences between the within-Stroop condition and the other within-conflict conditions, we conducted a mixed-effect model analysis only including trial pairs from the same conflict type. In this analysis, the primary predictor was the cross-condition difference (0 for within-Stroop condition and 1 for other within-conflict conditions). The results showed no significant cross-condition difference in either the incongruent (t = 1.22, p = .23) or the congruent (t = 1.06, p = .29) trials. Thus, we believe the evidence for different similarities is inconclusive in our data and decided not to interpret this numerical difference. We have added this note in the revised figure caption for Figure S5.
Author response image 2.
Fig. S5. The stronger conflict type similarity effect in incongruent versus congruent conditions. (A) Summary representational similarity matrices for the right 8C region in incongruent (left) and congruent (right) conditions, respectively. Each cell represents the averaged Pearson correlation of cells with the same conflict type and congruency in the 1400×1400 matrix. Note that the seemingly disparities in the values of Stroop and other within-conflict cells (i.e., the diagonal) did not reach significance for either incongruent (t = 1.22, p = .23) or congruent (t = 1.06, p = .29) trials. (2) Scatter plot showing the averaged neural similarity (Pearson correlation) as a function of conflict type similarity in both conditions. The values in both A and B are calculated from raw Pearson correlation values, in contrast to the z-scored values in Fig. 4D.
Minor:
- In the analysis of similarity_orientation, the df is very large (~14000). Here, and throughout, the df should be reflective of the population of subjects (ie be less than the sample size).
Response: The large degrees of freedom (df) in our analysis stem from the fact that we utilized a mixed-effect linear model, incorporating all data points (a total of 400×35=14000). In mixed-effect models, the df is determined by subtracting the number of fixed effects (in our case, 7) from the total number of observations. Notably, we are in line with the literature that have reported the df in this manner (e.g., Iravani et al., 2021; Schmidt & Weissman, 2015; Natraj et al., 2022).
Reference:
Iravani B, Schaefer M, Wilson DA, Arshamian A, Lundström JN. The human olfactory bulb processes odor valence representation and cues motor avoidance behavior. Proc Natl Acad Sci U S A. 2021 Oct 19;118(42):e2101209118. https://doi.org/10.1073/pnas.2101209118.
Schmidt, J.R., Weissman, D.H. Congruency sequence effects and previous response times: conflict adaptation or temporal learning?. Psychological Research 80, 590–607 (2016). https://doi.org/10.1007/s00426-015-0681-x.
Natraj, N., Silversmith, D. B., Chang, E. F., & Ganguly, K. (2022). Compartmentalized dynamics within a common multi-area mesoscale manifold represent a repertoire of human hand movements. Neuron, 110(1), 154-174. https://doi.org/10.1016/j.neuron.2021.10.002.
- it would improve the readability if there was more didactic justification for why analyses are done a certain way (eg justifying the jaccard metric). This will help less technically-savvy readers.
Response: We appreciate the reviewer’s suggestion. However, considering the Stroop/Simon-only models in our design may not be a valid approach for distinguishing the contributions of the Stroop/Simon components, we have decided not to include the Jaccard metrics in our revised manuscript.
Besides, to improve the readability, we have moved Figure S4 to the main text (labeled as Figure 7), and added the domain-general/domain-specific schematics in Figure 8.
Author response image 3.
Figure 8. Schematic of key RSMs. (A) and (B) show the orthogonality between conflict similarity and orientation RSMs. The within-subject RSMs (e.g., Group1-Group1) for conflict similarity and orientation are all the same, but the cross-group correlations (e.g., Group2-Group1) are different. Therefore, we can separate the contribution of these two effects when including them as different regressors in the same linear regression model. (C) and (D) show the two alternative models. Like the cosine model (A), within-group trial pairs resemble between-group trial pairs in these two models. The domain-specific model is an identity matrix. The domain-general model is estimated from the absolute difference of behavioral congruency effect, but scaled to 0(lowest similarity)-1(highest similarity) to aid comparison. The plotted matrices here include only one subject each from Group 1 and Group 2. Numbers 1-5 indicate the conflict type conditions, for spatial Stroop, StHSmL, StMSmM, StLSmH, and Simon, respectively. The thin lines separate four different sub-conditions, i.e., target arrow (up, down) × congruency (incongruent, congruent), within each conflict type.
Reviewer #2:
This study examines the construct of "cognitive spaces" as they relate to neural coding schemes present in response conflict tasks. The authors use a novel experimental design in which different types of response conflict (spatial Stroop, Simon) are parametrically manipulated. These conflict types are hypothesized to be encoded jointly, within an abstract "cognitive space", in which distances between task conditions depend only on the similarity of conflict types (i.e., where conditions with similar relative proportions of spatial-Stroop versus Simon conflicts are represented with similar activity patterns). Authors contrast such a representational scheme for conflict with several other conceptually distinct schemes, including a domain-general, domain-specific, and two task-specific schemes. The authors conduct a behavioral and fMRI study to test which of these coding schemes is used by prefrontal cortex. Replicating the authors' prior work, this study demonstrates that sequential behavioral adjustments (the congruency sequence effect) are modulated as a function of the similarity between conflict types. In fMRI data, univariate analyses identified activation in left prefrontal and dorsomedial frontal cortex that was modulated by the amount of Stroop or Simon conflict present, and representational similarity analyses (RSA) that identified coding of conflict similarity, as predicted under the cognitive space model, in right lateral prefrontal cortex.
This study tackles an important question regarding how distinct types of conflict might be encoded in the brain within a computationally efficient representational format. The ideas postulated by the authors are interesting ones and the statistical methods are generally rigorous.
Response: We would like to express our sincere appreciation for the reviewer’s positive evaluation of our manuscript and the constructive comments and suggestions. In response to your suggestions and concerns, we excluded the StroopOnly, SimonOnly and Stroop+Simon models, and added the schematic of domain-general/specific model RSMs. We have provided detailed responses to your comments below.
The evidence supporting the authors claims, however, is limited by confounds in the experimental design and by lack of clarity in reporting the testing of alternative hypotheses within the method and results.
- Model comparison
The authors commendably performed a model comparison within their study, in which they formalized alternative hypotheses to their cognitive space hypothesis. We greatly appreciate the motivation for this idea and think that it strengthened the manuscript. Nevertheless, some details of this model comparison were difficult for us to understand, which in turn has limited our understanding of the strength of the findings.
The text indicates the domain-general model was computed by taking the difference in congruency effects per conflict condition. Does this refer to the "absolute difference" between congruency effects? In the rest of this review, we assume that the absolute difference was indeed used, as using a signed difference would not make sense in this setting. Nevertheless, it may help readers to add this information to the text.
Response: We apologize for any confusion. The “difference” here indeed refers to the “absolute difference” between congruency effects. We have now clarified this by adding the word “absolute” accordingly.
"Therefore, we defined the domain-general matrix as the absolute difference in their congruency effects indexed by the group-averaged RT in Experiment 2."
Regarding the Stroop-Only and Simon-Only models, the motivation for using the Jaccard metric was unclear. From our reading, it seems that all of the other models --- the cognitive space model, the domain-general model, and the domain-specific model --- effectively use a Euclidean distance metric. (Although the cognitive space model is parameterized with cosine similarities, these similarity values are proportional to Euclidean distances because the points all lie on a circle. And, although the domain-general model is parameterized with absolute differences, the absolute difference is equivalent to Euclidean distance in 1D.) Given these considerations, the use of Jaccard seems to differ from the other models, in terms of parameterization, and thus potentially also in terms of underlying assumptions. Could authors help us understand why this distance metric was used instead of Euclidean distance? Additionally, if Jaccard must be used because this metric seems to be non-standard in the use of RSA, it would likely be helpful for many readers to give a little more explanation about how it was calculated.
Response: We believe that the Jaccard similarity measure is consistent with the Cosine similarity measure. The Jaccard similarity is calculated as the intersection divided by the union. To define the similarity of two conflicts in the Stroop-only and Simon-only models, we first project them onto the vertical or horizontal axes, respectively (as shown in Author response image 1A). The Jaccard similarity in our design is equivalent to the cosine similarity because the denominator in the Jaccard similarity is identical to the denominator in the cosine similarity (both are the radius of the circle, Author response image 1B).
However, it is important to note that a cosine similarity cannot be defined when conflicts are projected onto spatial Stroop or Simon axis simultaneously. Therefore, we used the Jaccard similarity in the previous version of our manuscript.
Author response image 4.
Definition of Jaccard similarity. A) Two conflicts (1 and 2) are projected onto the spatial Stroop/Simon axis in the Stroop/Simon-only model, respectively. The Jaccard similarity for Stroop-only and Simon-only model are
and respectively. Letters a-d are the projected vectors from the two conflicts to the two axes. Blue and red colors indicate the conflict conditions. Shorter vectors are the intersection and longer vectors are the union. B) According to the cosine similarity model, the similarity is defined as , where e is the projected vector from conflict 1 to conflict 2, and g is the vector of conflict 1. The Jaccard similarity for this case is defined by , where f is the projector vector from conflict 2 to itself. Because f = g in our design, the Jaccard similarity is equivalent to the cosine similarity.However, we agree with the reviewer’s and other reviewers’ concern that the correlation between spatial Stroop and Simon conflicts makes it less likely to distinguish the Stroop+Simon from cosine similarity models. While distinguishing them is essential to understand the detailed geometry of the cognitive space, it is beyond our major purpose, that is, to distinguish the cosine similarity model with the domain-general/specific models. Therefore, we have chosen to exclude the Stroop-only, Simon-only and Stroop+Simon models from our revised manuscript.
When considering parameterizing the Stroop-Only and Simon-Only models with Euclidean distances, one concern we had is that the joint inclusion of these models might render the cognitive space model unidentifiable due to collinearity (i.e., the sum of the Stroop-Only and Simon-Only models could be collinear with the cognitive space model). Could the authors determine whether this is the case? This issue seems to be important, as the presence of such collinearity would suggest to us that the design is incapable of discriminating those hypotheses as parameterized.
Response: We acknowledge that our design does not allow for a complete differentiation between the parallel encoding (StroopOnly+SimonOnly) model and the cognitive space model, given their high correlation (r = 0.85). However, it is important to note that the StroopOnly+SimonOnly model introduces more free parameters, making the model fitting poorer than the cognitive space model.
Additionally, the cognitive space model also shows high correlations with the StroopOnly and SimonOnly models (both rs = 0.66). It is crucial to emphasize that our study’s primary goal does not involve testing the parallel encoding hypothesis (through the StroopOnly+SimonOnly model). As a result, we have chosen to remove the model comparison results with the StroopOnly, SimonOnly and StroopOnly+SimonOnly models. Instead, the cognitive space model shows lower correlation with the purely domain-general (r = −0.16) and domain-specific (r = 0.46) models.
- Issue of uniquely identifying conflict coding
We certainly appreciate the efforts that authors have taken to address potential confounders for encoding of conflict in their original submission. We broach this question not because we wish authors to conduct additional control analyses, but because this issue seems to be central to the thesis of the manuscript and we would value reading the authors' thoughts on this issue in the discussion.
To summarize our concerns, conflict seems to be a difficult variable to isolate within aggregate neural activity, at least relative to other variables typically studied in cognitive control, such as task-set or rule coding. This is because it seems reasonable to expect that many more nuisance factors covary with conflict -- such as univariate activation, level of cortical recruitment, performance measures, arousal --- than in comparison with, for example, a well-designed rule manipulation. Controlling for some of these factors post-hoc through regression is commendable (as authors have done here), but such a method will likely be incomplete and can provide no guarantees on the false positive rate.
Relatedly, the neural correlates of conflict coding in fMRI and other aggregate measures of neural activity are likely of heterogeneous provenance, potentially including rate coding (Fu et al., 2022), temporal coding (Smith et al., 2019), modulation of coding of other more concrete variables (Ebitz et al., 2020, 10.1101/2020.03.14.991745; see also discussion and reviews of Tang et al., 2016, 10.7554/eLife.12352), or neuromodulatory effects (e.g., Aston-Jones & Cohen, 2005). Some of these origins would seem to be consistent with "explicit" coding of conflict (conflict as a representation), but others would seem to be more consistent with epiphenomenal coding of conflict (i.e., conflict as an emergent process). Again, these concerns could apply to many variables as measured via fMRI, but at the same time, they seem to be more pernicious in the case of conflict. So, if authors consider these issues to be germane, perhaps they could explicitly state in the discussion whether adopting their cognitive space perspective implies a particular stance on these issues, how they interpret their results with respect to these issues, and if relevant, qualify their conclusions with uncertainty on these issues.
Response: We appreciate the reviewer’s insightful comments regarding the representation and process of conflict.
First, we agree that the conflict is not simply a pure feature like a stimulus but often arises from the interaction (e.g., dimension overlap) between two or more aspects. For example, in the manual Stroop, conflict emerges from the inconsistent semantic information between color naming and word reading. Similarly, other higher-order cognitive processes such as task-set also underlie the relationship between concrete aspects. For instance, in a face/house categorization task, the taskset is the association between face/house and the responses. When studying these higher-order processes, it is often impossible to completely isolate them from bottomup features. Therefore, methods like the representational similarity analysis and regression models are among the limited tools available to attempt to dissociate these concrete factors from conflict representation. While not perfect, this approach has been suggested and utilized in practice (Freund et al., 2021).
Second, we agree that conflict can be both a representation and an emerging process. These two perspectives are not necessarily contradictory. According to David Marr’s influential three-level theory (Marr, 1982), representation is the algorithm of the process to achieve a goal based on the input. Therefore, a representation can refer to not only a static stimulus (e.g., the visual representation of an image), but also a dynamic process. Building on this perspective, we posit that the representation of cognitive control consists of an array of dynamic representations embedded within the overall process. A similar idea has been proposed that the abstract task profiles can be progressively constructed as a representation in our brain (Kikumoto & Mayr, 2020).
We have incorporated this discussion into the manuscript:
"Recently an interesting debate has arisen concerning whether cognitive control should be considered as a process or a representation (Freund, Etzel, et al., 2021). Traditionally, cognitive control has been predominantly viewed as a process. However, the study of its representation has gained more and more attention. While it may not be as straightforward as the visual representation (e.g., creating a mental image from a real image in the visual area), cognitive control can have its own form of representation. An influential theory, Marr’s (1982) three-level model proposed that representation serves as the algorithm of the process to achieve a goal based on the input. In other words, representation can encompass a dynamic process rather than being limited to static stimuli. Building on this perspective, we posit that the representation of cognitive control consists of an array of dynamic representations embedded within the overall process. A similar idea has been proposed that the representation of task profiles can be progressively constructed with time in the brain (Kikumoto & Mayr, 2020)."
Reference:
Freund, M. C., Etzel, J. A., & Braver, T. S. (2021). Neural Coding of Cognitive Control: The Representational Similarity Analysis Approach. Trends in Cognitive Sciences, 25(7), 622-638. https://doi.org/10.1016/j.tics.2021.03.011
Marr, D. C. (1982). Vision: A computational investigation into human representation and information processing. New York: W.H. Freeman.
Kikumoto A, Mayr U. (2020). Conjunctive representations that integrate stimuli, responses, and rules are critical for action selection. Proceedings of the National Academy of Sciences, 117(19):10603-10608. https://doi.org/10.1073/pnas.1922166117.
- Interpretation of measured geometry in 8C
We appreciate the inclusion of the measured similarity matrices of area 8C, the key area the results focus on, to the supplemental, as this allows for a relatively model-agnostic look at a portion of the data. Interestingly, the measured similarity matrix seems to mismatch the cognitive space model in a potentially substantive way. Although the model predicts that the "pure" Stroop and Simon conditions will have maximal self-similarity (i.e., the Stroop-Stroop and Simon-Simon cells on the diagonal), these correlations actually seem to be the lowest, by what appears to be a substantial margin (particularly the Stroop-Stroop similarities). What should readers make of this apparent mismatch? Perhaps authors could offer their interpretation on how this mismatch could fit with their conclusions.
Response: We appreciate the reviewer for bringing this to our attention. It is essential to clarify that our conclusions were based on the significant similarity modulation effect observed in our statistical analysis using the cosine similarity model, where we did not distinguish between the within-Stroop condition and the other four withinconflict conditions (Fig. 7A). This means that the representation of conflict type was not biased by the seemingly disparities in the values shown here. Moreover, to specifically address the potential differences between the within-Stroop condition and the other within-conflict conditions, we conducted a mixed-effect model. In this analysis, the primary predictor was the cross-condition difference (0 for within-Stroop condition and 1 for other within-conflict conditions). The results showed no significant cross-condition difference in either the incongruent trials (t = 1.22, p = .23) or the congruent (t = 1.06, p = .29) trials. Thus, we believe the evidence for different similarities is inconclusive in our data and decided not to interpret this numerical difference.
We have added this note in the revised figure caption for Figure S5.
Author response image 5.
Fig. S5. The stronger conflict type similarity effect in incongruent versus congruent conditions. (A) Summary representational similarity matrices for the right 8C region in incongruent (left) and congruent (right) conditions, respectively. Each cell represents the averaged Pearson correlation of cells with the same conflict type and congruency in the 1400×1400 matrix. Note that the seemingly disparities in the values of Stroop and other within-conflict cells (i.e., the diagonal) did not reach significance for either incongruent (t = 1.22, p = .23) or congruent (t = 1.06, p = .29) trials. (2) Scatter plot showing the averaged neural similarity (Pearson correlation) as a function of conflict type similarity in both conditions. The values in both A and B are calculated from raw Pearson correlation values, in contrast to the z-scored values in Fig. 4D.
- It would likely improve clarity if all of the competing models were displayed as summarized RSA matrices in a single figure, similar to (or perhaps combined with) Figure 7.
Response: We appreciate the reviewer’s suggestion. We now have incorporated the domain-general and domain-specific models into the Figure 7 (now Figure 8).
Author response image 6.
Figure 8. Schematic of key RSMs. (A) and (B) show the orthogonality between conflict similarity and orientation RSMs. The within-subject RSMs (e.g., Group1-Group1) for conflict similarity and orientation are all the same, but the cross-group correlations (e.g., Group2-Group1) are different. Therefore, we can separate the contribution of these two effects when including them as different regressors in the same linear regression model. (C) and (D) show the two alternative models. Like the cosine model (A), within-group trial pairs resemble between-group trial pairs in these two models. The domain-specific model is an identity matrix. The domain-general model is estimated from the absolute difference of behavioral congruency effect, but scaled to 0(lowest similarity)-1(highest similarity) to aid comparison. The plotted matrices here include only one subject each from Group 1 and Group 2. Numbers 1-5 indicate the conflict type conditions, for spatial Stroop, StHSmL, StMSmM, StLSmH, and Simon, respectively. The thin lines separate four different sub-conditions, i.e., target arrow (up, down) × congruency (incongruent, congruent), within each conflict type.
- Because this model comparison is key to the main inferences in the study, it might also be helpful for most readers to move all of these RSA model matrices to the main text, instead of in the supplemental.
Response: We thank the reviewer for this suggestion. We have moved the Fig. S4 to the main text, labeled as the new Figure 7.
- It may be worthwhile to check how robust the observed brain-behavior association (Fig 4C) is to the exclusion of the two datapoints with the lowest neural representation strength measure, as these points look like they have high leverage.
Response: We calculated the Pearson correlation after excluding the two points and found it does not affect the results too much, with the r = 0.50, p = .003 (compared to the original r = 0.52, p = .001).
Additionally, we found the two axes were mistakenly shifted in Fig 4C. Therefore, we corrected this error in the revised manuscript. The correlation results would not be influenced.
Author response image 7.
Fig. 4. The conflict type effect. (A) Brain regions surviving the Bonferroni correction (p < 0.0001) across the regions (criterion 1). Labeled regions are those meeting the criterion 2. (B) Different encoding of conflict type in the incongruent with congruent conditions. * Bonferroni corrected p < .05. (C) The brain-behavior correlation of the right 8C (criterion 3). The x-axis shows the beta coefficient of the conflict type effect from the RSA, and the y-axis shows the beta coefficient obtained from the behavioral linear model using the conflict similarity to predict the CSE in Experiment 2. (D) Illustration of the different encoding strength of conflict type similarity in incongruent versus congruent conditions of right 8C. The y-axis is derived from the z-scored Pearson correlation coefficient, consistent with the RSA methodology. See Fig. S4B for a plot with the raw Pearson correlation measurement. l = left; r = right.
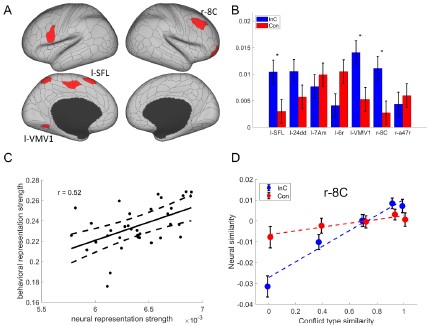
Reviewer #3:
Yang and colleagues investigated whether information on two task-irrelevant features that induce response conflict is represented in a common cognitive space. To test this, the authors used a task that combines the spatial Stroop conflict and the Simon effect. This task reliably produces a beautiful graded congruency sequence effect (CSE), where the cost of congruency is reduced after incongruent trials. The authors measured fMRI to identify brain regions that represent the graded similarity of conflict types, the congruency of responses, and the visual features that induce conflicts. They applied univariate, multivariate, and connectivity analyses to fMRI data to identify brain regions that represent the graded similarity of conflict types, the congruency of responses, and the visual features that induce conflicts. They further directly assessed the dimensionality of represented conflict space.
The authors identified the right dlPFC (right 8C), which shows 1) stronger encoding of graded similarity of conflicts in incongruent trials and 2) a positive correlation between the strength of conflict similarity type and the CSE on behavior. The dlPFC has been shown to be important for cognitive control tasks. As the dlPFC did not show a univariate parametric modulation based on the higher or lower component of one type of conflict (e.g., having more spatial Stroop conflict or less Simon conflict), it implies that dissimilarity of conflicts is represented by a linear increase or decrease of neural responses. Therefore, the similarity of conflict is represented in multivariate neural responses that combine two sources of conflict.
The strength of the current approach lies in the clear effect of parametric modulation of conflict similarity across different conflict types. The authors employed a clever cross-subject RSA that counterbalanced and isolated the targeted effect of conflict similarity, decorrelating orientation similarity of stimulus positions that would otherwise be correlated with conflict similarity. A pattern of neural response seems to exist that maps different types of conflict, where each type is defined by the parametric gradation of the yoked spatial Stroop conflict and the Simon conflict on a similarity scale. The similarity of patterns increases in incongruent trials and is correlated with CSE modulation of behavior.
The main significance of the paper lies in the evidence supporting the use of an organized "cognitive space" to represent conflict information as a general control strategy. The authors thoroughly test this idea using multiple approaches and provide convincing support for their findings. However, the universality of this cognitive strategy remains an open question.
(Public Reviews) Taken together, this study presents an exciting possibility that information requiring high levels of cognitive control could be flexibly mapped into cognitive map-like representations that both benefit and bias our behavior. Further characterization of the representational geometry and generalization of the current results look promising ways to understand representations for cognitive control.
Response: We would like to thank the reviewer for the positive evaluation of our manuscript and for providing constructive comments. In response to your suggestions, we have acknowledged the potential limitation of the design and the cross-subject RSA approach, and incorporated the open questions to the discussions. Please find our detailed responses below.
The task presented in the study involved two sources of conflict information through a single salient visual input, which might have encouraged the utilization of a common space.
Response: We agree that the unified visual input in our design may have facilitated the utilization of a common space. However, we believe the stimuli are not necessarily unified in the construction of the common space. To further test the potential interaction between the concrete stimulus setting and the cognitive space representation, it is necessary to use varied stimuli in future research. We have left this as an open question in the discussion:
Can we effectively map any sources of conflict with completely different stimuli into a single space?
The similarity space was analyzed at the level of between-individuals (i.e., crosssubject RSA) to mitigate potential confounds in the design, such as congruency and the orientation of stimulus positions. This approach makes it challenging to establish a direct link between the quality of conflict space representation and the patterns of behavioral adaptations within individuals.
Response: By setting the variables as random effects at the subject level, we have extracted the individual effects that incorporate both the group-level fixed effects and individual-level random effects. We believe this approach yields results that are as reliable, if not more, than effects calculated from individual data only. First, the mixed effect linear (LME) model has included all the individual data, forming the basis for establishing random effects. Therefore, the individual effects derived from this approach inherently reflect the individual-specific effects. To support this notion, we have included a simulation script (accessible in the online file “simulation_LME.mlx” at https://osf.io/rcq8w) to demonstrate the strong consistency between the two approaches (see Author response image 8). In this simulation, we generated random data (Y) for 35 subjects, each containing 20 repeated measurements across 5 conditions. To streamline the simulation, we only included one predictor (X), which was treated as both fixed and random effects at the subject level. We applied two methods to calculate the individual beta coefficient. The first involved extracting individual beta coefficients from the LME model by summing the fixed effect with the subject-specific random effect. The second method was entailed conducting a regression analysis using data from each subject to obtain the slope. We tested their consistency by calculating the Pearson correlation between the derived beta coefficients. This simulation was repeated 100 times.
Author response image 8.
The consistent individual beta coefficients between the mixed effect model and the individual regression analysis. A) The distribution of Pearson correlation between the two methods for 100 times. B) An example from the simulation showing the highly correlated results from the two methods. Each data point indicates a subject (n=35).
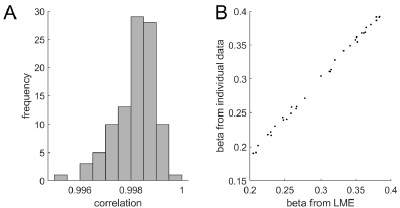
Second, the potential difference between the two methods lies in that the LME model have also taken the group-level variance into account, such as the dissociable variances of the conflict similarity and orientation across subject groups. This enabled us to extract relatively cleaner conflict similarity effects for each subject, which we believe can be better linked to the individual behavioral adaptations. Moreover, we have extracted the behavioral adaptations scores (i.e., the similarity modulation effect on CSE) using a similar LME approach. Conducting behavioral analysis solely using individual data would have been less reliable, given the limited sample size of individual data (~32 points per subject). This also motivated us to maintain consistency by extracting individual neural effects using LME models.
Furthermore, it remains unclear at which cognitive stages during response selection such a unified space is recruited. Can we effectively map any sources of conflict into a single scale? Is this unified space adaptively adjusted within the same brain region? Additionally, does the amount of conflict solely define the dimensions of this unified space across many conflict-inducing tasks? These questions remain open for future studies to address.
Response: We appreciate the reviewer’s constructive open questions. We respond to each of them based on our current understanding.
- It remains unclear at which cognitive stages during response selection such a unified space is recruited.
We anticipate that the cognitive space is recruited to guide the transference of behavioral CSE at two critical stages. The first stage involves the evaluation of control demands, where the representational distance/similarity between previous and current trials influences the adjustment of cognitive control. The second stage pertains to is control execution, where the switch from one control state to another follows a path within the cognitive space. It is worth noting that future studies aiming to address this question may benefit from methodologies with higher temporal resolutions, such as EEG and MEG, to provide more precise insights into the temporal dynamics of the process of cognitive space recruitment.
- Can we effectively map any sources of conflict into a single scale?
It is possible that various sources of conflict can be mapped onto the same space based on their similarity, even if finding such an operational defined similarity may be challenging. However, our results may offer an approach to infer the similarity between two conflicts. One way is to examine their congruency sequence effect (CSE), with a stronger CSE suggesting greater similarity. The other way is to test their representational similarity within the dorsolateral prefrontal cortex.
Is this unified space adaptively adjusted within the same brain region? We do not have an answer to this question. We showed that the cognitive space does not change with time (Note. S3). What have adjusted is the control demand to resolve the quickly changing conflict conditions from trial to trial. Though, it is an interesting question whether the cognitive space may be altered, for example, when the mental state changes significantly. And if yes, we can further test whether the change of cognitive space is also within the right dlPFC.
Additionally, does the amount of conflict solely define the dimensions of this unified space across many conflict-inducing tasks?
Our understanding of this comment is that the amount of conflict refers to the number of conflict sources. Based on our current finding, the dimensions of the space are indeed defined by how many different conflict sources are included. However, this would require the different conflict sources are orthogonal. If some sources share some aspects, the cognitive space may collapse to a lower dimension. We have incorporated the first question into the discussion:
Moreover, we anticipate that the representation of cognitive space is most prominently involved at two critical stages to guide the transference of behavioral CSE. The first stage involves the evaluation of control demands, where the representational distance/similarity between previous and current trials influences the adjustment of cognitive control. The second stage pertains to control execution, where the switch from one control state to another follows a path within the cognitive space. However, we were unable to fully distinguish between these two stages due to the low temporal resolution of fMRI signals in our study. Future research seeking to delve deeper into this question may benefit from methodologies with higher temporal resolutions, such as EEG and MEG.
We have included the other questions into the manuscript as open questions, calling for future research.
Several interesting questions remains to be answered. For example, is the dimension of the unified space across conflict-inducing tasks solely determined by the number of conflict sources? Can we effectively map any sources of conflict with completely different stimuli into a single space? Is the cognitive space geometry modulated by the mental state? If yes, what brain regions mediate the change of cognitive space?
Minor comments:
- The original comment about out-of-sample predictions to examine the continuity of the space was a suggestion for testing neural representations, not behavior (I apologize for the lack of clarity). Given the low dimensionality of the conflict space shown by the participation ratio, we expect that linear separability exists only among specific combinations of conditions. For example, the pair of conflicts 1 and 5 together is not linearly separable from conflicts 2 and 3. But combined with other results, this is already implied.
Response: We apologize for the misunderstanding. In fact, performing a prediction analysis using the extensive RSM in our study does presents certain challenges, primarily due to its substantial size (1400x1400) and the intricate nature of the mixed-effect linear model. In our efforts to simplify the prediction process by excluding random effects, we did observe a correlation between the predicted and original values, albeit a relatively small Pearson correlation coefficient of r = 0.024, p < .001. This small correlation can be attributed to two key factors. First, the exclusion of data points impacts not only the conflict similarity regressor but also other regressors within the model, thereby diminishing the predictive power. Secondly, the large amount of data points in the model heightens the risk of overfitting, subsequently reducing the model’s capacity for generalization and increasing the likelihood of unreliable predictions. Given these potential problems, we have opted not to include this prediction in the revised manuscript.
-
eLife assessment
Yang et al. investigate whether distinct sources of conflict are represented in a common cognitive space. The study uses an interesting task that mixes different sources of difficulty and reports that the brain appears to represent these sources as a mixture on a continuum in prefrontal areas. While the findings could be valuable to theory in this area, there are concerns with the analysis, design and results, that raise uncertainty regarding the main conclusion of a shared cognitive space. Thus, the evidence reported here ranges from solid to incomplete.
-
Reviewer #1 (Public Review):
People can perform a wide variety of different tasks, and a long-standing question in cognitive neuroscience is how the properties of different tasks are represented in the brain. The authors develop an interesting task that mixes two different sources of difficulty, and find that the brain appears to represent this mixture on a continuum, in the prefrontal areas involved in resolving task difficulty. While these results are interesting and in several ways compelling, they overlap with previous findings and rely on novel statistical analyses that may require further validation.
Strengths
1. The authors present an interesting and novel task for combining the contributions of stimulus-stimulus and stimulus-response conflict. While this mixture has been measured in the multi-source interference task (MSIT), …Reviewer #1 (Public Review):
People can perform a wide variety of different tasks, and a long-standing question in cognitive neuroscience is how the properties of different tasks are represented in the brain. The authors develop an interesting task that mixes two different sources of difficulty, and find that the brain appears to represent this mixture on a continuum, in the prefrontal areas involved in resolving task difficulty. While these results are interesting and in several ways compelling, they overlap with previous findings and rely on novel statistical analyses that may require further validation.
Strengths
1. The authors present an interesting and novel task for combining the contributions of stimulus-stimulus and stimulus-response conflict. While this mixture has been measured in the multi-source interference task (MSIT), this task provides a more graded mixture between these two sources of difficulty.2. The authors do a good job triangulating regions that encoding conflict similarity, looking for the conjunction across several different measures of conflict encoding. These conflict measures use several best-practice approaches towards estimating representational similarity.
3. The authors quantify several salient alternative hypothesis, and systematically distinguish their core results from these alternatives.
4. The question that the authors tackle is important to cognitive control, and they make a solid contribution.
Concerns
1. The framing of 'infinite possible types of conflict' feels like a strawman. While they might be true across stimuli (which may motivate a feature-based account of control), the authors explore the interpolation between two stimuli. Instead, this work provides confirmatory evidence that task difficulty is represented parametrically (e.g., consistent with literatures like n-back, multiple object tracking, and random dot motion). This parametric encoding is standard in feature-based attention, and it's not clear what the cognitive map framing is contributing.2. The representations within DLPFC appear to treat 100% Stoop and (to a lesser extent) 100% Simon differently than mixed trials. Within mixed trials, the RDM within this region don't strongly match the predictions of the conflict similarity model. It appears that there may be a more complex relationship encoded in this region.
3. To orthogonalized their variables, the authors need to employ a complex linear mixed effects analysis, with a potential influence of implementation details (e.g., high-level interactions and inflated degrees of freedom).
-
Reviewer #2 (Public Review):
Summary
This study examines the construct of "cognitive spaces" as they relate to neural coding schemes present in response conflict tasks. The authors use a novel experimental design in which different types of response conflict (spatial Stroop, Simon) are parametrically manipulated. These conflict types are hypothesized to be encoded jointly, within an abstract "cognitive space", in which distances between task conditions depend only on the similarity of conflict types (i.e., where conditions with similar relative proportions of spatial-Stroop versus Simon conflicts are represented with similar activity patterns). Authors contrast such a representational scheme for conflict with several other conceptually distinct schemes, including a domain-general, domain-specific, and two task-specific schemes. The …Reviewer #2 (Public Review):
Summary
This study examines the construct of "cognitive spaces" as they relate to neural coding schemes present in response conflict tasks. The authors use a novel experimental design in which different types of response conflict (spatial Stroop, Simon) are parametrically manipulated. These conflict types are hypothesized to be encoded jointly, within an abstract "cognitive space", in which distances between task conditions depend only on the similarity of conflict types (i.e., where conditions with similar relative proportions of spatial-Stroop versus Simon conflicts are represented with similar activity patterns). Authors contrast such a representational scheme for conflict with several other conceptually distinct schemes, including a domain-general, domain-specific, and two task-specific schemes. The authors conduct a behavioral and fMRI study to test whether prefrontal cortex activity is correlated to one of these coding schemes. Replicating the authors' prior work, this study demonstrates that sequential behavioral adjustments (the congruency sequence effect) are modulated as a function of the similarity between conflict types. In fMRI data, univariate analyses identified activation in left prefrontal and dorsomedial frontal cortex that was modulated by the amount of Stroop or Simon conflict present, and representational similarity analyses that identified coding of conflict similarity, as predicted under the cognitive space model, in right lateral prefrontal cortex.Strengths
This study addresses an important question regarding how conflict or difficulty might be encoded in the brain within a computationally efficient representational format. Relative to the other models reported in the paper, the evidence in support of the cognitive space model is solid. The ideas postulated by the authors are interesting and valuable ones, worthy of follow-up work that provides additional necessary scrutiny of the cognitive-space account.
Weaknesses
Future, within-subject experiments will be necessary to disentangle the cognitive space model from confounded task variables. A between-subjects manipulation of stimulus orientation/location renders the results difficult to interpret, as the source and spatial scale of the conflict encoding on cortex may differ from more rigorous (and more typical) within-subject manipulations.
Results are also difficult to interpret because Stroop and Simon conflict are confounded with each other. For interpretability, these two sources of conflict need to be manipulated orthogonally, so that each source of conflict (as well as their interaction) could be separately estimated and compared in terms of neural encoding. For example, it is therefore not clear whether the RSA results are due to encoding of only one type of conflict (Stroop or Simon), to a combination of both, and/or to interactive effects.
Finally, the motivation for the use of the term "cognitive space" to describe results is unclear. Evidence for the mere presence of a graded/parametric neural encoding (i.e., the reported conflict RSA effects) would not seem to be sufficient. Indeed, it is discussed in the manuscript that cognitive spaces/maps allow for flexibility through inference and generalization. Future work should therefore focus on linking neural conflict encoding to inference and generalization more directly.
-
-
Author Response
The following is the authors’ response to the original reviews.
Reviewer #1:
People can perform a wide variety of different tasks, and a long-standing question in cognitive neuroscience is how the properties of different tasks are represented in the brain. The authors develop an interesting task that mixes two different sources of difficulty, and find that the brain appears to represent this mixture on a continuum, in the prefrontal areas involved in resolving task difficulty. While these results are interesting and in several ways compelling, they overlap with previous findings and rely on novel statistical analyses that may require further validation.
Strengths
- The authors present an interesting and novel task for combining the contributions of stimulus-stimulus and stimulus-response conflict. While this mixture …
Author Response
The following is the authors’ response to the original reviews.
Reviewer #1:
People can perform a wide variety of different tasks, and a long-standing question in cognitive neuroscience is how the properties of different tasks are represented in the brain. The authors develop an interesting task that mixes two different sources of difficulty, and find that the brain appears to represent this mixture on a continuum, in the prefrontal areas involved in resolving task difficulty. While these results are interesting and in several ways compelling, they overlap with previous findings and rely on novel statistical analyses that may require further validation.
Strengths
- The authors present an interesting and novel task for combining the contributions of stimulus-stimulus and stimulus-response conflict. While this mixture has been measured in the multi-source interference task (MSIT), this task provides a more graded mixture between these two sources of difficulty
- The authors do a good job triangulating regions that encoding conflict similarity, looking for the conjunction across several different measures of conflict encoding
- The authors quantify several salient alternative hypothesis and systematically distinguish their core results from these alternatives
- The question that the authors tackle is of central theoretical importance to cognitive control, and they make an interesting an interesting contribution to this question
We would like to thank the reviewer for the positive evaluation of our manuscript and the constructive comments and suggestions. Your feedback has been invaluable in our efforts to enhance the accessibility of our manuscript and strengthen our findings. In response to your suggestion, we reanalyzed our data using the approach proposed by Chen et al.’s (2017, NeuroImage) and applied stricter multiple comparison correction thresholds in our reporting. This reanalysis largely replicated our previous results, thereby reinforcing the robustness of our findings. We also have examined several alternative models and results supported the integration of the spatial Stroop and Simon conflicts within the cognitive space. In addition, we enriched the theoretical framework of our manuscript by connecting the cognitive space with other important theories such as the “Expected Value of Control” theory. We have incorporated your feedback, revisions and additional analyses into the manuscript. As a result, we firmly believe that these changes have significantly improved the quality of our work. We have provided detailed responses to your comments below.
- It's not entirely clear what the current task can measure that is not known from the MSIT, such as the additive influence of conflict sources in Fu et al. (2022), Science. More could be done to distinguish the benefits of this task from MSIT.
We agree that the MSIT task incorporates Simon and Eriksen Flanker conflict tasks and can efficiently detect the additivity of conflict effects across orthogonal tasks. Like the MSIT, our task incorporates Simon with spatial Stroop conflicts and can test the same idea. For example, a previous study from our lab (Li et al., 2014) used the combined spatial Stroop-Simon condition with the arrows displayed on diagonal corners and found evidence for the additive hypothesis. However, the MSIT cannot be used to test whether/how different conflicts are parametrically represented in a low-dimensional space, a question that is important to address the debate of domain-general and domain-specific cognitive control.
To this end, our current study adopted the spatial Stroop-Simon task for the unique purpose of parametrically modulating conflict similarity. As far as we know, there is no way to define the similarity between the combined Simon_Flanker conflict condition and the Simon/Flanker conditions in the MSIT. In contrast, with the spatial Stroop-Simon paradigm, we can define the similarity with the cosine of the angle difference across the two conditions in question.
We have added the following texts in the discussion part to emphasize the 51 difference between our paradigm and other studies.
"The use of an experimental paradigm that permits parametric manipulation of conflict similarity provides a way to systematically investigate the organization of cognitive control, as well as its influence on adaptive behaviors. This approach extends traditional paradigms, such as the multi-source interference task (Fu et al., 2022), color Stroop-Simon task (Liu et al., 2010) and similar paradigms that do not afford a quantifiable metric of conflict source similarity."
References:
Li, Q., Nan, W., Wang, K., & Liu, X. (2014). Independent processing of stimulus-stimulus and stimulus-response conflicts. PloS One, 9(2), e89249.
- The evidence from this previous work for mixtures between different conflict sources make the framing of 'infinite possible types of conflict' feel like a strawman. The authors cite classic work (e.g., Kornblum et al., 1990) that develops a typology for conflict which is far from infinite, and I think few people would argue that every possible source of difficulty will have to be learned separately. Such an issue is addressed in theories like 'Expected Value of Control', where optimization of control policies can address unique combinations of task demands.
The notion that there might be infinite conflicts arises when we consider the quantitative feature of cognitive control. If each combination of the Stroop-Simon combination is regarded as a conflict condition, there would be infinite combinations, and it is our major goal to investigate how these infinite conflict conditions are represented effectively in a space with finite dimensions. We agree that it is unnecessary to dissociate each of these conflict conditions into a unique conflict type, since they may not differ substantially. However, we argue that understanding variant conflicts within a purely categorical framework (e.g., Simon and Flanker conflict in MSIT) is insufficient, especially because it leads to dichotomic conclusions that do not capture how combinations of conflicts are organized in the brain, as our study addresses.
There could be different perspectives on how our cognitive control system flexibly encodes and resolves multiple conflicts. The cognitive space assumption we held provides a principle by which we can represent multiple conflicts in a lower dimensional space efficiently. While the “Expected Value of Control” theory addresses when and how much cognitive control to apply based on control demand, the “cognitive space” view seeks to explain how the conflict, which defines cognitive control demand, is encoded in the brain. Thus, we argue that these two lines of work are different yet complementary. The geometry of cognitive space of conflict can benefit the adjustment of cognitive control for upcoming conflicts. For example, our brain may evaluate the similarity/distance (and thus cost) between the consecutive conflict conditions, and selects the path with best cost-benefit tradeoff to switch from one state to another. This idea is conceptually similar to a recent study by Grahek et al. (2022) demonstrating that more frequently switching states were encoded as closer together than less frequently switching states in a “drift-threshold” space.
Nevertheless, Grahek et al (2022) investigated how cognitive control changes based on the expected value of control theory within the same conflict, whereas our study aims to examine organization of different conflict.
We have added the implications of cognitive space view in the discussion to indicate the potential values of our finding to understand the EVC account and the difference between the two theories.
“Previous researchers have proposed an “expected value of control (EVC)” theory, which posits that the brain can evaluate the cost and benefit associated with executing control for a demanding task, such as the conflict task, and specify the optimal control strength (Shenhav et al., 2013). For instance, Grahek et al. (2022) found that more frequently switching goals when doing a Stroop task were achieved by adjusting smaller control intensity. Our work complements the EVC theory by further investigating the neural representation of different conflict conditions and how these representations can be evaluated to facilitate conflict resolution. We found that different conflict conditions can be efficiently represented in a cognitive space encoded by the right dlPFC, and participants with stronger cognitive space representation have also adjusted their conflict control to a greater extent based on the conflict similarity (Fig 4C). The finding suggests that the cognitive space organization of conflicts guides cognitive control to adjust behavior. Previous studies have shown that participants may adopt different strategies to represent a task, with the model-based strategies benefitting goal-related behaviors more than the model-free strategies (Rmus et al., 2022). Similarly, we propose that cognitive space could serve as a mental model to assist fast learning and efficient organization of cognitive control settings. Specifically, the cognitive space representation may provide a principle for how our brain evaluates the expected cost of switching and the benefit of generalization between states and selects the path with the best cost-benefit tradeoff (Abrahamse et al., 2016; Shenhav et al., 2013). The proximity between two states in cognitive space could reflect both the expected cognitive demand required to transition and the useful mechanisms to adapt from. The closer the two conditions are in cognitive space, the lower the expected switching cost and the higher the generalizability when transitioning between them. With the organization of a cognitive space, a new conflict can be quickly assigned a location in the cognitive space, which will facilitate the development of cognitive control settings for this conflict by interpolating nearby conflicts and/or projecting the location to axes representing different cognitive control processes, thus leading to a stronger CSE when following a more similar conflict condition. On the other hand, without a cognitive space, there would be no measure of similarity between conflicts on different trials, hence limiting the ability of fast learning of cognitive control setting from similar trials.”
Reference:
Grahek, I., Leng, X., Fahey, M. P., Yee, D., & Shenhav, A. Empirical and Computational Evidence for Reconfiguration Costs During Within-Task Adjustments in Cognitive Control. CogSci.
- Wouldn't a region that represented each conflict source separately still show the same pattern of results? The degree of Stroop vs Simon conflict is perfectly negatively correlated across conditions, so wouldn't a region that just tracks Stoop conflict show these RSA patterns? The authors show that overall congruency is not represented in DLPFC (which is surprising), but they don't break it down by whether this is due to Stroop or Simon congruency (I'm not sure their task allows for this).
To estimate the unique contributions of the spatial Stroop and Simon conflicts, we performed a model-comparison analysis. We constructed a Stroop-Only model and a Simon-Only model, with each conflict type projected onto the Stroop (vertical) axis or Simon (horizontal) axis, respectively. The similarity between any two conflict types was defined using the Jaccard similarity index (Jaccard, P., 1901), that is, their intersection divided by their union. By replacing the cognitive spacebased conflict similarity regressor with the Stroop-Only and Simon-Only regressors, we calculated their BICs. Results showed that the BIC was larger for Stroop-Only (5377122) and Simon-Only (5377096) than for the Cognitive-Space model (5377094). An additional Stroop+Simon model, including both Stroop-Only and Simon-Only regressors, also showed a poorer model fitting (BIC = 5377118) than the Cognitive-Space model. Considering that the pattern of conflict representations is more manifested when the conflict is present (i.e., on incongruent trials) than not (i.e., on congruent trials), we also conducted the model comparison using the incongruent trials only. Results showed that Stroop-Only (1344128), Simon-Only (1344120), and Stroop+Simon (1344157) models all showed higher BIC values than the CognitiveSpace model (1344104). These results indicate that the right 8C encodes an integrated cognitive space for resolving Stroop and Simon conflicts. Therefore, we believe the cognitive space has incorporated both dimensions. We added these additional analyses and results to the revised manuscript.
“To examine if the right 8C specifically encodes the cognitive space rather than the domain-general or domain-specific organizations, we tested several additional models (see Methods). Model comparison showed a lower BIC in the Cognitive-Space model (BIC = 5377094) than the Domain-General (BIC = 537127) or Domain-Specific (BIC = 537127) models. Further analysis showed the dimensionality of the representation in the right 8C was 1.19, suggesting the cognitive space was close to 1D. We also tested if the observed conflict similarity effect was driven solely by spatial Stroop or Simon conflicts, and found larger BICs for the models only including the Stroop similarity (i.e., the Stroop-Only model, BIC = 5377122) or Simon similarity (i.e., the Simon-Only model, BIC = 5377096). An additional Stroop+Simon model, including both StroopOnly and Simon-Only regressors, also showed a worse model fitting (BIC = 5377118). Moreover, we replicated the results with only incongruent trials, considering that the pattern of conflict representations is more manifested when the conflict is present (i.e., on incongruent trials) than not (i.e., on congruent trials). We found a poorer fitting in Domain-general (BIC = 1344129), Domain-Specific (BIC = 1344129), Stroop-Only (BIC = 1344128), Simon-Only (BIC = 1344120), and Stroop+Simon (BIC = 1344157) models than the Cognitive-Space model (BIC = 1344104). These results indicate that the right 8C encodes an integrated cognitive space for resolving Stroop and Simon conflicts. The more detailed model comparison results are listed in Table 2.”
We reason that we did not observe an overall congruency effect in the RSA results is because our definition of congruency here differed from traditional definitions (i.e., contrast between incongruent and congruent conditions). In the congruency regressor of our RSA model, we defined representational similarity as 1 if calculated between two incongruent, or two congruent trials, and 0 if between incongruent and congruent trials. Thus, our definition of the congruency regressor reflects whether multivariate patterns differ between incongruent and congruent trials, rather than whether activity strengths differ. Indeed, we did observe the latter form of congruency effects, with stronger univariate activities in pre-SMA for incongruent versus congruent conditions. We have added this in the Note S6 (“The multivariate representations of conflict type and orientation are different from the congruency effect”):
“Neither did we observe a multivariate congruency effect (i.e., the pattern difference between incongruent and congruent conditions compared to that within each condition) in the right 8C or any other regions. Note the definition of congruency here differed from traditional definitions (i.e., contrast between activity strength of incongruent and congruent conditions), with which we found stronger univariate activities in pre-SMA for incongruent versus congruent conditions.”
We could not determine whether the null effect of the congruency regressor was due to Stroop or Simon congruency alone, because congruency levels of the two types always covary. On all trials of the compound conditions (Conf 2-4), whenever the Stroop dimension was incongruent, the Simon dimension was also incongruent, and vice versa for the congruent condition. Thus, the contribution of spatial Stroop or Simon alone to the congruency effect could not be tested using compound conditions. Although we have pure spatial Stroop or Simon conditions, within-Stroop and withinSimon trial pairs constituted only 8% of cells in the representational similarity matrix. This was insufficient to determine whether the null congruency effect was due to solely Stroop or Simon.
Overall, with the added analysis we found that the data in the right 8C area supports conflict representations that are organized based on both Simon and spatial Stroop conflict. Although the current experimental design does not allow us to identify whether the null effect of the congruency regressor was driven by either conflict or both, we clarified that the congruency regressor did not test the 205 conventional congruency effect and the null finding does not contradict previous 206 research.
Reference:
Jaccard, P. (1901). Étude comparative de la distribution florale dans une portion des Alpes et des Jura. Bull Soc Vaudoise Sci Nat(37), 547-579.
- The authors use a novel form of RSA that concatenates patterns across conditions, runs and subjects into a giant RSA matrix, which is then used for linear mixed effects analysis. This appears to be necessary because conflict type and visual orientation are perfectly confounded within the subject (although, if I understand, the conflict type x congruence interaction wouldn't have the same concern about visual confounds, which shouldn't depend on congruence). This is an interesting approach but should be better justified, preferably with simulations validating the sensitivity and specificity of this method and comparing it to more standard methods.
The confound exists for both the conflict type and the conflict type × congruence interaction in our design, since both incongruent and congruent conditions include stimuli from the full orientation space. For example, for the spatial Stroop type, the congruent condition could be either an up arrow at the top or a down arrow at the bottom. Similarly, the incongruent condition could be either an up arrow at the bottom or a down arrow at the top. Therefore, both the congruent and incongruent conditions are perfectly confounded with the orientation.
We reanalyzed the data using the well-documented approach by Chen et al. (2017, Neuroimage), as suggested by the reviewer. The new analysis replicated our previously reported results (Fig. 4-5, S4-S7). As Chen et al (2017) has provided abundant simulations to validate this approach, we did not run any further simulations.
- A chief concern is that the same pattern contributes to many entries in the DV, which has been addressed in previous work using row-wise and column-wise random effects (Chen et al., 2017, Neuroimage). It would also be informative to know whether the results hold up to removing within-run similarity, which can bias similarity measures (Walther et al., 2016, Neuroimage).
Thank you for the comment. In our revised manuscript, we followed your suggestion and adopted the approach proposed by Chen et al. (2017). Specifically, we included both the upper and lower triangle of the representational similarity matrix (excluding the diagonal). Moreover, we also removed all the within-subject similarity (thus also excluding the within-run similarity as suggested by Walther et al. (2016)) to minimize the bias of the potentially strong within-subject similarity. In addition, we added both the row-wise and column-wise random effects to capture the dependence of cells within each column and each row, respectively (Chen et al., 2017).
Results from this approach largely replicated our previous results. The right 8C again showed significant conflict similarity representation, with greater representational strength in incongruent than congruent condition, and positively correlated to behavioral performance. The orientation effect was also identified in the visual (e.g., right V1) and oculomotor (e.g., left FEF) regions.
We have revised the methodology and the results in the revised manuscript:
"Representational similarity analysis (RSA).
For each cortical region, we calculated the Pearson’s correlations between fMRI activity patterns for each run and each subject, yielding a 1400 (20 conditions × 2 runs × 35 participants) × 1400 RSM. The correlations were calculated in a cross297 voxel manner using the fMRI activation maps obtained from GLM3 described in the previous section. We excluded within-subject cells from the RSM (thus also excluding the within-run similarity as suggested by Walther et al., (2016)), and the remaining cells were converted into a vector, which was then z-transformed and submitted to a linear mixed effect model as the dependent variable. The linear mixed effect model also included regressors of conflict similarity and orientation similarity. Importantly, conflict similarity was based on how Simon and spatial Stroop conflict are combined and hence was calculated by first rotating all subject’s stimulus location to the top right and bottom-left quadrants, whereas orientation was calculated using original stimulus locations. As a result, the regressors representing conflict similarity and orientation similarity were de-correlated. Similarity between two conditions was measured as the cosine value of the angular difference. Other regressors included a target similarity regressor (i.e., whether the arrow directions were identical), a response similarity regressor (i.e., whether the correct responses were identical); a spatial Stroop distractor regressor (i.e., vertical distance between two stimulus locations); a Simon distractor regressor (i.e., horizontal distance between two stimulus locations). Additionally, we also included a regressor denoting the similarity of Group (i.e., whether two conditions are within the same subject group, according to the stimulus-response mapping). We also added two regressors including ROI316 mean fMRI activations for each condition of the pair to remove the possible uni-voxel influence on the RSM. A last term was the intercept. To control the artefact due to dependence of the correlation pairs sharing the same subject, we included crossed random effects (i.e., row-wise and column-wise random effects) for the intercept, conflict similarity, orientation and the group factors (G. Chen et al., 2017)."
Reference:
Walther, A., Nili, H., Ejaz, N., Alink, A., Kriegeskorte, N., & Diedrichsen, J. (2016). Reliability of dissimilarity measures for multi-voxel pattern analysis. Neuroimage, 137, 188-200. doi:10.1016/j.neuroimage.2015.12.012
- Another concern is the extent to which across-subject similarity will only capture consistent patterns across people, making this analysis very similar to a traditional univariate analysis (and unlike the traditional use of RSA to capture subject-specific patterns).
With proper normalization, we assume voxels across different subjects should show some consistent localizations, although individual differences can be high. J. Chen et al. (2017) has demonstrated that consistent multi-voxel activation patterns exist across individuals. Previous studies have also successfully applied cross-subject RSA (see review by Freund et al, 2021) and cross-subject decoding approaches (e.g., Jiang et al., 2016; Tusche et al., 2016), so we believe cross-subject RSA should be feasible to capture distributed activation patterns shared at the group level. We added this argument in the revised manuscript:
"Previous studies (e.g., J. Chen et al., 2017) have demonstrated that consistent multivoxel activation patterns exist across individuals, and successful applications of cross-subject RSA (see review by Freund, Etzel, et al., 2021) and cross-subject decoding approaches (Jiang et al., 2016; Tusche et al., 2016) have also been reported."
In the revised manuscript, we also tested whether the representation in right 8C held for within-subject data. We reasoned that the conflict similarity effects identified by cross-subject RSA should be replicable in within-subject data, although the latter is not able to dissociate the conflict similarity effect from the orientation effect. We performed similar RSA for within-subject RSMs, excluding the within-run cells. We replaced the perfectly confounded factors of conflict similarity and orientation with a common factor called similarity_orientation. Other confounding factor pairs were addressed similarly. Results showed a significant effect of similarity_orientation, t(13993) = 3.270, p = .0005, 1-tailed. Given the specific representation of conflict similarity identified by the cross-subject RSA, we believe that the within-subject data of right 8C probably showed similar conflict similarity modulation effects as the cross-subject data, although future research that orthogonalizes conflict type and orientation is needed to fully answer this question. We added this result in the revised section Note S7.
"Note S7. The cross-subject RSA captures similar effects with the within-subject RSA Considering the variability in voxel-level functional localizations among individuals, one may question whether the cross-subject RSA results were biased by the consistent multi-voxel patterns across subjects, distinct from the more commonly utilized withinsubject RSA. We reasoned that the cross-subject RSA should have captured similar effects as the within-subject RSA if we observe the conflict similarity effect in right 8C with the latter analysis. Therefore, we tested whether the representation in right 8C held for within-subject data. Specifically, we performed similar RSA for withinsubject RSMs, excluding the within-run cells. We replaced the perfectly confounded factors of conflict similarity and orientation with a common factor called similarity_orientation. Other confounding factor pairs (i.e., target versus response, and Stroop distractor versus Simon distractor) were addressed similarly. Results showed a significant effect of similarity_orientation, t(13993) = 3.270, p = .0005, 1tailed. Given the specific representation of conflict similarity identified by the crosssubject RSA, the within-subject data of right 8C may show similar conflict similarity modulation effects as the cross-subject data. Further research is needed to fully dissociate the representation of conflict and the representation of visual features such as orientation."
Reference:
Chen, J., Leong, Y. C., Honey, C. J., Yong, C. H., Norman, K. A., & Hasson, U. (2017). Shared memories reveal shared structure in neural activity across individuals. Nature Neuroscience, 20(1), 115-125.
Freund, M. C., Etzel, J. A., & Braver, T. S. (2021). Neural Coding of Cognitive Control: The Representational Similarity Analysis Approach. Trends in Cognitive Sciences, 25(7), 622-638.
Jiang, J., Summerfield, C., & Egner, T. (2016). Visual Prediction Error Spreads Across Object Features in Human Visual Cortex. J Neurosci, 36(50), 12746-12763.
Tusche, A., Bockler, A., Kanske, P., Trautwein, F. M., & Singer, T. (2016). Decoding the Charitable Brain: Empathy, Perspective Taking, and Attention Shifts Differentially Predict Altruistic Giving. Journal of Neuroscience, 36(17), 4719-4732.
- Finally, the authors should confirm all their results are robust to less liberal methods of multiplicity correction. For univariate analysis, they should report the effects from the standard p < .001 cluster forming threshold for univariate analysis (or TFCE). For multivariate analyses, FDR can be quite liberal. The authors should consider whether their mixed-effects analyses allow for group-level randomization, and consider (relatively powerful) Max-Stat randomization tests (Nichols & Holmes, 2002, Hum Brain Mapp).
In our revised manuscript, we have corrected the univariate results using the probabilistic TFCE (pTFCE) approach by Spisak et al. (2019). This approach estimates the conditional probability of cluster extent based on Bayes’ rule. Specifically, we applied pTFCE on our univariate results (i.e., the z-maps of our contrasts). This returned enhanced Z-score maps, which were then thresholded based on simulated cluster size thresholds using 3dClustSim. A cluster-forming threshold of p < .001 was employed. Results showed only the pre-SMA was activated in the incongruent > congruent contrast, and right IPS and right dmPFC were activated in the linear Simon modulation effect. Further tests also showed these regions were not correlated with the behavioral performance, uncorrected ps >.28. These results largely replicated our previous results. We have revised the method and results accordingly.
Methods:
"Results were corrected with the probabilistic threshold-free cluster enhancement(pTFCE) and then thresholded by 3dClustSim function in AFNI (Cox & Hyde, 1997) with voxel-wise p < .001 and cluster-wize p < .05, both 1-tailed."
Results:
"In the fMRI analysis, we first replicated the classic congruency effect by searching for brain regions showing higher univariate activation in incongruent than congruent conditions (GLM1, see Methods). Consistent with the literature (Botvinick et al., 2004; Fu et al., 2022), this effect was observed in the pre-supplementary motor area (preSMA) (Fig. 3, Table S1). We then tested the encoding of conflict type as a cognitive space by identifying brain regions with activation levels parametrically covarying with the coordinates (i.e., axial angle relative to the horizontal axis) in the hypothesized cognitive space. As shown in Fig. 1B, change in the angle corresponds to change in spatial Stroop and Simon conflicts in opposite directions. Accordingly, we found the right inferior parietal sulcus (IPS) and the right dorsomedial prefrontal cortex (dmPFC) displayed positive correlation between fMRI activation and the Simon conflict (Fig. 3, Fig. S3, Table S1)."
We appreciate the reviewer’s suggestion to apply the Max-Stat randomization tests (Nichols & Holmes, 2002) for the multivariate analyses. However, the representational similarity matrix was too large (1400×1400) to be tested with a balanced randomization approach (i.e., the Max-Stat), due to (1) running even 1000 times for all ROIs cost very long time; (2) the distribution generated from normal times of randomization (e.g., 5000 iterations) would probably be unbalanced, since the full range of possible samples that could be generated by a complete randomization is not adequately represented. Instead, we adopted a very strict Bonferroni correction p < 0.0001/360 when reporting the regression results from RSA. Notebally, Chen et al (2017) has shown that their approach could control the FDR at an acceptable level.
Reference:
Spisák, T., Spisák, Z., Zunhammer, M., Bingel, U., Smith, S., Nichols, T., & Kincses,T. (2019). Probabilistic TFCE: A generalized combination of cluster size and voxel intensity to increase statistical power. NeuroImage, 185, 12-26.
Chen, G., Taylor, P. A., Shin, Y.-W., Reynolds, R. C., & Cox, R. W. J. N. (2017). Untangling the relatedness among correlations, Part II: Inter-subject correlation group analysis through linear mixed-effects modeling. 147, 825-840.
Minor concerns:
- I appreciate the authors wanting to present the conditions in a theory-agnostic way, but the framing of 5 conflict types was confusing. I think framing the conditions as a mixture of 2 conflict types (Stroop and Simon) makes more sense, especially given the previous work on MSIT.
We have renamed the Type1-5 as spatial Stroop, StHSmL, StMSmM, StLSmH, and Simon conditions, respectively. H, L, and M indicate high, low andmedium similarity with the corresponding conflict, respectively. This is alsoconsistent with the naming of our previous work (Yang et al., 2021).
Reference:
Yang, G., Xu, H., Li, Z., Nan, W., Wu, H., Li, Q., & Liu, X. (2021). The congruency sequence effect is modulated by the similarity of conflicts. Journal of Experimental Psychology: Learning, Memory, and Cognition, 47(10), 1705-1719.
- It would be helpful to have more scaffolding for the key conflict & orientation analyses. A schematic in the main text that outlines these contrasts would be very helpful (e.g. similar to S4).
We have inserted Figure 7 in the revised manuscript. In this figure, we plotted the schematic of the difference between the conflict similarity 467 and orientation regressors according to their cross-group representational similarity 468 matrices.
- Figure 4D could be clearer, both in labeling and figure caption. 'Modeled similarity' could be relabelled to something more informative, like 'conflict type (or mixture) similarity'. Alternatively, it would be helpful to show a summary RDM for region r-8C. For example, breaking it down by just conflict type and congruence.
We have relabeled the x-axis to “Conflict type similarity” and y-axis to “Neural similarity” for Figure 4D in the revised manuscript.
We have also added a summary RSM figure in Fig. S5 to show the different similarity patterns between incongruent and congruent conditions.
- It may be helpful to connect your work to how people have discussed multiple forms of conflict monitoring and control with respect to target and distractor features e.g., Lindsay & Jacoby, 1994, JEP:HPP; Mante, Sussillo et al., 2013, Nature; Soutschek et al., 2015, JoCN; Jackson et al., 2021, Comm Bio; Ritz & Shenhav, 2022, bioRxiv
We have added an analysis to examine how cognitive control modulates target and distractor representation. To this end, we selected the left V4, a visual region showing joint representation of target, Stroop distractor and Simon distractor, as the region of interest. We tested whether these representation strengths differed between incongruent and congruent conditions, finding the representation of target was stronger and representations of both distractors were weaker in the incongruent condition. This suggests that cognitive control modulates the stimuli in both directions. We added the results in Note S10 and Fig. S8, and also added discussion of it in “Methodological implications”.
“Note S10. Cognitive control enhances target representation and suppresses distractor representation Using the separability of confounding factors afforded by the cross-subject RSA, we examined how representations of targets and distractors are modulated by cognitive control. The key assumption is that exerting cognitive control may enhance target representation and suppress distractor representation. We hypothesized that stimuli are represented in visual areas, so we chose a visual ROI from the main RSA results showing joint representation of target, spatial Stroop distractor and Simon distractor (p < .005, 1-tail, uncorrected). Only the left V4 met this criterion. We then tested representations with models similar to the main text for incongruent only trials, congruent only trials, and the incongruent – congruent contrast. The contrast model additionally used interaction between the congruency and target, Stroop distractor and Simon distractor terms. Results showed that in the incongruent condition, when we employ more cognitive control, the target representation was enhanced (t(237990) = 2.59, p = .029, Bonferroni corrected) and both spatial Stroop (t(237990) = –4.18, p < .001, Bonferroni corrected) and Simon (t(237990) = –3.14, p = .005, Bonferroni corrected) distractor representations were suppressed (Fig. S8). These are consistent with the idea that the top-down control modulates the stimuli in both directions (Polk et al., 2008; Ritz & Shenhav, 2022).”
Discussion:
“Moreover, the cross-subject RSA provides high sensitivity to the variables of interest and the ability to separate confounding factors. For instance, in addition to dissociating conflict type from orientation, we dissociated target from response, and spatial Stroop distractor from Simon distractor. We further showed cognitive control can both enhance the target representation and suppress the distractor representation (Note S10, Fig. S8), which is in line with previous studies (Polk et al., 2008; Ritz & Shenhav, 2022)."
- For future work, I would recommend placing stimuli along the whole circumference, to orthogonalize Stroop and Simon conflict within-subject.
We thank the reviewer for this highly helpful suggestion. Expanding the 547 conflict conditions to a full conflict space and replicating our current results could 548 provide stronger evidence for the cognitive space view.
In the revised manuscript, we added this as a possible future design:
“A possible improvement to our current design would be to include left, right, up, and down arrows presented in a grid formation across four spatially separate quadrants, with each arrow mapped to its own response button. However, one potential confounding factor would be that these conditions have different levels of difficulty (i.e., different magnitude of conflict), which may affect the CSE results and their representational similarity."
Reviewer #2:
Summary, general appraisal
This study examines the construct of "cognitive spaces" as they relate to neural coding schemes present in response conflict tasks. The authors utilize a novel paradigm, in which subjects must map the direction of a vertically oriented arrow to either a left or right response. Different types of conflict (spatial Stroop, Simon) are parametrically manipulated by varying the spatial location of the arrow (a taskirrelevant feature). The vertical eccentricity of the arrow either agrees or conflicts with the arrow's direction (spatial Stroop), while the horizontal eccentricity of the arrow agrees or conflicts with the side of the response (Simon). A neural coding model is postulated in which the stimuli are embedded in a cognitive space, organized by distances that depend only on the similarity of congruency types (i.e., where conditions with similar relative proportions of spatial-Stroop versus Simon congruency are represented with similar activity patterns). The authors conduct a behavioral and fMRI study to provide evidence for such a representational coding scheme. The behavioral findings replicate the authors' prior work in demonstrating that conflict-related cognitive control adjustments (the congruency sequence effect) shows strong modulation as a function of the similarity between conflict types. With the fMRI neural activity data, the authors report univariate analyses that identified activation in left prefrontal and dorsomedial frontal cortex modulated by the amount of Stroop or Simon conflict present, and multivariate representational similarity analyses (RSA) that identified right lateral prefrontal activity encoding conflict similarity and correlated with the behavioral effects of conflict similarity.
This study tackles an important question regarding how distinct types of conflict, which have been previously shown to elicit independent forms of cognitive control adjustments, might be encoded in the brain within a computationally efficient representational format. The ideas postulated by the authors are interesting ones and the utilized methods are rigorous.
We would like to express our sincere appreciation for the reviewer’s positive evaluation of our manuscript and the constructive comments and suggestions. Through careful consideration of your feedback, we have endeavored to make our manuscript more accessible to readers and further strengthened our findings. In response to your suggestion, we reanalyzed our data with the approach proposed by Chen et al.’s (2017, NeuroImage). This reanalysis largely replicated our previous results, reinforcing the validity of our findings. Additionally, we conducted tests with several alternative models and found that the cognitive space hypothesis best aligns with our observed data. We have incorporated these revisions and additional analyses into the manuscript based on your valuable feedback. As a result, we believe that these changes and additional analyses have significantly enhanced the quality of our manuscript. We have provided detailed responses to your comments below.
However, the study has critical limitations that are due to a lack of clarity regarding theoretical hypotheses, serious confounds in the experimental design, and a highly non-standard (and problematic) approach to RSA. Without addressing these issues it is hard to evaluate the contribution of the authors findings to the computational cognitive neuroscience literature.
- The primary theoretical question and its implications are unclear. The paper would greatly benefit from more clearly specifying potential alternative hypotheses and discussing their implications. Consider, for example, the case of parallel conflict monitors. Say that these conflict monitors are separately tuned for Stroop and Simon conflict, and are located within adjacent patches of cortex that are both contained within a single cortical parcel (e.g., as defined by the Glasser atlas used by the authors for analyses). If RSA was conducted on the responses of such a parcel to this task, it seems highly likely that an activation similarity matrix would be observed that is quite similar (if not identical) to the hypothesized one displayed in Figure 1. Yet it would seem like the authors are arguing that the "cognitive space" representation is qualitatively and conceptually distinct from the "parallel monitor" coding scheme. Thus, it seems that the task and analytic approach is not sufficient to disambiguate these different types of coding schemes or neural architectures.
The authors also discuss a fully domain-general conflict monitor, in which different forms of conflict are encoded within a single dimension. Yet this alternative hypothesis is also not explicitly tested nor discussed in detail. It seems that the experiment was designed to orthogonalize the "domain-general" model from the "cognitive space" model, by attempting to keep the overall conflict uniform across the different stimuli (i.e., in the design, the level of Stroop congruency parametrically trades off with the level of Simon congruency). But in the behavioral results (Fig. S1), the interference effects were found to peak when both Stroop and Simon congruency are present (i.e., Conf 3 and 4), suggesting that the "domain-general" model may not be orthogonal to the "cognitive space" model. One of the key advantages of RSA is that it provides the ability to explicitly formulate, test and compare different coding models to determine which best accounts for the pattern of data. Thus, it would seem critical for the authors to set up the design and analyses so that an explicit model comparison analysis could be conducted, contrasting the domain-general, domain-specific, and cognitive space accounts.
We appreciate the reviewer pointing out the need to formally test alternative models. In the revised manuscript, we have added and compared a few alternative models, finding the Cognitive-Space model (the one with graded conflict similarity levels as we reported) provided the best fit to our data. Specifically, we tested the following five models against the Cognitive-Space model:
(1) Domain-General model. This model treats each conflict type as equivalent, so each two conflict types only differ in the magnitude of their conflict. Therefore, we defined the domain-general matrix as the difference in their effects indexed by the group-averaged RT in Experiment 2. Then the z-scored model vector was sign-flipped to reflect similarity instead of distance. This model showed non-significant conflict type effects (t(951989) = 0.92, p = .179) and poorer fit (BIC = 5377126) than the Cognitive-Space model (BIC = 5377094).
(2) Domain-Specific model. This model treats each conflict type differently, so we used a diagonal matrix, with within-conflict type similarities being 1 and all crossconflict type similarities being 0. This model also showed non-significant effects (t(951989) = 0.84, p = .201) and poorer fit (BIC = 5377127) than the Cognitive-Space model.
(3) Stroop-Only model. This model assumes that the right 8C only encodes the spatial Stroop conflict. We projected each conflict type to the Stroop (vertical) axis and calculated the similarity between any two conflict types as the Jaccard similarity index (Jaccard, 1901), that is, their intersection divided by their union. This model also showed non-significant effects (t(951989) = 0.20, p = .423) and poorer fit (BIC = 5377122) than the Cognitive-Space model.
(4) Simon-Only model. This model assumes that the right 8C only encodes the Simon conflict. We projected each conflict type to the Simon (horizontal) axis and calculated the similarity like the Stroop-Only model. This model showed significant effects (t(951989) = 4.19, p < .001) but still quantitatively poorer fit (BIC = 5377096) than the Cognitive-Space model.
(5) Stroop+Simon model. This model assumes the spatial Stroop and Simon conflicts are parallelly encoded in the brain, similar to the "parallel monitor" hypothesis suggested by the reviewer. It includes both Stroop-Only and Simon-Only regressors. This model showed nonsignificant effect for the Stroop regressor (t(951988) = 0.06, p = .478) and significant effect for the Simon regressor (t(951988) = 3.30, p < .001), but poorer fit (BIC = 5377118) than the Cognitive-Space model.
“Moreover, we replicated these results with only incongruent trials (i.e., when conflict is present), considering that the pattern of conflict representations is more manifested when the conflict is present (i.e., on incongruent trials) than not (i.e., on congruent trials). We found a poorer fitting in Domain-general (BIC = 1344129), Domain-Specific (BIC = 1344129), Stroop-Only (BIC = 1344128), Simon-Only (BIC = 1344120), and Stroop+Simon (BIC = 1344157) models than the Cognitive-Space model (BIC = 1344104).”
In summary, these results indicate that the right 8C encodes an integrated cognitive space for resolving Stroop and Simon conflicts. We added the above results to the revised manuscript.
The above analysis approach was added to the method “Model comparison and representational dimensionality”, and the results were added to the “Multivariate patterns of the right dlPFC encodes the conflict similarity” in the revised manuscript.
Methods:
“Model comparison and representational dimensionality To estimate if the right 8C specifically encodes the cognitive space, rather than the domain-general or domain-specific structures, we conducted two more RSAs. We replaced the cognitive space-based conflict similarity matrix in the RSA we reported above (hereafter referred to as the Cognitive-Space model) with one of the alternative model matrices, with all other regressors equal. The domain-general model treats each conflict type as equivalent, so each two conflict types only differ in the magnitude of their conflict. Therefore, we defined the domain-general matrix as the difference in their congruency effects indexed by the group-averaged RT in Experiment 2. Then the zscored model vector was sign-flipped to reflect similarity instead of distance. The domain-specific model treats each conflict type differently, so we used a diagonal matrix, with within-conflict type similarities being 1 and all cross-conflict type similarities being 0.
Moreover, to examine if the cognitive space is driven solely by the Stroop or Simon conflicts, we tested a spatial Stroop-Only (hereafter referred to as “Stroop-Only”) and a Simon-Only model, with each conflict type projected onto the spatial Stroop (vertical) axis or Simon (horizontal) axis, respectively. The similarity between any two conflict types was defined using the Jaccard similarity index (Jaccard, 1901), that is, their intersection divided by their union. We also included a model assuming the Stroop and Simon dimensions are independently represented in the brain, adding up the StroopOnly and Simon-Only regressors (hereafter referred to as the Stroop+Simon model). We conducted similar RSAs as reported above, replacing the original conflict similarity regressor with the Strrop-Only, Simon-Only, or both regressors (for the Stroop+Simon model), and then calculated their Bayesian information criterions (BICs).”
Results:
“To examine if the right 8C specifically encodes the cognitive space rather than the domain-general or domain-specific organizations, we tested several additional models (see Methods). Model comparison showed a lower BIC in the Cognitive-Space model (BIC = 5377094) than the Domain-General (BIC = 537127) or Domain-Specific (BIC = 537127) models. Further analysis showed the dimensionality of the representation in the right 8C was 1.19, suggesting the cognitive space was close to 1D. We also tested if the observed conflict similarity effect was driven solely by spatial Stroop or Simon conflicts, and found larger BICs for the models only including the Stroop similarity (i.e., the Stroop-Only model, BIC = 5377122) or Simon similarity (i.e., the Simon-Only model, BIC = 5377096). An additional Stroop+Simon model, including both StroopOnly and Simon-Only regressors, also showed a worse model fitting (BIC = 5377118). Moreover, we replicated the results with only incongruent trials, considering that the pattern of conflict representations is more manifested when the conflict is present (i.e., on incongruent trials) than not (i.e., on congruent trials). We found a poorer fitting in Domain-general (BIC = 1344129), Domain-Specific (BIC = 1344129), Stroop-Only (BIC = 1344128), Simon-Only (BIC = 1344120), and Stroop+Simon (BIC = 1344157) models than the Cognitive-Space model (BIC = 1344104). These results indicate that the right 8C encodes an integrated cognitive space for resolving Stroop and Simon conflicts. The more detailed model comparison results are listed in Table 2.”
Reference:
Jaccard, P. (1901). Étude comparative de la distribution florale dans une portion des Alpes et des Jura. Bull Soc Vaudoise Sci Nat(37), 547-579.
2a) Relatedly, the reasoning for the use of the term "cognitive space" is unclear. The mere presence of graded coding for two types of conflict seems to be a low bar for referring to neural activity patterns as encoding a "cognitive space". It is discussed that cognitive spaces/maps allow for flexibility through inference and generalization. But no links were made between these cognitive abilities and the observed representational structure.
In the revised manuscript, we have clarified that we tested a specific prediction of the cognitive space hypothesis: the geometry of the cognitive space predicts that more similar conflict types will have more similar neural representations,leading to the CSE and RSA patterns tested in this study. These results add to the literature by providing empirical evidence on how different conflict types are encoded in the brain. We agree that this study is not a comprehensive test of the cognitive space hypothesis. Thus, in the revised manuscript we explicitly clarified that this study is a test of the geometry of the cognitive space hypothesis.
Critically, the cognitive space view holds that the representations of different abstract information are organized continuously and the representational geometry in the cognitive space are determined by the similarity among the represented information (Bellmund et al., 2018).
"The present study aimed to test the geometry of cognitive space in conflict representation. Specifically, we hypothesize that different types of conflict are represented as points in a cognitive space. Importantly, the distance between the points, which reflects the geometry of the cognitive space, scales with the difference in the sources of the conflicts being represented by the points."
We have also discussed the limitation of the results and stressed the need for more research to fully test the cognitive space hypothesis.
“Additionally, our study is not a comprehensive test of the cognitive space hypothesis but aimed primarily to provide original evidence for the geometry of cognitive space in representing conflict information in cognitive control. Future research should examine other aspects of the cognitive space such as its dimensionality, its applicability to other conflict tasks such as Eriksen Flanker task, and its relevance to other cognitive abilities, such as cognitive flexibility and learning.
2b) Additionally, no explicit tests of generality (e.g., via cross-condition generalization) were provided.
To examine the generality of cognitive space across conditions, we conducted a leave-one-out prediction analysis. We used the behavioral data from Experiment 1 for this test, due to its larger amount of data than Experiment 2. Specifically, we removed data from one of the five similarity levels (as illustrated by the θs in Fig. 1C) and used the remaining data to perform the same mixed-effect model as reported in the main text (i.e., the two-stage analysis). This yielded one pair of beta coefficients including the similarity regressor and the intercept for each subject, with which we predicted the CSE for the removed similarity level for each subject. We repeated this process for each similarity level once. The predicted results were highly correlated with the original data, with r = .87 for the RT and r = .84 for the ER, ps < .001. We have added this analysis and result to the “Conflict type 706 similarity modulated behavioral congruency sequence effect (CSE)” section.
“Moreover, to test the continuity and generalizability of the similarity modulation, we conducted a leave-one-out prediction analysis. Specifically, we removed data from one of the five similarity levels (as illustrated by the θs in Fig. 1C) and used the remaining data to perform the same mixed-effect model (i.e., the two-stage analysis). This yielded one pair of beta coefficients including the similarity regressor and the intercept for each subject, with which we predicted the CSE for the removed similarity level for each subject. We repeated this process for each similarity level once. The predicted results were highly correlated with the original data, with r = .87 for the RT and r = .84 for the ER, ps < .001."
2c) Finally, although the design elicits strong CSE effects, it seems somewhat awkward to consider CSE behavioral patterns as a reflection of the kind of abilities supported by a cognitive map (if this is indeed the implication that was intended). In fact, CSE effects are well-modeled by simpler "model-free" associative learning processes, that do not require elaborate representations of abstract structures.
We argue the conflict similarity modulation of CSEs we observed cannot be explained by the “model-free” stimulus-driven associative learning process. This mainly refers to the feature integration account proposed by Hommel et al. (2004), which explains poorer performance in CI and IC trials (compared with CC and II trials) with the partial repetition cost caused by the breaking of stimulus-response binding. Although we cannot remove its influence on the within-type trials (similarity level 5, θ = 0), it should not affect the cross-type trials (similarity level 1-4, θ = 90°, 67.5°, 45° and 22.5°, respectively), because the CC, CI, IC, II trials had equal probabilities of partially repeated and fully switched trials (see the Author response image 1 for an example of trials across Conf 1 and Conf 3 conditions). Thus, feature integration cannot explain the gradual CSE decrease from similarity level 1 to 4, which sufficiently reproduce the full effect, as suggested by the leave-one-out prediction analysis mentioned above. We thus conclude that the similarity modulation of CSE cannot be explained by the stimulus-driven associative learning.
Author response image 1.
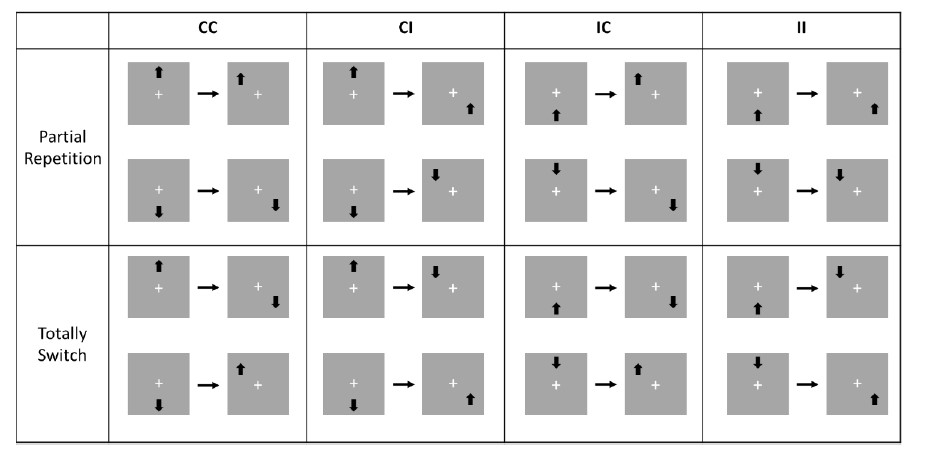
Notably, however, our findings are aligned with an associative learning account of cognitive control (Abrahamse et al., 2016), which extends association learning from stimulus/response level to cognitive control. In other words, abstract cognitive control state can be learned and generalized like other sensorimotor features. This view explicitly proposes that “transfer occurs to the extent that two tasks overlap”, a hypothesis directly supported by our CSE results (see also Yang et al., 2021). Extending this, our fMRI results provide the neural basis of how cognitive control can generalize through a representation of cognitive space. The cognitive space view complements associative learning account by providing a fundamental principle for the learning and generalization of control states. Given the widespread application of CSE as indicator of cognitive control generalization (Braem et al., 2014), we believe that it can be recognized as a kind of ability supported by the cognitive space. This was further supported by the brain-behavioral correlation: stronger encoding of cognitive space was associated with greater bias of trial-wise behavioral adjustment by the consecutive conflict similarity.
We have incorporated these ideas into the discussion:
“Similarly, we propose that cognitive space could serve as a mental model to assist fast learning and efficient organization of cognitive control settings. Specifically, the cognitive space representation may provide a principle for how our brain evaluates the expected cost of switching and the benefit of generalization between states and selects the path with the best cost-benefit tradeoff (Abrahamse et al., 2016; Shenhav et al., 2013). The proximity between two states in cognitive space could reflect both the expected cognitive demand required to transition and the useful mechanisms to adapt from. The closer the two conditions are in cognitive space, the lower the expected switching cost and the higher the generalizability when transitioning between them. With the organization of a cognitive space, a new conflict can be quickly assigned a location in the cognitive space, which will facilitate the development of cognitive control settings for this conflict by interpolating nearby conflicts and/or projecting the location to axes representing different cognitive control processes, thus leading to a stronger CSE when following a more similar conflict condition.”
References:
Hommel, B., Proctor, R. W., & Vu, K. P. (2004). A feature-integration account of sequential effects in the Simon task. Psychological Research, 68(1), 1-17. Abrahamse, E., Braem, S., Notebaert, W., & Verguts, T. (2016). Grounding cognitive control in associative learning. Psychological Bulletin, 142(7), 693-728.
Yang, G., Xu, H., Li, Z., Nan, W., Wu, H., Li, Q., & Liu, X. (2021). The congruency sequence effect is modulated by the similarity of conflicts. Journal of 770 Experimental Psychology: Learning, Memory, and Cognition, 47(10), 1705-1719.
Braem, S., Abrahamse, E. L., Duthoo, W., & Notebaert, W. (2014). What determines the specificity of conflict adaptation? A review, critical analysis, and proposed synthesis. Frontiers in Psychology, 5, 1134.
- More generally, it seems problematic that Stroop and Simon conflict in the paradigm parametrically trade-off against each other. A more powerful design would have de-confounded Stroop and Simon conflict so that each could be separately estimation via (potentially orthogonal) conflict axes. Additionally, incorporating more varied stimulus sets, locations, or responses might have enabled various tests of generality, as implied by a cognitive space account.
We thank the reviewer for these valuable suggestions. We argue that the current design is adequate to test the prediction that more similar conflict types have more similar neural representations. That said, we agree that further examination using more powerful experimental designs are needed to fully test the cognitive space account of cognitive control. We also agree that employing more varied stimulus sets,locations and responses would further extend our findings. We have included this as a future research direction in the revised manuscript.
We have revised our discussion about the limitation as:
“A few limitations of this study need to be noted. To parametrically manipulate the conflict similarity levels, we adopted the spatial Stroop-Simon paradigm that enables parametrical combinations of spatial Stroop and Simon conflicts. However, since this paradigm is a two-alternative forced choice design, the behavioral CSE is not a pure measure of adjusted control but could be partly confounded by bottom-up factors such as feature integration (Hommel et al., 2004). Future studies may replicate our findings with a multiple-choice design (including more varied stimulus sets, locations and responses) with confound-free trial sequences (Braem et al., 2019). Another limitation is that in our design, the spatial Stroop and Simon effects are highly anticorrelated. This constraint may make the five conflict types represented in a unidimensional space (e.g., a circle) embedded in a 2D space. Future studies may test the 2D cognitive space with fully independent conditions. A possible improvement to our current design would be to include left, right, up, and down arrows presented in a grid formation across four spatially separate quadrants, with each arrow mapped to its own response button. However, one potential confounding factor would be that these conditions have different levels of difficulty (i.e., different magnitude of conflict), which may affect the CSE results and their representational similarity.”
- Serious confounds in the design render the results difficult to interpret. As much prior neuroimaging and behavioral work has established, "conflict" per se is perniciously correlated with many conceptually different variables. Consequently, it is very difficult to distinguish these confounding variables within aggregate measures of neural activity like fMRI. For example, conflict is confounded with increased time-on-task with longer RT, as well as conflict-driven increases in coding of other task variables (e.g., task-set related coding; e.g., Ebitz et al. 2020 bioRxiv). Even when using much higher resolution invasive measures than fMRI (i.e., eCoG), researchers have rightly been wary of making strong conclusions about explicit encoding of conflict (Tang et al, 2019; eLife). As such, the researchers would do well to be quite cautious and conservative in their analytic approach and interpretation of results.
We acknowledge the findings showing that encoding of conflicts may not be easily detected in the brain. However, recent studies have shown that the representational similarity analysis can effectively detect representations of conflict tasks (e.g., the color Stroop) using factorial designs (Freund et al., 2021a; 2021b).
In our analysis, we are aware of the potential impact of time-on-task (e.g., RT) on univariate activation levels and subsequent RSA patterns. To address this issue, we added univariate fMRI activation levels as nuisance regressors to the RSA. To de confound conflict from other factors such as orientation of stimuli related to the center of the screen, we also applied the cross-subject RSA approach. Furthermore, we were cautious about determining regions that encoded conflict control. We set three strict criteria: (1) Regions must show a conflict similarity modulation effect; (2) regions must show higher representational strength in the incongruent condition compared with the congruent condition; and (3) regions must correlate with behavioral performance. With these criteria, we believe that the results we reported are already conservative. We would be happy to implement any additional criteria the reviewer recommends.
Reference:
Freund, M. C., Etzel, J. A., & Braver, T. S. (2021a). Neural Coding of Cognitive Control: The Representational Similarity Analysis Approach. Trends in Cognitive Sciences, 25(7), 622-638.
Freund, M. C., Bugg, J. M., & Braver, T. S. (2021b). A Representational Similarity 823 Analysis of Cognitive Control during Color-Word Stroop. Journal of 824 Neuroscience, 41(35), 7388-7402.
- This issue is most critical in the interpretation of the fMRI results as reflecting encoding of conflict types. A key limitation of the design, that is acknowledged by the authors is that conflict is fully confounded within-subject by spatial orientation. Indeed, the limited set of stimulus-response mappings also cast doubt on the underlying factors that give rise to the CSE modulations observed by the authors in their behavioral results. The CSE modulations are so strong - going from a complete absence of current x previous trial-type interaction in the cos(90) case all the way to a complete elimination of any current trial conflict when the prior trial was incongruent in the cos(0) case - that they cause suspicion that they are actually driven by conflict-related control adjustments rather than sequential dependencies in the stimulus-response mappings that can be associatively learned.
Unlike the fMRI data, we cannot tease apart the effects of conflict similarity and orientation in a similar manner as the cross-subject RSA for behavioral CSEs. However, we have a few reasons that the orientation and other bottom-up factors should not be the factors driving the similarity modulation effect.
First, we did not find any correlation between the regions showing orientation effects and behavioral CSEs. This suggests that orientation does not directly contribute to the CSE modulation.
Second, if the CSE modulation is purely driven by the association learning of the stimulus-response mapping, we should observe a stronger modulation effect after more extensive training. However, our results do not support this prediction. Using data from Experiment 1, we found that the modulation effect remained constant across the three sessions (see Note S3).
“Note S3. Modulation of conflict similarity on behavioral CSEs does not change across time We tested if the conflict similarity modulation on the CSE is susceptible to training. We collected the data of Experiment 1 across three sessions, thus it is possible to examine if the conflict similarity modulation effect changes across time. To this end, we added conflict similarity, session and their interaction into a mixed-effect linear model, in which the session was set as a categorical variable. With a post-hoc analysis of variance (ANOVA), we calculated the statistical significance of the interaction term. This approach was applied to both the RT and ER. Results showed no interaction effect in either RT, F(2,1479) = 1.025, p = .359, or ER, F(2,1479) = 0.789, p = .455. This result suggests that the modulation effect does not change across time. “
Third, the observed similarity modulation on the CSE, particularly for similarity levels 1-4, should not be attributed to the stimulus-response associations, such as feature integration, as have been addressed in response to comment 2.c.
Finally, other bottom-up factors, such as the spatial location proximity did not drive the CSE modulation results, which we have addressed in the original manuscript in Note S2.
"Note S2. Modulation of conflict similarity on behavioral CSEs cannot be explained by the physical proximity
In our design, the conflict similarity might be confounded by the physical proximity between stimulus (i.e., the arrow) of two consecutive trials. That is, when arrows of the two trials appear at the same quadrant, a higher conflict similarity also indicates a higher physical proximity (Fig. 1A). Although the opposite is true if arrows of the two trials appear at different quadrants, it is possible the behavioral effects can be biased by the within quadrant trials. To examine if the physical distance has confounded the conflict similarity modulation effect, we conducted an additional analysis.
We defined the physical angular difference across two trials as the difference of their polar angles relative to the origin. Therefore, the physical angular difference could vary from 0 to 180°. For each CSE conditions (i.e., CC, CI, IC and II), we grouped the trials based on their physical angular distances, and then averaged trials with the same previous by current conflict type transition but different orders (e.g., StHSmL−StLSmH and StLSmH−StHSmL) within each subject. The data were submitted to a mixed-effect model with the conflict similarity, physical proximity (i.e., the opposite of the physical angular difference) as fixed-effect predictors, and subject and CSE condition as random effects. Results showed significant conflict similarity modulation effects in both Experiment 1 (RT: β = 0.09 ± 0.01, t(7812) = 13.74, p < .001, ηp2 = .025; 875 ER: β = 0.09 ± 0.01, t(7812) = 7.66, p < .001, ηp2 = .018) and Experiment 2 (RT: β = 876 0.21 ± 0.02, t(3956) = 9.88, p < .001, ηp2 = .043; ER: β = 0.20 ± 0.03, t(4201) = 6.11, 877 p < .001, ηp2 = .038). Thus, the observed modulation of conflict similarity on behavioral 878 CSEs cannot be explained by physical proximity."
- To their credit, the authors recognize this confound, and attempt to address it analytically through the use of a between-subject RSA approach. Yet the solution is itself problematic, because it doesn't actually deconfound conflict from orientation. In particular, the RSA model assumes that whatever components of neural activity encode orientation produce this encoding within the same voxellevel patterns of activity in each subject. If they are not (which is of course likely), then orthogonalization of these variables will be incomplete. Similar issues underlie the interpretation target/response and distractor coding. Given these issues, perhaps zooming out to a larger spatial scale for the between-subject RSA might be warranted. Perhaps whole-brain at the voxel level with a high degree of smoothing, or even whole-brain at the parcel level (averaging per parcel). For this purpose, Schaefer atlas parcels might be more useful than Glasser, as they more strongly reflect functional divisions (e.g., motor strip is split into mouth/hand divisions; visual cortex is split into central/peripheral visual field divisions). Similarly, given the lateralization of stimuli, if a within-parcel RSA is going to be used, it seems quite sensible to pool voxels across hemispheres (so effectively using 180 parcels instead of 360).
Doing RSA at the whole-brain level is an interesting idea. However, it does not allow the identification of specific brain regions representing the cognitive space. Additionally, increasing the spatial scale would include more voxels that are not involved in representing the information of interest and may increase the noise level of data. Given these concerns, we did not conduct the whole-brain level RSA.
We agree that smoothing data can decrease cross-subject variance in voxel distribution and may increase the signal-noise ratio. We reanalyzed the results for the right 8C region using RSA on smoothed beta maps (6-mm FWHM Gaussian kernel). This yielded a significant conflict similarity effect, t(951989) = 5.55, p < .0001, replicating the results on unsmoothed data (t(951989) = 5.60, p < .0001). Therefore, we retained the results from unsmoothed data in the main text, and added the results based on smoothed data to the supplementary material (Note S9).
“Note S9. The cross-subject pattern similarity is robust against individual differences Due to individual differences, the multivoxel patterns extracted from the same brain mask may not reflect exactly the same brain region for each subject. To reduce the influence of individual difference, we conducted the same cross-subject RSA using data smoothed with a 6-mm FWHM Gaussian kernel. Results showed a significant conflict similarity effect, t(951989) = 5.55, p < .0001, replicating the results on unsmoothed data (t(951989) = 5.60, p < .0001). “
We also used the bilateral 8C area as a single mask and conducted the same RSA. We found a significant conflict type similarity effect, t(951989) = 4.36, p < .0001. However, the left 8C alone showed no such representation, t(951989) = 0.38, p = .351, consistent with the right lateralized representation of cognitive space we reported in Note S8. Therefore, we used ROIs from each hemisphere separately.
“Note S8. The lateralization of conflict type representation
We observed the right 8C but not the left 8C represented the conflict type similarity. A further test is to show if there is a lateralization. We tested several regions of the left dlPFC, including the i6-8, 8Av, 8C, p9-46v, 46, 9-46d, a9-46v (Freund, Bugg, et al., 2021). We found that none of these regions show the representation of conflict type, all uncorrected ps > .35. These results indicate that the conflict type is specifically represented in the right dlPFC. “
We have also discussed the lateralization in the manuscript:
“In addition, we found no such representation in the left dlPFC (Note S8), indicating a possible lateralization. Previous studies showed that the left dlPFC was related to the expectancy-related attentional set up-regulation, while the right dlPFC was related to the online adjustment of control (Friehs et al., 2020; Vanderhasselt et al., 2009), which is consistent with our findings. Moreover, the right PFC also represents a composition of single rules (Reverberi et al., 2012), which may explain how the spatial Stroop and Simon types can be jointly encoded in a single space.”
- The strength of the results is difficult to interpret due to the non-standard analysis method. The use of a mixed-level modeling approach to summarize the empirical similarity matrix is an interesting idea, but nevertheless is highly non-standard within RSA neuroimaging methods. More importantly, the way in which it was implemented makes it potentially vulnerable to a high degree of inaccuracy or bias. In this case, this bias is likely to be overly optimistic (high false positive rate). No numerical or formal defense was provided for this mixed-level model approach. As a result, the use of this method seems quite problematic, as it renders the strength of the observed results difficult to interpret. Instead, the authors are encouraged using a previously published method of conducting inference with between-subject RSA, such as the bootstrapping methods illustrated in Kragel et al. (2018; Nat Neurosci), or in potentially adopting one of the Chen et al. methods mentioned above, that have been extensively explored in terms of statistical properties.
No numerical or formal defense was provided for this mixed-level model approach. As a result, the use of this method seems quite problematic, as it renders the strength of the observed results difficult to interpret. Instead, the authors are encouraged using a previously published method of conducting inference with between-subject RSA, such as the bootstrapping methods illustrated in Kragel et al. (2018; Nat Neurosci), or in potentially adopting one of the Chen et al. methods mentioned above, that have been extensively explored in terms of statistical properties.
In our revised manuscript, we have adopted the approach proposed by Chen et al. (2017). Specifically, we included both the upper and lower triangle of the representational similarity matrix (excluding the diagonal). Moreover, we also removed all the within-subject similarity (thus also excluding the within-run similarity) to minimize the bias of the potentially strong within-subject similarity (note we also analyzed the within-subject data and found significant effects for the similarity modulation, though this effect cannot be attributed to the conflict similarity or orientation alone. We added this part in Note S7, see below). In addition, we added both the row-wise and column-wise random effects to capture the dependence of cells within each column/row (Chen et al., 2017). We have revised the method part as:
“We excluded within-subject cells from the RSM (thus also excluding the withinrun similarity as suggested by Walther et al., (2016)), and the remaining cells were converted into a vector, which was then z-transformed and submitted to a linear mixed effect model as the dependent variable. The linear mixed effect model also included regressors of conflict similarity and orientation similarity. Importantly, conflict similarity was based on how Simon and spatial Stroop conflicts are combined and hence was calculated by first rotating all subject’s stimulus location to the topright and bottom-left quadrants, whereas orientation was calculated using original stimulus locations. As a result, the regressors representing conflict similarity and orientation similarity were de-correlated. Similarity between two conditions was measured as the cosine value of the angular difference. Other regressors included a target similarity regressor (i.e., whether the arrow directions were identical), a response similarity regressor (i.e., whether the correct responses were identical); a spatial Stroop distractor regressor (i.e., vertical distance between two stimulus locations); a Simon distractor regressor (i.e., horizontal distance between two stimulus locations). Additionally, we also included a regressor denoting the similarity of Group (i.e., whether two conditions are within the same subject group, according to the stimulus-response mapping). We also added two regressors including ROImean fMRI activations for each condition of the pair to remove the possible uni-voxel influence on the RSM. A last term was the intercept. To control the artefact due to dependence of the correlation pairs sharing the same subject, we included crossed random effects (i.e., row-wise and column-wise random effects) for the intercept, conflict similarity, orientation and the group factors (G. Chen et al., 2017).”
Results from this approach highly replicated our original results. Specifically, we found the right 8C again showed a strong conflict similarity effect, a higher representational strength in the incongruent condition compared to the congruent condition, and a significant correlation with the behavioral CSE. The orientation effect was also identified in the visual (e.g., right V1) and oculomotor (e.g., left FEF) regions.
We revised the results accordingly:
For the conflict type effect:
“The first criterion revealed several cortical regions encoding the conflict similarity, including the Brodmann 8C area (a subregion of dlPFC(Glasser et al., 2016)) and a47r in the right hemisphere, and the superior frontal language (SFL) area, 6r, 7Am, 24dd, and ventromedial visual area 1 (VMV1) areas in the left hemisphere (Bonferroni corrected ps < 0.0001, one-tailed, Fig. 4A). We next tested whether these regions were related to cognitive control by comparing the strength of conflict similarity effect between incongruent and congruent conditions (criterion 2). Results revealed that the left SFL, left VMV1, and right 8C met this criterion, Bonferroni corrected ps < .05, one-tailed, suggesting that the representation of conflict type was strengthened when conflict was present (e.g., Fig. 4D). The intersubject brain-behavioral correlation analysis (criterion 3) showed that the strength of conflict similarity effect on RSM scaled with the modulation of conflict similarity on the CSE (slope in Fig. S2C) in right 8C (r = .52, Bonferroni corrected p = .002, onetailed, Fig. 4C, Table 1) but not in the left SFL and VMV1 (all Bonferroni corrected ps > .05, one-tailed). “
For the orientation effect:
“We observed increasing fMRI representational similarity between trials with more similar orientations of stimulus location in the occipital cortex, such as right V1, right V2, right V4, and right lateral occipital 2 (LO2) areas (Bonferroni corrected ps < 0.0001). We also found the same effect in the oculomotor related region, i.e., the left 997 frontal eye field (FEF), and other regions including the right 5m, left 31pv and right parietal area F (PF) (Fig. 5A). Then we tested if any of these brain regions were related to the conflict representation by comparing their encoding strength between incongruent and congruent conditions. Results showed that the right V1, right V2, left FEF, and right PF encoded stronger orientation effect in the incongruent than the congruent condition, Bonferroni corrected ps < .05, one-tailed (Table1, Fig. 5B). We then tested if any of these regions was related to the behavioral performance, and results showed that none of them positively correlated with the behavioral conflict similarity modulation effect, all uncorrected ps > .45, one-tailed. Thus all regions are consistent with the criterion 3.”
“Note S7. The cross-subject RSA captures similar effects with the within-subject RSA Considering the variability in voxel-level functional localizations among individuals, one may question whether the cross-subject RSA results were biased by the consistent multi-voxel patterns across subjects, distinct from the more commonly utilized withinsubject RSA. We reasoned that the cross-subject RSA should have captured similar effects as the within-subject RSA if we observe the conflict similarity effect in right 8C with the latter analysis. Therefore, we tested whether the representation in right 8C held for within-subject data. Specifically, we performed similar RSA for withinsubject RSMs, excluding the within-run cells. We replaced the perfectly confounded factors of conflict similarity and orientation with a common factor called similarity_orientation. Other confounding factor pairs (i.e., target versus response, and Stroop distractor versus Simon distractor) were addressed similarly. Results showed a significant effect of similarity_orientation, t(13993) = 3.270, p = .0005, 1tailed. Given the specific representation of conflict similarity identified by the crosssubject RSA, the within-subject data of right 8C may show similar conflict similarity modulation effects as the cross-subject data. Further research is needed to fully dissociate the representation of conflict and the representation of visual features such as orientation.”
- Another potential source of bias is in treating the subject-level random effect coefficients (as predicted by the mixed-level model) as independent samples from a random variable (in the t-tests). The more standard method for inference would be to use test statistics derived from the mixed-model fixed effects, as those have degrees of freedom calculations that are calibrated based on statistical theory.
In our revised manuscript, we reported the statistical p values calculated from the mixed-effect models. Note that because we used the Chen et al. (2017) method, which includes data from the symmetric matrix, we corrected the degrees of freedom and estimated the true p values based on the t statistics of model results. For the I versus C comparison results, we calculated the p values by combining I and C RSMs into a larger model and then adding the condition type, as well as the interaction between the regressors of interest (conflict similarity and orientation) and the condition type. We made the statistical inference based on the interaction effect.
We have revised the corresponding methods as:
“The statistical significance of these beta estimates was based on the outputs of the mixed-effect model estimated with the “fitlme” function in Matlab 2022a. Since symmetric cells from the RSM matrix were included in the mixed-effect model, we adjusted the t and p values with the true degree of freedom, which is half of the cells included minus the number of fixed regressors. Multiple comparison correction was applied with the Bonferroni approach across all cortical regions at the p < 0.0001 level. To test if the representation strengths are different between congruent and incongruent conditions, we also conducted the RSA using only congruent (RDM_C) and incongruent (RDM_I) trials separately. The contrast analysis was achieved by an additional model with both RDM_C and RDM_I included, adding the congruency and the interaction between conflict type (and orientation) and congruency as both fixed and random factors. The difference between incongruent and congruent representations was indicated by a significant interaction effect.”
Reviewer #3:
Yang and colleagues investigated whether information on two task-irrelevant features that induce response conflict is represented in a common cognitive space. To test this, the authors used a task that combines the spatial Stroop conflict and the Simon effect. This task reliably produces a beautiful graded congruency sequence effect (CSE), where the cost of congruency is reduced after incongruent trials. The authors measured fMRI to identify brain regions that represent the graded similarity of conflict types, the congruency of responses, and the visual features that induce conflicts.
Using several theory-driven exclusion criteria, the authors identified the right dlPFC (right 8C), which shows 1) stronger encoding of graded similarity of conflicts in incongruent trials and 2) a positive correlation between the strength of conflict similarity type and the CSE on behavior. The dlPFC has been shown to be important for cognitive control tasks. As the dlPFC did not show a univariate parametric modulation based on the higher or lower component of one type of conflict (e.g., having more spatial Stroop conflict or less Simon conflict), it implies that dissimilarity of conflicts is represented by a linear increase or decrease of neural responses. Therefore, the similarity of conflict is represented in multivariate neural responses that combine two sources of conflict.
The strength of the current approach lies in the clear effect of parametric modulation of conflict similarity across different conflict types. The authors employed a clever cross-subject RSA that counterbalanced and isolated the targeted effect of conflict similarity, decorrelating orientation similarity of stimulus positions that would otherwise be correlated with conflict similarity. A pattern of neural response seems to exist that maps different types of conflict, where each type is defined by the parametric gradation of the yoked spatial Stroop conflict and the Simon conflict on a similarity scale. The similarity of patterns increases in incongruent trials and is correlated with CSE modulation of behavior.
We would like to thank the reviewer for the positive evaluation of our manuscript and for providing constructive comments. By addressing these comments, we believe that we have made our manuscript more accessible for the readers while also strengthening our findings. In particular, we have tested a few alternative models and confirmed that the cognitive space hypothesis best fits the data. We have also demonstrated the geometric properties of the cognitive space by examining the continuity and dimensionality of the space, further supporting our main arguments. We have incorporated revisions and additional analyses to the manuscript based on your feedback. Overall, we believe that these changes and additional analyses have significantly improved the manuscript. Please find our detailed responses below.
However, several potential caveats need to be considered.
- One caveat to consider is that the main claim of recruitment of an organized "cognitive space" for conflict representation is solely supported by the exclusion criteria mentioned earlier. To further support the involvement of organized space in conflict representation, other pieces of evidence need to be considered. One approach could be to test the accuracy of out-of-sample predictions to examine the continuity of the space, as commonly done in studies on representational spaces of sensory information. Another possible approach could involve rigorously testing the geometric properties of space, rather than fitting RSM to all conflict types. For instance, in Fig 6, both the organized and domain-specific cognitive maps would similarly represent the similarity of conflict types expressed in Fig1c (as evident from the preserved order of conflict types). The RSM suggests a low-dimensional embedding of conflict similarity, but the underlying dimension remains unclear.
Following the reviewer’s first suggestion, we conducted a leave-one-out prediction approach to examine the continuity of the cognitive space. We used the behavioral data from Experiment 1 for this test, due to its larger amount of data than Experiment 2. Specifically, we removed data from one of the five similarity levels (as illustrated by the θs in Fig. 1C) and used the remaining data to perform the same mixed-effect model as reported in the main text (i.e., the two-stage analysis). This yielded one pair of beta coefficients including the similarity regressor and the intercept for each subject, with which we predicted the CSE for the removed similarity level at subject level. We repeated this process for each similarity level once. The predicted results were highly correlated with the original data, with r = .87 for the RT and r = .84 for the ER, ps < .001. We have added this analysis and result to the “Conflict type similarity modulated behavioral congruency sequence effect (CSE)” 1079 section:
“Moreover, to test the continuity and generalizability of the similarity modulation, we conducted a leave-one-out prediction analysis. We used the behavioral data from Experiment 1 for this test, due to its larger amount of data than Experiment 2. Specifically, we removed data from one of the five similarity levels (as illustrated by the θs in Fig. 1C) and used the remaining data to perform the same mixed-effect model (i.e., the two-stage analysis). This yielded one pair of beta coefficients including the similarity regressor and the intercept for each subject, with which we predicted the CSE for the removed similarity level for each subject. We repeated this process for each similarity level once. The predicted results were highly correlated with the original data, with r = .87 for the RT and r = .84 for the ER, ps < .001.”
To estimate if the domain-specific model could explain the results we observed in right 8C, we conducted a model-comparison analysis. The domain-specific model treats each conflict type differently, so we used a diagonal matrix, with within-conflict type similarities being 1 and all cross-conflict type similarities being 0. This model showed non-significant effects (t(951989) = 0.84, p = .201) and poorer fit (BIC = 5377127) than the cognitive space model (t(951989) = 5.60, p = 1.1×10⁻⁸, BIC = 5377094). We also compared other alternative models and found the cognitive space model best fitted the data. We have included these results in the revised manuscript:
“To examine if the right 8C specifically encodes the cognitive space rather than the domain-general or domain-specific organizations, we tested several additional models (see Methods). Model comparison showed a lower BIC in the Cognitive-Space model (BIC = 5377094) than the Domain-General (BIC = 537127) or Domain-Specific (BIC = 537127) models. Further analysis showed the dimensionality of the representation in the right 8C was 1.19, suggesting the cognitive space was close to 1D. We also tested if the observed conflict similarity effect was driven solely by spatial Stroop or Simon conflicts, and found larger BICs for the models only including the Stroop similarity (i.e., the Stroop-Only model, BIC = 5377122) or Simon similarity (i.e., the Simon-Only model, BIC = 5377096). An additional Stroop+Simon model, including both StroopOnly and Simon-Only regressors, also showed a worse model fitting (BIC = 5377118). Moreover, we replicated the results with only incongruent trials, considering that the pattern of conflict representations is more manifested when the conflict is present (i.e., on incongruent trials) than not (i.e., on congruent trials). We found a poorer fitting in Domain-general (BIC = 1344129), Domain-Specific (BIC = 1344129), Stroop-Only (BIC = 1344128), Simon-Only (BIC = 1344120), and Stroop+Simon (BIC = 1344157) models than the Cognitive-Space model (BIC = 1344104). These results indicate that the right 8C encodes an integrated cognitive space for resolving Stroop and Simon conflicts. The more detailed model comparison results are listed in Table 2.”
We also estimated the dimensionality of the right 8C with the averaged RSM and found the dimensionality of the cognitive space was ~ 1.19, very close to a 1D space. This result is consistent with our experimental design, as the only manipulated variable is the angular distance between conflict types. We have added these results and the methods to the revised manuscript.
Results:
“Further analysis showed the dimensionality of the representation in the right 8C was 1.19, suggesting the cognitive space was close to 1D.”
Methods:
“To better capture the dimensionality of the representational space, we estimated its dimensionality using the participation ratio (Ito & Murray, 2023). Since we excluded the within-subject cells from the whole RSM, the whole RSM is an incomplete matrix and could not be used. To resolve this issue, we averaged the cells corresponding to each pair of conflict types to obtain an averaged 5×5 RSM matrix, similar to the matrix shown in Fig. 1C. We then estimated the participation ratio using the formula:
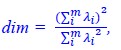
where λi is the eigenvalue of the RSM and m is the number of eigenvalues.
- Another important factor to consider is how learning within the confined task space, which always negatively correlates the two types of conflicts within each subject, may have influenced the current results. Is statistical dependence of conflict information necessary to use the organized cognitive space to represent conflicts from multiple sources? Answering this question would require a paradigm that can adjust multiple sources of conflicts parametrically and independently. Investigating such dependencies is crucial in order to better understand the adaptive utility of the observed cognitive space of conflict similarity.
As the central goal of our design was to test the geometry of neural representations of conflict, we manipulated the conflict similarity. The anticorrelated Simon and spatial Stroop conflict aimed to make the overall magnitude of conflict similar among different conflict types. We agree that with the current design the likely cognitive space is not a full 2D space with Simon and spatial Stroop being two dimensions. Instead, the likely cognitive space is a subspace (e.g., a circle) embedded in the 2D space, due to the constraint of anticorrelated Simon and spatial Stroop conflict across conflict types. Nevertheless, the subspace can also be used to test the geometry that similar conflict types share similar neural representations.
To test the full 2D cognitive space, a possible revision of our current design is to have multiple hybrid conditions (like Type 2-4) that cover the whole space. For instance, imagine arrow locations in the first quadrant space. We could have a 3×3 design with 9 conflict conditions, where their horizontal/vertical coordinates could be one of the combinations of 0, 0.5 and 1. This way, the spatial Stroop and Simon conditions would be independent of each other. Notably, however, one potential confounding factor would be that these conditions have different levels of difficulty (i.e., different magnitude of conflict), which may affect the CSE results and their representational similarity.
We have added the above limitations and future designs to the revised 1156 manuscript.“Another limitation is that in our design, the spatial Stroop and Simon effects are highly anticorrelated. This constraint may make the five conflict types represented in a unidimensional space (e.g., a circle) embedded in a 2D space. Future studies may test the 2D cognitive space with fully independent conditions. A possible improvement to our current design would be to include left, right, up, and down arrows presented in a grid formation across four spatially separate quadrants, with each arrow mapped to its own response button. However, one potential confounding factor would be that these conditions have different levels of difficulty (i.e., different magnitude of conflict), which may affect the CSE results and their representational similarity.”
Major comments:
- The RSM result (and the absence of univariate effect) seem to be a good first step to claim the use of cognitive space of conflict. Yet, the presence of an organized (unidimensional; Fig. 6) and continuous cognitive space should be further tested and backed up.
We thank the reviewer for recognizing the methods and results of our current work. Indeed, the utilization of a parametric design and RSA to examine organization of neural representations is a widely embraced methodology in the field of cognitive neuroscience (e.g., Freund et al., 2021; Ritz et al., 2022). Our current study aimed primarily to provide original evidence for whether similar conflicts are represented similarly in the brain, which reflects the geometry of conflict representations (i.e., the structure of differences between conflict representations). We have used multiple criteria to back up the findings by showing the representation is sensitive to the presence of conflict and has behavioral relevance.
We agree that the cognitive space account of cognitive control requires further validation. Therefore, in the revised manuscript, we have added several additional tests to strengthen the evidence supporting the organized cognitive space representation. Firstly, we tested five alternative models (Domain-General, Domain Specific, Stroop-Only, Simon-Only and Stroop+Simon models), and found that the Cognitive-Space model best fitted our data. Secondly, we explicitly calculated the dimensionality of the representation and observed a low dimensionality (1.19D). We have added these results to the “Multivariate patterns of the right dlPFC encodes the conflict similarity” section in the revised manuscript (see also the response to Comment 1).
Furthermore, we utilized data from Experiment 1 to demonstrate the continuity of the cognitive space by showing its ability to predict out-of-sample data. We have included this result to the “Conflict type similarity modulated behavioral congruency sequence effect (CSE)” section in the revised manuscript:
“Moreover, to test the continuity and generalizability of the similarity modulation, we conducted a leave-one-out prediction analysis. We used the behavioral data from Experiment 1 for this test, due to its larger amount of data than Experiment 2. Specifically, we removed data from one of the five similarity levels (as illustrated by the θs in Fig. 1C) and used the remaining data to perform the same mixed-effect model (i.e., the two-stage analysis). This yielded one pair of beta coefficients including the similarity regressor and the intercept for each subject, with which we predicted the CSE for the removed similarity level for each subject. We repeated this process for each similarity level once. The predicted results were highly correlated with the original data, with r = .87 for the RT and r = .84 for the ER, ps < .001.”
References:
Freund, M. C., Bugg, J. M., & Braver, T. S. (2021). A Representational Similarity Analysis of Cognitive Control during Color-Word Stroop. Journal of Neuroscience, 41(35), 7388-7402.
Ritz, H., & Shenhav, A. (2022). Humans reconfigure target and distractor processing to address distinct task demands. bioRxiv. doi:10.1101/2021.09.08.459546
- Is the conflict similarity effect not driven by either coding of the weak to strong gradient of the spatial Stroop conflict or the Simon conflict? For example, would simply identifying brain regions that selectively tuned to the Simon conflict continuously enough to create a graded similarity in Fig. C.
We recognize that our current design and analyzing approach cannot fully exclude the possibility that the current results are driven solely by either Stroop or Simon conflicts, since their gradients are correlated to the conflict similarity gradient we defined. To estimate their unique contributions, we performed a model-comparison analysis. We constructed a Stroop-Only model and a Simon-Only model, with each conflict type projected onto the Stroop (vertical) axis or Simon (horizontal) axis, respectively. The similarity between any two conflict types was defined using the Jaccard similarity index (Jaccard, P., 1901), that is, their intersection divided by their union. By replacing the cognitive space-based conflict similarity regressor with the Stroop-Only and Simon-Only regressors, we calculated their BICs. Results showed that the BIC was larger for Stroop-Only (5377122) and Simon-Only (5377096) than for the cognitive space model (5377094). An additional Stroop+Simon model, including both Stroop-Only and Simon-Only regressors, also 1220 showed a poorer model fitting (BIC = 5377118) than the cognitive space model.
Moreover, we replicated the results with only incongruent trials. We found a poorer fitting in Stroop-Only (BIC = 1344128), Simon-Only (BIC = 1344120), and Stroop+Simon (BIC = 1344157) models than the Cognitive-Space model (BIC = 1344104). These results indicate that the right 8C encodes an integrated cognitive space for resolving Stroop and Simon conflicts. Therefore, we believe the cognitive space has incorporated both dimensions. We added these additional analyses and results to the revised manuscript (see also the response to the above Comment 1).
- Is encoding of conflict similarity in the unidimensional organized space driven by specific requirements of the task or is this a general control strategy? Specifically, is the recruitment of organized space something specific to the task that people are trained to work with stimuli that negatively correlate the spatial Stroop conflict and the Simon conflict?
We argue that this encoding is a general control strategy. In our task design, we asked the participants to respond to the target arrow and ignore the location that appeared randomly for them. So, they were not trained to deal with the stimuli in any certain way. We also found the conflict similarity modulation on CSE did not change with more training (We added this result in Note S3), indicating that the cognitive space did not depend on strategies that could be learned through training.
“Note S3. Modulation of conflict similarity on behavioral CSEs does not change across time We tested if the conflict similarity modulation on the CSE is susceptible to training. We collected the data of Experiment 1 across three sessions, thus it is possible to examine if the conflict similarity modulation effect changes across time. To this end, we added conflict similarity, session and their interaction into a mixed-effect linear model, in which the session was set as a categorical variable. With a post-hoc analysis of variance (ANOVA), we calculated the statistical significance of the interaction term.
This approach was applied to both the RT and ER. Results showed no interaction effect in either RT, F(2,1479) = 1.025, p = .359, or ER, F(2,1479) = 0.789, p = .455. This result suggests that the modulation effect does not change across time."
Instead, the cognitive space should be determined by the intrinsic similarity structure of the task design. A previous study (Freitas et al., 2015) has found that the CSE across different versions of spatial Stroop and flanker tasks was stronger than that across either of the two conflicts and Simon. In their designs, the stimulus similarity was controlled at the same level, so the difference in CSE was only attributable to the similar dimensional overlap between Stroop and flanker tasks, in contrast to the Simon task. Furthermore, recent studies showed that the cognitive space generally exists to represent structured latent states (e.g., Vaidya et al., 2022), mental strategy cost (Grahek et al., 2022), and social hierarchies (Park et al., 2020). Therefore, we argue that cognitive space is likely a universal strategy that can be applied to different scenarios.
We added this argument in the discussion:
“Although the spatial orientation information in our design could be helpful to the construction of cognitive space, the cognitive space itself was independent of the stimulus-level representation of the task. We found the conflict similarity modulation on CSE did not change with more training (see Note S3), indicating that the cognitive space did not depend on strategies that could be learned through training. Instead, the cognitive space should be determined by the intrinsic similarity structure of the task design. For example, a previous study (Freitas et al, 2015) has found that the CSE across different versions of spatial Stroop and flanker tasks was stronger than that across either of the two conflicts and Simon. In their designs, the stimulus similarity was controlled at the same level, so the difference in CSE was only attributable to the similar dimensional overlap between Stroop and flanker tasks, in contrast to the Simon task. Furthermore, recent studies showed that the cognitive space generally exists to represent structured latent states (e.g., Vaidya et al., 2022), mental strategy cost (Grahek et al., 2022), and social hierarchies (Park et al., 2020). Therefore, cognitive space is likely a universal strategy that can be applied to different scenarios."
Reference:
Freitas, A. L., & Clark, S. L. (2015). Generality and specificity in cognitive control: conflict adaptation within and across selective-attention tasks but not across selective-attention and Simon tasks. Psychological Research, 79(1), 143-162.
Vaidya, A. R., Jones, H. M., Castillo, J., & Badre, D. (2021). Neural representation of 1280 abstract task structure during generalization. Elife, 10, 1-26.
Grahek, I., Leng, X., Fahey, M. P., Yee, D., & Shenhav, A. Empirical and 1282 Computational Evidence for Reconfiguration Costs During Within-Task 1283 Adjustments in Cognitive Control. CogSci.
Park, S. A., Miller, D. S., Nili, H., Ranganath, C., & Boorman, E. D. (2020). Map 1285 Making: Constructing, Combining, and Inferring on Abstract Cognitive Maps. 1286 Neuron, 107(6), 1226-1238 e1228. doi:10.1016/j.neuron.2020.06.030
- The observed pattern seems to suggest that there is conflict similarity space that is defined by the combination of the conflict similarity (i.e., the strength of conflicts) and the sources of conflict (i.e., the Simon vs the spatial Stroop). What are the rational reasons to separate conflicts of different sources (beyond detecting incongruence)? And how are they used for better conflict resolutions?
The necessity of separating conflicts of different sources lies in that the spatial Stroop and the Simon effects are resolved with different mechanisms. The behavioral congruency effects of a combined conflict from two different sources were shown to be the summation of the two conflict sources (Liu et al., 2010), suggesting that the conflicts are resolved independently. Moreover, previous studies have shown that different sources of conflict are resolved with different brain regions (Egner, 2008; Li et al., 2017), and at different processing stages (Wang et al., 2013). Therefore, when multiple sources of conflict occur simultaneously or sequentially, it should be more efficient to resolve the conflict by identifying the sources.
We have added this argument to the revised manuscript:
“The rationale behind defining conflict similarity based on combinations of different conflict sources, such as spatial-Stroop and Simon, stems from the evidence that these sources undergo independent processing (Egner, 2008; Li et al., 2014; Liu et al., 2010; Wang et al., 2014). Identifying these distinct sources is critical in efficiently resolving potentially infinite conflicts."
Reference:
Egner, T. (2008). Multiple conflict-driven control mechanisms in the human brain. Trends in Cognitive Sciences, 12(10), 374-380.
Li, Q., Yang, G., Li, Z., Qi, Y., Cole, M. W., & Liu, X. (2017). Conflict detection and 1307 resolution rely on a combination of common and distinct cognitive control networks. Neuroscience and Biobehavioral Reviews, 83, 123-131.
Wang, K., Li, Q., Zheng, Y., Wang, H., & Liu, X. (2014). Temporal and spectral 1310 profiles of stimulus-stimulus and stimulus-response conflict processing. NeuroImage, 89, 280-288.
Liu, X., Park, Y., Gu, X., & Fan, J. (2010). Dimensional overlap accounts for independence and integration of stimulus-response compatibility effects. Attention, Perception, & Psychophysics, 72(6), 1710-1720.
- The congruency effect is larger in conflict type 2, 3, 4 consistently compared to conflict 1 and 5. Are these expected under the hypothesis of unified cognitive space of conflict similarity? Is the pattern of similarity modeled in RSA?
Yes, this is expected. The spatial Stroop and Simon effects have been shown to be additive and independent (Li et al., 2014). Therefore, the congruency effects of conflict type 2, 3 and 4 would be the weighted sum of the spatial Stroop and Simon effects. The weights can be defined by the sine and cosine of the polar angle.
For instance, in Type 2, wy = sin(67.5°) and wx = cos(67.5°). The sum of the two 1321 weight values (i.e., 1.31) is larger than 1, leading to a larger congruency effect than 1322 the pure spatial Stroop (Conf 1) and Simon (Conf 5) conditions.
Note that this hypothesis underlies the Stroop+Simon model, which assumes the Stroop and Simon dimensions are independently represented in the brain and drive the behavior in an additive fashion. Moreover, the observed difference of behavioral congruency effects may have reflected the variance in the Domain-General model, which treats all conflict types as equivalent, with the only difference between each two conflict types in the magnitude of their conflict. Therefore, we did not model the behavioral congruency effects as a covariance regressor in the major RSA. Instead, we conducted a model comparison analysis by comparing these models and the Cognitive-Space model. Results showed worse model fitting of both the Domain-general and Stroop+Simon models. Specially, the regressor of congruency effect difference in the Domain-General model was not significant (p = .575), which also suggests that the higher congruency effect in conflict type 2, 3 and 4 should not influence the Cognitive-Space model results. We have added these methods and results to the revised manuscript (see also our response to Comment 1):
Methods:
“Model comparison and representational dimensionality
To estimate if the right 8C specifically encodes the cognitive space, rather than the domain-general or domain-specific structures, we conducted two more RSAs. We replaced the cognitive space-based conflict similarity matrix in the RSA we reported above (hereafter referred to as the Cognitive-Space model) with one of the alternative model matrices, with all other regressors equal. The domain-general model treats each conflict type as equivalent, so each two conflict types only differ in the magnitude of their conflict. Therefore, we defined the domain-general matrix as the difference in their congruency effects indexed by the group-averaged RT in Experiment 2. Then the z scored model vector was sign-flipped to reflect similarity instead of distance. The domain-specific model treats each conflict type differently, so we used a diagonal matrix, with within-conflict type similarities being 1 and all cross-conflict type similarities being 0.
Moreover, to examine if the cognitive space is driven solely by the Stroop or Simon conflicts, we tested a spatial Stroop-Only (hereafter referred to as “Stroop-Only”) and a Simon-Only model, with each conflict type projected onto the spatial Stroop (vertical) axis or Simon (horizontal) axis, respectively. The similarity between any two conflict types was defined using the Jaccard similarity index (Jaccard, 1901), that is, their intersection divided by their union. We also included a model assuming the Stroop and Simon dimensions are independently represented in the brain, adding up the Stroop Only and Simon-Only regressors. We conducted similar RSAs as reported above, replacing the original conflict similarity regressor with the Strrop-Only, Simon-Only, or both regressors, and then calculated their Bayesian information criterions (BICs)."
Reference:
Li, Q., Nan, W., Wang, K., & Liu, X. (2014). Independent processing of stimulus stimulus and stimulus-response conflicts. PloS One, 9(2), e89249.
- Please clarify the observed patterns of CSE effects in relation to the hypothesis of common cognitive space of conflict. In particular, right 8C shows that the patterns become dissimilar in incongruent trials compared to congruent trials. How does this direction of the effect fit to the common unidimensional cognitive space account? And how does such a representation contribute to the CES effects?
The behavioral CSE patterns provide initial evidence for the cognitive space hypothesis. Previous studies have debated whether cognitive control relies on domain-general or domain-specific representations, with much evidence gathered from behavioral CSE patterns. A significant CSE across two conflict conditions typically suggests domain-general representations of cognitive control, while an absence of CSE suggests domain-specific representations. The cognitive space view proposes that conflict representations are neither purely domain-general nor purely domain-specific, but rather exist on a continuum. This view predicts that the CSE across two conflict conditions should depend on the representational distance between them within this cognitive space. Our finding that CSE values systematically vary with conflict similarity level support this hypothesis. We have added this point in the discussion of the revised manuscript:
“Previous research on this topic often adopts a binary manipulation of conflict(Braem et al., 2014) (i.e., each domain only has one conflict type) and gathered evidence for the domain-general/specific view with presence/absence of CSE, respectively. Here, we parametrically manipulated the similarity of conflict types and found the CSE systematically vary with conflict similarity level, demonstrating that cognitive control is neither purely domain-general nor purely domain-specific, but can be reconciled as a cognitive space(Bellmund et al., 2018) (Fig. 6, middle).
Fig. 4D was plotted to show the steeper slope of the conflict similarity effect for incongruent versus congruent conditions. Note the y-aixs displays z-scored Pearson correlation values, so the grand mean of each condition was 0. The values for the first two similarity levels (level 1 and 2) were lower for incongruent than congruent conditions, seemingly indicating lower average similarity. However, this was not the case. The five similarity levels contained different numbers of data points (see Fig. 1C), so levels 4 and 5 should be weighted more heavily than levels 1 and 2. When comparing the grand mean of raw Pearson correlation values, the incongruent condition (0.0053) showed a tendency toward higher similarity than the congruent condition (0.0040), t(475998) = 1.41, p = .079. We have also plotted another version of Fig. 4D in Fig. S5, in which the raw Pearson correlation values were used.
The greater representation of conflict type in incongruent condition compared to congruent condition (as evidenced by a steeper slope) suggests that the conflict representation was driven by the incongruent condition. This is probably due to the stronger involvement of cognitive control in incongruent condition (than congruent condition), which in turn leads to more distinct patterns across different conflict types. This is consistent with the fact that the congruent condition is typically a baseline, where any conflict related effects should be weaker.
The representation of cognitive space may contribute to the CSE as a mental model. This model allows our brain to evaluate the cost and benefit associated with transitioning between different conflict conditions. When two consecutive trials are characterized by more similar conflict types, their representations in the cognitive space will be closer, resulting in a less costly transition. As a consequence, stronger CSEs are observed. We revised the corresponding discussion part as:
“Similarly, we propose that cognitive space could serve as a mental model to assist fast learning and efficient organization of cognitive control settings. Specifically, the cognitive space representation may provide a principle for how our brain evaluates the expected cost of switching and the benefit of generalization between states and selects the path with the best cost-benefit tradeoff (Abrahamse et al., 2016; Shenhav et al., 2013). The proximity between two states in cognitive space could reflect both the expected cognitive demand required to transition and the useful mechanisms to adapt from. The closer the two conditions are in cognitive space, the lower the expected switching cost and the higher the generalizability when transitioning between them. With the organization of a cognitive space, a new conflict can be quickly assigned a location in the cognitive space, which will facilitate the development of cognitive control settings for this conflict by interpolating nearby conflicts and/or projecting the location to axes representing different cognitive control processes, thus leading to a stronger CSE when following a more similar conflict condition.”
Minor comments:
- Some of the labels of figure axes are unclear (e.g., Fig4C) about what they represent.
In Fig. 4C, the x-axis label is “neural representational strength”, which refers to the beta coefficient of the conflict type effect computed from the main RSA, denoting the strength of the conflict type representation in neural patterns. The y-axis label is “behavioral representational strength”, which refers to the beta coefficient obtained from the behavioral linear model using conflict similarity to predict the CSE in Experiment 2; it reflects how strong the conflict similarity modulates the behavioral 1440 CSE. We apologize for any confusion from the brief axis labels. We have added expanded descriptions to the figure caption of Fig. 4C.
-
eLife assessment
Yang et al. investigate whether distinct sources of conflict are represented in a common cognitive space. The study uses an interesting task that mixes different sources of difficulty and reports that the brain appears to represent these sources as a mixture on a continuum in prefrontal areas. While the findings could be valuable to theory in this area, there are concerns with the analysis, design and results, that raise uncertainty regarding the main conclusion of a shared cognitive space. Thus, the evidence reported here remains incomplete.
-
Reviewer #1 (Public Review):
People can perform a wide variety of different tasks, and a long-standing question in cognitive neuroscience is how the properties of different tasks are represented in the brain. The authors develop an interesting task that mixes two different sources of difficulty, and find that the brain appears to represent this mixture on a continuum, in the prefrontal areas involved in resolving task difficulty. While these results are interesting and in several ways compelling, they overlap with previous findings and rely on novel statistical analyses that may require further validation.
Strengths
1. The authors present an interesting and novel task for combining the contributions of stimulus-stimulus and stimulus-response conflict. While this mixture has been measured in the multi-source interference task (MSIT), …Reviewer #1 (Public Review):
People can perform a wide variety of different tasks, and a long-standing question in cognitive neuroscience is how the properties of different tasks are represented in the brain. The authors develop an interesting task that mixes two different sources of difficulty, and find that the brain appears to represent this mixture on a continuum, in the prefrontal areas involved in resolving task difficulty. While these results are interesting and in several ways compelling, they overlap with previous findings and rely on novel statistical analyses that may require further validation.
Strengths
1. The authors present an interesting and novel task for combining the contributions of stimulus-stimulus and stimulus-response conflict. While this mixture has been measured in the multi-source interference task (MSIT), this task provides a more graded mixture between these two sources of difficulty.2. The authors do a good job triangulating regions that encoding conflict similarity, looking for the conjunction across several different measures of conflict encoding. These conflict measures use several best-practice approaches towards estimating representational similarity.
3. The authors quantify several salient alternative hypothesis and systematically distinguish their core results from these alternatives.
4. The question that the authors tackle is important to cognitive control, and they make a solid contribution.
Concerns
1. The evidence from this previous work for mixtures between different conflict sources makes the framing of 'infinite possible types of conflict' feel like a strawman. The authors cite classic work (e.g., Kornblum et al., 1990) that develops a typology for conflict which is far from infinite. I think few people would argue that every possible source and level of difficulty will have to be learned separately. This work provides confirmatory evidence that task difficulty is represented parametrically (e.g., consistent with the n-back, MOT, and random dot motion literature).2. The degree of Stroop vs Simon conflict is perfectly negatively correlated across conditions. This limits their interpretation of an integrated cognitive space, as they cannot separately measure Stroop and Simon effects. The author's control analyses have limited ability to overcome this task limitation. While these results are consistent with parametric encoding, they cannot adjudicate between combined vs separated representations.
-
Reviewer #2 (Public Review):
This study examines the construct of "cognitive spaces" as they relate to neural coding schemes present in response conflict tasks. The authors use a novel experimental design in which different types of response conflict (spatial Stroop, Simon) are parametrically manipulated. These conflict types are hypothesized to be encoded jointly, within an abstract "cognitive space", in which distances between task conditions depend only on the similarity of conflict types (i.e., where conditions with similar relative proportions of spatial-Stroop versus Simon conflicts are represented with similar activity patterns). Authors contrast such a representational scheme for conflict with several other conceptually distinct schemes, including a domain-general, domain-specific, and two task-specific schemes. The authors …
Reviewer #2 (Public Review):
This study examines the construct of "cognitive spaces" as they relate to neural coding schemes present in response conflict tasks. The authors use a novel experimental design in which different types of response conflict (spatial Stroop, Simon) are parametrically manipulated. These conflict types are hypothesized to be encoded jointly, within an abstract "cognitive space", in which distances between task conditions depend only on the similarity of conflict types (i.e., where conditions with similar relative proportions of spatial-Stroop versus Simon conflicts are represented with similar activity patterns). Authors contrast such a representational scheme for conflict with several other conceptually distinct schemes, including a domain-general, domain-specific, and two task-specific schemes. The authors conduct a behavioral and fMRI study to test which of these coding schemes is used by prefrontal cortex. Replicating the authors' prior work, this study demonstrates that sequential behavioral adjustments (the congruency sequence effect) are modulated as a function of the similarity between conflict types. In fMRI data, univariate analyses identified activation in left prefrontal and dorsomedial frontal cortex that was modulated by the amount of Stroop or Simon conflict present, and representational similarity analyses (RSA) that identified coding of conflict similarity, as predicted under the cognitive space model, in right lateral prefrontal cortex.
This study tackles an important question regarding how distinct types of conflict might be encoded in the brain within a computationally efficient representational format. The ideas postulated by the authors are interesting ones and the statistical methods are generally rigorous. The evidence supporting the authors claims, however, is limited by confounds in the experimental design and by lack of clarity in reporting the testing of alternative hypotheses within the method and results.
(1) Model comparison
The authors commendably performed a model comparison within their study, in which they formalized alternative hypotheses to their cognitive space hypothesis. We greatly appreciate the motivation for this idea and think that it strengthened the manuscript. Nevertheless, some details of this model comparison were difficult for us to understand, which in turn has limited our understanding of the strength of the findings.
The text indicates the domain-general model was computed by taking the difference in congruency effects per conflict condition. Does this refer to the "absolute difference" between congruency effects? In the rest of this review, we assume that the absolute difference was indeed used, as using a signed difference would not make sense in this setting. Nevertheless, it may help readers to add this information to the text.
Regarding the Stroop-Only and Simon-Only models, the motivation for using the Jaccard metric was unclear. From our reading, it seems that all of the other models --- the cognitive space model, the domain-general model, and the domain-specific model --- effectively use a Euclidean distance metric. (Although the cognitive space model is parameterized with cosine similarities, these similarity values are proportional to Euclidean distances because the points all lie on a circle. And, although the domain-general model is parameterized with absolute differences, the absolute difference is equivalent to Euclidean distance in 1D.) Given these considerations, the use of Jaccard seems to differ from the other models, in terms of parameterization, and thus potentially also in terms of underlying assumptions. Could authors help us understand why this distance metric was used instead of Euclidean distance? Additionally, if Jaccard must be used because this metric seems to be non-standard in the use of RSA, it would likely be helpful for many readers to give a little more explanation about how it was calculated.
When considering parameterizing the Stroop-Only and Simon-Only models with Euclidean distances, one concern we had is that the joint inclusion of these models might render the cognitive space model unidentifiable due to collinearity (i.e., the sum of the Stroop-Only and Simon-Only models could be collinear with the cognitive space model). Could the authors determine whether this is the case? This issue seems to be important, as the presence of such collinearity would suggest to us that the design is incapable of discriminating those hypotheses as parameterized.
(2) Issue of uniquely identifying conflict coding
We certainly appreciate the efforts that authors have taken to address potential confounders for encoding of conflict in their original submission. We broach this question not because we wish authors to conduct additional control analyses, but because this issue seems to be central to the thesis of the manuscript and we would value reading the authors' thoughts on this issue in the discussion.
To summarize our concerns, conflict seems to be a difficult variable to isolate within aggregate neural activity, at least relative to other variables typically studied in cognitive control, such as task-set or rule coding. This is because it seems reasonable to expect that many more nuisance factors covary with conflict --- such as univariate activation, level of cortical recruitment, performance measures, arousal --- than in comparison with, for example, a well-designed rule manipulation. Controlling for some of these factors post-hoc through regression is commendable (as authors have done here), but such a method will likely be incomplete and can provide no guarantees on the false positive rate.
Relatedly, the neural correlates of conflict coding in fMRI and other aggregate measures of neural activity are likely of heterogeneous provenance, potentially including rate coding (Fu et al., 2022), temporal coding (Smith et al., 2019), modulation of coding of other more concrete variables (Ebitz et al., 2020, 10.1101/2020.03.14.991745; see also discussion and reviews of Tang et al., 2016, 10.7554/eLife.12352), or neuromodulatory effects (e.g., Aston-Jones & Cohen, 2005). Some of these origins would seem to be consistent with "explicit" coding of conflict (conflict as a representation), but others would seem to be more consistent with epiphenomenal coding of conflict (i.e., conflict as an emergent process). Again, these concerns could apply to many variables as measured via fMRI, but at the same time, they seem to be more pernicious in the case of conflict. So, if authors consider these issues to be germane, perhaps they could explicitly state in the discussion whether adopting their cognitive space perspective implies a particular stance on these issues, how they interpret their results with respect to these issues, and if relevant, qualify their conclusions with uncertainty on these issues.
(3) Interpretation of measured geometry in 8C
We appreciate the inclusion of the measured similarity matrices of area 8C, the key area the results focus on, to the supplemental, as this allows for a relatively model-agnostic look at a portion of the data. Interestingly, the measured similarity matrix seems to mismatch the cognitive space model in a potentially substantive way. Although the model predicts that the "pure" Stroop and Simon conditions will have maximal self-similarity (i.e., the Stroop-Stroop and Simon-Simon cells on the diagonal), these correlations actually seem to be the lowest, by what appears to be a substantial margin (particularly the Stroop-Stroop similarities). What should readers make of this apparent mismatch? Perhaps authors could offer their interpretation on how this mismatch could fit with their conclusions.
-
Reviewer #3 (Public Review):
Yang and colleagues investigated whether information on two task-irrelevant features that induce response conflict is represented in a common cognitive space. To test this, the authors used a task that combines the spatial Stroop conflict and the Simon effect. This task reliably produces a beautiful graded congruency sequence effect (CSE), where the cost of congruency is reduced after incongruent trials. The authors measured fMRI to identify brain regions that represent the graded similarity of conflict types, the congruency of responses, and the visual features that induce conflicts. They applied univariate, multivariate, and connectivity analyses to fMRI data to identify brain regions that represent the graded similarity of conflict types, the congruency of responses, and the visual features that induce …
Reviewer #3 (Public Review):
Yang and colleagues investigated whether information on two task-irrelevant features that induce response conflict is represented in a common cognitive space. To test this, the authors used a task that combines the spatial Stroop conflict and the Simon effect. This task reliably produces a beautiful graded congruency sequence effect (CSE), where the cost of congruency is reduced after incongruent trials. The authors measured fMRI to identify brain regions that represent the graded similarity of conflict types, the congruency of responses, and the visual features that induce conflicts. They applied univariate, multivariate, and connectivity analyses to fMRI data to identify brain regions that represent the graded similarity of conflict types, the congruency of responses, and the visual features that induce conflicts. They further directly assessed the dimensionality of represented conflict space.
The authors identified the right dlPFC (right 8C), which shows 1) stronger encoding of graded similarity of conflicts in incongruent trials and 2) a positive correlation between the strength of conflict similarity type and the CSE on behavior. The dlPFC has been shown to be important for cognitive control tasks. As the dlPFC did not show a univariate parametric modulation based on the higher or lower component of one type of conflict (e.g., having more spatial Stroop conflict or less Simon conflict), it implies that dissimilarity of conflicts is represented by a linear increase or decrease of neural responses. Therefore, the similarity of conflict is represented in multivariate neural responses that combine two sources of conflict.
The strength of the current approach lies in the clear effect of parametric modulation of conflict similarity across different conflict types. The authors employed a clever cross-subject RSA that counterbalanced and isolated the targeted effect of conflict similarity, decorrelating orientation similarity of stimulus positions that would otherwise be correlated with conflict similarity. A pattern of neural response seems to exist that maps different types of conflict, where each type is defined by the parametric gradation of the yoked spatial Stroop conflict and the Simon conflict on a similarity scale. The similarity of patterns increases in incongruent trials and is correlated with CSE modulation of behavior.
The main significance of the paper lies in the evidence supporting the use of an organized "cognitive space" to represent conflict information as a general control strategy. The authors thoroughly test this idea using multiple approaches and provide convincing support for their findings. However, the universality of this cognitive strategy remains an open question.
The task presented in the study involved two sources of conflict information through a single salient visual input, which might have encouraged the utilization of a common space. The similarity space was analyzed at the level of between-individuals (i.e., cross-subject RSA) to mitigate potential confounds in the design, such as congruency and the orientation of stimulus positions. This approach makes it challenging to establish a direct link between the quality of conflict space representation and the patterns of behavioral adaptations within individuals.
Furthermore, it remains unclear at which cognitive stages during response selection such a unified space is recruited. Can we effectively map any sources of conflict into a single scale? Is this unified space adaptively adjusted within the same brain region? Additionally, does the amount of conflict solely define the dimensions of this unified space across many conflict-inducing tasks? These questions remain open for future studies to address.
Taken together, this study presents an exciting possibility that information requiring high levels of cognitive control could be flexibly mapped into cognitive map-like representations that both benefit and bias our behavior. Further characterization of the representational geometry and generalization of the current results look promising ways to understand representations for cognitive control.
-
-
eLife assessment
Yang et al. investigate whether distinct sources of conflict are represented in a common cognitive space. The study uses an interesting task that mixes two different sources of difficulty and reports that the brain appears to represent these sources as a mixture on a continuum, in the prefrontal areas involved in resolving task difficulty. While these results are useful, they overlap with previous findings, leave open several design and logical concerns, and rely on novel statistical analyses that may require further validation, so they are currently incomplete.
-
Reviewer #1 (Public Review):
People can perform a wide variety of different tasks, and a long-standing question in cognitive neuroscience is how the properties of different tasks are represented in the brain. The authors develop an interesting task that mixes two different sources of difficulty, and find that the brain appears to represent this mixture on a continuum, in the prefrontal areas involved in resolving task difficulty. While these results are interesting and in several ways compelling, they overlap with previous findings and rely on novel statistical analyses that may require further validation.
Strengths
1. The authors present an interesting and novel task for combining the contributions of stimulus-stimulus and stimulus-response conflict. While this mixture has been measured in the multi-source interference task (MSIT), …Reviewer #1 (Public Review):
People can perform a wide variety of different tasks, and a long-standing question in cognitive neuroscience is how the properties of different tasks are represented in the brain. The authors develop an interesting task that mixes two different sources of difficulty, and find that the brain appears to represent this mixture on a continuum, in the prefrontal areas involved in resolving task difficulty. While these results are interesting and in several ways compelling, they overlap with previous findings and rely on novel statistical analyses that may require further validation.
Strengths
1. The authors present an interesting and novel task for combining the contributions of stimulus-stimulus and stimulus-response conflict. While this mixture has been measured in the multi-source interference task (MSIT), this task provides a more graded mixture between these two sources of difficulty2. The authors do a good job triangulating regions that encoding conflict similarity, looking for the conjunction across several different measures of conflict encoding
3. The authors quantify several salient alternative hypothesis and systematically distinguish their core results from these alternatives
4. The question that the authors tackle is of central theoretical importance to cognitive control, and they make an interesting an interesting contribution to this question
Concerns
1. It's not entirely clear what the current task can measure that is not known from the MSIT, such as the additive influence of conflict sources in Fu et al. (2022), Science. More could be done to distinguish the benefits of this task from MSIT.2. The evidence from this previous work for mixtures between different conflict sources make the framing of 'infinite possible types of conflict' feel like a strawman. The authors cite classic work (e.g., Kornblum et al., 1990) that develops a typology for conflict which is far from infinite, and I think few people would argue that every possible source of difficulty will have to be learned separately. Such an issue is addressed in theories like 'Expected Value of Control', where optimization of control policies can address unique combinations of task demands.
3. Wouldn't a region that represented each conflict source separately still show the same pattern of results? The degree of Stroop vs Simon conflict is perfectly negatively correlated across conditions, so wouldn't a region that *just* tracks Stoop conflict show these RSA patterns? The authors show that overall congruency is not represented in DLPFC (which is surprising), but they don't break it down by whether this is due to Stroop or Simon congruency (I'm not sure their task allows for this).
4. The authors use a novel form of RSA that concatenates patterns across conditions, runs and subjects into a giant RSA matrix, which is then used for linear mixed effects analysis. This appears to be necessary because conflict type and visual orientation are perfectly confounded within the subject (although, if I understand, the conflict type x congruence interaction wouldn't have the same concern about visual confounds, which shouldn't depend on congruence). This is an interesting approach but should be better justified, preferably with simulations validating the sensitivity and specificity of this method and comparing it to more standard methods.
A chief concern is that the same pattern contributes to many entries in the DV, which has been addressed in previous work using row-wise and column-wise random effects (Chen et al., 2017, Neuroimage). It would also be informative to know whether the results hold up to removing within-run similarity, which can bias similarity measures (Walther et al., 2016, Neuroimage).
Another concern is the extent to which across-subject similarity will only capture consistent patterns across people, making this analysis very similar to a traditional univariate analysis (and unlike the traditional use of RSA to capture subject-specific patterns).
5. Finally, the authors should confirm all their results are robust to less liberal methods of multiplicity correction. For univariate analysis, they should report the effects from the standard p < .001 cluster forming threshold for univariate analysis (or TFCE). For multivariate analyses, FDR can be quite liberal. The authors should consider whether their mixed-effects analyses allow for group-level randomization, and consider (relatively powerful) Max-Stat randomization tests (Nichols & Holmes, 2002, Hum Brain Mapp).
-
Reviewer #2 (Public Review):
Summary, general appraisal
This study examines the construct of "cognitive spaces" as they relate to neural coding schemes present in response conflict tasks. The authors utilize a novel paradigm, in which subjects must map the direction of a vertically oriented arrow to either a left or right response. Different types of conflict (spatial Stroop, Simon) are parametrically manipulated by varying the spatial location of the arrow (a task-irrelevant feature). The vertical eccentricity of the arrow either agrees or conflicts with the arrow's direction (spatial Stroop), while the horizontal eccentricity of the arrow agrees or conflicts with the side of the response (Simon). A neural coding model is postulated in which the stimuli are embedded in a cognitive space, organized by distances that depend only on the …
Reviewer #2 (Public Review):
Summary, general appraisal
This study examines the construct of "cognitive spaces" as they relate to neural coding schemes present in response conflict tasks. The authors utilize a novel paradigm, in which subjects must map the direction of a vertically oriented arrow to either a left or right response. Different types of conflict (spatial Stroop, Simon) are parametrically manipulated by varying the spatial location of the arrow (a task-irrelevant feature). The vertical eccentricity of the arrow either agrees or conflicts with the arrow's direction (spatial Stroop), while the horizontal eccentricity of the arrow agrees or conflicts with the side of the response (Simon). A neural coding model is postulated in which the stimuli are embedded in a cognitive space, organized by distances that depend only on the similarity of congruency types (i.e., where conditions with similar relative proportions of spatial-Stroop versus Simon congruency are represented with similar activity patterns). The authors conduct a behavioral and fMRI study to provide evidence for such a representational coding scheme. The behavioral findings replicate the authors' prior work in demonstrating that conflict-related cognitive control adjustments (the congruency sequence effect) shows strong modulation as a function of the similarity between conflict types. With the fMRI neural activity data, the authors report univariate analyses that identified activation in left prefrontal and dorsomedial frontal cortex modulated by the amount of Stroop or Simon conflict present, and multivariate representational similarity analyses (RSA) that identified right lateral prefrontal activity encoding conflict similarity and correlated with the behavioral effects of conflict similarity.
This study tackles an important question regarding how distinct types of conflict, which have been previously shown to elicit independent forms of cognitive control adjustments, might be encoded in the brain within a computationally efficient representational format. The ideas postulated by the authors are interesting ones and the utilized methods are rigorous. However, the study has critical limitations that are due to a lack of clarity regarding theoretical hypotheses, serious confounds in the experimental design, and a highly non-standard (and problematic) approach to RSA. Without addressing these issues it is hard to evaluate the contribution of the authors findings to the computational cognitive neuroscience literature.The primary theoretical question and its implications are unclear.
The paper would greatly benefit from more clearly specifying potential alternative hypotheses and discussing their implications. Consider, for example, the case of parallel conflict monitors. Say that these conflict monitors are separately tuned for Stroop and Simon conflict, and are located within adjacent patches of cortex that are both contained within a single cortical parcel (e.g., as defined by the Glasser atlas used by the authors for analyses). If RSA was conducted on the responses of such a parcel to this task, it seems highly likely that an activation similarity matrix would be observed that is quite similar (if not identical) to the hypothesized one displayed in Figure 1. Yet it would seem like the authors are arguing that the "cognitive space" representation is qualitatively and conceptually distinct from the "parallel monitor" coding scheme. Thus, it seems that the task and analytic approach is not sufficient to disambiguate these different types of coding schemes or neural architectures.
The authors also discuss a fully domain-general conflict monitor, in which different forms of conflict are encoded within a single dimension. Yet this alternative hypothesis is also not explicitly tested nor discussed in detail. It seems that the experiment was designed to orthogonalize the "domain-general" model from the "cognitive space" model, by attempting to keep the overall conflict uniform across the different stimuli (i.e., in the design, the level of Stroop congruency parametrically trades off with the level of Simon congruency). But in the behavioral results (Fig. S1), the interference effects were found to peak when both Stroop and Simon congruency are present (i.e., Conf 3 and 4), suggesting that the "domain-general" model may not be orthogonal to the "cognitive space" model. One of the key advantages of RSA is that it provides the ability to explicitly formulate, test and compare different coding models to determine which best accounts for the pattern of data. Thus, it would seem critical for the authors to set up the design and analyses so that an explicit model comparison analysis could be conducted, contrasting the domain-general, domain-specific, and cognitive space accounts.
Relatedly, the reasoning for the use of the term "cognitive space" is unclear. The mere presence of graded coding for two types of conflict seems to be a low bar for referring to neural activity patterns as encoding a "cognitive space". It is discussed that cognitive spaces/maps allow for flexibility through inference and generalization. But no links were made between these cognitive abilities and the observed representational structure. Additionally, no explicit tests of generality (e.g., via cross-condition generalization) were provided. Finally, although the design elicits strong CSE effects, it seems somewhat awkward to consider CSE behavioral patterns as a reflection of the kind of abilities supported by a cognitive map (if this is indeed the implication that was intended). In fact, CSE effects are well-modeled by simpler "model-free" associative learning processes, that do not require elaborate representations of abstract structures.More generally, it seems problematic that Stroop and Simon conflict in the paradigm parametrically trade-off against each other. A more powerful design would have de-confounded Stroop and Simon conflict so that each could be separately estimation via (potentially orthogonal) conflict axes. Additionally, incorporating more varied stimulus sets, locations, or responses might have enabled various tests of generality, as implied by a cognitive space account.
Serious confounds in the design render the results difficult to interpret.
As much prior neuroimaging and behavioral work has established, "conflict" per se is perniciously correlated with many conceptually different variables. Consequently, it is very difficult to distinguish these confounding variables within aggregate measures of neural activity like fMRI. For example, conflict is confounded with increased time-on-task with longer RT, as well as conflict-driven increases in coding of other task variables (e.g., task-set related coding; e.g., Ebitz et al. 2020 bioRxiv). Even when using much higher resolution invasive measures than fMRI (i.e., eCoG), researchers have rightly been wary of making strong conclusions about explicit encoding of conflict (Tang et al, 2019; eLife). As such, the researchers would do well to be quite cautious and conservative in their analytic approach and interpretation of results.
This issue is most critical in the interpretation of the fMRI results as reflecting encoding of conflict types. A key limitation of the design, that is acknowledged by the authors is that conflict is fully confounded within-subject by spatial orientation. Indeed, the limited set of stimulus-response mappings also cast doubt on the underlying factors that give rise to the CSE modulations observed by the authors in their behavioral results. The CSE modulations are so strong - going from a complete absence of current x previous trial-type interaction in the cos(90) case all the way to a complete elimination of any current trial conflict when the prior trial was incongruent in the cos(0) case - that they cause suspicion that they are actually driven by conflict-related control adjustments rather than sequential dependencies in the stimulus-response mappings that can be associatively learned.
To their credit, the authors recognize this confound, and attempt to address it analytically through the use of a between-subject RSA approach. Yet the solution is itself problematic, because it doesn't actually deconfound conflict from orientation. In particular, the RSA model assumes that whatever components of neural activity encode orientation produce this encoding within the same voxel-level patterns of activity in each subject. If they are not (which is of course likely), then orthogonalization of these variables will be incomplete. Similar issues underlie the interpretation target/response and distractor coding. Given these issues, perhaps zooming out to a larger spatial scale for the between-subject RSA might be warranted. Perhaps whole-brain at the voxel level with a high degree of smoothing, or even whole-brain at the parcel level (averaging per parcel). For this purpose, Schaefer atlas parcels might be more useful than Glasser, as they more strongly reflect functional divisions (e.g., motor strip is split into mouth/hand divisions; visual cortex is split into central/peripheral visual field divisions). Similarly, given the lateralization of stimuli, if a within-parcel RSA is going to be used, it seems quite sensible to pool voxels across hemispheres (so effectively using 180 parcels instead of 360).
The strength of the results is difficult to interpret due to the non-standard analysis method.
The use of a mixed-level modeling approach to summarize the empirical similarity matrix is an interesting idea, but nevertheless is highly non-standard within RSA neuroimaging methods. More importantly, the way in which it was implemented makes it potentially vulnerable to a high degree of inaccuracy or bias. In this case, this bias is likely to be overly optimistic (high false positive rate).
A key source of potential bias comes from the fact that the off-diagonal cells are not independent (e.g., the correlation between subject A and B is strongly dependent on the correlation between subject A and C). For appropriate degrees of freedom calculation, the model must take this into account somehow. As fitted, the current models do not seem to handle this appropriately. That being said, it may be possible to devise an appropriate test via mixed-level models. In fact, Chen et al. have a series of three recent Neuroimage articles that extensively explore this question (all entitled "Untangling the relatedness among correlations") - adopting one of the methods described in the papers, seems much safer, if possible.
Another potential source of bias is in treating the subject-level random effect coefficients (as predicted by the mixed-level model) as independent samples from a random variable (in the t-tests). The more standard method for inference would be to use test statistics derived from the mixed-model fixed effects, as those have degrees of freedom calculations that are calibrated based on statistical theory.
No numerical or formal defense was provided for this mixed-level model approach. As a result, the use of this method seems quite problematic, as it renders the strength of the observed results difficult to interpret. Instead, the authors are encouraged using a previously published method of conducting inference with between-subject RSA, such as the bootstrapping methods illustrated in Kragel et al. (2018; Nat Neurosci), or in potentially adopting one of the Chen et al. methods mentioned above, that have been extensively explored in terms of statistical properties.
-
Reviewer #3 (Public Review):
Yang and colleagues investigated whether information on two task-irrelevant features that induce response conflict is represented in a common cognitive space. To test this, the authors used a task that combines the spatial Stroop conflict and the Simon effect. This task reliably produces a beautiful graded congruency sequence effect (CSE), where the cost of congruency is reduced after incongruent trials. The authors measured fMRI to identify brain regions that represent the graded similarity of conflict types, the congruency of responses, and the visual features that induce conflicts.
Using several theory-driven exclusion criteria, the authors identified the right dlPFC (right 8C), which shows 1) stronger encoding of graded similarity of conflicts in incongruent trials and 2) a positive correlation between …
Reviewer #3 (Public Review):
Yang and colleagues investigated whether information on two task-irrelevant features that induce response conflict is represented in a common cognitive space. To test this, the authors used a task that combines the spatial Stroop conflict and the Simon effect. This task reliably produces a beautiful graded congruency sequence effect (CSE), where the cost of congruency is reduced after incongruent trials. The authors measured fMRI to identify brain regions that represent the graded similarity of conflict types, the congruency of responses, and the visual features that induce conflicts.
Using several theory-driven exclusion criteria, the authors identified the right dlPFC (right 8C), which shows 1) stronger encoding of graded similarity of conflicts in incongruent trials and 2) a positive correlation between the strength of conflict similarity type and the CSE on behavior. The dlPFC has been shown to be important for cognitive control tasks. As the dlPFC did not show a univariate parametric modulation based on the higher or lower component of one type of conflict (e.g., having more spatial Stroop conflict or less Simon conflict), it implies that dissimilarity of conflicts is represented by a linear increase or decrease of neural responses. Therefore, the similarity of conflict is represented in multivariate neural responses that combine two sources of conflict.
The strength of the current approach lies in the clear effect of parametric modulation of conflict similarity across different conflict types. The authors employed a clever cross-subject RSA that counterbalanced and isolated the targeted effect of conflict similarity, decorrelating orientation similarity of stimulus positions that would otherwise be correlated with conflict similarity. A pattern of neural response seems to exist that maps different types of conflict, where each type is defined by the parametric gradation of the yoked spatial Stroop conflict and the Simon conflict on a similarity scale. The similarity of patterns increases in incongruent trials and is correlated with CSE modulation of behavior. However, several potential caveats need to be considered.
One caveat to consider is that the main claim of recruitment of an organized "cognitive space" for conflict representation is solely supported by the exclusion criteria mentioned earlier. To further support the involvement of organized space in conflict representation, other pieces of evidence need to be considered. One approach could be to test the accuracy of out-of-sample predictions to examine the continuity of the space, as commonly done in studies on representational spaces of sensory information. Another possible approach could involve rigorously testing the geometric properties of space, rather than fitting RSM to all conflict types. For instance, in Fig 6, both the organized and domain-specific cognitive maps would similarly represent the similarity of conflict types expressed in Fig1c (as evident from the preserved order of conflict types). The RSM suggests a low-dimensional embedding of conflict similarity, but the underlying dimension remains unclear.
Another important factor to consider is how learning within the confined task space, which always negatively correlates the two types of conflicts within each subject, may have influenced the current results. Is statistical dependence of conflict information necessary to use the organized cognitive space to represent conflicts from multiple sources? Answering this question would require a paradigm that can adjust multiple sources of conflicts parametrically and independently. Investigating such dependencies is crucial in order to better understand the adaptive utility of the observed cognitive space of conflict similarity.
Taken together, this study presents an exciting possibility that information requiring high levels of cognitive control could be flexibly mapped into cognitive map-like representations that both benefit and bias our behavior. Further characterization of the representational geometry and generalization of the current results look promising ways to understand representations for cognitive control.
-
