Antipsychotic drugs selectively decorrelate long-range interactions in deep cortical layers
Curation statements for this article:-
Curated by eLife

eLife assessment
This important study uses calcium imaging in mice to advance our understanding of the effect of antipsychotic drugs on neural functioning. The evidence supporting the conclusions is convincing, and this work will be of interest to neuroscientists working on visual processing and psychosis researchers.
This article has been Reviewed by the following groups
Discuss this preprint
Start a discussion What are Sciety discussions?Listed in
- Evaluated articles (eLife)
Abstract
Psychosis is characterized by a diminished ability of the brain to distinguish externally driven activity patterns from self-generated activity patterns. Antipsychotic drugs are a class of small molecules with relatively broad binding affinity for a variety of neuromodulator receptors that, in humans, can prevent or ameliorate psychosis. How these drugs influence the function of cortical circuits, and in particular their ability to distinguish between externally and self-generated activity patterns, is still largely unclear. To have experimental control over self-generated sensory feedback, we used a virtual reality environment in which the coupling between movement and visual feedback can be altered. We then used widefield calcium imaging to determine the cell type-specific functional effects of antipsychotic drugs in mouse dorsal cortex under different conditions of visuomotor coupling. By comparing cell type-specific activation patterns between locomotion onsets that were experimentally coupled to self-generated visual feedback and locomotion onsets that were not coupled, we show that deep cortical layers were differentially activated in these two conditions. We then show that the antipsychotic drug clozapine disrupted visuomotor integration at locomotion onsets also primarily in deep cortical layers. Given that one of the key components of visuomotor integration in cortex is long-range cortico-cortical connections, we tested whether the effect of clozapine was detectable in the correlation structure of activity patterns across dorsal cortex. We found that clozapine as well as two other antipsychotic drugs, aripiprazole and haloperidol, resulted in a strong reduction in correlations of layer 5 activity between cortical areas and impaired the spread of visuomotor prediction errors generated in visual cortex. Our results are consistent with the interpretation that a major functional effect of antipsychotic drugs is a selective alteration of long-range layer 5-mediated communication.
Article activity feed
-

-
-
-

-
Author Response
The following is the authors’ response to the previous reviews.
Reviewer #1 (Recommendations For The Authors):
Revised manuscript
The authors have addressed most of my points, but I still have one outstanding concern about the statistics:
My Original Question:
I have a few concerns and questions that I would like to see addressed: 1) Figure 1L - the statistics are a little unusual here as the errors are across visual areas rather than across mice or hemispheres. This isn't ideal as ideally, we want to generalize the results across animals, not areas, and the results seem to be driven mostly by V1/RSC. I would like to see comparisons using mice as the statistical unit either in an ANOVA with areas as factors or post-hoc comparisons per area.
Author Reply:
Based on the assumption that visual cortex should …
Author Response
The following is the authors’ response to the previous reviews.
Reviewer #1 (Recommendations For The Authors):
Revised manuscript
The authors have addressed most of my points, but I still have one outstanding concern about the statistics:
My Original Question:
I have a few concerns and questions that I would like to see addressed: 1) Figure 1L - the statistics are a little unusual here as the errors are across visual areas rather than across mice or hemispheres. This isn't ideal as ideally, we want to generalize the results across animals, not areas, and the results seem to be driven mostly by V1/RSC. I would like to see comparisons using mice as the statistical unit either in an ANOVA with areas as factors or post-hoc comparisons per area.
Author Reply:
Based on the assumption that visual cortex should respond to visual stimuli, we would have expected to find a difference between closed and open loop locomotion onset responses in all cell types in visual areas of cortex (a closed loop locomotion onset being the combination of locomotion and visual flow onset, while an open loop locomotion onset lacks the visual flow component). Thus, the first surprise was that in most cell types we found very little difference between these two locomotion onset types. Conversely, in Tlx3-positive L5 IT neurons the difference was apparent well outside of the visual areas of cortex (even though the difference was indeed strongest in V1/RSC). To quantify the extent to which closed and open loop locomotion onsets result in different activity patterns across dorsal cortex we performed the analyses shown in Figures 1L and 2. To make the point that the effect was observable on average across cortical areas, we used cortical area as a unit in Figure 1L. We have added the analysis shown in Figure 1L with mice as the statistical unit as Figure S4J and have added the ANOVA information to Table S1, as suggested.
My revised question:
The authors have only partially addressed my concerns here. I disagree with the authors that they were making a point about the effect being observable across visual areas. The primary statistical statement they are trying to make is that the similarity between open and closed-loop stimulation is different for Tlx mice, e.g. Line 122: "However, comparing locomotion onsets in mice that expressed GCaMP6 only in Tlx3 positive L5 IT neurons, we found that the activation pattern was strikingly different between closed and open loop conditions" and Line 172-3: "Thus, excitatory neurons of deep cortical layers exhibited the strongest differences between closed and open loop locomotion related activation". These statements are not correctly supported by the statistical analysis as presented in Figure 1L as it is the variability across mice that is relevant to draw this conclusion.
In the example "However, comparing locomotion onsets in mice that expressed GCaMP6 only in Tlx3 positive L5 IT neurons, we found that the activation pattern was strikingly different between closed and open loop conditions (Figure 1D)" we talk about the example mouse shown. We have not changed phrasing here.
We have, however, changed the way we talk about Figure 1L and S4J (the second example given by the reviewer), and have rephrased much of this paragraph. Please note, we have also changed Figure S4J to quantify the difference only for V1.
This is partially addressed by Figure S4J where the authors show standard-errors across mice and report statistics across mice. In Table S1 the statistical test is reported to be a bootstrap test with mice as the statistical unit, however, according to line 985 this was a non-hierarchical bootstrap test. Does this mean that the authors resampled onsets without regard to which mouse they came from to regenerate the response-curves and recalculate the correlation coefficient? Or did they directly resample from the distribution of correlation coefficient values? I suspect the latter, but for some comparisons (e.g. Tlx3 vs PV) there are only two mice in one group, yielding two correlation coefficients, and resampling 2 values 10,000 times would lead to very biased statistics. Either way the approach is far from ideal. There is also no protection against multiple-comparisons in these tests.
We have adapted Figure S4J to include only V1, where we find the largest effect (the text is adapted to reflect this) and have added individual data points as suggested in the following comment. The reviewer is correct that we created a bootstrap distribution by resampling correlation values. This means we are resampling 2, 3, 4, 6, 7, or 14 values depending on the comparison. This should now be clearer in the text. We agree that this is not ideal, but when using mice as a statistical unit, analysis is almost always underpowered. To the best of our knowledge, bootstrap resampling is the best approach to alleviate this problem. Regarding the concern for multiple comparisons: We have now adjusted the significance threshold in Figures 1L and S4J by dividing through the number of groups (here: 9 genotypes).
The ANOVA reported in Table S1 for Figure S4J isn't described in the methods so I can't say what they did and it doesn't seem to be referred to in the text and is non-significant in any case. Figure S4J also only shows summary statistics whereas individual mice should be plotted. The correct statistical test is either a one-way ANOVA with one factor (genotype) with post-hoc tests between the Tlx3 genotype and the others with suitable multiple-comparisons corrections (this may be the non-significant test in table S1). Alternatively, a linear mixed effects model with Genotype as a fixed effect and Mouse as a random intercept term. This approach is more powerful as it would allow them to use data from all locomotion onsets, but it may struggle to fit datasets with only 2 members for certain genotypes. If they wish to make the more extended point that the pattern across visual areas differs between Tlx3 and other mice they could include 'Area' as another (fixed) factor in the design and look for an interaction with Genotype.
The ANOVA was indeed a one-way ANOVA with one factor. We have added this information to the methods. As suggested, we have added individual data points to Figure S4J.
I also agree with the other reviewers that the presentation of standard-errors in Figures 1F-K and elsewhere is somewhat misleading as these are s.e.m. across onsets without taking into account the hierarchical nature of the data. Across mice s.e.m. would give a more accurate view of the variability in the data across the population. I also understand that first averaging across onsets within mice before taking a grand-average throws away a lot of data and s.e.m.s will be considerably larger. The authors should consider linear mixed effects models as an optimal solution for estimating s.e.m. If this is not feasible then the authors could consider showing data from individual mice in a supplementary figure or at least reporting the number of onsets that came from each mouse.
We have now changed all plots in which we show time course data of widefield calcium imaging to show a hierarchical bootstrap estimate of mean and 90% confidence interval of the mean estimate.
Reviewer #2 (Recommendations For The Authors):
Congratulations to the authors on the revision! The revised article has substantially improved, and I have no further comments. I am particularly reassured by the new hierarchical bootstrap analyses as well as by the new analysis with mouse as a statistical unit that reproduces the key finding from the analyses with region as a statistical unit. Moreover, the authors added a vehicle control condition which does not yield any results. Therefore, I have no further methodological concerns and removed my mention of this previous weakness from my public review. Also, the readability of the manuscript has much improved in the revised version. Congratulations again on this important work!
We thank the reviewer for the help in improving the manuscript.
Reviewer #3 (Recommendations For The Authors):
Comments on rebuttal:
(1) It is greatly appreciated that the authors have improved aspects of their statistics, I have revised my comments accordingly.
We are happy to hear.
(2) However, I should clarify my comments regarding statistical concerns were not merely pertaining to a given Figure (e.g. Figure 1) I was only using it as an example. The authors have redone aspects of their analysis using N = number of mice (for statistics/trace figures), but is there a reason they cannot do this for other problematic figures/traces in the manuscript?
Prompted also by reviewer 1, we have changed all time course plots in the manuscript to show a hierarchical bootstrap estimate of mean and 90% confidence interval of mean.
Using mice as a statistical unit throughout the manuscript unfortunately is not viable in most cases, as we simply do not have enough mice in our dataset and statistical tests based on mice would be underpowered. The manuscript currently contains data from 77 mice, and we would likely need multiples of that to do statistics over mice.
For Figure 1 - I do take the point why regions are being used as the independent N (though the authors justification should be made more clearly in the manuscript) making an N of 12 (though I am less clear why the same region across 2 hemispheres is counted as 2 Ns instead of 1; are they really independent?). However, I am less clear as to the choice in N in other figures. Could the authors clarify this more explicitly in the manuscript.
We use regions as a statistical unit in Figures 6 and 7, S6-S8. Regarding the independence of hemispheres, this depends on cell type and region. E.g. activity in left V1 exhibits a higher correlation with activity left V2am than with right V2 (see Figure 5). On average callosal pairs exhibit correlation levels comparable to near cortical neighbors. See also, other work on the topic, for example (Calhoun et al., 2023).
Regarding choice of N in other figures, this is either “recording session” or “pairs of regions”. We have made this clearer in the figure legends. In the case of testing using recording sessions, the idea is that each recording session constitutes a measurement. Measurements in the same mouse are not independent, and hence we use hierarchical bootstrap for all testing on recording sessions. The choice of “pairs of regions” for the correlation analysis follows from the use of regions as a statistical unit.
(3) Regarding using N = locomotion onsets (or other definitions other than N = mice) when deriving trace averages/SEMs (for example, as in Figure 1) is visually misleading for the reader as it masks the true variability of the data, and even more misleading given that the authors do necessarily use that definition of N in their statistical tests associated with the data (as the authors commented). Whilst the authors have shown some traces with N=mice for some data, is there a reason they cannot do this for all figures in the manuscript? At the very least the practice of using other definitions of N for the purpose of showing trace averages/SEMs should be justified in the MS.
We have replaced all time course plots that used SEM over events (for example locomotion onsets or visual stimuli) with a hierarchical bootstrap estimate of mean and 90% confidence interval of the mean throughout the manuscript. See also response to comment 2 above, and to reviewer 1, comment 4.
References
Calhoun, G., Chen, C.-T., Kanold, P.O., 2023. Bilateral widefield calcium imaging reveals circuit asymmetries and lateralized functional activation of the mouse auditory cortex. Proc. Natl. Acad. Sci. U. S. A. 120, e2219340120. https://doi.org/10.1073/pnas.2219340120
-
eLife assessment
This important study uses calcium imaging in mice to advance our understanding of the effect of antipsychotic drugs on neural functioning. The evidence supporting the conclusions is convincing, and this work will be of interest to neuroscientists working on visual processing and psychosis researchers.
-
Reviewer #1 (Public Review):
The authors present a study of visuo-motor coupling primarily using wide-field calcium imaging to measure activity across the dorsal visual cortex. They used different mouse lines or systemically injected viral vectors to allow imaging of calcium activity from specific cell-types with a particular focus on a mouse-line that expresses GCaMP in layer 5 IT (intratelencephalic) neurons. They examined the question of how the neural response to predictable visual input, as a consequence of self-motion, differed from responses to unpredictable input. They identify layer 5 IT cells as having a different response pattern to other cell-types/layers in that they show differences in their response to closed-loop (i.e. predictable) vs open-loop (i.e. unpredictable) stimulation whereas other cell-types showed similar …
Reviewer #1 (Public Review):
The authors present a study of visuo-motor coupling primarily using wide-field calcium imaging to measure activity across the dorsal visual cortex. They used different mouse lines or systemically injected viral vectors to allow imaging of calcium activity from specific cell-types with a particular focus on a mouse-line that expresses GCaMP in layer 5 IT (intratelencephalic) neurons. They examined the question of how the neural response to predictable visual input, as a consequence of self-motion, differed from responses to unpredictable input. They identify layer 5 IT cells as having a different response pattern to other cell-types/layers in that they show differences in their response to closed-loop (i.e. predictable) vs open-loop (i.e. unpredictable) stimulation whereas other cell-types showed similar activity patterns between these two conditions. They also analyzed the responses to visuomotor prediction errors obtained by briefly pausing the display while the mouse is running, causing a negative prediction error, or by presenting an unpredicted visual input causing a positive prediction error. Surprisingly, they find that presentation of a visual grating actually decreases the responses of L5 IT cells in V1. They interpret their results within a predictive coding framework that the last author has previously proposed. The response pattern of the L5 IT cells leads them to propose that these cells may act as 'internal representation' neurons that carry a representation of the brain's model of its environment. Though this is rather speculative. They subsequently examine the responses of these cells to anti-psychotic drugs (e.g. clozapine) with the reasoning that a leading theory of schizophrenia is a disturbance of the brain's internal model and/or a failure to correctly predict the sensory consequences of self-movement. They find that anti-psychotic drugs strongly enhance responses of L5 IT cells to locomotion while having little effect on other cell-types. Finally, they suggest that anti-psychotics reduce long-range correlations between (predominantly) L5 cells and reduce the propagation of prediction errors to higher visual areas and suggest this may be a mechanism by which these drugs reduce hallucinations/psychosis.
This is a large study containing a screening of many mouse-lines/expression profiles using wide-field calcium imaging. Wide-field imaging has its caveats, including a broad point-spread function of the signal and susceptibility to hemodynamic artifacts, which can make the interpretation of results difficult. The authors acknowledge these problems and directly address the hemodynamic occlusion problem. It was reassuring to see supplementary 2-photon imaging of soma to complement this data-set, even though this is rather briefly described in the paper. Some comparisons in the paper are underpowered as a result of including only a small number of mice (e.g. the PV, Ntsr1 and Cux2 mice) and results involving these mice should be cautiously interpreted, but in general the results are robust. Overall the paper's strengths are its identification of a very different response profile in the L5 IT cells compared to other layers/cell-types which suggests an important role for these cells in handling integration of self-motion generated sensory predictions with sensory input. The interpretation of the responses to anti-psychotic drugs is more speculative but the result appears robust and provides an interesting basis for further studies of this effect with more specific recording techniques and possibly behavioral measures.
-
-
Author Response
The following is the authors’ response to the original reviews.
We thank you for the time you took to review our work and for your feedback!
The major changes to the manuscript are:
Promoted by multiple reviewers, we have replaced the statistical analysis in Figure 1L with a bootstrap analysis, added an ANOVA (in Table S1), and have also added the same analysis with mice as a statistical unit as Figure S4J to the manuscript.
In response to reviewer 1, comment 3, we have replaced the response latency maps previously shown in Figures 3B, 3C, 3E and 3F with response amplitude maps.
In response to reviewer 2, comment 1, we have added a variant of the response traces shown in Figures 3B, 3C, 3E and 3F with mice as the statistical unit as Figures S2C and S2D.
In response to reviewer 2, public review, we have added data from …
Author Response
The following is the authors’ response to the original reviews.
We thank you for the time you took to review our work and for your feedback!
The major changes to the manuscript are:
Promoted by multiple reviewers, we have replaced the statistical analysis in Figure 1L with a bootstrap analysis, added an ANOVA (in Table S1), and have also added the same analysis with mice as a statistical unit as Figure S4J to the manuscript.
In response to reviewer 1, comment 3, we have replaced the response latency maps previously shown in Figures 3B, 3C, 3E and 3F with response amplitude maps.
In response to reviewer 2, comment 1, we have added a variant of the response traces shown in Figures 3B, 3C, 3E and 3F with mice as the statistical unit as Figures S2C and S2D.
In response to reviewer 2, public review, we have added data from additional experiments as Figures S6F-S6H, that control for the effect of a saline injection.
A detailed point-by-point response to all reviewer concerns is provided in the following.
Reviewer #1 (Public Review):
The authors present a study of visuo-motor coupling primarily using wide-field calcium imaging to measure activity across the dorsal visual cortex. They used different mouse lines or systemically injected viral vectors to allow imaging of calcium activity from specific cell-types with a particular focus on a mouse-line that expresses GCaMP in layer 5 IT (intratelencephalic) neurons. They examined the question of how the neural response to predictable visual input, as a consequence of self-motion, differed from responses to unpredictable input. They identify layer 5 IT cells as having a different response pattern to other cell-types/layers in that they show differences in their response to closed-loop (i.e. predictable) vs open-loop (i.e. unpredictable) stimulation whereas other cell-types showed similar activity patterns between these two conditions. They analyze the latencies of responses to visuomotor prediction errors obtained by briefly pausing the display while the mouse is running, causing a negative prediction error, or by presenting an unpredicted visual input causing a positive prediction error. They suggest that neural responses related to these prediction errors originate in V1, however, I would caution against overinterpretation of this finding as judging the latency of slow calcium responses in wide-field signals is very challenging and this result was not statistically compared between areas. Surprisingly, they find that presentation of a visual grating actually decreases the responses of L5 IT cells in V1. They interpret their results within a predictive coding framework that the last author has previously proposed. The response pattern of the L5 IT cells leads them to propose that these cells may act as 'internal representation' neurons that carry a representation of the brain's model of its environment. Though this is rather speculative. They subsequently examine the responses of these cells to anti-psychotic drugs (e.g. clozapine) with the reasoning that a leading theory of schizophrenia is a disturbance of the brain's internal model and/or a failure to correctly predict the sensory consequences of self-movement. They find that anti-psychotic drugs strongly enhance responses of L5 IT cells to locomotion while having little effect on other cell-types. Finally, they suggest that anti-psychotics reduce long-range correlations between (predominantly) L5 cells and reduce the propagation of prediction errors to higher visual areas and suggest this may be a mechanism by which these drugs reduce hallucinations/psychosis.
This is a large study containing a screening of many mouse-lines/expression profiles using wide-field calcium imaging. Wide-field imaging has its caveats, including a broad point-spread function of the signal and susceptibility to hemodynamic artifacts, which can make interpretation of results difficult. The authors acknowledge these problems and directly address the hemodynamic occlusion problem. It was reassuring to see supplementary 2-photon imaging of soma to complement this data-set, even though this is rather briefly described in the paper. Overall the paper's strengths are its identification of a very different response profile in the L5 IT cells compared other layers/cell-types which suggests an important role for these cells in handling integration of self-motion generated sensory predictions with sensory input. The interpretation of the responses to anti-psychotic drugs is more speculative but the result appears robust and provides an interesting basis for further studies of this effect with more specific recording techniques and possibly behavioral measures.
We thank the reviewer for the feedback and the help with improving the manuscript. We agree, the findings presented in this study are merely a starting point. The two questions we are currently pursuing in follow up work are:
Do the findings generalize to all known antipsychotic drugs?
What is the mechanism by which these drugs induce a decorrelation of activity, specifically in layer 5 neurons?
But we suspect these questions will take at least a few more years of research to answer.
Reviewer #2 (Public Review):
Summary:
This work investigates the effects of various antipsychotic drugs on cortical responses during visuomotor integration. Using wide-field calcium imaging in a virtual reality setup, the researchers compare neuronal responses to self-generated movement during locomotion-congruent (closed loop) or locomotionincongruent (open loop) visual stimulation. Moreover, they probe responses to unexpected visual events (halt of visual flow, sudden-onset drifting grating). The researchers find that, in contrast to a variety of excitatory and inhibitory cell types, genetically defined layer 5 excitatory neurons distinguish between the closed and the open loop condition and exhibit activity patterns in visual cortex in response to unexpected events, consistent with unsigned prediction error coding. Motivated by the idea that prediction error coding is aberrant in psychosis, the authors then inject the antipsychotic drug clozapine, and observe that this intervention specifically affects closed loop responses of layer 5 excitatory neurons, blunting the distinction between the open and closed loop conditions. Clozapine also leads to a decrease in long-range correlations between L5 activity in different brain regions, and similar effects are observed for two other antipsychotics, aripripazole and haloperidol, but not for the stimulant amphetamine. The authors suggest that altered prediction error coding in layer 5 excitatory neurons due to reduced longrange correlations in L5 neurons might be a major effect of antipsychotic drugs and speculate that this might serve as a new biomarker for drug development.
Strengths:
- Relevant and interesting research question:
The distinction between expected and unexpected stimuli is blunted in psychosis but the neural mechanisms remain unclear. Therefore, it is critical to understand whether and how antipsychotic drugs used to treat psychosis affect cortical responses to expected and unexpected stimuli. This study provides important insights into this question by identifying a specific cortical cell type and long-range interactions as potential targets. The authors identify layer 5 excitatory neurons as a site where functional effects of antipsychotic drugs manifest. This is particularly interesting as these deep layer neurons have been proposed to play a crucial role in computing the integration of predictions, which is thought to be disrupted in psychosis. This work therefore has the potential to guide future investigations on psychosis and predictive coding towards these layer 5 neurons, and ultimately improve our understanding of the neural basis of psychotic symptoms.
- Broad investigation of different cell types and cortical regions:
One of the major strengths of this study is quasi-systematic approach towards cell types and cortical regions. By analysing a wide range of genetically defined excitatory and inhibitory cell types, the authors were able to identify layer 5 excitatory neurons as exhibiting the strongest responses to unexpected vs. expected stimuli and being the most affected by antipsychotic drugs. Hence, this quasi-systematic approach provides valuable insights into the functional effects of antipsychotic drugs on the brain, and can guide future investigations towards the mechanisms by which these medications affect cortical neurons.
- Bridging theory with experiments
Another strength of this study is its theoretical framework, which is grounded in the predictive coding theory. The authors use this theory as a guiding principle to motivate their experimental approach connecting visual responses in different layers with psychosis and antipsychotic drugs. This integration of theory and experimentation is a powerful approach to tie together the various findings the authors present and to contribute to the development of a coherent model of how the brain processes visual information both in health and in disease.
Weaknesses:
- Unclear relevance for psychosis research
From the study, it remains unclear whether the findings might indeed be able to normalise altered predictive coding in psychosis. Psychosis is characterised by a blunted distinction between predicted and unpredicted stimuli. The results of this study indicate that antipsychotic drugs further blunt the distinction between predicted and unpredicted stimuli, which would suggest that antipsychotic drugs would deteriorate rather than ameliorate the predictive coding deficit found in psychosis. However, these findings were based on observations in wild-type mice at baseline. Given that antipsychotics are thought to have little effects in health but potent antipsychotic effects in psychosis, it seems possible that the presented results might be different in a condition modelling a psychotic state, for example after a dopamine-agonistic or a NMDA-antagonistic challenge. Therefore, future work in models of psychotic states is needed to further investigate the translational relevance of these findings.
- Incomplete testing of predictive coding interpretation
While the investigation of neuronal responses to different visual flow stimuli Is interesting, it remains open whether these responses indeed reflect internal representations in the framework of predictive coding. While the responses are consistent with internal representation as defined by the researchers, i.e., unsigned prediction error signals, an alternative interpretation might be that responses simply reflect sensory bottom-up signals that are more related to some low-level stimulus characteristics than to prediction errors. Moreover, This interpretational uncertainty is compounded by the fact that the used experimental paradigms were not suited to test whether behaviour is impacted as a function of the visual stimulation which makes it difficult to assess what the internal representation of the animal actual was. For these reasons, the observed effects might reflect simple bottom-up sensory processing alterations and not necessarily have any functional consequences. While this potential alternative explanation does not detract from the value of the study, future work would be needed to explain the effect of antipsychotic drugs on responses to visual flow. For example, experimental designs that systematically vary the predictive strength of coupled events or that include a behavioural readout might be more suited to draw from conclusions about whether antipsychotic drugs indeed alter internal representations.
- Methodological constraints of experimental design
While the study findings provide valuable insights into the potential effects of antipsychotic drugs, it is important to acknowledge that there may be some methodological constraints that could impact the interpretation of the results. More specifically, the experimental design does not include a negative control condition or different doses. These conditions would help to ensure that the observed effects are not due to unspecific effects related to injection-induced stress or time, and not confined to a narrow dose range that might or might not reflect therapeutic doses used in humans. Hence, future work is needed to confirm that the observed effects indeed represent specific drug effects that are relevant to antipsychotic action.
Conclusion:
Overall, the results support the idea that antipsychotic drugs affect neural responses to predicted and unpredicted stimuli in deep layers of cortex. Although some future work is required to establish whether this observation can indeed be explained by a drug-specific effect on predictive coding, the study provides important insights into the neural underpinnings of visual processing and antipsychotic drugs, which is expected to guide future investigations on the predictive coding hypothesis of psychosis. This will be of broad interest to neuroscientists working on predictive coding in health and in disease.
We thank the reviewer for the feedback and the help with improving the manuscript.
Regarding the concern of a lack of a negative control, we have repeated the correlation measurement experiments in a cohort of Tlx3-Cre x Ai148 mice that received injections of saline. This analysis is now shown in Figure S6F-S6H. Saline injections did not change correlations in L5 IT neurons. Combined with the absence of changes in the L5 IT correlation structure following amphetamine injections (Figures 7G – 7I), this suggests that unspecific effects related to stress of injection, or simply time, cannot explain the observed decorrelation effect of the antipsychotic drugs.
And we fully agree, a lot more work is needed to confirm that the observed effects are specific and relevant to antipsychotic action.
Reviewer #3 (Public Review):
The study examines how different cell types in various regions of the mouse dorsal cortex respond to visuomotor integration and how antipsychotic drugs impacts these responses. Specifically, in contrast to most cell types, the authors found that activity in Layer 5 intratelencephalic neurons (Tlx3+) and Layer 6 neurons (Ntsr1+) differentiated between open loop and closed loop visuomotor conditions. Focussing on Layer 5 neurons, they found that the activity of these neurons also differentiated between negative and positive prediction errors during visuomotor integration. The authors further demonstrated that the antipsychotic drugs reduced the correlation of Layer 5 neuronal activity across regions of the cortex, and impaired the propagation of visuomotor mismatch responses (specifically, negative prediction errors) across Layer 5 neurons of the cortex, suggesting a decoupling of long-range cortical interactions.
The data when taken as a whole demonstrate that visuomotor integration in deeper cortical layers is different than in superficial layers and is more susceptible to disruption by antipsychotics. Whilst it is already known that deep layers integrate information differently from superficial layers, this study provides more specific insight into these differences. Moreover, this study provides a first step into understanding the potential mechanism by which antipsychotics may exert their effect.
Whilst the paper has several strengths, the robustness of its conclusions is limited by its questionable statistical analyses. A summary of the paper's strengths and weaknesses follow.
Strengths:
The authors perform an extensive investigation of how different cortical cell types (including Layer 2/3, 4 , 5, and 6 excitatory neurons, as well as PV, VIP, and SST inhibitory interneurons) in different cortical areas (including primary and secondary visual areas as well as motor and premotor areas), respond to visuomotor integration. This investigation provides strong support to the idea that deep layer neurons are indeed unique in their computational properties. This large data set will be of considerable interest to neuroscientists interested in cortical processing.
The authors also provide several lines of evidence that visuomotor information is differentially integrated in deep vs. superficial layers. They show that this is true across experimental paradigms of visuomotor processing (open loop, closed loop, mismatch, drifting grating conditions) and experimental manipulations, with the demonstration that Layer 5 visuomotor integration is more sensitive to disruption by the antipsychotic drug clozapine, compared with cortex as a whole.
The study further uses multiple drugs (clozapine, aripiprazole and haloperidol) to bolster its conclusion that antipsychotic drugs disrupt correlated cortical activity in Layer 5 neurons, and further demonstrates that this disruption is specific to antipsychotics, as the psychostimulant amphetamine shows no such effect.
In widefield calcium imaging experiments, the authors effectively control for the impact of hemodynamic occlusions in their results, and try to minimize this impact using a crystal skull preparation, which performs better than traditional glass windows. Moreover, they examine key findings in widefield calcium imaging experiments with two-photon imaging.
Weaknesses:
A critical weakness of the paper is its statistical analysis. The study does not use mice as its independent unit for statistical comparisons but rather relies on other definitions, without appropriate justification, which results in an inflation of sample sizes. For example, in Figure 1, independent samples are defined as locomotion onsets, leading to sample sizes of approx. 400-2000 despite only using 6 mice for the experiment. This is only justified if the data from locomotion onsets within a mouse is actually statistically independent, which the authors do not test for, and which seems unlikely. With such inflated sample sizes, it becomes more likely to find spurious differences between groups as significant. It also remains unclear how many locomotion onsets come from each mouse; the results could be dominated by a small subset of mice with the most locomotion onsets. The more disciplined approach to statistical analysis of the dataset is to average the data associated with locomotion onsets within a mouse, and then use the mouse as an independent unit for statistical comparison. A second example, for instance, is in Figure 2L, where the independent statistical unit is defined as cortical regions instead of mice, with the left and right hemispheres counting as independent samples; again this is not justified. Is the activity of cortical regions within a mouse and across cortical hemispheres really statistically independent? The problem is apparent throughout the manuscript and for each data set collected. An additional statistical issue is that it is unclear if the authors are correcting for the use of multiple statistical tests (as in for example Figure 1L and Figure 2B,D). In general, the use of statistics by the authors is not justified in the text.
Finally, it is important to note that whilst the study demonstrates that antipsychotics may selectively impact visuomotor integration in L5 neurons, it does not show that this effect is necessary or sufficient for the action of antipsychotics; though this is likely beyond the scope of the study it is something for readers to keep in mind.
We thank the reviewer for the feedback and the help with improving the manuscript.
Regarding the concerns of statistical analysis, this may partially be a misunderstanding. We apologize for the lack of clarity. For example, the data in Figures 1F-1K is indeed shown as averaged over locomotion onsets, but there is no statistical analysis performed in these panels. The unit for the statistical analysis shown in Figure 1L is brain area (not locomotion onset). A central tenet of the analysis shown in Figures 1L and 2 is that the effect of differential activation during closed and open loop locomotion onsets is not specific to visual areas of cortex. In visual areas of cortex, one would expect to find a difference. In essence, the surprising finding here is the lack of a difference in other cell types but L5 IT neurons. Thus, in the analyses of those figure panels we are testing whether the effect is present on average across all cortical areas. Hence, we chose the statistical unit of Figure 1L to be cortical areas, not mice. We have added the same analysis with mice as a statistical unit as Figure S4J.
Reviewer #1 (Recommendations For The Authors):
I have a few concerns and questions that I would like to see addressed:
- Figure 1L - the statistics are a little unusual here as the errors are across visual areas rather than across mice or hemispheres. This isn't ideal as ideally, we want to generalize the results across animals, not areas, and the results seem to be driven mostly by V1/RSC. I would like to see comparisons using mice as the statistical unit either in an ANOVA with areas as factors or post-hoc comparisons per area.
Based on the assumption that visual cortex should respond to visual stimuli, we would have expected to find a difference between closed and open loop locomotion onset responses in all cell types in visual areas of cortex (a closed loop locomotion onset being the combination of locomotion and visual flow onset, while an open loop locomotion onset lacks the visual flow component). Thus, the first surprise was that in most cell types we found very little difference between these two locomotion onset types. Conversely, in Tlx3-positive L5 IT neurons the difference was apparent well outside of the visual areas of cortex (even though the difference was indeed strongest in V1/RSC). To quantify the extent to which closed and open loop locomotion onsets result in different activity patterns across dorsal cortex we performed the analyses shown in Figures 1L and 2. To make the point that the effect was observable on average across cortical areas, we used cortical area as a unit in Figure 1L. We have added the analysis shown in Figure 1L with mice as the statistical unit as Figure S4J and have added the ANOVA information to Table S1, as suggested.
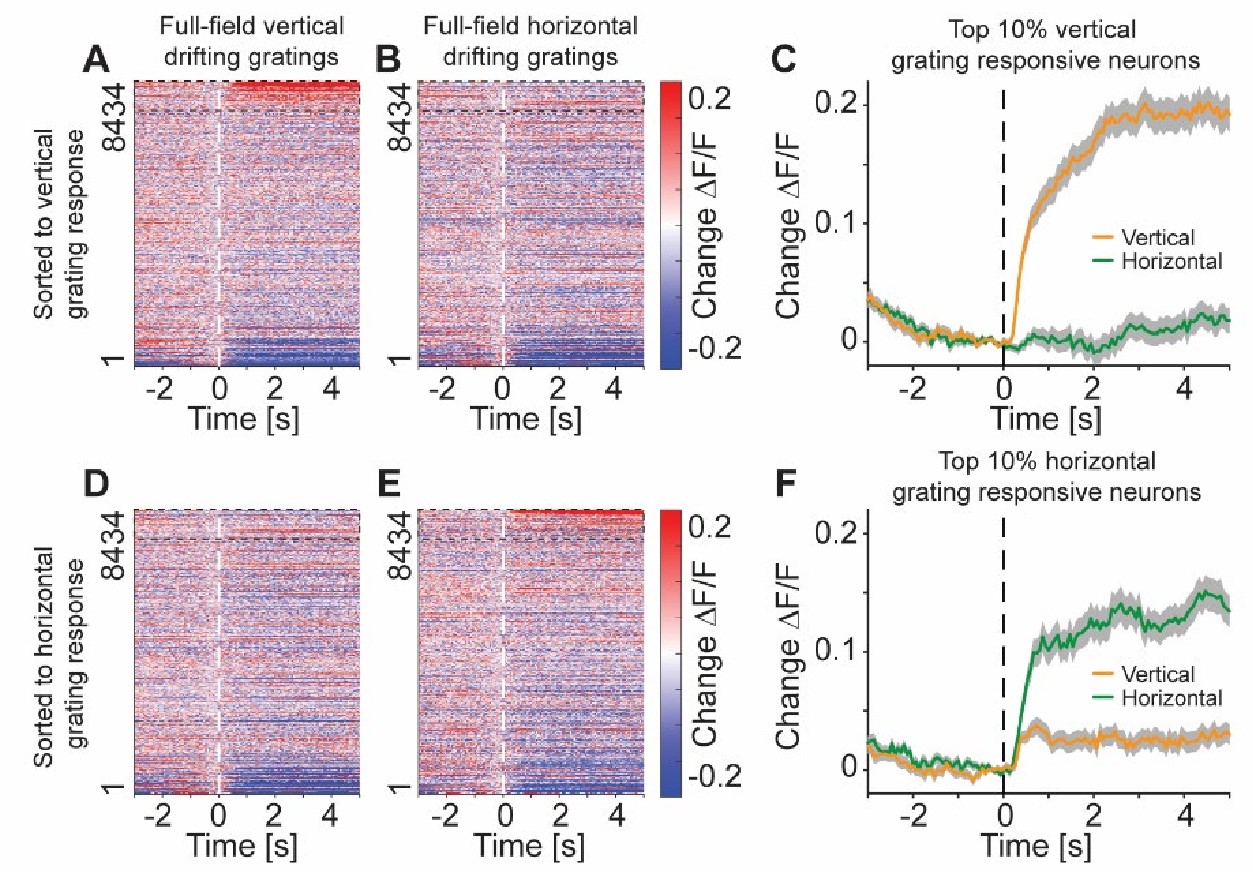
- The reduction of activity of L5 IT cells in V1 after the presentation of gratings is curious. The authors suggest it might have been due to one population of cells tuned for the orientation of the presented grating suppressing the remaining cells leading to an aggregate negative response. However, they also observed this negative response in the 2p signal for individual somata. Presumably in the 2p data they could check their hypothesis - is there a group of cells that were tuned for the grating? Is it possible that for some reason the L5 IT cells in the 2p were not being activated by the grating because of their RF locations? How large were the gratings - I didn't see this in the methods section?
We can certainly identify neurons that selectively increase activity to one particular grating. See Author response image 1, for vertical and horizontal gratings. The gratings were presented full-field on a toroidal screen that surrounded the mouse (240 degrees horizontal and 100 degrees vertical coverage of the visual field). This covered a large fraction of the field of view of the mouse. While we did not map receptive fields of individual neurons in this study, it is unlikely that the receptive fields of the neurons recorded were outside the stimulated area. We have made this clearer in the manuscript.
Author response image 1.
The population L5 IT neuron response to full-field drifting grating stimuli was a decrease of activity, yet there were increasing responses in a subset of neurons. (A) Heatmap of responses of all L5 IT neuron somata recorded with two-photon imaging in 7 Tlx3-Cre x Ai148 mice to drifting gratings of vertical orientation, sorted by their response. Data were sorted on odd trials and plotted on even trials to avoid regression to the mean artifacts. Dashed black box marks the top 10% responsive neurons. The data are a subset of the data shown in Figure S3D. (B) As in A, but for responses to drifting gratings of horizontal orientation. (C) Responses of top 10% vertical grating responsive neurons (dashed black box in A) to vertical (orange) or horizontal gratings (green). Neurons were selected on odd trials, and the average response of even trials is shown. (D) As in A, but sorted to the response of horizontal drifting gratings. (E) As in D, but for the horizontal grating stimulus. (F) As in C, but for the top 10% horizontal grating responsive neurons.
- I would caution against over-interpretation of latencies from wide-field GCaMP activity (Figure 3). A weaker response in a smaller population of neurons that has the same latency as a strong response in a large population of neurons will appear to have different latencies when convolved with the GCaMP kernel. Also there doesn't appear to be any statistical support for different latencies in different cortical areas. Either this should be correctly treated (ideally with linear mixed effects models to account for the increased correlation within animals) or the latency conclusions should be removed from the manuscript (my recommendation).
We suspect that by “latency conclusions” the reviewer means “latency analysis”. The only time we mention latency differences is to state that: “In C57BL/6 mice that expressed GCaMP brain wide, both visuomotor mismatch and grating stimuli resulted in increases of activity that were strongest and appeared first in visual regions of dorsal cortex (Figures 3A-3C).”
Nevertheless, we agree with the reviewer that response latency and response amplitude are not independent in our measurements and have replaced the latency plots in Figures 3B, 3C, 3E and 3F with average response maps.
- Given that the data is baseline corrected, is it possible that the effects of the anti-psychotic drugs on L5IT cells was due to a change in the baseline activity of this population?
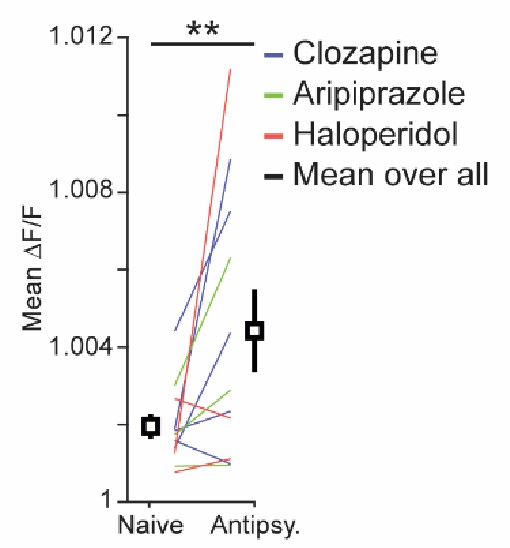
While we do find a small increase in average activity as a result of antipsychotic drug injections (Author response image 2), these effects are much smaller than those on locomotion onset responses.
Author response image 2.
On average, activity was increased in dorsal cortex after administration of antipsychotic drugs. Average calcium activity over the entire recording session before (naïve) and after (antipsy.) the administration of antipsychotic drugs. Colored lines indicate paired data for individual mice (Blue: 5 mice that had received clozapine, green: 3 mice that had received aripiprazole, red: 3 mice that had received haloperidol).
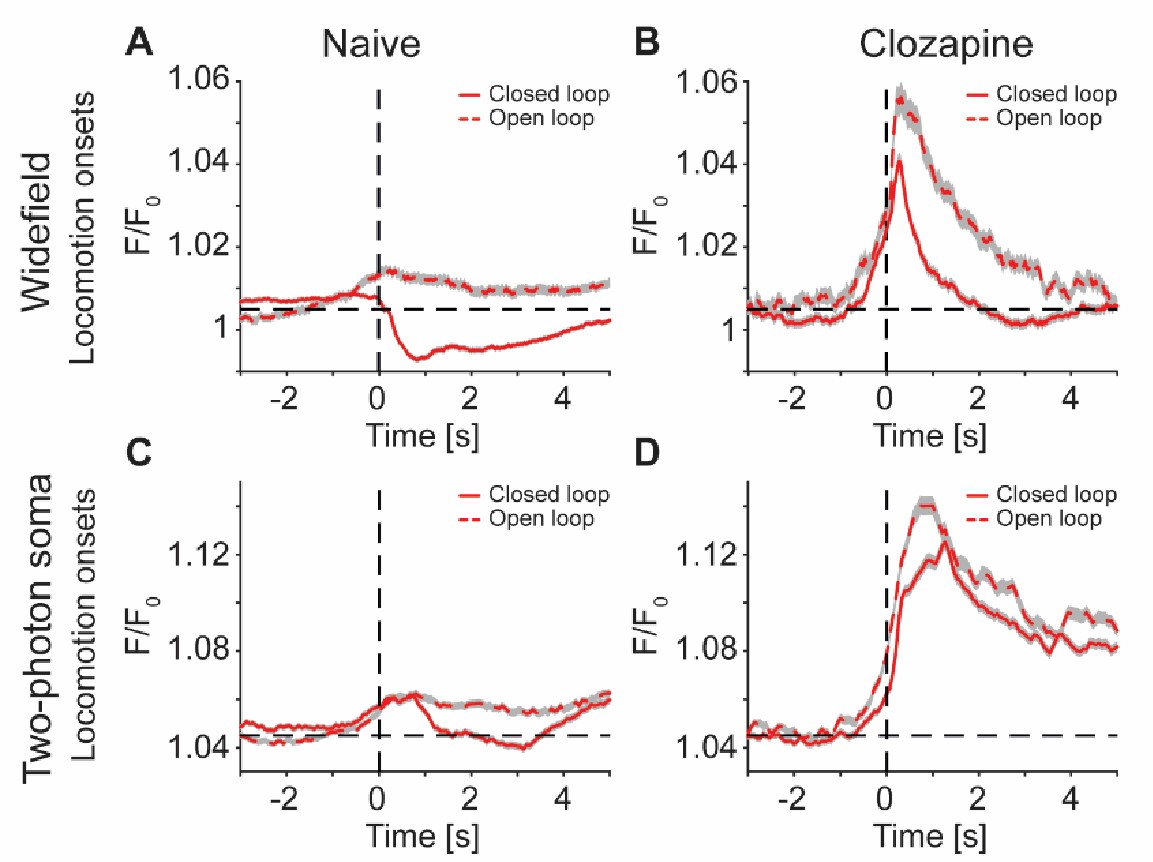
To illustrate that the clozapine induced change in locomotion related activity cannot be explained by baseline activity differences, we have replotted the responses shown in Figures 4D and 4E, S3B, S5F without baseline subtraction (Author response image 3).
Author response image 3.
Antipsychotic drug injection only modestly shifts the baseline before locomotion onsets. (A) Average response expressed as F/F0 (wherein F0 was defined as the median of a recording session) during closed (solid line, 1101 onsets) and open loop (dashed line, 348 onsets) locomotion onsets in 5 Tlx3-Cre x Ai148 mice that expressed GCaMP6 in layer L5 IT neurons. Shading indicates SEM over onsets. Dashed horizontal line marks a value of F/F0 of 1.005 for comparison with panel B. Underlying data were the same as in Figures 4D and 4E. (B) As in A, but after a single intraperitoneal injection of the drug clozapine and for 707 closed and 350 open loop locomotion onsets. (C) Average response expressed as F/F0 (wherein F0 was defined as the median of a recording session) of L5 soma in V1, recorded with two-photon imaging in 7 Tlx3-Cre x Ai148 mice that expressed GCaMP6 in L5 IT neurons, during either closed (solid) or open loop (dashed) locomotion onsets. Shading indicates SEM over 8434 neurons. Dashed horizontal line marks a value of F/F0 of 1.045 for comparison with panel D. Underlying data were the same as in Figure S3B. (D) As in C, but for the 3 Tlx3 x Ai148 mice that had received a single intraperitoneal injection of clozapine. Underlying data were from Figure S5F.
- Figure 5/Figure S6 - Do the results really reflect an effect of distance or is it driven by areas from different hemispheres. Does the result hold if they factor out the effect of hemisphere or calculate the results within hemisphere?
The effect appears qualitatively unchanged when we exclude interhemispheric connections from the analysis (Author response image 4).
Author response image 4.
As in Figures 6D-6F, but with the exclusion of interhemispheric connections. The decorrelation effect appears qualitatively unchanged.
Reviewer #2 (Recommendations For The Authors):
In addition to my public review, I only have one statistics-related and a few minor editing suggestions for the abstract. I hope that these might help the authors to improve their manuscript.
- It seems that the researchers are combining observations across different subjects, as seen in Figure 1F-L as well as in all of the other figures. While this has been a common practice in their field, it is now widely recognized that this approach can result in biased statistical inferences since it violates the assumptions of most statistical tests (see this recent discussion: https://www.ncbi.nlm.nih.gov/pmc/articles/PMC7906290/). As such, it may be beneficial for the authors to consider utilizing statistical tests that are designed to accurately deal with hierarchical data sets, like linear mixed models or hierarchical bootstrap, to confirm their key results. Additionally or alternatively, presenting data grouped by subject would help demonstrate the consistency of their findings across subjects.
Please note, in Figures 1F-1K, there are no statistical tests – but the data are indeed averaged over locomotion onsets across all mice. We could use hierarchical sampling to calculate a bootstrap estimate of the mean response curves and show those instead, but that is also not standard practice in the field. We suspect this is also not what the reviewer is suggesting. In Figure 1L, the unit is indeed brain areas (see also our response to comment 1 of reviewer 1), but it is not areas x mice (i.e., the analysis is not hierarchical).
We have now added a supplementary panel (Figure S4J) that shows the data of Figure 1L with mouse as the statistical unit (note, this is also not hierarchical). We have replaced the statistical test data using bootstrapping, as the reviewer suggests. This information can be found in Table S1.
In Figures 2B and 2D, we have replaced the statistical test with hierarchical bootstrap, and updated the corresponding information in Table S1.For Figure 3, in which we show mismatch and grating onset responses averaged using onsets as the base unit, we have added supplementary panels (Figure S2) that show the same analysis using mice as the statistical unit. This did not change any of the conclusions. Note, there was no statistical testing in Figure 3.
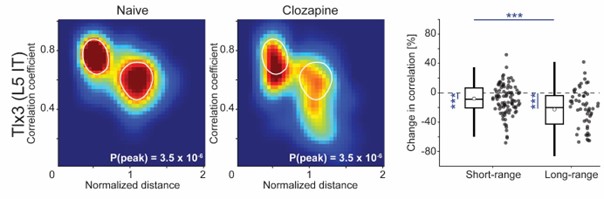
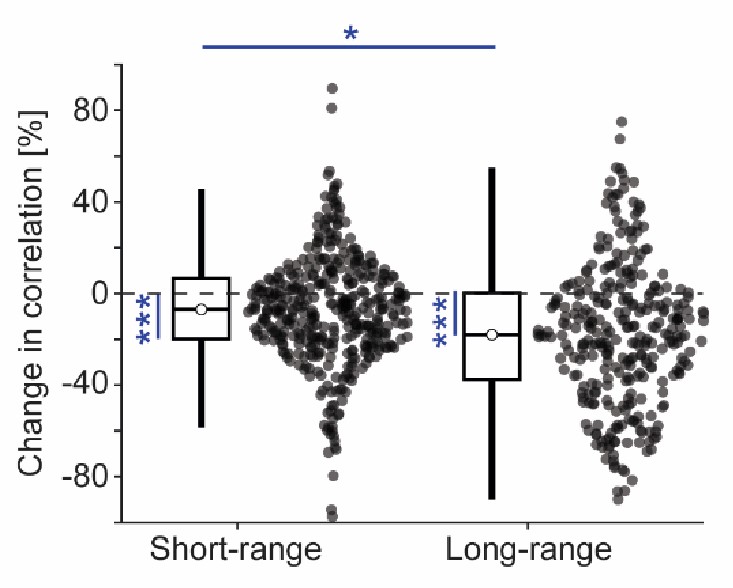
For the decorrelation effect of the different antipsychotic drugs that we show in Figures 6 and 7 the statistical unit is mice x region pairs (that is, while the structure is hierarchical, all mice contribute the same number of pairs). Our data are underpowered to use hierarchical bootstrap for testing the drug effects individually. However, if we combine all antipsychotic drug data (clozapine, aripiprazole, and haloperidol) we reach the same conclusions with hierarchical bootstrap as with the statistical tests (ttest and ranksum) used in the paper (Author response image 5).
Author response image 5.
Hierarchical bootstrap of the combined distribution of correlation values shown in Figures 6F, 7C and 7F did not change the conclusion that administration of antipsychotic drugs reduces L5 IT neuron correlations. Statistical comparisons using hierarchical bootstrap: Short-range vs no change, p < 0.001; long-range vs no change, p < 0.001; short-range vs longrange, p < 0.05.
- Given the impressive amount of data, I found it sometimes a little difficult to follow the manuscript. The authors might want to consider including a high-level overview of their results and rationales at the end of the introduction, and start each Results subsection with a sentence referring back to that highlevel overview ("To test whether X, we did Y and present it in this section.")
We have attempted to improve the writing along these lines.
- Some suggestions that might further improve the clarity of writing.
Abstract: Does the brain really distinguish between different "activity patterns", or would externallygenerated and self-generated "stimuli" be a slightly more accurate term to describe the observed alterations in schizophrenia?
We would argue that (outside of sensory organs) the brain only has access to activity patterns, not stimuli directly. We would prefer to keep the phrasing with activity patterns here.
Line 12: It might be easier to follow if the authors explicitly related that sentence back to the previous sentence "their ability to identify self-generated activity patterns" -> "their ability to distinguish between externally and self/internally generated ..."
Absolutely correct – we have improved the writing here.
Line 14: It remains unclear how visuomotor integration relates to the problem of distinguishing between self- and externally generated stimuli.
We have attempted to expand on this in the abstract.
Line 26: it remains unclear how the results support the activation of "internal representations" as this term has not been defined previously
We have removed “internal representation” from the abstract.
Results, line 80ff: I was confused by the description of all the different investigated cell types, as the first figure panels then only talk about brain wide and L5. Maybe the authors might find that shortening this with a reference to the methods might improve the flow.
We have moved the list of cell types and mouse lines to the methods, as suggested.
Reviewer #3 (Recommendations For The Authors):
The authors should strongly consider reassessing their statistics as outlined in the Public Review.
Specifically:
- They should justify their definition of independent statistical unit; if this is not the mouse, they should justify why another definition (i.e. locomotion onset) is used, and show that their defined statistical unit achieves the requirements of being statistically independent (i.e. variance of the unit within a mouse is statistically indistinguishable from variance found between mice; more formally they could calculate the intraclass correlation (ICC)).
We assume the reviewer is referring mainly to Figure 1 and therein to panel 1L.
Since we did not perform statistical tests on the calcium traces, we are not sure why we would need to justify the choice of the unit we were showing. Moreover, Figure S2 shows the data of the V1 ROI averaged over mice to address this concern. As also mentioned to reviewer 2, we have amended this Figure S2 for the mouse-averaged traces of the V1 ROI data shown in main Figure 3.
- They should justify the statistical tests they use and whether they corrected for multiple comparisons; why for example was an ANOVA not used for Figure 1L and Figure 2B,D?
We did not rely on ANOVA statistics for Figure 1L because we were mainly interested in carving out that Tlx3- (and Ntsr1-) positive mice inhabit a unique space when comparing the similarity of activity during closed and open loop locomotion onsets. We appreciate the reviewer taking a slightly different point of view on the data and now additionally report the ANOVA test result in Table S1. We have also opted to replace the statistical test in Figure 1L with bootstrapping. Lastly, we added Figure S4J which now shows the data in Figure 1L but with mice as the statistical unit.
With similar logic, in Figure 2, we were not interested in comparing how the correlation of activity in cortical regions with locomotion behavior evolves over regions within a visuomotor feedback condition (closed loop, open loop or dark) but rather how a given region compares across feedback conditions.
Still, we have opted to replace the statistical test in Figures 2B and 2D with hierarchical bootstrap, as also suggested by reviewer #2, comment 1. This did not change the significance indicator bars. We have accordingly updated Table S1 in which we report the full statistics.
-
eLife assessment
This important study uses calcium imaging in mice to advance our understanding of the effect of antipsychotic drugs on neural functioning. The evidence supporting the conclusions is convincing, though some improvements could be made to the statistical testing of the data. This work will be of interest to neuroscientists working on visual processing and psychosis researchers.
-
Reviewer #1 (Public Review):
The authors present a study of visuo-motor coupling primarily using wide-field calcium imaging to measure activity across the dorsal visual cortex. They used different mouse lines or systemically injected viral vectors to allow imaging of calcium activity from specific cell-types with a particular focus on a mouse-line that expresses GCaMP in layer 5 IT (intratelencephalic) neurons. They examined the question of how the neural response to predictable visual input, as a consequence of self-motion, differed from responses to unpredictable input. They identify layer 5 IT cells as having a different response pattern to other cell-types/layers in that they show differences in their response to closed-loop (i.e. predictable) vs open-loop (i.e. unpredictable) stimulation whereas other cell-types showed similar …
Reviewer #1 (Public Review):
The authors present a study of visuo-motor coupling primarily using wide-field calcium imaging to measure activity across the dorsal visual cortex. They used different mouse lines or systemically injected viral vectors to allow imaging of calcium activity from specific cell-types with a particular focus on a mouse-line that expresses GCaMP in layer 5 IT (intratelencephalic) neurons. They examined the question of how the neural response to predictable visual input, as a consequence of self-motion, differed from responses to unpredictable input. They identify layer 5 IT cells as having a different response pattern to other cell-types/layers in that they show differences in their response to closed-loop (i.e. predictable) vs open-loop (i.e. unpredictable) stimulation whereas other cell-types showed similar activity patterns between these two conditions. Surprisingly, they find that presentation of a visual grating actually decreases the responses of L5 IT cells in V1. They interpret their results within a predictive coding framework that the last author has previously proposed. The response pattern of the L5 IT cells leads them to propose that these cells may act as 'internal representation' neurons that carry a representation of the brain's model of its environment. Though this is rather speculative. They subsequently examine the responses of these cells to anti-psychotic drugs (e.g. clozapine) with the reasoning that a leading theory of schizophrenia is a disturbance of the brain's internal model and/or a failure to correctly predict the sensory consequences of self-movement. They find that anti-psychotic drugs strongly enhance responses of L5 IT cells to locomotion while having little effect on other cell-types. Finally, they suggest that anti-psychotics reduce long-range correlations between (predominantly) L5 cells and reduce the propagation of prediction errors to higher visual areas and suggest this maybe a mechanism by which these drugs reduce hallucinations/psychosis.
This is a large study containing a screening of many mouse-lines/expression profiles using wide-field calcium imaging. Wide-field imaging has its caveats, including a broad point-spread function of the signal and susceptibility to hemodynamic artifacts, which can make interpretation of results difficult. The authors acknowledge these problems and directly address the hemodynamic occlusion problem. It was reassuring to see supplementary 2-photon imaging of soma to complement this data-set, even though this is rather briefly described in the paper. Overall the paper's strengths are its identification of a very different response profile in the L5 IT cells compared other layers/cell-types which suggests an important role for these cells in handling integration of self-motion generated sensory predictions with sensory input. The interpretation of the responses to anti-psychotic drugs is more speculative but the result appears robust and provides an interesting basis for further studies of this effect with more specific recording techniques and possibly behavioral measures.
-
Reviewer #2 (Public Review):
Summary:
This work investigates the effects of various antipsychotic drugs on cortical responses during visuomotor integration. Using wide-field calcium imaging in a virtual reality setup, the researchers compare neuronal responses to self-generated movement during locomotion-congruent (closed loop) or locomotion-incongruent (open loop) visual stimulation. Moreover, they probe responses to unexpected visual events (halt of visual flow, sudden-onset drifting grating). The researchers find that, in contrast to a variety of excitatory and inhibitory cell types, genetically defined layer 5 excitatory neurons distinguish between the closed and the open loop condition and exhibit activity patterns in visual cortex in response to unexpected events, consistent with unsigned prediction error coding. Motivated by the …Reviewer #2 (Public Review):
Summary:
This work investigates the effects of various antipsychotic drugs on cortical responses during visuomotor integration. Using wide-field calcium imaging in a virtual reality setup, the researchers compare neuronal responses to self-generated movement during locomotion-congruent (closed loop) or locomotion-incongruent (open loop) visual stimulation. Moreover, they probe responses to unexpected visual events (halt of visual flow, sudden-onset drifting grating). The researchers find that, in contrast to a variety of excitatory and inhibitory cell types, genetically defined layer 5 excitatory neurons distinguish between the closed and the open loop condition and exhibit activity patterns in visual cortex in response to unexpected events, consistent with unsigned prediction error coding. Motivated by the idea that prediction error coding is aberrant in psychosis, the authors then inject the antipsychotic drug clozapine, and observe that this intervention specifically affects closed loop responses of layer 5 excitatory neurons, blunting the distinction between the open and closed loop conditions. Clozapine also leads to a decrease in long-range correlations between L5 activity in different brain regions, and similar effects are observed for two other antipsychotics, aripripazole and haloperidol, but not for saline or the stimulant amphetamine. The authors suggest that altered prediction error coding in layer 5 excitatory neurons due to reduced long-range correlations in L5 neurons might be a major effect of antipsychotic drugs and speculate that this might serve as a new biomarker for drug development.Strengths:
- Relevant and interesting research question:
The distinction between expected and unexpected stimuli is blunted in psychosis but the neural mechanisms remain unclear. Therefore, it is critical to understand whether and how antipsychotic drugs used to treat psychosis affect cortical responses to expected and unexpected stimuli. This study provides important insights into this question by identifying a specific cortical cell type and long-range interactions as potential targets. The authors identify layer 5 excitatory neurons as a site where functional effects of antipsychotic drugs manifest. This is particularly interesting as these deep layer neurons have been proposed to play a crucial role in computing the integration of predictions, which is thought to be disrupted in psychosis. This work therefore has the potential to guide future investigations on psychosis and predictive coding towards these layer 5 neurons, and ultimately improve our understanding of the neural basis of psychotic symptoms.- Broad investigation of different cell types and cortical regions:
One of the major strengths of this study is quasi-systematic approach towards cell types and cortical regions. By analysing a wide range of genetically defined excitatory and inhibitory cell types, the authors were able to identify layer 5 excitatory neurons as exhibiting the strongest responses to unexpected vs. expected stimuli and being the most affected by antipsychotic drugs. Hence, this quasi-systematic approach provides valuable insights into the functional effects of antipsychotic drugs on the brain, and can guide future investigations towards the mechanisms by which these medications affect cortical neurons.- Bridging theory with experiments
Another strength of this study is its theoretical framework, which is grounded in the predictive coding theory. The authors use this theory as a guiding principle to motivate their experimental approach connecting visual responses in different layers with psychosis and antipsychotic drugs. This integration of theory and experimentation is a powerful approach to tie together the various findings the authors present and to contribute to the development of a coherent model of how the brain processes visual information both in health and in disease.Weaknesses:
- Unclear relevance for psychosis research
From the study, it remains unclear whether the findings might indeed be able to normalise altered predictive coding in psychosis. Psychosis is characterised by a blunted distinction between predicted and unpredicted stimuli. The main results of this study indicate that antipsychotic drugs further blunt the distinction between predicted and unpredicted stimuli, which would suggest that antipsychotic drugs would deteriorate rather than ameliorate the predictive coding deficit found in psychosis. However, these findings were based on observations in wild-type mice at baseline. Given that antipsychotics are thought to have little effects in health but potent antipsychotic effects in psychosis, it seems possible that the presented results might be different in a condition modelling a psychotic state, for example after a dopamine-agonistic or a NMDA-antagonistic challenge. Therefore, future work in models of psychotic states is needed to further investigate the translational relevance of these findings.- Incomplete testing of predictive coding interpretation
While the investigation of neuronal responses to different visual flow stimuli is interesting, it remains open whether these responses indeed reflect internal representations in the framework of predictive coding. While the responses are consistent with internal representation as defined by the researchers, i.e., unsigned prediction error signals, an alternative interpretation might be that responses simply reflect sensory bottom-up signals that are more related to some low-level stimulus characteristics than to prediction errors. Moreover, this interpretational uncertainty is compounded by the fact that the used experimental paradigms were not suited to test whether behaviour is impacted as a function of the visual stimulation which makes it difficult to assess what the internal representation of the animal actually was. For these reasons, the observed effects might reflect simple bottom-up sensory processing alterations and not necessarily have any functional consequences. While this potential alternative explanation does not detract from the value of the study, future work would be needed to explain the effect of antipsychotic drugs on responses to visual flow. For example, experimental designs that systematically vary the predictive strength of coupled events or that include a behavioural readout might be more suited to draw from conclusions about whether antipsychotic drugs indeed alter internal representations.Conclusion:
Overall, the results support the idea that antipsychotic drugs affect neural responses to predicted and unpredicted stimuli in deep layers of cortex. Although some future work is required to establish whether this observation can indeed be explained by a drug-specific effect on predictive coding, the study provides important insights into the neural underpinnings of visual processing and antipsychotic drugs, which is expected to guide future investigations on the predictive coding hypothesis of psychosis. This will be of broad interest to neuroscientists working on predictive coding in health and disease. -
Reviewer #3 (Public Review):
The study examines how different cell types in various regions of the mouse dorsal cortex respond to visuomotor integration and how antipsychotic drugs impacts these responses. Specifically, in contrast to most cell types, the authors found that activity in Layer 5 intratelencephalic neurons (Tlx3+) and Layer 6 neurons (Ntsr1+) differentiated between open loop and closed loop visuomotor conditions. Focussing on Layer 5 neurons, they found that the activity of these neurons also differentiated between negative and positive prediction errors during visuomotor integration. The authors further demonstrated that the antipsychotic drugs reduced the correlation of Layer 5 neuronal activity across regions of the cortex, and impaired the propagation of visuomotor mismatch responses (specifically, negative prediction …
Reviewer #3 (Public Review):
The study examines how different cell types in various regions of the mouse dorsal cortex respond to visuomotor integration and how antipsychotic drugs impacts these responses. Specifically, in contrast to most cell types, the authors found that activity in Layer 5 intratelencephalic neurons (Tlx3+) and Layer 6 neurons (Ntsr1+) differentiated between open loop and closed loop visuomotor conditions. Focussing on Layer 5 neurons, they found that the activity of these neurons also differentiated between negative and positive prediction errors during visuomotor integration. The authors further demonstrated that the antipsychotic drugs reduced the correlation of Layer 5 neuronal activity across regions of the cortex, and impaired the propagation of visuomotor mismatch responses (specifically, negative prediction errors) across Layer 5 neurons of the cortex, suggesting a decoupling of long-range cortical interactions.
The data when taken as a whole demonstrate that visuomotor integration in deeper cortical layers is different than in superficial layers and is more susceptible to disruption by antipsychotics. Whilst it is already known that deep layers integrate information differently from superficial layers, this study provides more specific insight into these differences. Moreover, this study provides a first step into understanding the potential mechanism by which antipsychotics may exert their effect.
Whilst the paper has several strengths, the robustness of its conclusions is limited by weaknesses in statistical analyses. A summary of the paper's strengths and weaknesses follow.Strengths:
The authors perform an extensive investigation of how different cortical cell types (including Layer 2/3, 4 , 5, and 6 excitatory neurons, as well as PV, VIP, and SST inhibitory interneurons) in different cortical areas (including primary and secondary visual areas as well as motor and premotor areas), respond to visuomotor integration. This investigation provides strong support to the idea that deep layer neurons are indeed unique in their computational properties. This large data set will be of considerable interest to neuroscientists interested in cortical processing.
The authors also provide several lines of evidence that visuomotor information is differentially integrated in deep vs. superficial layers. They show that this is true across experimental paradigms of visuomotor processing (open loop, closed loop, mismatch, drifting grating conditions) and experimental manipulations, with the demonstration that Layer 5 visuomotor integration is more sensitive to disruption by the antipsychotic drug clozapine, compared with cortex as a whole.The study further uses multiple drugs (clozapine, aripiprazole and haloperidol) to bolster its conclusion that antipsychotic drugs disrupt correlated cortical activity in Layer 5 neurons, and further demonstrates that this disruption is specific to antipsychotics, as the psychostimulant amphetamine shows no such effect.
In widefield calcium imaging experiments, the authors effectively control for the impact of hemodynamic occlusions in their results, and try to minimize this impact using a crystal skull preparation, which performs better than traditional glass windows. Moreover, they examine key findings in widefield calcium imaging experiments with two-photon imaging.
Weaknesses:
A critical weakness of the paper is its statistical analysis and data representations. The study does not use mice as its independent unit for statistical comparisons but rather relies on other definitions (see authors' Tabe S1), without appropriate justification, which results in an inflation of sample sizes. For example, in Figure 2, the independent statistical unit is defined as sessions instead of mice, and in Figures 6 and 7 its pairs of cortical regions of interest. This greatly inflates N by at least 1-2 orders of magnitude compared to using N = number of mice. With such inflated sample sizes, it becomes more likely to find spurious differences between groups as significant.
It should be noted, however, that the authors have redone some analyses in their revision, specifically for Figure 1L, in which mice are used as independent units (shown in Figure S4) without any change in conclusion. However, this is not done for all other problematic figures in the manuscript.
Furthermore - and related to the previous comment - trace averages and SEMs across the figures of the manuscript come from hundreds to thousands of data points (e.g. locomotion onsets or cells) repeatedly measured from only a handful of mice. This can be visually misleading for the reader (even if statistics are not being formally performed on these traces) as it artificially reduces the size of the SEM masking the true variability (and size) of the effects portrayed in the paper. Again, this practice is only justified if the data (e.g. locomotion onsets) within a mouse is actually statistically independent, which the authors do not test for or justify.
It should be noted that the authors do show some trace averages and SEMs for a some of their data (Figure S2), in which N = individual mice, without any change in conclusion. However, this is not done for all other problematic figures in the manuscript.
The above statistical problems are apparent throughout the manuscript. The more disciplined approach would be to average the data within a mouse, and then use the mouse as an independent unit for statistical comparison and/or for the purposes of presenting means and SEMs for aggregate data. Alternatively, the authors should provide clear justification in the manuscript for opting for other definitions of N.
Finally, it is important to note that whilst the study demonstrates that antipsychotics may selectively impact visuomotor integration in L5 neurons, it does not show that this effect is necessary or sufficient for the action of antipsychotics; though this is likely beyond the scope of the study it is something for readers to keep in mind.
-
-
Author Response
Reviewer #1 (Public Review):
The authors present a study of visuo-motor coupling primarily using wide-field calcium imaging to measure activity across the dorsal visual cortex. They used different mouse lines or systemically injected viral vectors to allow imaging of calcium activity from specific cell-types with a particular focus on a mouse-line that expresses GCaMP in layer 5 IT (intratelencephalic) neurons. They examined the question of how the neural response to predictable visual input, as a consequence of self-motion, differed from responses to unpredictable input. They identify layer 5 IT cells as having a different response pattern to other cell-types/layers in that they show differences in their response to closed-loop (i.e. predictable) vs open-loop (i.e. unpredictable) stimulation whereas other cell-types …
Author Response
Reviewer #1 (Public Review):
The authors present a study of visuo-motor coupling primarily using wide-field calcium imaging to measure activity across the dorsal visual cortex. They used different mouse lines or systemically injected viral vectors to allow imaging of calcium activity from specific cell-types with a particular focus on a mouse-line that expresses GCaMP in layer 5 IT (intratelencephalic) neurons. They examined the question of how the neural response to predictable visual input, as a consequence of self-motion, differed from responses to unpredictable input. They identify layer 5 IT cells as having a different response pattern to other cell-types/layers in that they show differences in their response to closed-loop (i.e. predictable) vs open-loop (i.e. unpredictable) stimulation whereas other cell-types showed similar activity patterns between these two conditions. They analyze the latencies of responses to visuomotor prediction errors obtained by briefly pausing the display while the mouse is running, causing a negative prediction error, or by presenting an unpredicted visual input causing a positive prediction error. They suggest that neural responses related to these prediction errors originate in V1, however, I would caution against over-interpretation of this finding as judging the latency of slow calcium responses in wide-field signals is very challenging and this result was not statistically compared between areas.
Surprisingly, they find that presentation of a visual grating actually decreases the responses of L5 IT cells in V1. They interpret their results within a predictive coding framework that the last author has previously proposed. The response pattern of the L5 IT cells leads them to propose that these cells may act as 'internal representation' neurons that carry a representation of the brain's model of its environment. Though this is rather speculative. They subsequently examine the responses of these cells to anti-psychotic drugs (e.g. clozapine) with the reasoning that a leading theory of schizophrenia is a disturbance of the brain's internal model and/or a failure to correctly predict the sensory consequences of self-movement. They find that anti-psychotic drugs strongly enhance responses of L5 IT cells to locomotion while having little effect on other cell-types. Finally, they suggest that anti-psychotics reduce long-range correlations between (predominantly) L5 cells and reduce the propagation of prediction errors to higher visual areas and suggest this may be a mechanism by which these drugs reduce hallucinations/psychosis.
This is a large study containing a screening of many mouse-lines/expression profiles using wide-field calcium imaging. Wide-field imaging has its caveats, including a broad point-spread function of the signal and susceptibility to hemodynamic artifacts, which can make interpretation of results difficult. The authors acknowledge these problems and directly address the hemodynamic occlusion problem. It was reassuring to see supplementary 2-photon imaging of soma to complement this data-set, even though this is rather briefly described in the paper.
We will expand on the discussion of caveats as suggested.
Overall the paper's strengths are its identification of a very different response profile in the L5 IT cells compared other layers/cell-types which suggests an important role for these cells in handling integration of self-motion generated sensory predictions with sensory input. The interpretation of the responses to anti-psychotic drugs is more speculative but the result appears robust and provides an interesting basis for further studies of this effect with more specific recording techniques and possibly behavioral measures.
Reviewer #2 (Public Review):
Summary:
This work investigates the effects of various antipsychotic drugs on cortical responses during visuomotor integration. Using wide-field calcium imaging in a virtual reality setup, the researchers compare neuronal responses to self-generated movement during locomotion-congruent (closed loop) or locomotion-incongruent (open loop) visual stimulation. Moreover, they probe responses to unexpected visual events (halt of visual flow, sudden-onset drifting grating). The researchers find that, in contrast to a variety of excitatory and inhibitory cell types, genetically defined layer 5 excitatory neurons distinguish between the closed and the open loop condition and exhibit activity patterns in visual cortex in response to unexpected events, consistent with unsigned prediction error coding. Motivated by the idea that prediction error coding is aberrant in psychosis, the authors then inject the antipsychotic drug clozapine, and observe that this intervention specifically affects closed loop responses of layer 5 excitatory neurons, blunting the distinction between the open and closed loop conditions. Clozapine also leads to a decrease in long-range correlations between L5 activity in different brain regions, and similar effects are observed for two other antipsychotics, aripripazole and haloperidol, but not for the stimulant amphetamine. The authors suggest that altered prediction error coding in layer 5 excitatory neurons due to reduced long-range correlations in L5 neurons might be a major effect of antipsychotic drugs and speculate that this might serve as a new biomarker for drug development.
Strengths:
- Relevant and interesting research question:
The distinction between expected and unexpected stimuli is blunted in psychosis but the neural mechanisms remain unclear. Therefore, it is critical to understand whether and how antipsychotic drugs used to treat psychosis affect cortical responses to expected and unexpected stimuli. This study provides important insights into this question by identifying a specific cortical cell type and long-range interactions as potential targets. The authors identify layer 5 excitatory neurons as a site where functional effects of antipsychotic drugs manifest. This is particularly interesting as these deep layer neurons have been proposed to play a crucial role in computing the integration of predictions, which is thought to be disrupted in psychosis. This work therefore has the potential to guide future investigations on psychosis and predictive coding towards these layer 5 neurons, and ultimately improve our understanding of the neural basis of psychotic symptoms.
- Broad investigation of different cell types and cortical regions:
One of the major strengths of this study is quasi-systematic approach towards cell types and cortical regions. By analysing a wide range of genetically defined excitatory and inhibitory cell types, the authors were able to identify layer 5 excitatory neurons as exhibiting the strongest responses to unexpected vs. expected stimuli and being the most affected by antipsychotic drugs. Hence, this quasi-systematic approach provides valuable insights into the functional effects of antipsychotic drugs on the brain, and can guide future investigations towards the mechanisms by which these medications affect cortical neurons.
- Bridging theory with experiments
Another strength of this study is its theoretical framework, which is grounded in the predictive coding theory. The authors use this theory as a guiding principle to motivate their experimental approach connecting visual responses in different layers with psychosis and antipsychotic drugs. This integration of theory and experimentation is a powerful approach to tie together the various findings the authors present and to contribute to the development of a coherent model of how the brain processes visual information both in health and in disease.
Weaknesses:
- Unclear relevance for psychosis research
From the study, it remains unclear whether the findings might indeed be able to normalise altered predictive coding in psychosis. Psychosis is characterised by a blunted distinction between predicted and unpredicted stimuli. The results of this study indicate that antipsychotic drugs further blunt the distinction between predicted and unpredicted stimuli, which would suggest that antipsychotic drugs would deteriorate rather than ameliorate the predictive coding deficit found in psychosis. However, these findings were based on observations in wild-type mice at baseline. Given that antipsychotics are thought to have little effects in health but potent antipsychotic effects in psychosis, it seems possible that the presented results might be different in a condition modelling a psychotic state, for example after a dopamine-agonistic or a NMDA-antagonistic challenge. Therefore, future work in models of psychotic states is needed to further investigate the translational relevance of these findings.
We fully agree that it is unclear how the effects of antipsychotics in mice relate to the drug effects that would be observed in schizophrenic patients. It is also correct that the reduction of the difference between closed and open loop locomotion onset response in L5 IT neurons (Figure 4) is not what we would have expected to find under the assumption that psychosis is characterized by a blunted distinction between predicted and unpredicted stimuli. We are not sure how to interpret this finding. However, it is probably important to note that the difference is only reduced when using a normalized comparison. Looking just at the subtraction of the two curves, the difference between closed and open loop locomotion onset responses remains unchanged before and after antipsychotic drug injection. The finding of a decorrelation of layer 5 activity, however, is easier to interpret under the assumption that layer 5 functions as an internal representation. If speech hallucinations, for example, are the consequence of a spurious activation of internal representations in speech processing areas of cortex, then antipsychotics might reduce the probability of these spurious activation events by reducing the lateral influence between layer 5 neurons in different cortical areas.
We do indeed plan to address the question of how antipsychotics influence cortical processing in mouse models of schizophrenia in the future.
- Incomplete testing of predictive coding interpretation
While the investigation of neuronal responses to different visual flow stimuli Is interesting, it remains open whether these responses indeed reflect internal representations in the framework of predictive coding. While the responses are consistent with internal representation as defined by the researchers, i.e., unsigned prediction error signals, an alternative interpretation might be that responses simply reflect sensory bottom-up signals that are more related to some low-level stimulus characteristics than to prediction errors.
This is correct – we will expand on the discussion of this point in the manuscript.
Moreover, This interpretational uncertainty is compounded by the fact that the used experimental paradigms were not suited to test whether behaviour is impacted as a function of the visual stimulation which makes it difficult to assess what the internal representation of the animal actual was. For these reasons, the observed effects might reflect simple bottom-up sensory processing alterations and not necessarily have any functional consequences. While this potential alternative explanation does not detract from the value of the study, future work would be needed to explain the effect of antipsychotic drugs on responses to visual flow. For example, experimental designs that systematically vary the predictive strength of coupled events or that include a behavioural readout might be more suited to draw from conclusions about whether antipsychotic drugs indeed alter internal representations.
We agree that much additional work will be necessary to identify internal representation neurons. However, it is difficult to envision how behavioral output could be used to make inferences about internal representations in sensory areas of cortex. In humans, for example, there is evidence that internal representations in visual cortex and behavioral output are not always directly related: binocular rivalry activates representations of both stimuli shown in visual cortex, while the conscious experience that drives behavioral output is only of one of the two stimuli. Hence, we would assume that the internal representation in visual cortex does not necessarily relate to behavioral output.
- Methodological constraints of experimental design
While the study findings provide valuable insights into the potential effects of antipsychotic drugs, it is important to acknowledge that there may be some methodological constraints that could impact the interpretation of the results. More specifically, the experimental design does not include a negative control condition or different doses. These conditions would help to ensure that the observed effects are not due to unspecific effects related to injection-induced stress or time, and not confined to a narrow dose range that might or might not reflect therapeutic doses used in humans. Hence, future work is needed to confirm that the observed effects indeed represent specific drug effects that are relevant to antipsychotic action.
We agree that both dosages and a broader spectrum of non-antipsychotic compounds will need to be investigated. We are in the process of building a screening pipeline to perform exactly these types of experiments. We would however argue that the paper already includes a control condition in the form of the amphetamine data (Figure 7). While it is possible that amphetamine might have an effect that exactly cancels out potential i.p. injection- or stress-induced changes, we would argue it is more probable that these changes had no measurable effect on Tlx3 positive L5 IT neuron calcium activity per se. We will provide additional evidence that time or injection stress alone do not result in the observed effects.
Conclusion:
Overall, the results support the idea that antipsychotic drugs affect neural responses to predicted and unpredicted stimuli in deep layers of cortex. Although some future work is required to establish whether this observation can indeed be explained by a drug-specific effect on predictive coding, the study provides important insights into the neural underpinnings of visual processing and antipsychotic drugs, which is expected to guide future investigations on the predictive coding hypothesis of psychosis. This will be of broad interest to neuroscientists working on predictive coding in health and in disease.
Reviewer #3 (Public Review):
The study examines how different cell types in various regions of the mouse dorsal cortex respond to visuomotor integration and how antipsychotic drugs impacts these responses. Specifically, in contrast to most cell types, the authors found that activity in Layer 5 intratelencephalic neurons (Tlx3+) and Layer 6 neurons (Ntsr1+) differentiated between open loop and closed loop visuomotor conditions. Focussing on Layer 5 neurons, they found that the activity of these neurons also differentiated between negative and positive prediction errors during visuomotor integration. The authors further demonstrated that the antipsychotic drugs reduced the correlation of Layer 5 neuronal activity across regions of the cortex, and impaired the propagation of visuomotor mismatch responses (specifically, negative prediction errors) across Layer 5 neurons of the cortex, suggesting a decoupling of long-range cortical interactions.
The data when taken as a whole demonstrate that visuomotor integration in deeper cortical layers is different than in superficial layers and is more susceptible to disruption by antipsychotics. Whilst it is already known that deep layers integrate information differently from superficial layers, this study provides more specific insight into these differences. Moreover, this study provides a first step into understanding the potential mechanism by which antipsychotics may exert their effect.
Whilst the paper has several strengths, the robustness of its conclusions is limited by its questionable statistical analyses. A summary of the paper's strengths and weaknesses follow.
Strengths:
The authors perform an extensive investigation of how different cortical cell types (including Layer 2/3, 4 , 5, and 6 excitatory neurons, as well as PV, VIP, and SST inhibitory interneurons) in different cortical areas (including primary and secondary visual areas as well as motor and premotor areas), respond to visuomotor integration. This investigation provides strong support to the idea that deep layer neurons are indeed unique in their computational properties. This large data set will be of considerable interest to neuroscientists interested in cortical processing.
The authors also provide several lines of evidence that visuomotor information is differentially integrated in deep vs. superficial layers. They show that this is true across experimental paradigms of visuomotor processing (open loop, closed loop, mismatch, drifting grating conditions) and experimental manipulations, with the demonstration that Layer 5 visuomotor integration is more sensitive to disruption by the antipsychotic drug clozapine, compared with cortex as a whole.
The study further uses multiple drugs (clozapine, aripiprazole and haloperidol) to bolster its conclusion that antipsychotic drugs disrupt correlated cortical activity in Layer 5 neurons, and further demonstrates that this disruption is specific to antipsychotics, as the psychostimulant amphetamine shows no such effect.
In widefield calcium imaging experiments, the authors effectively control for the impact of hemodynamic occlusions in their results, and try to minimize this impact using a crystal skull preparation, which performs better than traditional glass windows. Moreover, they examine key findings in widefield calcium imaging experiments with two-photon imaging.
Weaknesses:
A critical weakness of the paper is its statistical analysis. The study does not use mice as its independent unit for statistical comparisons but rather relies on other definitions, without appropriate justification, which results in an inflation of sample sizes.
We will expand on both analyses and justifications throughout.
For example, in Figure 1, independent samples are defined as locomotion onsets, leading to sample sizes of approx. 400-2000 despite only using 6 mice for the experiment. This is only justified if the data from locomotion onsets within a mouse is actually statistically independent, which the authors do not test for, and which seems unlikely. With such inflated sample sizes, it becomes more likely to find spurious differences between groups as significant. It also remains unclear how many locomotion onsets come from each mouse; the results could be dominated by a small subset of mice with the most locomotion onsets. The more disciplined approach to statistical analysis of the dataset is to average the data associated with locomotion onsets within a mouse, and then use the mouse as an independent unit for statistical comparison. A second example, for instance, is in Figure 2L, where the independent statistical unit is defined as cortical regions instead of mice, with the left and right hemispheres counting as independent samples; again this is not justified. Is the activity of cortical regions within a mouse and across cortical hemispheres really statistically independent? The problem is apparent throughout the manuscript and for each data set collected.
This may partially be a misunderstanding. Figures 1F-1K indeed use locomotion onsets as a unit, but there were no statistical comparisons. In these Figures we were addressing the question of whether locomotion onsets in closed loop differ from those in open loop. Thus, we quantify variability as a unit of locomotion onsets. The question of mouse-to-mouse variability of this analysis is a slightly different one. We did include the same analysis (for visual cortex) with the variability calculated across mice as Figure S2. We will expand this supplementary figure with the equivalent data of Figure 3 to further address this concern.
For Figure 1L (we assume the reviewer means Figure 1L, not Figure 2L), the unit we used for analysis was cortical area. We will update and improve the analysis. This was indeed not optimal, and we will replace the statistical testing with hierarchical bootstrap (https://www.ncbi.nlm.nih.gov/pmc/articles/PMC7906290/) to account for nested data.
An additional statistical issue is that it is unclear if the authors are correcting for the use of multiple statistical tests (as in for example Figure 1L and Figure 2B,D). In general, the use of statistics by the authors is not justified in the text.
We will update and improve the analysis shown in Figure 1L.
In Figures 2B and 2D, we think adding family-wise error correction would be slightly misleading. We could add a correction – our conclusions would remain unchanged almost independent of the choice of correction (most of the significant p values are infinitesimally small, see Table S1). However, our interpretation is not focusing on one particular comparison (of many possible comparisons) that is significant - all comparisons between closed and open loop data points were significant in the L5 IT recordings and none of them were significant in the recordings in C57BL/6 mice that expressed GCaMP brain-wide.
Finally, it is important to note that whilst the study demonstrates that antipsychotics may selectively impact visuomotor integration in L5 neurons, it does not show that this effect is necessary or sufficient for the action of antipsychotics; though this is likely beyond the scope of the study it is something for readers to keep in mind.
We fully agree, it is still unclear how the effects we observe in our work relate to the treatment relevant effects in patients. We will expand on this point in the discussion.
-
eLife assessment
This important study uses calcium imaging in mice to advance our understanding of the effect of antipsychotic drugs on neural functioning. The evidence supporting the conclusions is solid, although the statistical testing of the data may be improved. This work will be of interest to neuroscientists working on visual processing and psychosis researchers.
-
Reviewer #1 (Public Review):
The authors present a study of visuo-motor coupling primarily using wide-field calcium imaging to measure activity across the dorsal visual cortex. They used different mouse lines or systemically injected viral vectors to allow imaging of calcium activity from specific cell-types with a particular focus on a mouse-line that expresses GCaMP in layer 5 IT (intratelencephalic) neurons. They examined the question of how the neural response to predictable visual input, as a consequence of self-motion, differed from responses to unpredictable input. They identify layer 5 IT cells as having a different response pattern to other cell-types/layers in that they show differences in their response to closed-loop (i.e. predictable) vs open-loop (i.e. unpredictable) stimulation whereas other cell-types showed similar …
Reviewer #1 (Public Review):
The authors present a study of visuo-motor coupling primarily using wide-field calcium imaging to measure activity across the dorsal visual cortex. They used different mouse lines or systemically injected viral vectors to allow imaging of calcium activity from specific cell-types with a particular focus on a mouse-line that expresses GCaMP in layer 5 IT (intratelencephalic) neurons. They examined the question of how the neural response to predictable visual input, as a consequence of self-motion, differed from responses to unpredictable input. They identify layer 5 IT cells as having a different response pattern to other cell-types/layers in that they show differences in their response to closed-loop (i.e. predictable) vs open-loop (i.e. unpredictable) stimulation whereas other cell-types showed similar activity patterns between these two conditions. They analyze the latencies of responses to visuomotor prediction errors obtained by briefly pausing the display while the mouse is running, causing a negative prediction error, or by presenting an unpredicted visual input causing a positive prediction error. They suggest that neural responses related to these prediction errors originate in V1, however, I would caution against over-interpretation of this finding as judging the latency of slow calcium responses in wide-field signals is very challenging and this result was not statistically compared between areas. Surprisingly, they find that presentation of a visual grating actually decreases the responses of L5 IT cells in V1. They interpret their results within a predictive coding framework that the last author has previously proposed. The response pattern of the L5 IT cells leads them to propose that these cells may act as 'internal representation' neurons that carry a representation of the brain's model of its environment. Though this is rather speculative. They subsequently examine the responses of these cells to anti-psychotic drugs (e.g. clozapine) with the reasoning that a leading theory of schizophrenia is a disturbance of the brain's internal model and/or a failure to correctly predict the sensory consequences of self-movement. They find that anti-psychotic drugs strongly enhance responses of L5 IT cells to locomotion while having little effect on other cell-types. Finally, they suggest that anti-psychotics reduce long-range correlations between (predominantly) L5 cells and reduce the propagation of prediction errors to higher visual areas and suggest this may be a mechanism by which these drugs reduce hallucinations/psychosis.
This is a large study containing a screening of many mouse-lines/expression profiles using wide-field calcium imaging. Wide-field imaging has its caveats, including a broad point-spread function of the signal and susceptibility to hemodynamic artifacts, which can make interpretation of results difficult. The authors acknowledge these problems and directly address the hemodynamic occlusion problem. It was reassuring to see supplementary 2-photon imaging of soma to complement this data-set, even though this is rather briefly described in the paper. Overall the paper's strengths are its identification of a very different response profile in the L5 IT cells compared other layers/cell-types which suggests an important role for these cells in handling integration of self-motion generated sensory predictions with sensory input. The interpretation of the responses to anti-psychotic drugs is more speculative but the result appears robust and provides an interesting basis for further studies of this effect with more specific recording techniques and possibly behavioral measures.
-
Reviewer #2 (Public Review):
Summary:
This work investigates the effects of various antipsychotic drugs on cortical responses during visuomotor integration. Using wide-field calcium imaging in a virtual reality setup, the researchers compare neuronal responses to self-generated movement during locomotion-congruent (closed loop) or locomotion-incongruent (open loop) visual stimulation. Moreover, they probe responses to unexpected visual events (halt of visual flow, sudden-onset drifting grating). The researchers find that, in contrast to a variety of excitatory and inhibitory cell types, genetically defined layer 5 excitatory neurons distinguish between the closed and the open loop condition and exhibit activity patterns in visual cortex in response to unexpected events, consistent with unsigned prediction error coding. Motivated by the …
Reviewer #2 (Public Review):
Summary:
This work investigates the effects of various antipsychotic drugs on cortical responses during visuomotor integration. Using wide-field calcium imaging in a virtual reality setup, the researchers compare neuronal responses to self-generated movement during locomotion-congruent (closed loop) or locomotion-incongruent (open loop) visual stimulation. Moreover, they probe responses to unexpected visual events (halt of visual flow, sudden-onset drifting grating). The researchers find that, in contrast to a variety of excitatory and inhibitory cell types, genetically defined layer 5 excitatory neurons distinguish between the closed and the open loop condition and exhibit activity patterns in visual cortex in response to unexpected events, consistent with unsigned prediction error coding. Motivated by the idea that prediction error coding is aberrant in psychosis, the authors then inject the antipsychotic drug clozapine, and observe that this intervention specifically affects closed loop responses of layer 5 excitatory neurons, blunting the distinction between the open and closed loop conditions. Clozapine also leads to a decrease in long-range correlations between L5 activity in different brain regions, and similar effects are observed for two other antipsychotics, aripripazole and haloperidol, but not for the stimulant amphetamine. The authors suggest that altered prediction error coding in layer 5 excitatory neurons due to reduced long-range correlations in L5 neurons might be a major effect of antipsychotic drugs and speculate that this might serve as a new biomarker for drug development.
Strengths:
- Relevant and interesting research question:
The distinction between expected and unexpected stimuli is blunted in psychosis but the neural mechanisms remain unclear. Therefore, it is critical to understand whether and how antipsychotic drugs used to treat psychosis affect cortical responses to expected and unexpected stimuli. This study provides important insights into this question by identifying a specific cortical cell type and long-range interactions as potential targets. The authors identify layer 5 excitatory neurons as a site where functional effects of antipsychotic drugs manifest. This is particularly interesting as these deep layer neurons have been proposed to play a crucial role in computing the integration of predictions, which is thought to be disrupted in psychosis. This work therefore has the potential to guide future investigations on psychosis and predictive coding towards these layer 5 neurons, and ultimately improve our understanding of the neural basis of psychotic symptoms.
- Broad investigation of different cell types and cortical regions:
One of the major strengths of this study is quasi-systematic approach towards cell types and cortical regions. By analysing a wide range of genetically defined excitatory and inhibitory cell types, the authors were able to identify layer 5 excitatory neurons as exhibiting the strongest responses to unexpected vs. expected stimuli and being the most affected by antipsychotic drugs. Hence, this quasi-systematic approach provides valuable insights into the functional effects of antipsychotic drugs on the brain, and can guide future investigations towards the mechanisms by which these medications affect cortical neurons.
- Bridging theory with experiments:
Another strength of this study is its theoretical framework, which is grounded in the predictive coding theory. The authors use this theory as a guiding principle to motivate their experimental approach connecting visual responses in different layers with psychosis and antipsychotic drugs. This integration of theory and experimentation is a powerful approach to tie together the various findings the authors present and to contribute to the development of a coherent model of how the brain processes visual information both in health and in disease.
Weaknesses:
- Unclear relevance for psychosis research:
From the study, it remains unclear whether the findings might indeed be able to normalise altered predictive coding in psychosis. Psychosis is characterised by a blunted distinction between predicted and unpredicted stimuli. The results of this study indicate that antipsychotic drugs further blunt the distinction between predicted and unpredicted stimuli, which would suggest that antipsychotic drugs would deteriorate rather than ameliorate the predictive coding deficit found in psychosis. However, these findings were based on observations in wild-type mice at baseline. Given that antipsychotics are thought to have little effects in health but potent antipsychotic effects in psychosis, it seems possible that the presented results might be different in a condition modelling a psychotic state, for example after a dopamine-agonistic or a NMDA-antagonistic challenge. Therefore, future work in models of psychotic states is needed to further investigate the translational relevance of these findings.
- Incomplete testing of predictive coding interpretation:
While the investigation of neuronal responses to different visual flow stimuli Is interesting, it remains open whether these responses indeed reflect internal representations in the framework of predictive coding. While the responses are consistent with internal representation as defined by the researchers, i.e., unsigned prediction error signals, an alternative interpretation might be that responses simply reflect sensory bottom-up signals that are more related to some low-level stimulus characteristics than to prediction errors. Moreover, This interpretational uncertainty is compounded by the fact that the used experimental paradigms were not suited to test whether behaviour is impacted as a function of the visual stimulation which makes it difficult to assess what the internal representation of the animal actual was. For these reasons, the observed effects might reflect simple bottom-up sensory processing alterations and not necessarily have any functional consequences. While this potential alternative explanation does not detract from the value of the study, future work would be needed to explain the effect of antipsychotic drugs on responses to visual flow. For example, experimental designs that systematically vary the predictive strength of coupled events or that include a behavioural readout might be more suited to draw from conclusions about whether antipsychotic drugs indeed alter internal representations.
- Methodological constraints of experimental design:
While the study findings provide valuable insights into the potential effects of antipsychotic drugs, it is important to acknowledge that there may be some methodological constraints that could impact the interpretation of the results. More specifically, the experimental design does not include a negative control condition or different doses. These conditions would help to ensure that the observed effects are not due to unspecific effects related to injection-induced stress or time, and not confined to a narrow dose range that might or might not reflect therapeutic doses used in humans. Hence, future work is needed to confirm that the observed effects indeed represent specific drug effects that are relevant to antipsychotic action.
Conclusion:
Overall, the results support the idea that antipsychotic drugs affect neural responses to predicted and unpredicted stimuli in deep layers of cortex. Although some future work is required to establish whether this observation can indeed be explained by a drug-specific effect on predictive coding, the study provides important insights into the neural underpinnings of visual processing and antipsychotic drugs, which is expected to guide future investigations on the predictive coding hypothesis of psychosis. This will be of broad interest to neuroscientists working on predictive coding in health and in disease.
-
Reviewer #3 (Public Review):
The study examines how different cell types in various regions of the mouse dorsal cortex respond to visuomotor integration and how antipsychotic drugs impacts these responses. Specifically, in contrast to most cell types, the authors found that activity in Layer 5 intratelencephalic neurons (Tlx3+) and Layer 6 neurons (Ntsr1+) differentiated between open loop and closed loop visuomotor conditions. Focussing on Layer 5 neurons, they found that the activity of these neurons also differentiated between negative and positive prediction errors during visuomotor integration. The authors further demonstrated that the antipsychotic drugs reduced the correlation of Layer 5 neuronal activity across regions of the cortex, and impaired the propagation of visuomotor mismatch responses (specifically, negative prediction …
Reviewer #3 (Public Review):
The study examines how different cell types in various regions of the mouse dorsal cortex respond to visuomotor integration and how antipsychotic drugs impacts these responses. Specifically, in contrast to most cell types, the authors found that activity in Layer 5 intratelencephalic neurons (Tlx3+) and Layer 6 neurons (Ntsr1+) differentiated between open loop and closed loop visuomotor conditions. Focussing on Layer 5 neurons, they found that the activity of these neurons also differentiated between negative and positive prediction errors during visuomotor integration. The authors further demonstrated that the antipsychotic drugs reduced the correlation of Layer 5 neuronal activity across regions of the cortex, and impaired the propagation of visuomotor mismatch responses (specifically, negative prediction errors) across Layer 5 neurons of the cortex, suggesting a decoupling of long-range cortical interactions.
The data when taken as a whole demonstrate that visuomotor integration in deeper cortical layers is different than in superficial layers and is more susceptible to disruption by antipsychotics. Whilst it is already known that deep layers integrate information differently from superficial layers, this study provides more specific insight into these differences. Moreover, this study provides a first step into understanding the potential mechanism by which antipsychotics may exert their effect.
Whilst the paper has several strengths, the robustness of its conclusions is limited by its questionable statistical analyses. A summary of the paper's strengths and weaknesses follow.
Strengths:
The authors perform an extensive investigation of how different cortical cell types (including Layer 2/3, 4 , 5, and 6 excitatory neurons, as well as PV, VIP, and SST inhibitory interneurons) in different cortical areas (including primary and secondary visual areas as well as motor and premotor areas), respond to visuomotor integration. This investigation provides strong support to the idea that deep layer neurons are indeed unique in their computational properties. This large data set will be of considerable interest to neuroscientists interested in cortical processing.
The authors also provide several lines of evidence that visuomotor information is differentially integrated in deep vs. superficial layers. They show that this is true across experimental paradigms of visuomotor processing (open loop, closed loop, mismatch, drifting grating conditions) and experimental manipulations, with the demonstration that Layer 5 visuomotor integration is more sensitive to disruption by the antipsychotic drug clozapine, compared with cortex as a whole.
The study further uses multiple drugs (clozapine, aripiprazole and haloperidol) to bolster its conclusion that antipsychotic drugs disrupt correlated cortical activity in Layer 5 neurons, and further demonstrates that this disruption is specific to antipsychotics, as the psychostimulant amphetamine shows no such effect.
In widefield calcium imaging experiments, the authors effectively control for the impact of hemodynamic occlusions in their results, and try to minimize this impact using a crystal skull preparation, which performs better than traditional glass windows. Moreover, they examine key findings in widefield calcium imaging experiments with two-photon imaging.
Weaknesses:
A critical weakness of the paper is its statistical analysis. The study does not use mice as its independent unit for statistical comparisons but rather relies on other definitions, without appropriate justification, which results in an inflation of sample sizes. For example, in Figure 1, independent samples are defined as locomotion onsets, leading to sample sizes of approx. 400-2000 despite only using 6 mice for the experiment. This is only justified if the data from locomotion onsets within a mouse is actually statistically independent, which the authors do not test for, and which seems unlikely. With such inflated sample sizes, it becomes more likely to find spurious differences between groups as significant. It also remains unclear how many locomotion onsets come from each mouse; the results could be dominated by a small subset of mice with the most locomotion onsets. The more disciplined approach to statistical analysis of the dataset is to average the data associated with locomotion onsets within a mouse, and then use the mouse as an independent unit for statistical comparison. A second example, for instance, is in Figure 2L, where the independent statistical unit is defined as cortical regions instead of mice, with the left and right hemispheres counting as independent samples; again this is not justified. Is the activity of cortical regions within a mouse and across cortical hemispheres really statistically independent? The problem is apparent throughout the manuscript and for each data set collected.
An additional statistical issue is that it is unclear if the authors are correcting for the use of multiple statistical tests (as in for example Figure 1L and Figure 2B,D). In general, the use of statistics by the authors is not justified in the text.
Finally, it is important to note that whilst the study demonstrates that antipsychotics may selectively impact visuomotor integration in L5 neurons, it does not show that this effect is necessary or sufficient for the action of antipsychotics; though this is likely beyond the scope of the study it is something for readers to keep in mind.
-
