Large-scale neural dynamics in a shared low-dimensional state space reflect cognitive and attentional dynamics
Curation statements for this article:-
Curated by eLife

eLife assessment
This valuable study examines the distribution of four states of brain activity across a variety of cognitive conditions, linking systems neuroscience with cognition and behavior. The work is convincing, using null models and replication in independent datasets to support their findings.
This article has been Reviewed by the following groups
Discuss this preprint
Start a discussion What are Sciety discussions?Listed in
- Evaluated articles (eLife)
Abstract
Cognition and attention arise from the adaptive coordination of neural systems in response to external and internal demands. The low-dimensional latent subspace that underlies large-scale neural dynamics and the relationships of these dynamics to cognitive and attentional states, however, are unknown. We conducted functional magnetic resonance imaging as human participants performed attention tasks, watched comedy sitcom episodes and an educational documentary, and rested. Whole-brain dynamics traversed a common set of latent states that spanned canonical gradients of functional brain organization, with global desynchronization among functional networks modulating state transitions. Neural state dynamics were synchronized across people during engaging movie watching and aligned to narrative event structures. Neural state dynamics reflected attention fluctuations such that different states indicated engaged attention in task and naturalistic contexts, whereas a common state indicated attention lapses in both contexts. Together, these results demonstrate that traversals along large-scale gradients of human brain organization reflect cognitive and attentional dynamics.
Article activity feed
-

-

Author Response
Reviewer #1 (Public Review):
This manuscript will interest cognitive scientists, neuroimaging researchers, and neuroscientists interested in the systems-level organization of brain activity. The authors describe four brain states that are present across a wide range of cognitive tasks and determine that the relative distribution of the brain states shows both commonalities and differences across task conditions.
The authors characterized the low-dimensional latent space that has been shown to capture the major features of intrinsic brain activity using four states obtained with a Hidden Markov Model. They related the four states to previously-described functional gradients in the brain and examined the relative contribution of each state under different cognitive conditions. They showed that states related to the …
Author Response
Reviewer #1 (Public Review):
This manuscript will interest cognitive scientists, neuroimaging researchers, and neuroscientists interested in the systems-level organization of brain activity. The authors describe four brain states that are present across a wide range of cognitive tasks and determine that the relative distribution of the brain states shows both commonalities and differences across task conditions.
The authors characterized the low-dimensional latent space that has been shown to capture the major features of intrinsic brain activity using four states obtained with a Hidden Markov Model. They related the four states to previously-described functional gradients in the brain and examined the relative contribution of each state under different cognitive conditions. They showed that states related to the measured behavior for each condition differed, but that a common state appears to reflect disengagement across conditions. The authors bring together a state-of-the-art analysis of systemslevel brain dynamics and cognitive neuroscience, bridging a gap that has long needed to be bridged.
The strongest aspect of the study is its rigor. The authors use appropriate null models and examine multiple datasets (not used in the original analysis) to demonstrate that their findings replicate. Their thorough analysis convincingly supports their assertion that common states are present across a variety of conditions, but that different states may predict behavioural measures for different conditions. However, the authors could have better situated their work within the existing literature. It is not that a more exhaustive literature review is needed-it is that some of their results are unsurprising given the work reported in other manuscripts; some of their work reinforces or is reinforced by prior studies; and some of their work is not compared to similar findings obtained with other analysis approaches. While space is not unlimited, some of these gaps are important enough that they are worth addressing:
We appreciate the reviewer’s thorough read of our manuscript and positive comments on its rigor and implications. We agree that the original version of the manuscript insufficiently situated this work in the existing literature. We have made extensive revisions to better place our findings in the context of prior work. These changes are described in detail below.
- The authors' own prior work on functional connectivity signatures of attention is not discussed in comparison to the latest work. Neither is work from other groups showing signatures of arousal that change over time, particularly in resting state scans. Attention and arousal are not the same things, but they are intertwined, and both have been linked to large-scale changes in brain activity that should be captured in the HMM latent states. The authors should discuss how the current work fits with existing studies.
Thank you for raising this point. We agree that the relationship between low-dimensional latent states and predefined activity and functional connectivity signatures is an important and interesting question in both attention research and more general contexts. Here, we did not empirically relate the brain states examined in this study and functional connectivity signatures previously investigated in our lab (e.g., Rosenberg et al., 2016; Song et al., 2021a) because the research question and methodological complexities deserved separate attention that go beyond the scope of this paper. Therefore, we conceptually addressed the reviewer’s question on how functional connectivity signatures of attention are related to the brain states that were observed here. Next, we asked how arousal relates to the brain states by indirectly predicting arousal levels of each brain state based on its activity patterns’ spatial resemblance to the predefined arousal network template (Goodale et al., 2021).
Latent states and dynamic functional connectivity
Previous work suggested that, on medium time scales (~20-60 seconds), changes in functional connectivity signatures of sustained attention (Rosenberg et al., 2020) and narrative engagement (Song et al., 2021a) predicted changes in attentional states. How do these attention-related functional connectivity dynamics relate to latent state dynamics, measured on a shorter time scale (1 second)?
Theoretically, there are reasons to think that these measures are related but not redundant. Both HMM and dynamic functional connectivity provide summary measures of the whole-brain functional interactions that evolve over time. Whereas HMM identifies recurring low-dimensional brain states, dynamic functional connectivity used in our and others’ prior studies captures high-dimensional dynamical patterns. Furthermore, while the mixture Gaussian function utilized to infer emission probability in our HMM infers the states from both the BOLD activity patterns and their interactions, functional connectivity considers only pairwise interactions between regions of interests. Thus, with a theoretical ground that the brain states can be characterized at multiple scales and different methods (Greene et al., 2023), we can hypothesize that the both measures could (and perhaps, should be able to) capture brain-wide latent state changes. For example, if we were to apply kmeans clustering methods on the sliding window-based dynamic functional connectivity as in Allen et al. (2014), the resulting clusters could arguably be similar to the latent states derived from the HMM.
However, there are practical reasons why the correspondence between our prior dynamic functional connectivity models and current HMM states is difficult to test directly. A time point-bytime point matching of the HMM state sequence and dynamic functional connectivity is not feasible because, in our prior work, dynamic functional connectivity was measured in a sliding time window (~20-60 seconds), whereas the HMM state identification is conducted at every TR (1 second). An alternative would be to concatenate all time points that were categorized as each HMM state to compute representative functional connectivity of that state. This “splicing and concatenating” method, however, disrupts continuous BOLD-signal time series and has not previously been validated for use with our dynamic connectome-based predictive models. In addition, the difference in time series lengths across states would make comparisons of the four states’ functional connectomes unfair.
One main focus of our manuscript was to relate brain dynamics (HMM state dynamics) to static manifold (functional connectivity gradients). We agree that a direct link between two measures of brain dynamics, HMM and dynamic functional connectivity, is an important research question. However, due to some intricacies that needed to be addressed to answer this question, we felt that it was beyond the scope of our paper. We are eager, however, to explore these comparisons in future work which can more thoroughly address the caveats associated with comparing models of sustained attention, narrative engagement, and arousal defined using different input features and methods.
Arousal, attention, and latent neural state dynamics
Next, the reviewer posed an important question about the relationship between arousal, attention, and latent states. The current study was designed to assess the relationship between attention and latent state dynamics. However, previous neuroimaging work showed that low-dimensional brain dynamics reflect fluctuations in arousal (Raut et al., 2021; Shine et al., 2016; Zhang et al., 2023). Behavioral studies showed that attention and arousal hold a non-linear relationship, for example, mind-wandering states are associated with lower arousal and externally distracted states are associated with higher arousal, when both these states indicate low attention (Esterman and Rothlein, 2019; Unsworth and Robison, 2018, 2016).
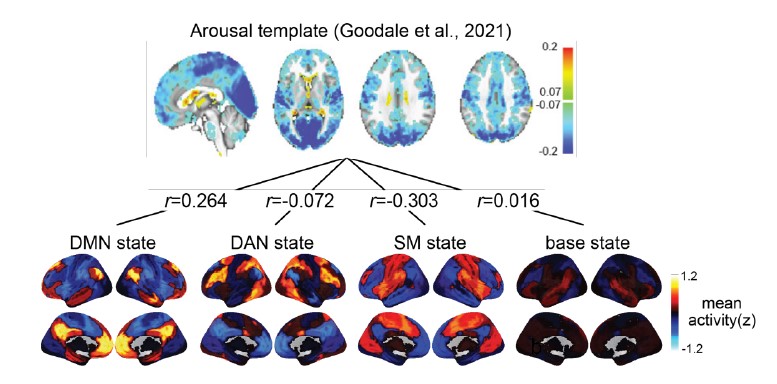
To address the reviewer’s suggestion, we wanted to test if our brain states reflected changes in arousal, but we did not collect relevant behavioral or physiological measures. Therefore, to indirectly test for relationships, we predicted levels of arousal in brain states by applying the “arousal network template” defined by Dr. Catie Chang’s group (Chang et al., 2016; Falahpour et al., 2018; Goodale et al., 2021). The arousal network template was created from resting-state fMRI data to predict arousal levels indicated by eye monitoring and electrophysiological signals. In the original study, the arousal level at each time point was predicted by the correlation between the BOLD activity patterns of each TR to the arousal template. The more similar the whole-brain activation pattern was to the arousal network template, the higher the participant was predicted to be aroused at that moment. This activity pattern-based model was generalized to fMRI data during tasks (Goodale et al., 2021).
We correlated the arousal template to the activity patterns of the four brain states that were inferred by the HMM. The DMN state was positively correlated with the arousal template (r=0.264) and the SM state was negatively correlated with the arousal template (r=-0.303) (Author response image 1). These values were not tested for significance because they were single observations. While speculative, this may suggest that participants are in a high arousal state during the DMN state and a low arousal state during the SM state. Together with our results relating brain states to attention, it is possible that the SM state is a common state indicating low arousal and low attention. On the other hand, the DMN state, a signature of a highly aroused state, may benefit gradCPT task performance but not necessarily in engaging with a sitcom episode. However, because this was a single observation and we did not collect a physiological measure of arousal to validate this indirect prediction result, we did not include the result in the manuscript. We hope to more directly test this question in future work with behavioral and physiological measures of arousal.
Author response image 1.
Changes made to the manuscript
Importantly, we agree with the reviewer that a theoretical discussion about the relationships between functional connectivity, latent states, gradients, as well as attention and arousal was a critical omission from the original Discussion. We edited the Discussion to highlight past literature on these topics and encourage future work to investigate these relationships.
[Manuscript, page 11] “Previous studies showed that large-scale neural dynamics that evolve over tens of seconds capture meaningful variance in arousal (Raut et al., 2021; Zhang et al., 2023) and attentional states (Rosenberg et al., 2020; Yamashita et al., 2021). We asked whether latent neural state dynamics reflect ongoing changes in attention in both task and naturalistic contexts.”
[Manuscript, page 17] “Previous work showed that time-resolved whole-brain functional connectivity (i.e., paired interactions of more than a hundred parcels) predicts changes in attention during task performance (Rosenberg et al., 2020) as well as movie-watching and story-listening (Song et al., 2021a). Future work could investigate whether functional connectivity and the HMM capture the same underlying “brain states” to bridge the results from the two literatures. Furthermore, though the current study provided evidence of neural state dynamics reflecting attention, the same neural states may, in part, reflect fluctuations in arousal (Chang et al., 2016; Zhang et al., 2023). Complementing behavioral studies that demonstrated a nonlinear relationship between attention and arousal (Esterman and Rothlein, 2019; Unsworth and Robison, 2018, 2016), future studies collecting behavioral and physiological measures of arousal can assess the extent to which attention explains neural state dynamics beyond what can be explained by arousal fluctuations.”
- The 'base state' has been described in a number of prior papers (for one early example, see https://pubmed.ncbi.nlm.nih.gov/27008543). The idea that it might serve as a hub or intermediary for other states has been raised in other studies, and discussion of the similarity or differences between those studies and this one would provide better context for the interpretation of the current work. One of the intriguing findings of the current study is that the incidence of this base state increases during sitcom watching, the strongest evidence to date is that it has a cognitive role and is not merely a configuration of activity that the brain must pass through when making a transition.
We greatly appreciate the reviewer’s suggestion of prior papers. We were not aware of previous findings of the base state at the time of writing the manuscript, so it was reassuring to see consistent findings. In the Discussion, we highlighted the findings of Chen et al. (2016) and Saggar et al. (2022). Both studies highlighted the role of the base state as a “hub”-like transition state. However, as the reviewer noted, these studies did not address the functional relevance of this state to cognitive states because both were based on resting-state fMRI.
In our revised Discussion, we write that our work replicates previous findings of the base state that consistently acted as a transitional hub state in macroscopic brain dynamics. We also note that our study expands this line of work by characterizing what functional roles the base state plays in multiple contexts: The base state indicated high attentional engagement and exhibited the highest occurrence proportion as well as longest dwell times during naturalistic movie watching. The base state’s functional involvement was comparatively minor during controlled tasks.
[Manuscript, page 17-18] “Past resting-state fMRI studies have reported the existence of the base state. Chen et al. (2016) used the HMM to detect a state that had “less apparent activation or deactivation patterns in known networks compared with other states”. This state had the highest occurrence probability among the inferred latent states, was consistently detected by the model, and was most likely to transition to and from other states, all of which mirror our findings here. The authors interpret this state as an “intermediate transient state that appears when the brain is switching between other more reproducible brain states”. The observation of the base state was not confined to studies using HMMs. Saggar et al. (2022) used topological data analysis to represent a low-dimensional manifold of resting-state whole-brain dynamics as a graph, where each node corresponds to brain activity patterns of a cluster of time points. Topologically focal “hub” nodes were represented uniformly by all functional networks, meaning that no characteristic activation above or below the mean was detected, similar to what we observe with the base state. The transition probability from other states to the hub state was the highest, demonstrating its role as a putative transition state.
However, the functional relevance of the base state to human cognition had not been explored previously. We propose that the base state, a transitional hub (Figure 2B) positioned at the center of the gradient subspace (Figure 1D), functions as a state of natural equilibrium. Transitioning to the DMN, DAN, or SM states reflects incursion away from natural equilibrium (Deco et al., 2017; Gu et al., 2015), as the brain enters a functionally modular state. Notably, the base state indicated high attentional engagement (Figure 5E and F) and exhibited the highest occurrence proportion (Figure 3B) as well as the longest dwell times (Figure 3—figure supplement 1) during naturalistic movie watching, whereas its functional involvement was comparatively minor during controlled tasks. This significant relevance to behavior verifies that the base state cannot simply be a byproduct of the model. We speculate that susceptibility to both external and internal information is maximized in the base state—allowing for roughly equal weighting of both sides so that they can be integrated to form a coherent representation of the world—at the expense of the stability of a certain functional network (Cocchi et al., 2017; Fagerholm et al., 2015). When processing rich narratives, particularly when a person is fully immersed without having to exert cognitive effort, a less modular state with high degrees of freedom to reach other states may be more likely to be involved. The role of the base state should be further investigated in future studies.”
- The link between latent states and functional connectivity gradients should be considered in the context of prior work showing that the spatiotemporal patterns of intrinsic activity that account for most of the structure in resting state fMRI also sweep across functional connectivity gradients (https://pubmed.ncbi.nlm.nih.gov/33549755/). In fact, the spatiotemporal dynamics may give rise to the functional connectivity gradients (https://pubmed.ncbi.nlm.nih.gov/35902649/). HMM states bear a marked resemblance to the high-activity phases of these patterns and are likely to be closely linked to them. The spatiotemporal patterns are typically obtained during rest, but they have been reported during task performance (https://pubmed.ncbi.nlm.nih.gov/30753928/) which further suggests a link to the current work. Similar patterns have been observed in anesthetized animals, which also reinforces the conclusion of the current work that the states are fundamental aspects of the brain's functional organization.
We appreciate the comments that relate spatiotemporal patterns, functional connectivity gradients, and the latent states derived from the HMM. Our work was also inspired by the papers that the reviewer suggested, especially Bolt et al.’s (2022), which compared the results of numerous dimensionality and clustering algorithms and suggested three spatiotemporal patterns that seemed to be commonly supported across algorithms. We originally cited these studies throughout the manuscript, but did not discuss them comprehensively. We have revised the Discussion to situate our findings on past work that used resting-state fMRI to study low-dimensional latent brain states.
[Manuscript, page 15-16] “This perspective is supported by previous work that has used different methods to capture recurring low-dimensional states from spontaneous fMRI activity during rest. For example, to extract time-averaged latent states, early resting-state analyses identified task-positive and tasknegative networks using seed-based correlation (Fox et al., 2005). Dimensionality reduction algorithms such as independent component analysis (Smith et al., 2009) extracted latent components that explain the largest variance in fMRI time series. Other lines of work used timeresolved analyses to capture latent state dynamics. For example, variants of clustering algorithms, such as co-activation patterns (Liu et al., 2018; Liu and Duyn, 2013), k-means clustering (Allen et al., 2014), and HMM (Baker et al., 2014; Chen et al., 2016; Vidaurre et al., 2018, 2017), characterized fMRI time series as recurrences of and transitions between a small number of states. Time-lag analysis was used to identify quasiperiodic spatiotemporal patterns of propagating brain activity (Abbas et al., 2019; Yousefi and Keilholz, 2021). A recent study extensively compared these different algorithms and showed that they all report qualitatively similar latent states or components when applied to fMRI data (Bolt et al., 2022). While these studies used different algorithms to probe data-specific brain states, this work and ours report common latent axes that follow a long-standing theory of large-scale human functional systems (Mesulam, 1998). Neural dynamics span principal axes that dissociate unimodal to transmodal and sensory to motor information processing systems.”
Reviewer #2 (Public Review):
In this study, Song and colleagues applied a Hidden Markov Model to whole-brain fMRI data from the unique SONG dataset and a grad-CPT task, and in doing so observed robust transitions between lowdimensional states that they then attributed to specific psychological features extracted from the different tasks.
The methods used appeared to be sound and robust to parameter choices. Whenever choices were made regarding specific parameters, the authors demonstrated that their approach was robust to different values, and also replicated their main findings on a separate dataset.
I was mildly concerned that similarities in some of the algorithms used may have rendered some of the inter-measure results as somewhat inevitable (a hypothesis that could be tested using appropriate null models).
This work is quite integrative, linking together a number of previous studies into a framework that allows for interesting follow-up questions.
Overall, I found the work to be robust, interesting, and integrative, with a wide-ranging citation list and exciting implications for future work.
We appreciate the reviewer’s comments on the study’s robustness and future implications. Our work was highly motivated by the reviewer’s prior work.
Reviewer #3 (Public Review):
My general assessment of the paper is that the analyses done after they find the model are exemplary and show some interesting results. However, the method they use to find the number of states (Calinski-Harabasz score instead of log-likelihood), the model they use generally (HMM), and the fact that they don't show how they find the number of states on HCP, with the Schaeffer atlas, and do not report their R^2 on a test set is a little concerning. I don't think this perse impedes their results, but it is something that they can improve. They argue that the states they find align with long-standing ideas about the functional organization of the brain and align with other research, but they can improve their selection for their model.
We appreciate the reviewer’s thorough read of the paper, evaluation of our analyses linking brain states to behavior as “exemplary”, and important questions about the modeling approach. We have included detailed responses below and updated the manuscript accordingly.
Strengths:
- Use multiple datasets, multiple ROIs, and multiple analyses to validate their results
- Figures are convincing in the sense that patterns clearly synchronize between participants
- Authors select the number of states using the optimal model fit (although this turns out to be a little more questionable due to what they quantify as 'optimal model fit')
We address this concern on page 30-31 of this response letter.
- Replication with Schaeffer atlas makes results more convincing
- The analyses around the fact that the base state acts as a flexible hub are well done and well explained
- Their comparison of synchrony is well-done and comparing it to resting-state, which does not have any significant synchrony among participants is obvious, but still good to compare against.
- Their results with respect to similar narrative engagement being correlated with similar neural state dynamics are well done and interesting.
- Their results on event boundaries are compelling and well done. However, I do not find their Chang et al. results convincing (Figure 4B), it could just be because it is a different medium that explains differences in DMN response, but to me, it seems like these are just altogether different patterns that can not 100% be explained by their method/results.
We entirely agree with the reviewer that the Chang et al. (2021) data are different in many ways from our own SONG dataset. Whereas data from Chang et al. (2021) were collected while participants listened to an audio-only narrative, participants in the SONG sample watched and listened to audiovisual stimuli. They were scanned at different universities in different countries with different protocols by different research groups for different purposes. That is, there are numerous reasons why we would expect the model should not generalize. Thus, we found it compelling and surprising that, despite all of these differences between the datasets, the model trained on the SONG dataset generalized to the data from Chang et al. (2021). The results highlighted a robust increase in the DMN state occurrence and a decrease in the base state occurrence after the narrative event boundaries, irrespective of whether the stimulus was an audiovisual sitcom episode or a narrated story. This external model validation was a way that we tested the robustness of our own model and the relationship between neural state dynamics and cognitive dynamics.
- Their results that when there is no event, transition into the DMN state comes from the base state is 50% is interesting and a strong result. However, it is unclear if this is just for the sitcom or also for Chang et al.'s data.
We apologize for the lack of clarity. We show the statistical results of the two sitcom episodes as well as Chang et al.’s (2021) data in Figure 4—figure supplement 2 in our original manuscript. Here, we provide the exact values of the base-to-DMN state transition probability, and how they differ across moments after event boundaries compared to non-event boundaries.
For sitcom episode 1, the probability of base-to-DMN state transition was 44.6 ± 18.8 % at event boundaries whereas 62.0 ± 10.4 % at non-event boundaries (FDR-p = 0.0013). For sitcom episode 2, the probability of base-to-DMN state transition was 44.1 ± 18.0 % at event boundaries whereas 62.2 ± 7.6 % at non-event boundaries (FDR-p = 0.0006). For the Chang et al. (2021) dataset, the probability of base-to-DMN state transition was 33.3 ± 15.9 % at event boundaries whereas 58.1 ± 6.4 % at non-event boundaries (FDR-p < 0.0001). Thus, our result, “At non-event boundaries, the DMN state was most likely to transition from the base state, accounting for more than 50% of the transitions to the DMN state” (pg 11, line 24-25), holds true for both the internal and external datasets.
- The involvement of the base state as being highly engaged during the comedy sitcom and the movie are interesting results that warrant further study into the base state theory they pose in this work.
- It is good that they make sure SM states are not just because of head motion (P 12).
- Their comparison between functional gradient and neural states is good, and their results are generally well-supported, intuitive, and interesting enough to warrant further research into them. Their findings on the context-specificity of their DMN and DAN state are interesting and relate well to the antagonistic relationship in resting-state data.
Weaknesses:
- Authors should train the model on part of the data and validate on another
Thank you for raising this issue. To the best of our knowledge, past work that applied the HMM to the fMRI data has conducted training and inference on the same data, including initial work that implemented HMM on the resting-state fMRI (Baker et al., 2014; Chen et al., 2016; Vidaurre et al., 2018, 2017) as well as more recent work that applied HMMs to the task or movie-watching fMRI (Cornblath et al., 2020; Taghia et al., 2018; van der Meer et al., 2020; Yamashita et al., 2021). That is, the parameters—emission probability, transition probability, and initial probability—were estimated from the entire dataset and the latent state sequence was inferred using the Viterbi algorithm on the same dataset.
However, we were also aware of the potential problem this may have. Therefore, in our recent work asking a different research question in another fMRI dataset (Song et al., 2021b), we trained an HMM on a subset of the dataset (moments when participants were watching movie clips in the original temporal order) and inferred latent state sequence of the fMRI time series in another subset of the dataset (moments when participants were watching movie clips in a scrambled temporal order). To the best of our knowledge, this was the first paper that used different segments of the data to fit and infer states from the HMM.
In the current study, we wanted to capture brain states that underlie brain activity across contexts. Thus, we presented the same-dataset training and inference procedure as our primary result. However, for every main result, we also showed results where we separated the data used for model fitting and state inference. That is, we fit the HMM on the SONG dataset, primarily report the inference results on the SONG dataset, but also report inference on the external datasets that were not included in model fitting. The datasets used were the Human Connectome Project dataset (Van Essen et al., 2013), Chang et al. (2021) audio-listening dataset, Rosenberg et al. (2016) gradCPT dataset, and Chen et al. (2017) Sherlock dataset.
However, to further address the concern of the reviewer whether the HMM fit is reliable when applied to held-out data, we computed the reliability of the HMM inference by conducting crossvalidations and split-half reliability analysis.
(1) Cross-validation
To separate the dataset used for HMM training and inference, we conducted cross-validation on the SONG dataset (N=27) by training the model with the data from 26 participants and inferring the latent state sequence of the held-out participant.
First, we compared the robustness of the model training by comparing the mean activity patterns of the four latent states fitted at the group level (N=27) with the mean activity patterns of the four states fitted across cross-validation folds. Pearson’s correlations between the group-level vs. cross-validated latent states’ mean activity patterns were r = 0.991 ± 0.010, with a range from 0.963 to 0.999.
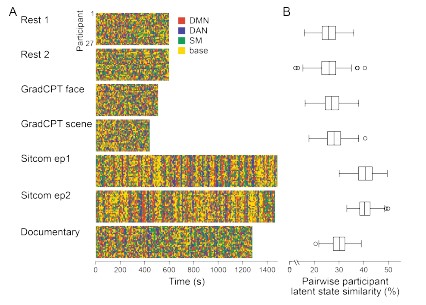
Second, we compared the robustness of model inference by comparing the latent state sequences that were inferred at the group level vs. from held-out participants in a cross-validation scheme. All fMRI conditions had mean similarity higher than 90%; Rest 1: 92.74 ± 5.02 %, Rest2: 92.74 ± 4.83 %, GradCPT face: 92.97 ± 6.41 %, GradCPT scene: 93.27 ± 5.76 %, Sitcom ep1: 93.31 ± 3.92 %, Sitcom ep2: 93.13 ± 4.36 %, Documentary: 92.42 ± 4.72 %.
Third, with the latent state sequences inferred from cross-validation, we replicated the analysis of Figure 3 to test for synchrony of the latent state sequences across participants. The crossvalidated results were highly similar to manuscript Figure 3, which was generated from the grouplevel analysis. Mean synchrony of latent state sequences are as follows: Rest 1: 25.90 ± 3.81%, Rest 2: 25.75 ± 4.19 %, GradCPT face: 27.17 ± 3.86 %, GradCPT scene: 28.11 ± 3.89 %, Sitcom ep1: 40.69 ± 3.86%, Sitcom ep2: 40.53 ± 3.13%, Documentary: 30.13 ± 3.41%.
Author response image 2.
(2) Split-half reliability
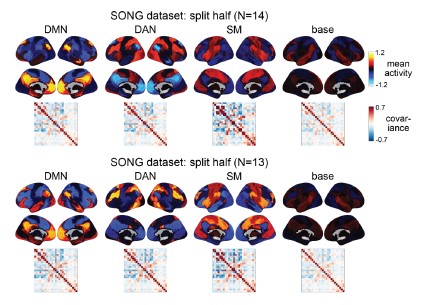
To test for the internal robustness of the model, we randomly assigned SONG dataset participants into two groups and conducted HMM separately in each. Similarity (Pearson’s correlation) between the two groups’ activation patterns were DMN: 0.791, DAN: 0.838, SM: 0.944, base: 0.837. The similarity of the covariance patterns were DMN: 0.995, DAN: 0.996, SM: 0.994, base: 0.996.
Author response image 3.
We further validated the split-half reliability of the model using the HCP dataset, which contains data of a larger sample (N=119). Similarity (Pearson’s correlation) between the two groups’ activation patterns were DMN: 0.998, DAN: 0.997, SM: 0.993, base: 0.923. The similarity of the covariance patterns were DMN: 0.995, DAN: 0.996, SM: 0.994, base: 0.996.
Together the cross-validation and split-half reliability results demonstrate that the HMM results reported in the manuscript are reliable and robust to the way we conducted the analysis. The result of the split-half reliability analysis is added in the Results.
[Manuscript, page 3-4] “Neural state inference was robust to the choice of 𝐾 (Figure 1—figure supplement 1) and the fMRI preprocessing pipeline (Figure 1—figure supplement 5) and consistent when conducted on two groups of randomly split-half participants (Pearson’s correlations between the two groups’ latent state activation patterns: DMN: 0.791, DAN: 0.838, SM: 0.944, base: 0.837).”
- Comparison with just PCA/functional gradients is weak in establishing whether HMMs are good models of the timeseries. Especially given that the HMM does not explain a lot of variance in the signal (~0.5 R^2 for only 27 brain regions) for PCA. I think they don't report their own R^2 of the timeseries
We agree with the reviewer that the PCA that we conducted to compare with the explained variance of the functional gradients was not directly comparable because PCA and gradients utilize different algorithms to reduce dimensionality. To make more meaningful comparisons, we removed the data-specific PCA results and replaced them with data-specific functional gradients (derived from the SONG dataset). This allows us to directly compare SONG-specific functional gradients with predefined gradients (derived from the resting-state HCP dataset from Margulies et al. [2016]). We found that the degrees to which the first two predefined gradients explained whole-brain fMRI time series (SONG: 𝑟! = 0.097, HCP: 0.084) were comparable to the amount of variance explained by the first two data-specific gradients (SONG: 𝑟! = 0.100, HCP: 0.086). Thus, the predefined gradients explain as much variance in the SONG data time series as SONG-specific gradients do. This supports our argument that the low-dimensional manifold is largely shared across contexts, and that the common HMM latent states may tile the predefined gradients.
These analyses and results were added to the Results, Methods, and Figure 1—figure supplement 8. Here, we only attach changes to the Results section for simplicity, but please see the revised manuscript for further changes.
[Manuscript, page 5-6] “We hypothesized that the spatial gradients reported by Margulies et al. (2016) act as a lowdimensional manifold over which large-scale dynamics operate (Bolt et al., 2022; Brown et al., 2021; Karapanagiotidis et al., 2020; Turnbull et al., 2020), such that traversals within this manifold explain large variance in neural dynamics and, consequently, cognition and behavior (Figure 1C). To test this idea, we situated the mean activity values of the four latent states along the gradients defined by Margulies et al. (2016) (see Methods). The brain states tiled the two-dimensional gradient space with the base state at the center (Figure 1D; Figure1—figure supplement 7). The Euclidean distances between these four states were maximized in the two-dimensional gradient space, compared to a chance where the four states were inferred from circular-shifted time series (p < 0.001). For the SONG dataset, the DMN and SM states fell at more extreme positions of the primary gradient than expected by chance (both FDR-p values = 0.004; DAN and SM states, FDRp values = 0.171). For the HCP dataset, the DMN and DAN states fell at more extreme positions on the primary gradient (both FDR-p values = 0.004; SM and base states, FDR-p values = 0.076). No state was consistently found at the extremes of the secondary gradient (all FDR-p values > 0.021).
We asked whether the predefined gradients explain as much variance in neural dynamics as latent subspace optimized for the SONG dataset. To do so, we applied the same nonlinear dimensionality reduction algorithm to the SONG dataset’s ROI time series. Of note, the SONG dataset includes 18.95% rest, 15.07% task, and 65.98% movie-watching data whereas the data used by Margulies et al. (2016) was 100% rest. Despite these differences, the SONG-specific gradients closely resembled the predefined gradients, with significant Pearson’s correlations observed for the first (r = 0.876) and second (r = 0.877) gradient embeddings (Figure 1—figure supplement 8). Gradients identified with the HCP data also recapitulated Margulies et al.’s (2016) first (r = 0.880) and second (r = 0.871) gradients. We restricted our analysis to the first two gradients because the two gradients together explained roughly 50% of the entire variance of functional brain connectome (SONG: 46.94%, HCP: 52.08%), and the explained variance dropped drastically from the third gradients (more than 1/3 drop compared to second gradients). The degrees to which the first two predefined gradients explained whole-brain fMRI time series (SONG: 𝑟! = 0.097, HCP: 0.084) were comparable to the amount of variance explained by the first two data-specific gradients (SONG: 𝑟! = 0.100, HCP: 0.086; Figure 1—figure supplement 8). Thus, the low-dimensional manifold captured by Margulies et al. (2016) gradients is highly replicable, explaining brain activity dynamics as well as data-specific gradients, and is largely shared across contexts and datasets. This suggests that the state space of whole-brain dynamics closely recapitulates low-dimensional gradients of the static functional brain connectome.”
The reviewer also pointed out that the PCA-gradient comparison was weak in establishing whether HMMs are good models of the time series. However, we would like to point out that the purpose of the comparison was not to validate the performance of the HMM. Instead, we wanted to test whether the gradients introduced by Margulies et al. (2016) could act as a generalizable lowdimensional manifold of brain state dynamics. To argue that the predefined gradients are a shared manifold, these gradients should explain SONG data fMRI time series as much as the principal components derived directly from the SONG data. Our results showed comparable 𝑟!, both in predefined gradient vs. data-specific PC comparisons and predefined gradient vs. data-specific gradient comparisons, which supported our argument that the predefined gradients could be the shared embedding space across contexts and datasets.
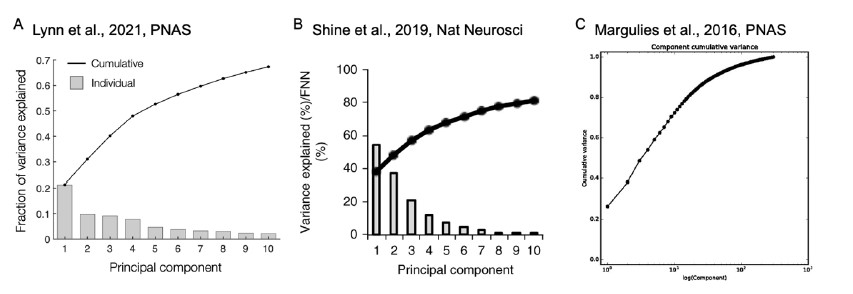
The reviewer pointed out that the 𝑟2 of ~0.5 is not explaining enough variance in the fMRI signal. However, we respectfully disagree with this point because there is no established criterion for what constitutes a high or low 𝑟2 for this type of analysis. Of note, previous literature that also applied PCA to fMRI time series (Author response image 4A and 4B) (Lynn et al., 2021; Shine et al.,
- also found that the cumulative explained variance of top 5 principal components is around 50%. Author response image 4C shows cumulative variances to which gradients explain the functional connectome of the resting-state fMRI data (Margulies et al., 2016).
Author response image 4.
Finally, the reviewer pointed out that the 𝑟! of the HMM-derived latent sequence to the fMRI time series should be reported. However, there is no standardized way of measuring the explained variance of the HMM inference. There is no report of explained variance in the traditional HMMfMRI papers (Baker et al., 2014; Chen et al., 2016; Vidaurre et al., 2018, 2017). Rather than 𝑟!, the HMM computes the log likelihood of the model fit. However, because log likelihood values are dependent on the number of data points, studies do not report log likelihood values nor do they use these metrics to interpret the goodness of model fit.
To ask whether the goodness of the HMM fit was significant above chance, we compared the log likelihood of the HMM to the log likelihood distribution of the null HMM fits. First, we extracted the log likelihood of the HMM fit with the real fMRI time series. We iterated this 1,000 times when calculating null HMMs using the circular-shifted fMRI time series. The log likelihood of the real model was significantly higher than the chance distribution, with a z-value of 2182.5 (p < 0.001). This indicates that the HMM explained a large variance in our fMRI time series data, significantly above chance.
- Authors do not specify whether they also did cross-validation for the HCP dataset to find 4 clusters
We apologize for the lack of clarity. When we computed the Calinski-Harabasz score with the HCP dataset, three was chosen as the most optimal number of states (Author response image 5A). When we set K as 3, the HMM inferred the DMN, DAN, and SM states (Author response image 5C). The base state was included when K was set to 4 (Author response image 5B). The activation pattern similarities of the DMN, DAN, and SM states were r = 0.981, 0.984, 0.911 respectively.
Author response image 5.
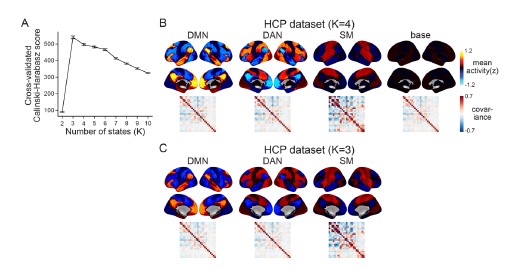
We did not use K = 3 for the HCP data replication because we were not trying to test whether these four states would be the optimal set of states in every dataset. Although the CalinskiHarabasz score chose K = 3 because it showed the best clustering performance, this does not mean that the base state is not meaningful to this dataset. Likewise, the latent states that are inferred when we increase/decrease the number of states are also meaningful states. For example, in Figure 1—figure supplement 1, we show an example of the SONG dataset’s latent states when we set K to 7. The seven latent states included the DAN, SM, and base states, the DMN state was subdivided into DMN-A and DMN-B states, and the FPN state and DMN+VIS state were included. Setting a higher number of states like K = 7 would mean that we are capturing brain state dynamics in a higher dimension than when using K = 4. Because we are utilizing a higher number of states, a model set to K = 7 would inevitably capture a larger variance of fMRI time series than a model set to K = 4.
The purpose of latent state replication with the HCP dataset was to validate the generalizability of the DMN, DAN, SM, and base states. Before characterizing these latent states’ relevance to cognition, we needed to verify that these latent states were not simply overfit to the SONG dataset. The fact that the HMM revealed a similar set of latent states when applied to the HCP dataset suggested that the states were not merely specific to SONG data.
To make our points clearer in the manuscript, we emphasized that we are not arguing for the four states to be the exclusive states. We made edits to Discussion as follows.
[Manuscript, page 16] “Our study adopted the assumption of low dimensionality of large-scale neural systems, which led us to intentionally identify only a small number of states underlying whole-brain dynamics. Importantly, however, we do not claim that the four states will be the optimal set of states in every dataset and participant population. Instead, latent states and patterns of state occurrence may vary as a function of individuals and tasks (Figure 1—figure supplement 2). Likewise, while the lowest dimensions of the manifold (i.e., the first two gradients) were largely shared across datasets tested here, we do not argue that it will always be identical. If individuals and tasks deviate significantly from what was tested here, the manifold may also differ along with changes in latent states (Samara et al., 2023). Brain systems operate at different dimensionalities and spatiotemporal scales (Greene et al., 2023), which may have different consequences for cognition. Asking how brain states and manifolds—probed at different dimensionalities and scales—flexibly reconfigure (or not) with changes in contexts and mental states is an important research question for understanding complex human cognition.”
- One of their main contributions is the base state but the correlation between the base state in their Song dataset and the HCP dataset is only 0.399
This is a good point. However, there is precedent for lower spatial pattern correlation of the base state compared to other states in the literature.
Compared to the DMN, DAN, and SM states, the base state did not show characteristic activation or deactivation of functional networks. Most of the functional networks showed activity levels close to the mean (z = 0). With this flattened activation pattern, relatively low activation pattern similarity was observed between the SONG base state and the HCP base state.
In Figure 1—figure supplement 6, we write, “The DMN, DAN, and SM states showed similar mean activity patterns. We refrained from making interpretations about the base state’s activity patterns because the mean activity of most of the parcels was close to z = 0”.
A similar finding has been reported in a previous work by Chen et al. (2016) that discovered the base state with HMM. State 9 (S9) of their results is comparable to our base state. They report that even though the spatial correlation coefficient of the brain state from the split-half reliability analysis was the lowest for S9 due to its low degrees of activation or deactivation, S9 was stably inferred by the HMM. The following is a direct quote from their paper:
“To the best of our knowledge, a state similar to S9 has not been presented in previous literature. We hypothesize that S9 is the “ground” state of the brain, in which brain activity (or deactivity) is similar for the entire cortex (no apparent activation or deactivation as shown in Fig. 4). Note that different groups of subjects have different spatial patterns for state S9 (Fig. 3A). Therefore, S9 has the lowest reproducible spatial pattern (Fig. 3B). However, its temporal characteristics allowed us to distinguish it consistently from other states.” (Chen et al., 2016)
Thus, we believe our data and prior results support the existence of the “base state”.
- Figure 1B: Parcellation is quite big but there seems to be a gradient within regions
This is a function of the visualization software. Mean activity (z) is the same for all voxels within a parcel. To visualize the 3D contours of the brain, we chose an option in the nilearn python function that smooths the mean activity values based on the surface reconstructed anatomy.
In the original manuscript, our Methods write, “The brain surfaces were visualized with nilearn.plotting.plot_surf_stat_map. The parcel boundaries in Figure 1B are smoothed from the volume-to-surface reconstruction.”
- Figure 1D: Why are the DMNs further apart between SONG and HCP than the other states
To address this question, we first tested whether the position of the DMN states in the gradient space is significantly different for the SONG and HCP datasets. We generated surrogate HMM states from the circular-shifted fMRI time series and positioned the four latent states and the null DMN states in the 2-dimensional gradient space (Author response image 6).
Author response image 6.
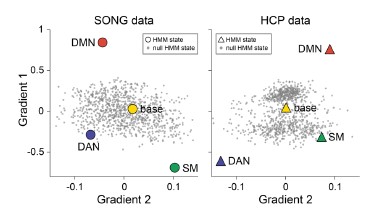
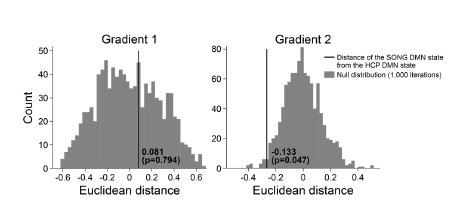
We next tested whether the Euclidean distance between the SONG dataset’s DMN state and the HCP dataset’s DMN state is larger than would be expected by chance (Author response image 7). To do so, we took the difference between the DMN state positions and compared it to the 1,000 differences generated from the surrogate latent states. The DMN states of the SONG and HCP datasets did not significantly differ in the Gradient 1 dimension (two-tailed test, p = 0.794). However, as the reviewer noted, the positions differed significantly in the Gradient 2 dimension (p = 0.047). The DMN state leaned more towards the Visual gradient in the SONG dataset, whereas it leaned more towards the Somatosensory-Motor gradient in the HCP dataset.
Author response image 7.
Though we cannot claim an exact reason for this across-dataset difference, we note a distinctive difference between the SONG and HCP datasets. Both datasets largely included resting-state, controlled tasks, and movie watching. The SONG dataset included 18.95% of rest, 15.07% of task, and 65.98% of movie watching. The task only contained the gradCPT, i.e., sustained attention task. On the other hand, the HCP dataset included 52.71% of rest, 24.35% of task, and 22.94% of movie watching. There were 7 different tasks included in the HCP dataset. It is possible that different proportions of rest, task, and movie watching, and different cognitive demands involved with each dataset may have created data-specific latent states.
- Page 5 paragraph starting at L25: Their hypothesis that functional gradients explain large variance in neural dynamics needs to be explained more, is non-trivial especially because their R^2 scores are so low (Fig 1. Supplement 8) for PCA
We address this concern on page 21-23 of this response letter.
- Generally, I do not find the PCA analysis convincing and believe they should also compare to something like ICA or a different model of dynamics. They do not explain their reasoning behind assuming an HMM, which is an extremely simplified idea of brain dynamics meaning they only change based on the previous state.
We appreciate this perspective. We replaced the Margulies et al.’s (2016) gradient vs. SONGspecific PCA comparison with a more direct Margulies et al.’s (2016) gradient vs. SONG-specific gradient comparison as described on page 21-23 of this response letter.
More broadly, we elected to use HMM because of recent work showing correspondence between low-dimensional HMM states and behavior (Cornblath et al., 2020; Taghia et al., 2018; van der Meer et al., 2020; Yamashita et al., 2021). We also found the model’s assumption—a mixture Gaussian emission probability and first-order Markovian transition probability—to be the most suited to analyzing the fMRI time series data. We do not intend to claim that other data-reduction techniques would not also capture low-dimensional, behaviorally relevant changes in brain activity. Instead, our primary focus was identifying a set of latent states that generalize (i.e., recur) across multiple contexts and understanding how those states reflect cognitive and attentional states.
Although a comparison of possible data-reduction algorithms is out of the scope of the current work, an exhaustive comparison of different models can be found in Bolt et al. (2022). The authors compared dozens of latent brain state algorithms spanning zero-lag analysis (e.g., principal component analysis, principal component analysis with Varimax rotation, Laplacian eigenmaps, spatial independent component analysis, temporal independent component analysis, hidden Markov model, seed-based correlation analysis, and co-activation patterns) to time-lag analysis (e.g., quasi-periodic pattern and lag projections). Bolt et al. (2022) writes “a range of empirical phenomena, including functional connectivity gradients, the task-positive/task-negative anticorrelation pattern, the global signal, time-lag propagation patterns, the quasiperiodic pattern and the functional connectome network structure, are manifestations of the three spatiotemporal patterns.” That is, many previous findings that used different methods essentially describe the same recurring latent states. A similar argument was made in previous papers (Brown et al., 2021; Karapanagiotidis et al., 2020; Turnbull et al., 2020).
We agree that the HMM is a simplified idea of brain dynamics. We do not argue that the four number of states can fully explain the complexity and flexibility of cognition. Instead, we hoped to show that there are different dimensionalities to which the brain systems can operate, and they may have different consequences to cognition. We “simplified” neural dynamics to a discrete sequence of a small number of states. However, what is fascinating is that these overly “simplified” brain state dynamics can explain certain cognitive and attentional dynamics, such as event segmentation and sustained attention fluctuations. We highlight this point in the Discussion.
[Manuscript, page 16] “Our study adopted the assumption of low dimensionality of large-scale neural systems, which led us to intentionally identify only a small number of states underlying whole-brain dynamics. Importantly, however, we do not claim that the four states will be the optimal set of states in every dataset and participant population. Instead, latent states and patterns of state occurrence may vary as a function of individuals and tasks (Figure 1—figure supplement 2). Likewise, while the lowest dimensions of the manifold (i.e., the first two gradients) were largely shared across datasets tested here, we do not argue that it will always be identical. If individuals and tasks deviate significantly from what was tested here, the manifold may also differ along with changes in latent states (Samara et al., 2023). Brain systems operate at different dimensionalities and spatiotemporal scales (Greene et al., 2023), which may have different consequences for cognition. Asking how brain states and manifolds—probed at different dimensionalities and scales—flexibly reconfigure (or not) with changes in contexts and mental states is an important research question for understanding complex human cognition.”
- For the 25- ROI replication it seems like they again do not try multiple K values for the number of states to validate that 4 states are in fact the correct number.
In the manuscript, we do not argue that the four will be the optimal number of states in any dataset. (We actually predict that this may differ depending on the amount of data, participant population, tasks, etc.) Instead, we claim that the four identified in the SONG dataset are not specific (i.e., overfit) to that sample, but rather recur in independent datasets as well. More broadly we argue that the complexity and flexibility of human cognition stem from the fact that computation occurs at multiple dimensions and that the low-dimensional states observed here are robustly related to cognitive and attentional states. To prevent misunderstanding of our results, we emphasized in the Discussion that we are not arguing for a fixed number of states. A paragraph included in our response to the previous comment (page 16 in the manuscript) illustrates this point.
- Fig 2B: Colorbar goes from -0.05 to 0.05 but values are up to 0.87
We apologize for the confusion. The current version of the figure is correct. The figure legend states, “The values indicate transition probabilities, such that values in each row sums to 1. The colors indicate differences from the mean of the null distribution where the HMMs were conducted on the circular-shifted time series.”
We recognize that this complicates the interpretation of the figure. However, after much consideration, we decided that it was valuable to show both the actual transition probabilities (values) and their difference from the mean of null HMMs (colors). The values demonstrate the Markovian property of latent state dynamics, with a high probability of remaining in the same state at consecutive moments and a low probability of transitioning to a different state. The colors indicate that the base state is a transitional hub state by illustrating that the DMN, DAN, and SM states are more likely to transition to the base state than would be expected by chance.
- P 16 L4 near-critical, authors need to be more specific in their terminology here especially since they talk about dynamic systems, where near-criticality has a specific definition. It is unclear which definition they are looking for here.
We agree that our explanation was vague. Because we do not have evidence for this speculative proposal, we removed the mention of near-criticality. Instead, we focus on our observation as the base state being the transitional hub state within a metastable system.
[Manuscript, page 17-18] “However, the functional relevance of the base state to human cognition had not been explored previously. We propose that the base state, a transitional hub (Figure 2B) positioned at the center of the gradient subspace (Figure 1D), functions as a state of natural equilibrium. Transitioning to the DMN, DAN, or SM states reflects incursion away from natural equilibrium (Deco et al., 2017; Gu et al., 2015), as the brain enters a functionally modular state. Notably, the base state indicated high attentional engagement (Figure 5E and F) and exhibited the highest occurrence proportion (Figure 3B) as well as the longest dwell times (Figure 3—figure supplement 1) during naturalistic movie watching, whereas its functional involvement was comparatively minor during controlled tasks. This significant relevance to behavior verifies that the base state cannot simply be a byproduct of the model. We speculate that susceptibility to both external and internal information is maximized in the base state—allowing for roughly equal weighting of both sides so that they can be integrated to form a coherent representation of the world—at the expense of the stability of a certain functional network (Cocchi et al., 2017; Fagerholm et al., 2015). When processing rich narratives, particularly when a person is fully immersed without having to exert cognitive effort, a less modular state with high degrees of freedom to reach other states may be more likely to be involved. The role of the base state should be further investigated in future studies.”
- P16 L13-L17 unnecessary
We prefer to have the last paragraph as a summary of the implications of this paper. However, if the length of this paper becomes a problem as we work towards publication with the editors, we are happy to remove these lines.
- I think this paper is solid, but my main issue is with using an HMM, never explaining why, not showing inference results on test data, not reporting an R^2 score for it, and not comparing it to other models. Secondly, they use the Calinski-Harabasz score to determine the number of states, but not the log-likelihood of the fit. This clearly creates a bias in what types of states you will find, namely states that are far away from each other, which likely also leads to the functional gradient and PCA results they have. Where they specifically talk about how their states are far away from each other in the functional gradient space and correlated to (orthogonal) components. It is completely unclear to me why they used this measure because it also seems to be one of many scores you could use with respect to clustering (with potentially different results), and even odd in the presence of a loglikelihood fit to the data and with the model they use (which does not perform clustering).
(1) Showing inference results on test data
We address this concern on page 19-21 of this response letter.
(2) Not reporting 𝑹𝟐 score
We address this concern on page 21-23 of this response letter.
(3) Not comparing the HMM model to other models
We address this concern on page 27-28 of this response letter.
(4) The use of the Calinski-Harabasz score to determine the number of states rather than the log-likelihood of the model fit
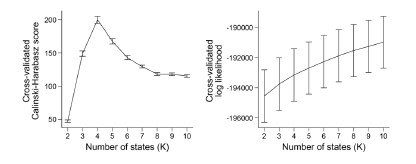
To our knowledge, the log-likelihood of the model fit is not used in the HMM literature. It is because the log-likelihood tends to increase monotonically as the number of states increases. Baker et al. (2014) illustrates this problem, writing:
“In theory, it should be possible to pick the optimal number of states by selecting the model with the greatest (negative) free energy. In practice however, we observe that the free energy increases monotonically up to K = 15 states, suggesting that the Bayes-optimal model may require an even higher number of states.”
Similarly, the following figure is the log-likelihood estimated from the SONG dataset. Similar to the findings of Baker et al. (2014), the log-likelihood monotonically increased as the number of states increased (Author response image 8, right). The measures like AIC or BIC, which account for the number of parameters, also have the same issue of monotonic increase.
Author response image 8.
Because there is “no straightforward data-driven approach to model order selection” (Baker et al., 2014), past work has used different approaches to decide on the number of states. For example, Vidaurre et al. (2018) iterated over a range of the number of states to repeat the same HMM training and inference procedures 5 times using the same hyperparameters. They selected the number of states that showed the highest consistency across iterations. Gao et al. (2021) tested the clustering performance of the model output using the Calinski-Harabasz score. The number of states that showed the highest within-cluster cohesion compared to the across-cluster separation was selected as the number of states. Chang et al. (2021) applied HMM to voxels of the ventromedial prefrontal cortex using a similar clustering algorithm, writing: “To determine the number of states for the HMM estimation procedure, we identified the number of states that maximized the average within-state spatial similarity relative to the average between-state similarity”. In our previous paper (Song et al., 2021b), we reported both the reliability and clustering performance measures to decide on the number of states.
In the current manuscript, the model consistency criterion from Vidaurre et al. (2018) was ineffective because the HMM inference was extremely robust (i.e., always inferring the exact same sequence) due to a large number of data points. Thus, we used the Calinski-Harabasz score as our criterion for the number of states selected.
We agree with the reviewer that the selection of the number of states is critical to any study that implements HMM. However, the field lacks a consensus on how to decide on the number of states in the HMM, and the Calinski-Harabasz score has been validated in previous studies. Most importantly, the latent states’ relationships with behavioral and cognitive measures give strong evidence that the latent states are indeed meaningful states. Again, we are not arguing that the optimal set of states in any dataset will be four nor are we arguing that these four states will always be the optimal states. Instead, the manuscript proposes that a small number of latent states explains meaningful variance in cognitive dynamics.
- Grammatical error: P24 L29 rendering seems to have gone wrong
Our intention was correct here. To avoid confusion, we changed “(number of participantsC2 iterations)” to “(#𝐶!iterations, where N=number of participants)” (page 26 in the manuscript).
Questions:
- Comment on subject differences, it seems like they potentially found group dynamics based on stimuli, but interesting to see individual differences in large-scale dynamics, and do they believe the states they find mostly explain global linear dynamics?
We agree with the reviewer that whether low-dimensional latent state dynamics explain individual differences—above and beyond what could be explained by the high-dimensional, temporally static neural signatures of individuals (e.g., Finn et al., 2015)—is an important research question. However, because the SONG dataset was collected in a single lab, with a focus on covering diverse contexts (rest, task, and movie watching) over 2 sessions, we were only able to collect 27 participants. Due to this small sample size, we focused on investigating group-level, shared temporal dynamics and across-condition differences, rather than on investigating individual differences.
Past work has studied individual differences (e.g., behavioral traits like well-being, intelligence, and personality) using the HMM (Vidaurre et al., 2017). In the lab, we are working on a project that investigates latent state dynamics in relation to individual differences in clinical symptoms using the Healthy Brain Network dataset (Ji et al., 2022, presented at SfN; Alexander et al., 2017).
Finally, the reviewer raises an interesting question about whether the latent state sequence that was derived here mostly explains global linear dynamics as opposed to nonlinear dynamics. We have two responses: one methodological and one theoretical. First, methodologically, we defined the emission probabilities as a linear mixture of Gaussian distributions for each input dimension with the state-specific mean (mean fMRI activity patterns of the networks) and variance (functional covariance across networks). Therefore, states are modeled with an assumption of linearity of feature combinations. Theoretically, recent work supports in favor of nonlinearity of large-scale neural dynamics, especially as tasks get richer and more complex (Cunningham and Yu, 2014; Gao et al., 2021). However, whether low-dimensional latent states should be modeled nonlinearly—that is, whether linear algorithms are insufficient at capturing latent states compared to nonlinear algorithms—is still unknown. We agree with the reviewer that the assumption of linearity is an interesting topic in systems neuroscience. However, together with prior work which showed how numerous algorithms—either linear or nonlinear—recapitulated a common set of latent states, we argue that the HMM provides a strong low-dimensional model of large-scale neural activity and interaction.
- P19 L40 why did the authors interpolate incorrect or no-responses for the gradCPT runs? It seems more logical to correct their results for these responses or to throw them out since interpolation can induce huge biases in these cases because the data is likely not missing at completely random.
Interpolating the RTs of the trials without responses (omission errors and incorrect trials) is a standardized protocol for analyzing gradCPT data (Esterman et al., 2013; Fortenbaugh et al., 2018, 2015; Jayakumar et al., 2023; Rosenberg et al., 2013; Terashima et al., 2021; Yamashita et al., 2021). The choice of this analysis is due to an assumption that sustained attention is a continuous attentional state; the RT, a proxy for the attentional state in the gradCPT literature, is a noisy measure of a smoothed, continuous attentional state. Thus, the RTs of the trials without responses are interpolated and the RT time courses are smoothed by convolving with a gaussian kernel.
References
Abbas A, Belloy M, Kashyap A, Billings J, Nezafati M, Schumacher EH, Keilholz S. 2019. Quasiperiodic patterns contribute to functional connectivity in the brain. Neuroimage 191:193–204.
Alexander LM, Escalera J, Ai L, Andreotti C, Febre K, Mangone A, Vega-Potler N, Langer N, Alexander A, Kovacs M, Litke S, O’Hagan B, Andersen J, Bronstein B, Bui A, Bushey M, Butler H, Castagna V, Camacho N, Chan E, Citera D, Clucas J, Cohen S, Dufek S, Eaves M, Fradera B, Gardner J, Grant-Villegas N, Green G, Gregory C, Hart E, Harris S, Horton M, Kahn D, Kabotyanski K, Karmel B, Kelly SP, Kleinman K, Koo B, Kramer E, Lennon E, Lord C, Mantello G, Margolis A, Merikangas KR, Milham J, Minniti G, Neuhaus R, Levine A, Osman Y, Parra LC, Pugh KR, Racanello A, Restrepo A, Saltzman T, Septimus B, Tobe R, Waltz R, Williams A, Yeo A, Castellanos FX, Klein A, Paus T, Leventhal BL, Craddock RC, Koplewicz HS, Milham MP. 2017. Data Descriptor: An open resource for transdiagnostic research in pediatric mental health and learning disorders. Sci Data 4:1–26.
Allen EA, Damaraju E, Plis SM, Erhardt EB, Eichele T, Calhoun VD. 2014. Tracking whole-brain connectivity dynamics in the resting state. Cereb Cortex 24:663–676.
Baker AP, Brookes MJ, Rezek IA, Smith SM, Behrens T, Probert Smith PJ, Woolrich M. 2014. Fast transient networks in spontaneous human brain activity. Elife 3:e01867.
Bolt T, Nomi JS, Bzdok D, Salas JA, Chang C, Yeo BTT, Uddin LQ, Keilholz SD. 2022. A Parsimonious Description of Global Functional Brain Organization in Three Spatiotemporal Patterns. Nat Neurosci 25:1093–1103.
Brown JA, Lee AJ, Pasquini L, Seeley WW. 2021. A dynamic gradient architecture generates brain activity states. Neuroimage 261:119526.
Chang C, Leopold DA, Schölvinck ML, Mandelkow H, Picchioni D, Liu X, Ye FQ, Turchi JN, Duyn JH.
- Tracking brain arousal fluctuations with fMRI. Proc Natl Acad Sci U S A 113:4518–4523.
Chang CHC, Lazaridi C, Yeshurun Y, Norman KA, Hasson U. 2021. Relating the past with the present: Information integration and segregation during ongoing narrative processing. J Cogn Neurosci 33:1–23.
Chang LJ, Jolly E, Cheong JH, Rapuano K, Greenstein N, Chen P-HA, Manning JR. 2021. Endogenous variation in ventromedial prefrontal cortex state dynamics during naturalistic viewing reflects affective experience. Sci Adv 7:eabf7129.
Chen J, Leong YC, Honey CJ, Yong CH, Norman KA, Hasson U. 2017. Shared memories reveal shared structure in neural activity across individuals. Nat Neurosci 20:115–125.
Chen S, Langley J, Chen X, Hu X. 2016. Spatiotemporal Modeling of Brain Dynamics Using RestingState Functional Magnetic Resonance Imaging with Gaussian Hidden Markov Model. Brain Connect 6:326–334.
Cocchi L, Gollo LL, Zalesky A, Breakspear M. 2017. Criticality in the brain: A synthesis of neurobiology, models and cognition. Prog Neurobiol 158:132–152.
Cornblath EJ, Ashourvan A, Kim JZ, Betzel RF, Ciric R, Adebimpe A, Baum GL, He X, Ruparel K, Moore TM, Gur RC, Gur RE, Shinohara RT, Roalf DR, Satterthwaite TD, Bassett DS. 2020. Temporal sequences of brain activity at rest are constrained by white matter structure and modulated by cognitive demands. Commun Biol 3:261.
Cunningham JP, Yu BM. 2014. Dimensionality reduction for large-scale neural recordings. Nat Neurosci 17:1500–1509.
Deco G, Kringelbach ML, Jirsa VK, Ritter P. 2017. The dynamics of resting fluctuations in the brain: Metastability and its dynamical cortical core. Sci Rep 7:3095.
Esterman M, Noonan SK, Rosenberg M, Degutis J. 2013. In the zone or zoning out? Tracking behavioral and neural fluctuations during sustained attention. Cereb Cortex 23:2712–2723.
Esterman M, Rothlein D. 2019. Models of sustained attention. Curr Opin Psychol 29:174–180.
Fagerholm ED, Lorenz R, Scott G, Dinov M, Hellyer PJ, Mirzaei N, Leeson C, Carmichael DW, Sharp DJ, Shew WL, Leech R. 2015. Cascades and cognitive state: Focused attention incurs subcritical dynamics. J Neurosci 35:4626–4634.
Falahpour M, Chang C, Wong CW, Liu TT. 2018. Template-based prediction of vigilance fluctuations in resting-state fMRI. Neuroimage 174:317–327.
Finn ES, Shen X, Scheinost D, Rosenberg MD, Huang J, Chun MM, Papademetris X, Constable RT. 2015. Functional connectome fingerprinting: Identifying individuals using patterns of brain connectivity. Nat Neurosci 18:1664–1671.
Fortenbaugh FC, Degutis J, Germine L, Wilmer JB, Grosso M, Russo K, Esterman M. 2015. Sustained attention across the life span in a sample of 10,000: Dissociating ability and strategy. Psychol Sci 26:1497–1510.
Fortenbaugh FC, Rothlein D, McGlinchey R, DeGutis J, Esterman M. 2018. Tracking behavioral and neural fluctuations during sustained attention: A robust replication and extension. Neuroimage 171:148–164.
Fox MD, Snyder AZ, Vincent JL, Corbetta M, Van Essen DC, Raichle ME. 2005. The human brain is intrinsically organized into dynamic, anticorrelated functional networks. Proc Natl Acad Sci U S A 102:9673–9678.
Gao S, Mishne G, Scheinost D. 2021. Nonlinear manifold learning in functional magnetic resonance imaging uncovers a low-dimensional space of brain dynamics. Hum Brain Mapp 42:4510–4524.
Goodale SE, Ahmed N, Zhao C, de Zwart JA, Özbay PS, Picchioni D, Duyn J, Englot DJ, Morgan VL, Chang C. 2021. Fmri-based detection of alertness predicts behavioral response variability. Elife 10:1–20.
Greene AS, Horien C, Barson D, Scheinost D, Constable RT. 2023. Why is everyone talking about brain state? Trends Neurosci.
Greene DJ, Marek S, Gordon EM, Siegel JS, Gratton C, Laumann TO, Gilmore AW, Berg JJ, Nguyen AL, Dierker D, Van AN, Ortega M, Newbold DJ, Hampton JM, Nielsen AN, McDermott KB, Roland JL, Norris SA, Nelson SM, Snyder AZ, Schlaggar BL, Petersen SE, Dosenbach NUF. 2020. Integrative and Network-Specific Connectivity of the Basal Ganglia and Thalamus Defined in Individuals. Neuron 105:742-758.e6.
Gu S, Pasqualetti F, Cieslak M, Telesford QK, Yu AB, Kahn AE, Medaglia JD, Vettel JM, Miller MB, Grafton ST, Bassett DS. 2015. Controllability of structural brain networks. Nat Commun 6:8414.
Jayakumar M, Balusu C, Aly M. 2023. Attentional fluctuations and the temporal organization of memory. Cognition 235:105408.
Ji E, Lee JE, Hong SJ, Shim W (2022). Idiosyncrasy of latent neural state dynamic in ASD during movie watching. Poster presented at the Society for Neuroscience 2022 Annual Meeting.
Karapanagiotidis T, Vidaurre D, Quinn AJ, Vatansever D, Poerio GL, Turnbull A, Ho NSP, Leech R, Bernhardt BC, Jefferies E, Margulies DS, Nichols TE, Woolrich MW, Smallwood J. 2020. The psychological correlates of distinct neural states occurring during wakeful rest. Sci Rep 10:1–11.
Liu X, Duyn JH. 2013. Time-varying functional network information extracted from brief instances of spontaneous brain activity. Proc Natl Acad Sci U S A 110:4392–4397.
Liu X, Zhang N, Chang C, Duyn JH. 2018. Co-activation patterns in resting-state fMRI signals. Neuroimage 180:485–494.
Lynn CW, Cornblath EJ, Papadopoulos L, Bertolero MA, Bassett DS. 2021. Broken detailed balance and entropy production in the human brain. Proc Natl Acad Sci 118:e2109889118.
Margulies DS, Ghosh SS, Goulas A, Falkiewicz M, Huntenburg JM, Langs G, Bezgin G, Eickhoff SB, Castellanos FX, Petrides M, Jefferies E, Smallwood J. 2016. Situating the default-mode network along a principal gradient of macroscale cortical organization. Proc Natl Acad Sci U S A 113:12574–12579.
Mesulam MM. 1998. From sensation to cognition. Brain 121:1013–1052.
Munn BR, Müller EJ, Wainstein G, Shine JM. 2021. The ascending arousal system shapes neural dynamics to mediate awareness of cognitive states. Nat Commun 12:1–9.
Raut R V., Snyder AZ, Mitra A, Yellin D, Fujii N, Malach R, Raichle ME. 2021. Global waves synchronize the brain’s functional systems with fluctuating arousal. Sci Adv 7.
Rosenberg M, Noonan S, DeGutis J, Esterman M. 2013. Sustaining visual attention in the face of distraction: A novel gradual-onset continuous performance task. Attention, Perception, Psychophys 75:426–439.
Rosenberg MD, Finn ES, Scheinost D, Papademetris X, Shen X, Constable RT, Chun MM. 2016. A neuromarker of sustained attention from whole-brain functional connectivity. Nat Neurosci 19:165–171.
Rosenberg MD, Scheinost D, Greene AS, Avery EW, Kwon YH, Finn ES, Ramani R, Qiu M, Todd Constable R, Chun MM. 2020. Functional connectivity predicts changes in attention observed across minutes, days, and months. Proc Natl Acad Sci U S A 117:3797–3807.
Saggar M, Shine JM, Liégeois R, Dosenbach NUF, Fair D. 2022. Precision dynamical mapping using topological data analysis reveals a hub-like transition state at rest. Nat Commun 13.
Schaefer A, Kong R, Gordon EM, Laumann TO, Zuo X-N, Holmes AJ, Eickhoff SB, Yeo BTT. 2018. Local-Global Parcellation of the Human Cerebral Cortex from Intrinsic Functional Connectivity MRI. Cereb Cortex 28:3095–3114.
Shine JM. 2019. Neuromodulatory Influences on Integration and Segregation in the Brain. Trends Cogn Sci 23:572–583.
Shine JM, Bissett PG, Bell PT, Koyejo O, Balsters JH, Gorgolewski KJ, Moodie CA, Poldrack RA. 2016. The Dynamics of Functional Brain Networks: Integrated Network States during Cognitive Task Performance. Neuron 92:544–554.
Shine JM, Breakspear M, Bell PT, Ehgoetz Martens K, Shine R, Koyejo O, Sporns O, Poldrack RA. 2019. Human cognition involves the dynamic integration of neural activity and neuromodulatory systems. Nat Neurosci 22:289–296.
Smith SM, Fox PT, Miller KL, Glahn DC, Fox PM, Mackay CE, Filippini N, Watkins KE, Toro R, Laird AR, Beckmann CF. 2009. Correspondence of the brain’s functional architecture during activation and rest. Proc Natl Acad Sci 106:13040–13045.
Song H, Emily FS, Rosenberg MD. 2021a. Neural signatures of attentional engagement during narratives and its consequences for event memory. Proc Natl Acad Sci 118:e2021905118.
Song H, Park B-Y, Park H, Shim WM. 2021b. Cognitive and Neural State Dynamics of Narrative Comprehension. J Neurosci 41:8972–8990.
Taghia J, Cai W, Ryali S, Kochalka J, Nicholas J, Chen T, Menon V. 2018. Uncovering hidden brain state dynamics that regulate performance and decision-making during cognition. Nat Commun 9:2505.
Terashima H, Kihara K, Kawahara JI, Kondo HM. 2021. Common principles underlie the fluctuation of auditory and visual sustained attention. Q J Exp Psychol 74:705–715.
Tian Y, Margulies DS, Breakspear M, Zalesky A. 2020. Topographic organization of the human subcortex unveiled with functional connectivity gradients. Nat Neurosci 23:1421–1432.
Turnbull A, Karapanagiotidis T, Wang HT, Bernhardt BC, Leech R, Margulies D, Schooler J, Jefferies E, Smallwood J. 2020. Reductions in task positive neural systems occur with the passage of time and are associated with changes in ongoing thought. Sci Rep 10:1–10.
Unsworth N, Robison MK. 2018. Tracking arousal state and mind wandering with pupillometry. Cogn Affect Behav Neurosci 18:638–664.
Unsworth N, Robison MK. 2016. Pupillary correlates of lapses of sustained attention. Cogn Affect Behav Neurosci 16:601–615.
van der Meer JN, Breakspear M, Chang LJ, Sonkusare S, Cocchi L. 2020. Movie viewing elicits rich and reliable brain state dynamics. Nat Commun 11:1–14.
Van Essen DC, Smith SM, Barch DM, Behrens TEJ, Yacoub E, Ugurbil K. 2013. The WU-Minn Human Connectome Project: An overview. Neuroimage 80:62–79.
Vidaurre D, Abeysuriya R, Becker R, Quinn AJ, Alfaro-Almagro F, Smith SM, Woolrich MW. 2018. Discovering dynamic brain networks from big data in rest and task. Neuroimage, Brain Connectivity Dynamics 180:646–656.
Vidaurre D, Smith SM, Woolrich MW. 2017. Brain network dynamics are hierarchically organized in time. Proc Natl Acad Sci U S A 114:12827–12832.
Yamashita A, Rothlein D, Kucyi A, Valera EM, Esterman M. 2021. Brain state-based detection of attentional fluctuations and their modulation. Neuroimage 236:118072.
Yeo BTT, Krienen FM, Sepulcre J, Sabuncu MR, Lashkari D, Hollinshead M, Roffman JL, Smoller JW, Zöllei L, Polimeni JR, Fisch B, Liu H, Buckner RL. 2011. The organization of the human cerebral cortex estimated by intrinsic functional connectivity. J Neurophysiol 106:1125–1165.
Yousefi B, Keilholz S. 2021. Propagating patterns of intrinsic activity along macroscale gradients coordinate functional connections across the whole brain. Neuroimage 231:117827.
Zhang S, Goodale SE, Gold BP, Morgan VL, Englot DJ, Chang C. 2023. Vigilance associates with the low-dimensional structure of fMRI data. Neuroimage 267.
-
eLife assessment
This valuable study examines the distribution of four states of brain activity across a variety of cognitive conditions, linking systems neuroscience with cognition and behavior. The work is convincing, using null models and replication in independent datasets to support their findings.
-
Reviewer #1 (Public Review):
This manuscript will interest cognitive scientists, neuroimaging researchers, and neuroscientists interested in the systems-level organization of brain activity. The authors describe four brain states that are present across a wide range of cognitive tasks and determine that the relative distribution of the brain states shows both commonalities and differences across task conditions.
The authors characterized the low-dimensional latent space that has been shown to capture the major features of intrinsic brain activity using four states obtained with a Hidden Markov Model. They related the four states to previously-described functional gradients in the brain and examined the relative contribution of each state under different cognitive conditions. They showed that states related to the measured behavior for …
Reviewer #1 (Public Review):
This manuscript will interest cognitive scientists, neuroimaging researchers, and neuroscientists interested in the systems-level organization of brain activity. The authors describe four brain states that are present across a wide range of cognitive tasks and determine that the relative distribution of the brain states shows both commonalities and differences across task conditions.
The authors characterized the low-dimensional latent space that has been shown to capture the major features of intrinsic brain activity using four states obtained with a Hidden Markov Model. They related the four states to previously-described functional gradients in the brain and examined the relative contribution of each state under different cognitive conditions. They showed that states related to the measured behavior for each condition differed, but that a common state appears to reflect disengagement across conditions. The authors bring together a state-of-the-art analysis of systems-level brain dynamics and cognitive neuroscience, bridging a gap that has long needed to be bridged.
The strongest aspect of the study is its rigor. The authors use appropriate null models and examine multiple datasets (not used in the original analysis) to demonstrate that their findings replicate. Their thorough analysis convincingly supports their assertion that common states are present across a variety of conditions, but that different states may predict behavioural measures for different conditions. However, the authors could have better situated their work within the existing literature. It is not that a more exhaustive literature review is needed-it is that some of their results are unsurprising given the work reported in other manuscripts; some of their work reinforces or is reinforced by prior studies; and some of their work is not compared to similar findings obtained with other analysis approaches. While space is not unlimited, some of these gaps are important enough that they are worth addressing:
1. The authors' own prior work on functional connectivity signatures of attention is not discussed in comparison to the latest work. Neither is work from other groups showing signatures of arousal that change over time, particularly in resting state scans. Attention and arousal are not the same things, but they are intertwined, and both have been linked to large-scale changes in brain activity that should be captured in the HMM latent states. The authors should discuss how the current work fits with existing studies.
2. The 'base state' has been described in a number of prior papers (for one early example, see https://pubmed.ncbi.nlm.nih.gov/27008543). The idea that it might serve as a hub or intermediary for other states has been raised in other studies, and discussion of the similarity or differences between those studies and this one would provide better context for the interpretation of the current work. One of the intriguing findings of the current study is that the incidence of this base state increases during sitcom watching, the strongest evidence to date is that it has a cognitive role and is not merely a configuration of activity that the brain must pass through when making a transition.
3. The link between latent states and functional connectivity gradients should be considered in the context of prior work showing that the spatiotemporal patterns of intrinsic activity that account for most of the structure in resting state fMRI also sweep across functional connectivity gradients (https://pubmed.ncbi.nlm.nih.gov/33549755/ ). In fact, the spatiotemporal dynamics may give rise to the functional connectivity gradients (https://pubmed.ncbi.nlm.nih.gov/35902649/ ). HMM states bear a marked resemblance to the high-activity phases of these patterns and are likely to be closely linked to them. The spatiotemporal patterns are typically obtained during rest, but they have been reported during task performance (https://pubmed.ncbi.nlm.nih.gov/30753928/ ) which further suggests a link to the current work. Similar patterns have been observed in anesthetized animals, which also reinforces the conclusion of the current work that the states are fundamental aspects of the brain's functional organization. -
Reviewer #2 (Public Review):
In this study, Song and colleagues applied a Hidden Markov Model to whole-brain fMRI data from the unique SONG dataset and a grad-CPT task, and in doing so observed robust transitions between low-dimensional states that they then attributed to specific psychological features extracted from the different tasks.
The methods used appeared to be sound and robust to parameter choices. Whenever choices were made regarding specific parameters, the authors demonstrated that their approach was robust to different values, and also replicated their main findings on a separate dataset.
I was mildly concerned that similarities in some of the algorithms used may have rendered some of the inter-measure results as somewhat inevitable (a hypothesis that could be tested using appropriate null models).
This work is quite …
Reviewer #2 (Public Review):
In this study, Song and colleagues applied a Hidden Markov Model to whole-brain fMRI data from the unique SONG dataset and a grad-CPT task, and in doing so observed robust transitions between low-dimensional states that they then attributed to specific psychological features extracted from the different tasks.
The methods used appeared to be sound and robust to parameter choices. Whenever choices were made regarding specific parameters, the authors demonstrated that their approach was robust to different values, and also replicated their main findings on a separate dataset.
I was mildly concerned that similarities in some of the algorithms used may have rendered some of the inter-measure results as somewhat inevitable (a hypothesis that could be tested using appropriate null models).
This work is quite integrative, linking together a number of previous studies into a framework that allows for interesting follow-up questions.
Overall, I found the work to be robust, interesting, and integrative, with a wide-ranging citation list and exciting implications for future work.
-
Reviewer #3 (Public Review):
My general assessment of the paper is that the analyses done after they find the model are exemplary and show some interesting results. However, the method they use to find the number of states (Calinski-Harabasz score instead of log-likelihood), the model they use generally (HMM), and the fact that they don't show how they find the number of states on HCP, with the Schaeffer atlas, and do not report their R^2 on a test set is a little concerning. I don't think this perse impedes their results, but it is something that they can improve. They argue that the states they find align with long-standing ideas about the functional organization of the brain and align with other research, but they can improve their selection for their model.
Strengths:
- Use multiple datasets, multiple ROIs, and multiple analyses to …
Reviewer #3 (Public Review):
My general assessment of the paper is that the analyses done after they find the model are exemplary and show some interesting results. However, the method they use to find the number of states (Calinski-Harabasz score instead of log-likelihood), the model they use generally (HMM), and the fact that they don't show how they find the number of states on HCP, with the Schaeffer atlas, and do not report their R^2 on a test set is a little concerning. I don't think this perse impedes their results, but it is something that they can improve. They argue that the states they find align with long-standing ideas about the functional organization of the brain and align with other research, but they can improve their selection for their model.
Strengths:
- Use multiple datasets, multiple ROIs, and multiple analyses to validate their results
- Figures are convincing in the sense that patterns clearly synchronize between participants
- Authors select the number of states using the optimal model fit (although this turns out to be a little more questionable due to what they quantify as 'optimal model fit')
- Replication with Schaeffer atlas makes results more convincing
- The analyses around the fact that the base state acts as a flexible hub are well done and well explained
- Their comparison of synchrony is well-done and comparing it to resting-state, which does not have any significant synchrony among participants is obvious, but still good to compare against.
- Their results with respect to similar narrative engagement being correlated with similar neural state dynamics are well done and interesting.
- Their results on event boundaries are compelling and well done. However, I do not find their Chang et al. results convincing (Figure 4B), it could just be because it is a different medium that explains differences in DMN response, but to me, it seems like these are just altogether different patterns that can not 100% be explained by their method/results.
- Their results that when there is no event, transition into the DMN state comes from the base state is 50% is interesting and a strong result. However, it is unclear if this is just for the sitcom or also for Chang et al.'s data.
- The involvement of the base state as being highly engaged during the comedy sitcom and the movie are interesting results that warrant further study into the base state theory they pose in this work.
- It is good that they make sure SM states are not just because of head motion (P 12).
- Their comparison between functional gradient and neural states is good, and their results are generally well-supported, intuitive, and interesting enough to warrant further research into them. Their findings on the context-specificity of their DMN and DAN state are interesting and relate well to the antagonistic relationship in resting-state data.Weaknesses:
- Authors should train the model on part of the data and validate on another
- Comparison with just PCA/functional gradients is weak in establishing whether HMMs are good models of the timeseries. Especially given that the HMM does not explain a lot of variance in the signal (~0.5 R^2 for only 27 brain regions) for PCA. I think they don't report their own R^2 of the timeseries
- Authors do not specify whether they also did cross-validation for the HCP dataset to find 4 clusters
- One of their main contributions is the base state but the correlation between the base state in their Song dataset and the HCP dataset is only 0.399
- Figure 1B: Parcellation is quite big but there seems to be a gradient within regions
- Figure 1D: Why are the DMNs further apart between SONG and HCP than the other states
- Page 5 paragraph starting at L25: Their hypothesis that functional gradients explain large variance in neural dynamics needs to be explained more, is non-trivial especially because their R^2 scores are so low (Fig 1. Supplement 8) for PCA
- Generally, I do not find the PCA analysis convincing and believe they should also compare to something like ICA or a different model of dynamics. They do not explain their reasoning behind assuming an HMM, which is an extremely simplified idea of brain dynamics meaning they only change based on the previous state.
- For the 25- ROI replication it seems like they again do not try multiple K values for the number of states to validate that 4 states are in fact the correct number.
- Fig 2B: Colorbar goes from -0.05 to 0.05 but values are up to 0.87
- P 16 L4 near-critical, authors need to be more specific in their terminology here especially since they talk about dynamic systems, where near-criticality has a specific definition. It is unclear which definition they are looking for here.
- P16 L13-L17 unnecessary
- I think this paper is solid, but my main issue is with using an HMM, never explaining why, not showing inference results on test data, not reporting an R^2 score for it, and not comparing it to other models. Secondly, they use the Calinski-Harabasz score to determine the number of states, but not the log-likelihood of the fit. This clearly creates a bias in what types of states you will find, namely states that are far away from each other, which likely also leads to the functional gradient and PCA results they have. Where they specifically talk about how their states are far away from each other in the functional gradient space and correlated to (orthogonal) components. It is completely unclear to me why they used this measure because it also seems to be one of many scores you could use with respect to clustering (with potentially different results), and even odd in the presence of a log-likelihood fit to the data and with the model they use (which does not perform clustering).
- Grammatical error: P24 L29 rendering seems to have gone wrongQuestions:
- Comment on subject differences, it seems like they potentially found group dynamics based on stimuli, but interesting to see individual differences in large-scale dynamics, and do they believe the states they find mostly explain global linear dynamics?
- P19 L40 why did the authors interpolate incorrect or no-responses for the gradCPT runs? It seems more logical to correct their results for these responses or to throw them out since interpolation can induce huge biases in these cases because the data is likely not missing at completely random. -
