Diversification of multipotential postmitotic mouse retinal ganglion cell precursors into discrete types
Curation statements for this article:-
Curated by eLife

Evaluation Summary:
This study using single cell RNA Seq to profile developing retinal ganglion cells from embryonic and postnatal mouse retina explores the diversification of this class of neurons into specific subtypes. The computational approaches developed identify groups of RGC precursors with largely non-overlapping fates, distinguished by selectively expressed transcription factors that could act as fate determinants. The aim is to show that over time, clusters of cells become "decoupled" as they split into subclusters, and this process is associated with changes in the expression of specific transcription factors. This leads to the proposal that subtype diversification arises as a gradual, asynchronous fate restriction of postmitotic multipotential precursors. These findings enable the prediction of lineage relationships among RGC subtypes and the developmental time when these specification events occur, and should be of great interest to the developmental neurobiology community.
(This preprint has been reviewed by eLife. We include the public reviews from the reviewers here; the authors also receive private feedback with suggested changes to the manuscript. Reviewer #1 agreed to share their name with the authors.)
This article has been Reviewed by the following groups
Discuss this preprint
Start a discussion What are Sciety discussions?Listed in
- Evaluated articles (eLife)
Abstract
The genesis of broad neuronal classes from multipotential neural progenitor cells has been extensively studied, but less is known about the diversification of a single neuronal class into multiple types. We used single-cell RNA-seq to study how newly born (postmitotic) mouse retinal ganglion cell (RGC) precursors diversify into ~45 discrete types. Computational analysis provides evidence that RGC transcriptomic type identity is not specified at mitotic exit, but acquired by gradual, asynchronous restriction of postmitotic multipotential precursors. Some types are not identifiable until a week after they are generated. Immature RGCs may be specified to project ipsilaterally or contralaterally to the rest of the brain before their type identity emerges. Optimal transport inference identifies groups of RGC precursors with largely nonoverlapping fates, distinguished by selectively expressed transcription factors that could act as fate determinants. Our study provides a framework for investigating the molecular diversification of discrete types within a neuronal class.
Article activity feed
-

-

Author Response:
Reviewer #1 (Public Review):
In this report, Shekhar et al, have profiled developing retinal ganglion cells from embryonic and postnatal mouse retina to explore the diversification of this class of neurons into specific subtypes. In mature retina, scRNAseq and other methods have defined approximately 45 different subtypes of RGCs, and the authors ask whether these arise from a common postmitotic precursor, or many ditinct subtypes of precursors. The overall message, is that subtype diversification arises as a "gradual, asynchronus fate restriction of postmitotic multipotential precursors. The authors find that over time, clusters of cells become "decoupled" as they split into subclusters. This process of fate decoupling is associated with changes in the expression of specific transcription factors. This allows them …
Author Response:
Reviewer #1 (Public Review):
In this report, Shekhar et al, have profiled developing retinal ganglion cells from embryonic and postnatal mouse retina to explore the diversification of this class of neurons into specific subtypes. In mature retina, scRNAseq and other methods have defined approximately 45 different subtypes of RGCs, and the authors ask whether these arise from a common postmitotic precursor, or many ditinct subtypes of precursors. The overall message, is that subtype diversification arises as a "gradual, asynchronus fate restriction of postmitotic multipotential precursors. The authors find that over time, clusters of cells become "decoupled" as they split into subclusters. This process of fate decoupling is associated with changes in the expression of specific transcription factors. This allows them to both predict lineage relationships among RGC subtypes and the time during development when these specification events occur. Although this conclusion based almost entirely on a computational analysis of the relationships among cells sampled at discrete times, the evidence presented supports the overall conclusion. Future experimental validation of the proposed lineage relationships of RGC subtypes will be needed, but this report clearly outlines the overall pattern of diversification in this cell class.
We thank the reviewer for their thoughtful assessment of our study.
Reviewer #2 (Public Review):
The manuscript "Diversification of multipotential postmitotic mouse retinal ganglion cell precursors into discrete types" by Shekhar and colleagues represents an in-depth analysis of an additional transcriptomic datasets of retinal single-cells. It explores the progression of retinal ganglion cells diversity during development and describes some of aspects of fate acquisition in these postmitotic neurons. Altogether the findings provide another resource on which the neural development community will be able to generate new hypotheses in the field of retinal ganglion cell differentiation. A key point that is made by the authors regards the progression of the number of ganglion cell types in the mouse retina, i.e., how, and when neuronal "classes diversify into subclasses and types" (also p. 125). In particular, the authors would like to address whether postmitotic neurons follow either a predetermination or a stepwise progression (Fig. 2a). This is indeed a fascinating question, and the analysis, including the one based on the Waddington-OT method is conceptually interesting.
Comments and questions:
Is the transcriptomic diversity, based on highly variable genes (the number of which is not detailed in the study) a robust proxy to assess cell types? One could argue that early on predetermined cell types are specified by a small set of determinants, both at the proteomic and transcriptomic level, and that it takes several days or week to generate the cascade that allows the detection of transcriptional diversity at the level of >100 gene expression levels.
We had tested the dependence of our results on the number of highly variable genes (HVGs) used. This analysis, shown in Figure 2h, demonstrates that results are robust over the range tested – 1244-3003 total HVGs. Since the analysis in the paper employs 2800 HVGs (~800- 1500 at each stage), we are confident that we are in comfortable excess of the number at which we would need to worry. We have expanded the discussion to avoid confusion on this point. We also address the possibility that a small set of determinants are sufficient to define cell state in a transcriptomic study. This is a common argument, but we believe it is a tenuous one. We believe that the only way a small number of genes can truly define cell state is if they are expressed at very high levels. If these are expressed at high levels, they should be detected in our data and should drive the clustering. If they are expressed at extremely low levels, then given the nature of molecular fluctuations in cells, they cannot be expected to serve as a stable scaffold for differentiation. Indeed, a small set of determinants (usually transcription factors) may be necessary to specify a cell type. However, sufficiency of specification requires the expression of a usually much larger of number downstream regulators.
Since there are many RGC subsets (45) that share a great number of their gene expression, is it possible that a given RGC could transition from one subset to another between P5 and P56? Or even responding to a state linked to sustained activity? Was this possibility tested in the model?
We cannot address the possibility that cells swap types postnatally so that the cells comprising type X at P5 are not the same ones that comprise type X at P56. It does seem pretty unlikely, as the cell types are well-separated in transcriptional space (~250 DE genes on average). Regarding activity, we have made some initial tests by preventing visually evoked activity from birth to P56 in three different ways (dark-rearing and two mutant lines). We find no statistically significant effect on diversification. These results are currently being prepared for publication.
The authors state that early during development there is less diversity than later. This statement seems obvious but how much. Can this be due to differential differentiation stage? At E16 RGC are a mix of cells born from E11 to E16, with the latter barely located in the GCL. Does this tend to show a continuum that is may be probably lost when the analysis is performed on cells isolated a long time after they were born (postnatal stages)? Alternatively, would it be possible to compare RGC that have been label with birth dating methods?
Regarding the amount of diversification, we quantified this using the Rao diversity index (Figure 2h), which suggests an overall increase in 2-fold transcriptional diversity at P56 compared to the early stages. The continuum is likely because cells at early stage are close to the precursor stage and not very differentiated. Regarding combining RNA-seq with birthdating, although elegant methods now make this combination possible, it falls beyond the scope of this study.
Comparing data produced by different methods can be challenging. Here the authors compared transcriptomic diversity between embryonic dataset produced with 10X genomics (E13 to P0) and, on the other hand, postnatal P5 that were produced using a different drop-seq procedure). Is it possible to control that the differences observed are not due to the different methods?
It is correct that most of the P5 data was produced using Drop-seq, but that dataset also includes transcriptomes obtained by the 10X method. The relative frequency of RGC clusters and the average gene expression values obtained using either method was highly correlated (Reviewer Fig. 1). This is now pointed out in the “Methods.”
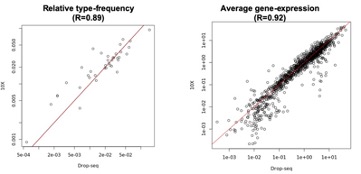
Reviewer Fig. 1. Comparison between the relative frequency of types (left) and the average gene expression levels (right) at P5 between 10X data (y-axis) and Drop-seq data (x-axis). R corresponds to the Pearson correlation coefficient. The axes are plotted in the logarithmic scale.
It might be important to control the conclusion that diversity is lower at E13 vs P5 when we see that thrice less cells (5900 vs 180000) were analyzed at early stage (BrdU, EdU, CFSE...)? A simple downsampling prior to the analysis may help.
Although we collected different numbers of cells at different ages, we noted in the text that they do not influence the number of clusters. Regarding P5 specifically, Rheaume et al. (who we now discuss) obtained very similar results to ours with only 6000 cells (3x lower).
Ipsilateral RGC: It is striking that the DEG between C-RGC and I-RGC reflect a strong bias with cells scored as" ipsi" are immature RGC while the other ("contra") are much more mature. This bias comes from the way ipsilateral RGC were "inferred" using non-specific markers. Can the author try again the analysis by identifying RGC using more robust markers? (eg. EphB1). Would it be possible to select I-RGC and C-RGC that share same level of differentiation? Previous studies already identified I-RGC signature using more specific set-up (Wang et al., 2016 from retrogradely labelled RGC; Lo Giudice et al., 2019 with I-RGC specific transgenic mouse).
We are not sure how the reviewer concludes that the putative I-RGCs are more immature than the putative C-RGCs. As discussed earlier, insofar as expression levels of pan-RGC markers are indicative of maturational stage, we found no evidence that clustering is driven by maturation gradients. Thus, we expect our putative I-RGCs and C-RGCs to not differ in differentiation state. Following the reviewer’s suggestion, we now include EphB1(Ephb1) in our I-RGC signature. The impact of replacing Igfbp5 with Ephb1 on the inferred proportion of I-RGCs within each terminal type was minimal (Reviewer Fig. 2). We would like to note that to assemble our IRGC/C-RGC signatures we relied on data presented Wang et al. (2016). Outside of wellestablished markers (e.g. Zic2, and Isl2), we chose the RNA-seq hits in Wang et al. that had been validated histologically in the same paper or that are correlated with Zic2 expression in our data. This nominated Igfbp5, Zic1, Fgf12, and Igf1.
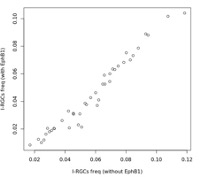
Reviewer Fig. 2. Comparison of inferred I-RGC frequency within each terminal type (points) using two I-RGC signature reported in the paper. For the y-axis we used Zic2 and EphB1.
It would be important to discuss how their findings differs from the others (including Rheaume et al., 2018). To make a strong point, I-RGC shall be isolated at a stage of final maturation (P5?) and using retrograde labelling, which is a robust method to ensure the ipsilateral identity of postnatal RGCs.
We cite Rheaume et al. in several places. In fact, there is good transcriptional correspondence between our dataset and theirs (Figure S1i), despite the differences in the number of cells profiled (~6000 vs ~18000) and technologies (10X vs. Drop-seq/10X). We now mention this is the text. Note also that we had compared our P56 data with Rheaume et al.’s, P5 data in an earlier publication (Tran et al., 2019) and observed a similar tight correspondence between clusters. Zic1 is expressed in I-RGCs (Wang et al., 2016) at early stages, and in our dataset its expression at E13 and E14 is similar to that of Zic2 (Supplementary Fig. 8); Postnatally, however, it marks W3B RGCs (Tran et al., 2019), many of which project contralaterally (Kim et al., J. Neurosci. 2010). Regarding retrograde labeling, as noted above, additional experiments would take a prohibitively long time (up to a year) to complete.
It is unclear how good Zic1 and Igf1 can be used as I-RGC marker. Can the author specify how specific to I-RGC they are? Have they been confirmed as marker using retrograde labelling experiments?
We have relied on previous work, primarily from the Mason lab, to choose I-RGC and C-RGC markers. Igf1 is a C-RGC marker that is expressed in a complementary fashion with Igfbp5, an I-RGC marker as noted in Wang et al, 2016. They also perform ISH to show that Igf1 is not expressed in the VT crescent, while Igfbp5 is (see Fig. 5 in Wang et al., 2016). Similarly, Zic1 is also cited in Wang et al. as an RNA-seq hit for I-RGCs. Although Zic1 was not validated using ISH, we found its expression pattern to be highly correlated with Zic2 at E13 (Supplementary Fig. 8c).
The enrichment procedure may deplete the RGC subpopulation that express low levels of Thy1 or L1CAM. A comparison on that point could be done with the other datasets analysed in the study.
We presume the reviewer is referring to the data of Lo Guidice and Clark/Blackshaw, which we show in comparison to ours in Figure S1. In both of those studies, all retinal cells were analyzed, whereas we enriched RGCs. As noted in the text, RGCs comprise a very small fraction of all retinal cells, so Lo Giudice and Clark/Blackshaw lacked the resolution to resolve RGC diversity at later time points. Indeed, there is no whole retina dataset available in which RGCs are numerous enough for comprehensive subtyping. Our approach to this issue was to collect RGCs with both Thy1 and L1 at E13, E14, E16 and P0, with the idea that the markers might have complementary strengths and weaknesses. In fact, at each age, all clusters are present in both collection types, although frequencies vary. This concordance supports the idea that neither marker excludes particular types. We now stress this point in results and in the Supplementary Fig. 2 legend.
In supplemental Fig. S1e: why are cells embedded from "Clark" datasets only clusters on the right side of the UMAP while the others are more evenly distributed?
Actually, both the Clark et al. and Lo Giudice et al. datasets are predominantly clustered on the right side of the UMAP. This reflects the methodological difference noted above: they profiled the whole retina, whereas we isolated RGCs. Thus, their datasets contain a much higher abundance of RPCs and non-neurogenic precursors compared to ours. The right clusters represent RPCs due to their expression of Fgf15 and other markers, while the left clusters represent RGCs based on their expression of Nefl. Indeed, a main reason for including these plots was to illustrate the relative abundance of RGCs in our data (also see Supplementary Fig. S1h).
What could explain that CD90 and L1CAM population are intermingled at E14, distinct at E16, and then more mixed at P0?
We believe the reviewer is referring to Supplementary Figs. S2a-c. Given the temporal expression level changes in Thy1 and L1cam (Supplementary Fig. S1c) in RGCs, a likely possibility is that they enrich RGC precursor subsets at different relative frequencies. We now note this in the Supplementary Fig. 2 legend.
On Fig. 6: the E13 RGC seems to be segregated in early born RGC expressing Eomes and later born expressing neurod2. Thus, fare coupling with P5 seems to suggest that Eomes population at P5 may have been generated first, and Neurod2 generated later. Is that possible?
That the Eomes RGCs are specified before Neurod2 RGCs is one of our conclusions from the fate decoupling analysis (Figures 6f-h). Whether this is because the former arise from early born cells and the latter arise from later born cells is not clear. There is disagreement in the literature on whether ipRGCs are born at a different time than other RGCs, so we prefer not to make a comment.
Methods: The Methods section is extensive, and yet it is presented in a rather complex manner so that it is difficult to understand for a broad audience. It would be valuable if the authors could simplify or better explain some parts (the WOT section in particular).
We believe that the sections on animals, molecular biology and histology are quite straightforward, but agree that the sections describing the computational analysis are hard going. We have modified them in several places as requested. As regards better explanation of the WOT, we now precede that section with an “overview” as a way of making it easier to follow. (We had already included an overview of the clustering procedures.) We have also provided further detail on some of the reviewer’s subsequent questions on this section, including the use of HVGs, the Classifier, and the strategy for inferring I-RGCs (see below). Perhaps most important, we have worked to make the “Results” and “Discussion” sections accessible to a broad audience.
*Highly variable genes (HVG) used for clustering and dimensionality reduction: how many of them and what are they? Are they the same used for each stage?
Since clustering was performed at each stage independently, we determined HVGs at each stage separately using a statistical method introduced in one of our previous studies (Pandey et al., Current Biology, 2018). The total number of HVGs at each stage were as follows: E13: N=1094 E14: N=834 E16: N=822 P0: N=881 P5: N=1105 P56: N=1510
We note that these are not necessarily the same at each stage due to the temporal variation in gene expression. Together these correspond to 2854 unique genes (union of all HVGs). The WOT analysis was done using this full set.
*In the methods p9: "The common features G = GR ∩ GT are used to train a third classifier ClassR on the reference atlas AR. This ensures that inferred transcriptomic correspondences are based on "core" gene expression programs that underlie cell type identity rather than maturation-associated genes." Could the authors explain the relevance of using a third model and, more importantly, is there any genes that eliminated through the procedure that could be important to drive the diversification process? If so, would it be possible to estimate their number and the relative impact?
The rationale for this was as follows. Our goal is to map cells from one time point to a type at another time point. The naïve way to do this would be to use a classifier trained entirely at either of the time point. However, the features of such a classifier is likely to contain genes that are not expressed at the earlier time point, and likely to generate spurious mappings (since the set of cluster specific genes are not identical). Therefore, we sought to train a classifier that is trained using genes that are part of conserved transcriptional signatures at both time points, which corresponds to the third model.
When this filtering was not performed, the temporal correspondences in the supervised classification model were less specific than those reported. In particular, ARI values dropped by about 15% on average. The simple reason for this is that a cluster specific gene at E13 (for e.g.) may no longer be expressed at E14, and vice-versa. Thus, by restricting the features to a common set of cluster specific genes, we obtained the “best possible” transcriptomic correspondences between clusters at consecutive time points. We note that the correspondences obtained in this way (Figure 3) were recovered through WOT when the results of the latter were collapsed at the cluster level (Supplementary Fig. 5).
*Methods page 15: Inference of ipsilaterally-projecting RGC types. Wouldn't it be more valuable to consider more markers to distinguish RGC precursors?
As indicated before, we used I-RGC genes and C-RGC genes reported in Wang et al., 2016 (Table 2), in addition to the well-known markers Zic2 and Isl2. Here, we prioritized genes that had been histologically validated (Figs. 4 and 5), which were expressed in our data (Sema3e and Tbx20 were not considered as these undetectable at E13 in our data). Following the reviewer’s earlier suggestion, we also noted that including Ephb1 in our signature minimally impacts the results.
Discussion: *Is there somewhat a plasticity that allow the RGC subgroups to switch over time? (IF we were to record the transcriptome of the same cell over time, will one observe that the cell belong to another cluster / subgroup?
One can only speculate. Other than long-term in vivo imaging combined with vital type-specific markers we know of no way to experimentally address the possibility that cells swap types postnatally so that the cells comprising type x at P5 are not the same ones that comprise type x at P56. It does seem pretty unlikely though.
*While the data appears technically rigorous, and the number of cells sequenced very high, the results seem redundant with several prior studies and the discrepancies are not sufficiently discussed.
We are confused by this point, since the reviewer does not cite the papers to which s/he refers. To our knowledge there is no study at present that has described RGC diversification, so it is not clear what would be discrepant.
-
Evaluation Summary:
This study using single cell RNA Seq to profile developing retinal ganglion cells from embryonic and postnatal mouse retina explores the diversification of this class of neurons into specific subtypes. The computational approaches developed identify groups of RGC precursors with largely non-overlapping fates, distinguished by selectively expressed transcription factors that could act as fate determinants. The aim is to show that over time, clusters of cells become "decoupled" as they split into subclusters, and this process is associated with changes in the expression of specific transcription factors. This leads to the proposal that subtype diversification arises as a gradual, asynchronous fate restriction of postmitotic multipotential precursors. These findings enable the prediction of lineage relationships among …
Evaluation Summary:
This study using single cell RNA Seq to profile developing retinal ganglion cells from embryonic and postnatal mouse retina explores the diversification of this class of neurons into specific subtypes. The computational approaches developed identify groups of RGC precursors with largely non-overlapping fates, distinguished by selectively expressed transcription factors that could act as fate determinants. The aim is to show that over time, clusters of cells become "decoupled" as they split into subclusters, and this process is associated with changes in the expression of specific transcription factors. This leads to the proposal that subtype diversification arises as a gradual, asynchronous fate restriction of postmitotic multipotential precursors. These findings enable the prediction of lineage relationships among RGC subtypes and the developmental time when these specification events occur, and should be of great interest to the developmental neurobiology community.
(This preprint has been reviewed by eLife. We include the public reviews from the reviewers here; the authors also receive private feedback with suggested changes to the manuscript. Reviewer #1 agreed to share their name with the authors.)
-
Reviewer #1 (Public Review):
In this report, Shekhar et al, have profiled developing retinal ganglion cells from embryonic and postnatal mouse retina to explore the diversification of this class of neurons into specific subtypes. In mature retina, scRNAseq and other methods have defined approximately 45 different subtypes of RGCs, and the authors ask whether these arise from a common postmitotic precursor, or many ditinct subtypes of precursors. The overall message, is that subtype diversification arises as a "gradual, asynchronus fate restriction of postmitotic multipotential precursors. The authors find that over time, clusters of cells become "decoupled" as they split into subclusters. This process of fate decoupling is associated with changes in the expression of specific transcription factors. This allows them to both predict …
Reviewer #1 (Public Review):
In this report, Shekhar et al, have profiled developing retinal ganglion cells from embryonic and postnatal mouse retina to explore the diversification of this class of neurons into specific subtypes. In mature retina, scRNAseq and other methods have defined approximately 45 different subtypes of RGCs, and the authors ask whether these arise from a common postmitotic precursor, or many ditinct subtypes of precursors. The overall message, is that subtype diversification arises as a "gradual, asynchronus fate restriction of postmitotic multipotential precursors. The authors find that over time, clusters of cells become "decoupled" as they split into subclusters. This process of fate decoupling is associated with changes in the expression of specific transcription factors. This allows them to both predict lineage relationships among RGC subtypes and the time during development when these specification events occur. Although this conclusion based almost entirely on a computational analysis of the relationships among cells sampled at discrete times, the evidence presented supports the overall conclusion. Future experimental validation of the proposed lineage relationships of RGC subtypes will be needed, but this report clearly outlines the overall pattern of diversification in this cell class.
-
Reviewer #2 (Public Review):
The manuscript "Diversification of multipotential postmitotic mouse retinal ganglion cell precursors into discrete types" by Shekhar and colleagues represents an in-depth analysis of an additional transcriptomic datasets of retinal single-cells. It explores the progression of retinal ganglion cells diversity during development and describes some of aspects of fate acquisition in these postmitotic neurons. Altogether the findings provide another resource on which the neural development community will be able to generate new hypotheses in the field of retinal ganglion cell differentiation. A key point that is made by the authors regards the progression of the number of ganglion cell types in the mouse retina, i.e., how, and when neuronal "classes diversify into subclasses and types" (also p. 125). In …
Reviewer #2 (Public Review):
The manuscript "Diversification of multipotential postmitotic mouse retinal ganglion cell precursors into discrete types" by Shekhar and colleagues represents an in-depth analysis of an additional transcriptomic datasets of retinal single-cells. It explores the progression of retinal ganglion cells diversity during development and describes some of aspects of fate acquisition in these postmitotic neurons. Altogether the findings provide another resource on which the neural development community will be able to generate new hypotheses in the field of retinal ganglion cell differentiation. A key point that is made by the authors regards the progression of the number of ganglion cell types in the mouse retina, i.e., how, and when neuronal "classes diversify into subclasses and types" (also p. 125). In particular, the authors would like to address whether postmitotic neurons follow either a predetermination or a stepwise progression (Fig. 2a). This is indeed a fascinating question, and the analysis, including the one based on the Waddington-OT method is conceptually interesting.
Comments and questions:
>Is the transcriptomic diversity, based on highly variable genes (the number of which is not detailed in the study) a robust proxy to assess cell types? One could argue that early on predetermined cell types are specified by a small set of determinants, both at the proteomic and transcriptomic level, and that it takes several days or week to generate the cascade that allows the detection of transcriptional diversity at the level of >100 gene expression levels.
> Since there are many RGC subsets (45) that share a great number of their gene expression, is it possible that a given RGC could transition from one subset to another between P5 and P56? Or even responding to a state linked to sustained activity? Was this possibility tested in the model?
> The authors state that early during development there is less diversity than later. This statement seems obvious but how much. Can this be due to differential differentiation stage? At E16 RGC are a mix of cells born from E11 to E16, with the latter barely located in the GCL. Does this tend to show a continuum that is may be probably lost when the analysis is performed on cells isolated a long time after they were born (postnatal stages)? Alternatively, would it be possible to compare RGC that have been label with birth dating methods?
> Comparing data produced by different methods can be challenging. Here the authors compared transcriptomic diversity between embryonic dataset produced with 10X genomics (E13 to P0) and, on the other hand, postnatal P5 that were produced using a different drop-seq procedure). Is it possible to control that the differences observed are not due to the different methods?
> It might be important to control the conclusion that diversity is lower at E13 vs P5 when we see that thrice less cells (5900 vs 180000) were analyzed at early stage (BrdU, EdU, CFSE...)? A simple downsampling prior to the analysis may help.
> Ipsilateral RGC: It is striking that the DEG between C-RGC and I-RGC reflect a strong bias with cells scored as" ipsi" are immature RGC while the other ("contra") are much more mature. This bias comes from the way ipsilateral RGC were "inferred" using non-specific markers. Can the author try again the analysis by identifying RGC using more robust markers? (eg. EphB1). Would it be possible to select I-RGC and C-RGC that share same level of differentiation? Previous studies already identified I-RGC signature using more specific set-up (Wang et al., 2016 from retrogradely labelled RGC; Lo Giudice et al., 2019 with I-RGC specific transgenic mouse).
> It would be important to discuss how their findings differs from the others (including Rheaume et al., 2018). To make a strong point, I-RGC shall be isolated at a stage of final maturation (P5?) and using retrograde labelling, which is a robust method to ensure the ipsilateral identity of postnatal RGCs.
> It is unclear how good Zic1 and Igf1 can be used as I-RGC marker. Can the author specify how specific to I-RGC they are? Have they been confirmed as marker using retrograde labelling experiments?
> The enrichment procedure may deplete the RGC subpopulation that express low levels of Thy1 or L1CAM. A comparison on that point could be done with the other datasets analysed in the study.
> In supplemental Fig. S1e: why are cells embedded from "Clark" datasets only clusters on the right side of the UMAP while the others are more evenly distributed?
> What could explain that CD90 and L1CAM population are intermingled at E14, distinct at E16, and then more mixed at P0?
> On Fig. 6: the E13 RGC seems to be segregated in early born RGC expressing Eomes and later born expressing neurod2. Thus, fare coupling with P5 seems to suggest that Eomes population at P5 may have been generated first, and Neurod2 generated later. Is that possible?
> Methods:
The Methods section is extensive, and yet it is presented in a rather complex manner so that it is difficult to understand for a broad audience. It would be valuable if the authors could simplify or better explain some parts (the WOT section in particular).
*Highly variable genes (HVG) used for clustering and dimensionality reduction: how many of them and what are they? Are they the same used for each stage?
*In the methods p9: "The common features G = GR ∩ GT are used to train a third classifier ClassR on the reference atlas AR. This ensures that inferred transcriptomic correspondences are based on "core" gene expression programs that underlie cell type identity rather than maturation-associated genes." Could the authors explain the relevance of using a third model and, more importantly, is there any genes that eliminated through the procedure that could be important to drive the diversification process? If so, would it be possible to estimate their number and the relative impact?
*Methods page 15: Inference of ipsilaterally-projecting RGC types. Wouldn't it be more valuable to consider more markers to distinguish RGC precursors?> Discussion:
*Is there somewhat a plasticity that allow the RGC subgroups to switch over time? (IF we were to record the transcriptome of the same cell over time, will one observe that the cell belong to another cluster / subgroup?
*While the data appears technically rigorous, and the number of cells sequenced very high, the results seem redundant with several prior studies and the discrepancies are not sufficiently discussed. -
