Decoding spine nanostructure in cultured neurons derived from mouse models of mental disorder reveals a schizophrenia-linked role for Ecrg4
Curation statements for this article:-
Curated by eLife

eLife Assessment
By investigating spine nanostructure and dynamics across multiple genetic mouse models for neurodevelopmental disorders, this important study has the potential to uncover convergent or divergent synaptic phenotypes that may be specifically associated with autism versus schizophrenia risk. The imaging and overall breadth of the methods are convincing. The purely in vitro nature of the study slightly limits the generalisability of the findings.
This article has been Reviewed by the following groups
Discuss this preprint
Start a discussion What are Sciety discussions?Listed in
- Evaluated articles (eLife)
Abstract
Dendritic spine dysfunction may contribute to the etiology and symptom expression of neuropsychiatric disorders. The intimate relationship between spine morphology and function suggests that decoding disease-related abnormalities from spine morphology can aid in developing synapse-targeted interventions. Here, we describe a population analysis of dendritic spine nanostructure applied to the objective grouping of multiple mouse models of neuropsychiatric disorders. This method has identified two major groups of spine phenotypes linked to schizophrenia and autism spectrum disorder (ASD). An increase in spine subpopulation with small volumes characterized the spines of schizophrenia-associated mouse models, whereas a spine subset with large volumes increased in ASD models. Schizophrenia-associated mouse models showed higher similarity in spine morphology, driven by reduced size and growth of nascent spines. The expression of Ecrg4, a gene encoding small secretory peptides, was increased in schizophrenia-associated mouse models, and functional studies confirmed its critical involvement in impaired spine dynamics and shape. These results suggest that population-level spine analysis provides rich insights into heterogeneous spine pathology, facilitating the identification of new molecular targets related to core synaptic dysfunction.
Article activity feed
-

-
-

eLife Assessment
By investigating spine nanostructure and dynamics across multiple genetic mouse models for neurodevelopmental disorders, this important study has the potential to uncover convergent or divergent synaptic phenotypes that may be specifically associated with autism versus schizophrenia risk. The imaging and overall breadth of the methods are convincing. The purely in vitro nature of the study slightly limits the generalisability of the findings.
-
Reviewer #1 (Public review):
Summary:
Kashiwagi et al. undertook a population analysis of dendritic spine nanostructure applied to the objective grouping of 8 mouse models of neuropsychiatric disorders. They report that spine morphology in cultured hippocampal neurons shows a higher similarity among schizophrenia mouse models (compared with autism spectrum disorder (ASD) mouse models) and identify an effect of Ecrg4 (encoding small secretory peptides) on spine dynamics and shape in these models.
Strengths:
The study developed a method for objectively comparing spine properties in primary hippocampal neuron cultures from 8 mouse models of psychiatric disorders at the population level using high-resolution structured illumination microscopy (SIM) imaging. This novel technique identified two distinct groups of mouse models according to the …
Reviewer #1 (Public review):
Summary:
Kashiwagi et al. undertook a population analysis of dendritic spine nanostructure applied to the objective grouping of 8 mouse models of neuropsychiatric disorders. They report that spine morphology in cultured hippocampal neurons shows a higher similarity among schizophrenia mouse models (compared with autism spectrum disorder (ASD) mouse models) and identify an effect of Ecrg4 (encoding small secretory peptides) on spine dynamics and shape in these models.
Strengths:
The study developed a method for objectively comparing spine properties in primary hippocampal neuron cultures from 8 mouse models of psychiatric disorders at the population level using high-resolution structured illumination microscopy (SIM) imaging. This novel technique identified two distinct groups of mouse models according to the population-level spine properties: those with ASD-related gene mutations and those with schizophrenia-related gene mutations. Functional studies, including gene knockdown and overexpression experiments, identified an effect of Ecrg4 on the spine phenotype of the schizophrenia model mice.
Weaknesses:
The main weakness is that the study is wholly in vitro, using cultured hippocampal neurons. The authors present this as an advantage, however, arguing that spine morphology as measured in a reduced culture system can demonstrate direct effects of gene mutations on neuronal phenotypes in the absence of indirect influences from nonneuronal cells or specific environments.
-
Reviewer #2 (Public review):
Okabe and colleagues build on a super-resolution-based technique they have previously developed in cultured hippocampal neurons, improving the pipeline and using it to analyze spine nanostructure differences across 8 different mouse lines with mutations in autism or schizophrenia (Sz) risk genes/pathways. It is a worthy goal to try to use multiple models to examine potential convergent (or not) phenotypes, and the authors have made a good selection of models. They identify some key differences between the autism versus the Sz risk gene models, primarily that dendritic spines are smaller in Sz models and (mostly) larger in autism risk gene models. They then focus on three models (2 Sz - 22q11.2 deletion, Setd1a; 1 ASD - Nlgn3) for timelapse imaging of spine dynamics, and together with computational modelling …
Reviewer #2 (Public review):
Okabe and colleagues build on a super-resolution-based technique they have previously developed in cultured hippocampal neurons, improving the pipeline and using it to analyze spine nanostructure differences across 8 different mouse lines with mutations in autism or schizophrenia (Sz) risk genes/pathways. It is a worthy goal to try to use multiple models to examine potential convergent (or not) phenotypes, and the authors have made a good selection of models. They identify some key differences between the autism versus the Sz risk gene models, primarily that dendritic spines are smaller in Sz models and (mostly) larger in autism risk gene models. They then focus on three models (2 Sz - 22q11.2 deletion, Setd1a; 1 ASD - Nlgn3) for timelapse imaging of spine dynamics, and together with computational modelling provide a mechanistic rationale for the smaller spines in Sz risk models. Bulk RNA sequencing of all 8 model cultures identifies several differentially expressed genes which they go on to test in cultures, finding that ecgr4 is upregulated in several Sz models and its misexpression recapitulates spine dynamics changes seen in the Sz mutants, while knockdown rescues spine dynamics changes in the Sz mutants. Overall, these have the potential to be very interesting findings and useful for the field. My major concerns from the initial manuscript, especially regarding cherry picking and circularity have been addressed with revised analytical approaches. I have some remaining minor comments.
(1) The comparison between two wild-type samples versus wild-type-mutant samples is helpful - I think this could be added to the manuscript.
(2) For results of timelapse imaging - please spell out in the results section the direction of change (lines 270 - 277).
(3) Using linear mixed effect models for statistical analysis is a significant improvement. While a sample size (n) of mice = 3 is not ideal, I think given the multiple different mouse lines used and intensity of analysis, this is probably the best that can be done, although further validation in larger samples eventually is to be hoped for.
(4) The revised text is much improved, but I still think the authors should be upfront somewhere in the text that the schizophrenia-associated genes can only confer biased risk for schizophrenia (and that the clinical phenotype can also include autism). As I said before, I think this is the best we can do and I agree with their choices, but it is important not to overstate the link. The differences they see make it clear that these are still relevant distinctions.
-
Author response:
The following is the authors’ response to the original reviews.
Public Reviews:
Reviewer #1 (Public review):
Summary:
Kashiwagi et al. undertook a population analysis of dendritic spine nanostructure applied to the objective grouping of 8 mouse models of neuropsychiatric disorders. They report that spine morphology in cultured hippocampal neurons shows a higher similarity among schizophrenia mouse models (compared with autism spectrum disorder (ASD) mouse models), and identify an effect of Ecrg4 (encoding small secretory peptides) on spine dynamics and shape in these models.
Strengths:
The study developed a method for objectively comparing spine properties in primary hippocampal neuron cultures from 8 mouse models of psychiatric disorders at the population level using high-resolution structured illumination microscopy …
Author response:
The following is the authors’ response to the original reviews.
Public Reviews:
Reviewer #1 (Public review):
Summary:
Kashiwagi et al. undertook a population analysis of dendritic spine nanostructure applied to the objective grouping of 8 mouse models of neuropsychiatric disorders. They report that spine morphology in cultured hippocampal neurons shows a higher similarity among schizophrenia mouse models (compared with autism spectrum disorder (ASD) mouse models), and identify an effect of Ecrg4 (encoding small secretory peptides) on spine dynamics and shape in these models.
Strengths:
The study developed a method for objectively comparing spine properties in primary hippocampal neuron cultures from 8 mouse models of psychiatric disorders at the population level using high-resolution structured illumination microscopy (SIM) imaging. This novel technique identified two distinct groups of mouse models according to the population-level spine properties: those with ASD-related gene mutations and those with schizophreniarelated gene mutations. Functional studies, including gene knockdown and overexpression experiments, identified an effect of Ecrg4 on the spine phenotype of the schizophrenia model mice.
We thank the reviewer for finding our strategy novel and useful for identifying molecules associated with the spine phenotype in schizophrenia-related mouse models.
Weaknesses:
The main weakness is that the study is wholly in vitro, using cultured hippocampal neurons. The authors present this as an advantage, however, arguing that spine morphology as measured in a reduced culture system can demonstrate direct effects of gene mutations on neuronal phenotypes in the absence of indirect influences from non-neuronal cells or specific environments.
We appreciate this reviewer's concern about the limitation of cultured hippocampal neurons in extracting disease-related spine phenotypes. While we fully recognize this limitation, we consider that this in vitro system has several advantages that contribute to translational research on mental disorders.
First, our culture system has been shown to support the development of spine morphology similar to that of the hippocampal CA1 excitatory synapse in vivo. High-resolution imaging techniques confirmed that the in vitro spine structure was highly preserved compared with in vivo preparations (Kashiwagi et al., Nature Communications, 2019). The present study used the same culture system and SIM imaging. Therefore, the difference we detected in samples derived from disease models is likely to reflect impairment of molecular mechanisms underlying native structural development in vivo.
Second, super-resolution imaging of thousands of spines in tissue preparations under precisely controlled conditions cannot be practically applied using currently available techniques. The advantage of our imaging and analytical pipeline is its reproducibility, which enabled us to compare the spine population data from eight different mouse models without normalization.
Third, a reduced culture system can demonstrate the direct effects of gene mutations on synapse phenotypes, independent of environmental influences. This property is highly advantageous for screening chemical compounds that rescue spine phenotypes. Neuronal firing patterns and receptor functions can also be easily controlled in a culture system. The difference in spine structure between ASD- and schizophrenia-related mouse models is valuable information to establish a drug screening system.
Fourth, establishing an in vitro system for evaluating synapse phenotypes could reduce the need for animal experiments. Researchers should be aware of the 3Rs principles. In the future, combined with differentiation techniques for human iPS cells, our in vitro approach will enable the evaluation of disease-related spine phenotypes without the need for animal experiments. The effort to establish a reliable culture system should not be eliminated.
We modified our text to have a balanced discussion on both advantages and disadvantages of the in vitro culture system in the study of mental disorder mouse models, as follows:
"Finally, while the spine phenotype identified in the human postmortem brain undoubtedly resulted from complex interactions among genetic background, environmental influences, and regulation by non-neuronal cells, data from pure neuronal cultures are more likely to reflect the direct effects of schizophrenia-related gene mutations on synaptic functions. This property may be advantageous for identifying synaptic molecules that regulate synapse phenotypes in schizophrenia-related mouse models. However, the phenotype observed in the culture system requires confirmation using in vivo experiments of mouse models or human tissue samples. Efficient in vitro screening combined with reliable in vivo evaluation of synapses will facilitate translational research on mental disorders."
Another weakness is that CaMKIIαK42R/K42R mutant mice are presented as a schizophrenia model, the authors justifying this by saying that "CaMKII-related signaling pathway disruption has been implicated in the working memory deficits found in schizophrenia patients". Since mutations in CAMK2A cause autosomal dominant intellectual developmental disorder-53 (OMIM 617798) and autosomal recessive intellectual developmental disorder-63 (OMIM 618095), and mice carrying the CAMK2A E183V mutation exhibit ASD-related synaptic and behavioral phenotypes (PMID: 28130356), I think it's stretching credibility to refer to the CaMKIIαK42R/K42R mice as a schizophrenia model.
We agree with this reviewer that CAMK2A mutations in humans are linked to multiple mental disorders, including developmental disorders, ASD, and schizophrenia. Association of gene mutations with the categories of mental disorders is not straightforward, as the symptoms of these disorders also overlap with each other. For the CaMKIIα K42R/K42R mutant, we considered the following points in its characterization as a model of mental disorder. Analysis of CaMKIIα +/- mice in Dr. Tsuyoshi Miyakawa's lab has provided evidence for the reduced CaMKIIα in schizophrenia-related phenotypes (Yamasaki et al., Mol Brain 2008; Frankland et al., Mol Brain Editorial 2008). It is also known that the CaMKIIα R8H mutation in the kinase domain is linked to schizophrenia (Brown et al., 2021). Both CaMKIIα R8H and CaMKIIα K42R mutations are located in the N-terminal domain and eliminate kinase activity. On the other hand, the representative CaMKIIα E183V mutation identified in ASD patients exhibits unique characteristics, including reduced kinase activity, decreased protein stability and expression levels, and disrupted interactions with ASD-associated proteins such as Shank3 (Stephenson et al., 2017). Importantly, reduced dendritic spines in neurons expressing CaMKIIα E183V is a property opposite to that of the CaMKIIα K42R/K42R mutant, which showed increased spine density (Koeberle et al. 2017).
References related to this discussion.
(1) Yamasaki et al., Mol Brain. 2008 DOI: 10.1186/1756-6606-1-6
(2) Frankland et al. Mol Brain. 2008 DOI: 10.1186/1756-6606-1-5
(3) Stephenson et al., J Neurosci. 2017 DOI: 10.1523/JNEUROSCI.2068-16.2017
(4) Koeberle et al. Sci Rep. 2017 DOI: 10.1038/s41598-017-13728-y
(5) Brown et al., iScience. 2021 DOI: 10.1016/j.isci.2021.103184
We fully agree with the reviewer that different CAMK2A mutations likely cause distinct phenotypes observed in the broad spectrum of mental disorders. In the revised manuscript, we include a discussion of the relevant literature to categorize this mouse model appropriately.
"CaMKII-related signaling pathway disruption has been implicated in the working memory deficits found in schizophrenia patients [45,46]. CAMK2A mutations in humans are linked to multiple mental disorders, including developmental disorders, ASD, and schizophrenia [47]. The K42R mutation of CAMK2A does not correspond to any known human genetic variant, but the CAMK2A R8H mutation is linked to schizophrenia [48]. Both R8H and K42R mutations in the N-terminal domain of CaMKIIα eliminate kinase activity; these mutations may have a similar impact on human mental disorders."
Although the manuscript is largely well written, there are some instances of ambiguous/unspecific language. This extends to the title (Decoding Spine Nanostructure in Mental Disorders Reveals a Schizophrenia-1 Linked Role for Ecrg4), which gives no indication that the work was in vitro on cultured neurons derived from mouse models.
We appreciate the reviewer for pointing out the lack of information about the experimental system in the title of this manuscript. According to the suggestion of the reviewer, we modified the title as "Decoding spine nanostructure in cultured neurons derived from mouse models of mental disorder reveals a schizophrenia-linked role for Ecrg4".
Reviewer #2 (Public review):
Okabe and colleagues build on a super-resolution-based technique that they have previously developed in cultured hippocampal neurons, improving the pipeline and using it to analyze spine nanostructure differences across 8 different mouse lines with mutations in autism or schizophrenia (Sz) risk genes/pathways. It is a worthy goal to try to use multiple models to examine potential convergent (or not) phenotypes, and the authors have made a good selection of models. They identify some key differences between the autism versus the Sz risk gene models, primarily that dendritic spines are smaller in Sz models and (mostly) larger in autism risk gene models. They then focus on three models (2 Sz - 22q11.2 deletion, Setd1a; 1 ASD - Nlgn3) for time-lapse imaging of spine dynamics, and together with computational modelling provide a mechanistic rationale for the smaller spines in Sz risk models. Bulk RNA sequencing of all 8 model cultures identifies several differentially expressed genes, which they go on to test in cultures, finding that ecgr4 is upregulated in several Sz models and its misexpression recapitulates spine dynamics changes seen in the Sz mutants, while knockdown rescues spine dynamics changes in the Sz mutants. Overall, these have the potential to be very interesting findings and useful for the field. However, I do have a number of major concerns.
We thank the reviewer for evaluating our findings as potentially very interesting and useful.
(1) The main finding of spine nanostructure changes is done by carrying out a PCA on various structural parameters, creating spine density plots across PC1 and PC2, and then subtracting the WT density plot from the mutant. Then, spines in the areas with obvious differences only are analyzed, from which they derive the finding that, for example, spine sizes are smaller. However, this seems a circular approach. It is like first identifying where there might be a difference in the data, then only analyzing that part of the data. I welcome input from a statistician, but to me, this is at best unconventional and potentially misleading. I assume the overall means are not different (although this should be included), but could they look at the distribution of sizes and see if these are shifted?
We appreciate the reviewer's concern regarding our analysis of spine population data. The intention of pre-selecting the areas showing differences between wild-type and mutant was to make a direct comparison between two subareas (one is enriched with wild-type spines and the other is enriched with mutant spines) and clarify that the spines of schizophreniarelated mouse models were smaller than wild-type spines. Conventional methods of comparing the total spine population using simple size parameters are not useful for this purpose, as shown in Supplementary Figure 2.
To clarify the reviewer's concern, we revised the analysis of the spine population data for both Figure 3 and Figure 8.
Figure 3: We first divided the feature space projected onto PC1 and PC2 into four areas with distinct structural properties: (1) small and short, (2) small and long, (3) large and short, and (4) large and long. Next, we calculated the normalized spine counts in the four areas for both wild-type and mutant spines and obtained the relative ratio (mutant/wild-type) for each area. As we performed three independent SIM imaging experiments (in one, we imaged both wild type and mutant culture dishes prepared from the same pregnant mouse), there are three independent datasets from 8 mouse models.
We found that the spine ratio (mutant/wild-type) only in area 2 (small and long spines) differed significantly between genotypes. This result is shown in Fig. 3 and explained in the text. The spine ratios in areas 1 and 3 did not show a clear relationship to the genotypes, while the ratio in area 4 showed the opposite trend to that in area 2. The opposite trend between areas 2 and 4 indicates enrichment of both small and long spines in schizophrenia-related mouse models, consistent with our previous analysis.
Figure 8: In this analysis, we aimed to evaluate the rescue effect of Ecrg4 shRNA relative to that of control shRNA. If Ecrg4 shRNA is effective, the spine population enriched in the control shRNA condition should be reduced in the Ecrg4 shRNA condition. To confirm this point in the revised manuscript, we first defined areas in the projected PC1-PC2 plane showing either enrichment or depletion of spines in the control shRNA condition (spine numbers increasing or decreasing by more than 3 × SD). We next measured the difference in spine numbers between the control and Ecrg4 shRNA conditions in either enriched or depleted areas. The expectation is that Ecrg4 shRNA treatment reduces the extent of both enrichment and depletion. The effect was significant in both the 22qdel and Setd1a mouse models, as indicated by permutation tests. This analysis was explained in the revised manuscript.
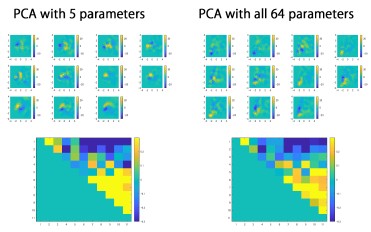
(2) Despite extracting 64 parameters describing spine structure, only 5 of these seemed to be used for the PCA. It should be possible to use all parameters and show the same results. More information on PC1 and PC2 would be helpful, given that the rest of the paper is based on these - what features are they related to?
We thank the reviewer for the advice on providing the rationale for parameter selection in PCA. We divided spines into 160-nm segments along their long axis, and the spine segments were used to calculate the 64 parameters, which include volume of each spine segment (20 segments), convex hull volume of each spine segment (20 segments), and convex hull ratio of each spine segment (20 segments). As most spines are shorter than 0.16 × 20 =3.2 μm, these segment-related parameters contain a large fraction of zero values, which affect the proper calculation of principal components. Therefore, we selected two parameters that reflect the principal structural features (length and volume), together with three other parameters that were mutually independent and also independent from the first two parameters (pairwise correlation coefficients < 0.3). These selection criteria were described in the original manuscript. We also confirmed that PCA using all 64 parameters yields a cross correlation map similar to that shown in Fig. 2B.
Author response image 1.
We provided additional information in the Materials and Methods section of the revised manuscript.
As described previously, the pattern of four areas with distinct spine structures (1. small and short, 2. small and long, 3. large and short, 4. large and long) supports the idea that the PC1PC2 plane reflects the relationship between spine volume and length (Fig. 3A and B).
These specific features could then be analyzed in the full dataset, without doing the cherry picking above.
We provided the dataset for the relative enrichment of spine counts across four areas of the PC1-PC2 plane in Fig. 3A and B. This analysis provides a comprehensive view of spine population properties related to spine volume and length, without relying on a pre-set region of interest.
It would also be helpful to demonstrate whether PC1 and 2 differ across groups - for example, the authors could break their WT data into 2 subsets and repeat the analysis.
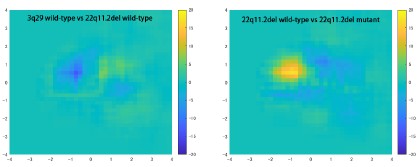
We noticed differences in the pattern of spine distribution across the PC1-PC2 planes in each experiment. The subtraction of the distributional data between wild-type and mutant samples effectively cancels out such differences. In general, the difference between two wild-type samples is smaller than that between wild-type and mutant samples, as shown in Author response image 2.
Author response image 2.
We added a description of variation across groups to the revised manuscript.
(3) Throughout the paper, the 'n' used for statistical analysis is often spine, which is not appropriate. At a minimum, cell should be used, but ideally a nested mixed model, which would take into account factors like cell, culture, and animal, would be preferable. Also, all of these factors should be listed, with sufficient independent cultures.
We agree that nested mixed models are more appropriate for evaluating genotype effects in most of our datasets. We confirm that the results of statistical analysis using nested mixed models were consistent with our previous conclusions in most cases.
Figure 3: We performed three independent primary cultures of embryonic hippocampal tissue with genotypes of both wild-type and mutant from the same pregnant mice for each mouse model. In our new Figure 3, each data point represents an independent culture experiment, and group comparisons were performed using one-way ANOVA followed by Tukey's post hoc test. In this analysis, statistical analysis using neurons as units of 'n' is not possible, as the number of spines measured from a single neuron is insufficient to generate the density map shown in Figure 3. The statistical analysis was described in the revised text. The details of experimental conditions related to Figure 3 are provided in Supplementary Table 1.
Figure 5A-C: We analyzed spine turnover rate using a linear mixed-effects model with genotype as a fixed effect and plate, cell, and dendrite as nested random effects. In both 22q deletion model and Setd1a model, there were significant effects of genotype (F(1,25) = 5.79, p = 0.024 for 22q deletion model and F(1,22) = 7.33, p = 0.013 for Setd1a model). In contrast, Nlgn3 mutant neurons did not show a significant difference (F(1,14) = 1.35, p = 0.26). This analysis was described in the revised text.
Figure 5D-F: Spine lifetime was analyzed using a linear mixed-effects model accounting for the hierarchical structure of the data (spines nested within dendrites, cells, and culture plates). The analysis revealed a significant effect of genotype in both 22q deletion mutant and Setd1a mutant (22qdel mutant; F(1,336) =5.33, p=0.022, Setd1a mutant; F(1,282)=6.38, p=0.012 ). The neurons of both mutants exhibited significantly longer spine lifetimes compared with wild-type neurons (22qdel mutant; ratio = 1.28, 95% CI 1.04–1.58, Setd1a mutant; ratio = 1.35, 95% CI 1.07–1.70). In contrast, Nlg3 mutation did not significantly alter spine lifetime (ratio = 0.86, 95% CI 0.61–1.22; F(1,220)=0.69, p=0.41). This analysis was described in the revised text.
Figure 5G-I: Spine volume trajectories were analyzed using linear mixed-effects models incorporating nested random effects (spine/dendrite/cell/culture plate) to account for the hierarchical structure of the data. In the 22q deletion model, newly formed spines were significantly smaller than those in wild-type neurons (genotype effect: p < 0.001). The spines in Setd1a mutant neurons also displayed significantly smaller volume than those in wild-type neurons (p < 10-7). There were also differences in the temporal profiles of spine growth in these two mutants (p < 0.001). In contrast, newly formed spines in the Nlgn3 mutant neurons were significantly larger than those in wild-type neurons (p < 10-4) with preserved time-course of spine growth. This analysis was described in the revised text.
Figure 5J-L: Similar analyses using linear mixed-effects models incorporating nested random effects (spine within dendrite within cell within culture plate) identified significantly smaller initial spine size in the 22q deletion model (p < 10⁻6), while no significant differences in the initial spine volume were found for Setd1a mutants. The temporal trajectories of spine shrinkage before their loss were also not significantly altered in both 22qdel and Setd1a mutants. The Nlg3 mutant showed a significantly different time-course of spine shrinkage (p < 0.05), while the initial spine size was not altered. This analysis was described in the revised text.
Figure 7A overexpression dataset: We analyzed plate-averaged lifetime values using a linear mixed-effects model with treatment as a fixed effect. There exists a significant main effect of treatment (F(3,8) = 4.59, p = 0.038), with post hoc examination showing a significant increase in lifetime by Ecrg4 overexpression (β = 0.49 ± 0.16 SE, t(8) = 3.16, p = 0.013). Figure 7A shRNA dataset: We also applied a linear mixed-effects model for plate-averaged lifetime values with treatment as a fixed effect. The analysis revealed no significant effect of treatment (F(2,6) = 0.29, p = 0.76).
The analyses of overexpression and shRNA datasets were described in the revised text.
Figure 8: As in Figure 3, we performed three independent primary cultures of embryonic hippocampal tissue with genotypes of both wild-type and mutant from the same pregnant mice for each mouse model. The culture plates were transfected with either a control shRNA or an Ecrg4 shRNA construct. Each data point represents an independent culture experiment, and the effect of Ecrg4 shRNA relative to that of control shRNA was evaluated using a permutation test. The data analysis was described in the revised text. The details of experimental conditions related to Figure 8 are provided in Supplementary Table 1.
(4) The authors should confirm that all mutants are also on the C57BL/6J background, and clarify whether control cultures are from littermates (this would be important). Also, are control versus mutant cultures done simultaneously? There can be significant batch effects with cultures.
The mutant mice we used in this study are on C57BL/6J or C57BL/6N background. It is known that C57BL/6J or C57BL/6N mice exhibit distinct phenotypes across a range of physiological, biochemical, and behavioral systems. However, it is less likely that our analysis is affected by differences between C57BL/6J and C57BL/6N, as we compared wild-type and mutant littermates on the same genetic background. This experimental design can also reduce the batch effects with different culture preparations. This point was described in the revised text.
(5) The spine analysis uses cultures from 18-22 DIV - this is quite a large range. It would be worth checking whether age is a confounder or correlated with any parameters / principal components.
We described in the method sections that culture samples were processed for imaging at 18-22 DIV. However, all the SIM imaging experiments for eight mutant mouse models were performed on samples fixed at DIV 19. The wide range of imaging experiments (DIV 18-22) includes test samples we used to optimize imaging conditions. In the revised manuscript, we specified the timing of SIM imaging.
(6) The computational modelling is interesting, but again, I am concerned about some circularity. Parameter optimization was used to identify the best fit model that replicated the spine turnover rates, so it is somewhat circular to say that this matched the observations when one of these is the turnover rate.
We appreciate the reviewer's comment on some circularity of the argument. We agree that the turnover rate is already incorporated into the simulation model and is not an appropriate criterion for the evaluation. We modified the text accordingly.
It is more convincing for spine density and size, but why not go back and test whether parameter differences are actually seen - for example, it would be possible to extract the probability of nascent spine loss, etc.
We thank the reviewer for giving this important suggestion. The probability of nascent spine loss is an important parameter, and we initially attempted to estimate it from the original data set. However, the upper limit of our time-lapse imaging is 24 h, which is insufficient to distinguish stable and nascent spines clearly. The difficulty of extracting all the necessary parameters for spine remodeling is our motivation for starting this computational modelling.
More compelling would be to repeat the experiments and see if the model still fits the data. In the interpretation (line 314-318) it is stated that '... reduced spine maturation rate can account for the three key properties of schizophrenia-related spines...', which is interesting if true, but it has just been stated that the probability of spine destabilization is also higher in mutants (line 303) - the authors should test whether if the latter is set to be the same as controls whether all the findings are replicated.
As suggested by the reviewer, we set the probability of spine destabilization equal across wild-type and mutant models and repeated the simulations. The results indicate that this modification has small effects on spine density (0.61 vs 0.62), spine turnover rate (0.22 vs 0.21), fraction of small spines (0.21 vs 0.20), and mean spine size (0.37 vs 0.36). We described this point in the revised manuscript.
(7) No validation for overexpression or knockdown is shown, although it is mentioned in the methods - please include.
As suggested by the reviewer, we validated overexpression and knockdown. The results are summarized in Supplementary Figure 8.
Supplementary Figure 8A-C shows the immunocytochemistry of anti-Ecrg4, anti-Cip4, and anti-NPAS4 for the confirmation of overexpression of these molecules.
Supplementary Figure 8D-E shows the confirmation of the appropriate size of exogenously expressed Ecrg4, Cip4, and NPAS4 by immunoblotting. (previous Supplementary Figure 10F is now Supplementary Figure 8E).
Supplementary Figure 8F-H indicates the efficient knockdown of exogenously expressed Met-GFP, ARHGAP15-GFP, and Ecrg4-HA by respective shRNA constructs in COS-7 cells. (previous Supplementary Figure 10G is now Supplementary Figure 8H)
Also, for the knockdown, a scrambled shRNA control would be preferable.
We used Stealth RNAi Negative Control Duplexes (Invitrogen) as the shRNA control in this study. To confirm that this RNAi sequence does not affect spine turnover, we performed timelapse imaging of neurons transfected with GFP alone or with GFP and the Stealth RNAi Negative Control. No detectable change in spine turnover was observed (Supplementary Figure 8I), indicating that this RNAi control sequence is suitable for our study.
(8) The finding regarding ecgr4 is interesting, but showing that some ecgr4 is expressed at boutons and spines and some in DCVs is not enough evidence to suggest that actively involved in the regulation of synapse formation and maturation (line 356).
To reveal the active roles of Ecrg4 in spine regulation, we exogenously applied a synthetic Ecrg4 peptide to wild-type neurons and monitored both spine density and turnover rate after Ecrg4 application. The Ecrg4 application increased the spine turnover rate, whereas samples treated with the scrambled peptide did not. This result supports the active role of Ecrg4 in regulating spine turnover. The data were added as Supplementary Figures 9F and G.
(9) The same caveats that apply to the analysis also apply to the ecgr4 rescue. In addition, while for 22q the control shRNA mutant vs WT looks vaguely like Figure 2, setd1a looks completely different.
We thank the reviewer for pointing out the apparent difference in the pattern of spine population data between Figure 2 and Figure 8. We performed SIM analysis using DiI-labeled neurons in Figure 2, whereas the data in Figure 8 are derived from GFP-expressing neurons. The images of cell-surface labeling and cytoplasmic labeling cannot be analyzed in the same way, as it is necessary to adjust parameters in SIM image processing and PCA-based dimensional reduction. Consequently, the distribution of the spine population projected onto the PC1-PC2 plane differs between DiI-labeled neurons and GFP-expressing neurons. To facilitate the comparison of PCA analysis applied to GFP-expressing neurons, we replaced the weight matrix for GFP-expressing neurons with that previously calculated for the DiIlabeled neurons. This adjustment increased the similarity of the data distributions shown in Figures 2 and 8. The explanation for the different patterns in the spine population map between Figure 2 and Figure 8 was added to the revised text. The related explanation for the data processing was described in the Materials and Methods.
And if rescued, surely shRNA in the mutant should now resemble control in WT, so there shouldn't be big differences, but in fact, there are just as many differences as comparing mutant vs wild-type? Plus, for spine features, they only compare mutant rescue with mutant control, but this is not ideal - something more like a 2-way ANOVA is really needed. Maybe input from a statistician might be useful here?
We appreciate the reviewer's important comment and agree that the analytical approach used in the original manuscript was not optimal. We therefore revised our analysis to examine whether the difference observed between wild-type and mutant neurons was reduced by suppression of Ecrg4 expression.
To this end, we first identified two regions in the PC1–PC2 plane where mutant spines were either enriched or depleted relative to wild-type neurons (Areas A and B). We then counted the number of spines located in Areas A and B in control shRNA-treated mutant neurons (normalized spine counts XA and XB). Next, we quantified spine counts in the same areas using data from Ecrg4-suppressed mutant neurons (normalized spine counts YA and YB). If XA > YA and XB < YB, suppression of Ecrg4 would indicate a shift toward rescue of the phenotype observed in control shRNA-treated mutant neurons. Indeed, the datasets were consistent with this shift in relative spine counts.
To determine whether these differences exceeded those expected from random variation in spine counts, we performed a permutation test. Specifically, spine identities were randomly shuffled between the two conditions while preserving the total number of spines in each dataset. The observed differences were then compared with the distribution obtained from the permuted datasets to assess statistical significance.
We found that all three culture replicates showed statistical significance in both areas A and B for both the 22qdel and Setd1a mutations. This analysis is described in the Result section.
(10) Although this is a study entirely focused on spine changes in mouse models for Sz, there is no discussion (or citation) of the various studies that have examined this in the literature. For example, for Setd1a, smaller spines or reduced spine densities have been described in various papers (Mukai et al, Neuron 2019; Chen et al, Sci Adv 2022; Nagahama et al, Cell Rep 2020).
We appreciate the reviewer's suggestion to include a discussion of schizophrenia-related mouse models. We added more information related to the Setd1a mouse model to the Discussion section.
"Population-level spine properties were more homogeneous in schizophrenia models (those with gene mutations implicated in schizophrenia) than in the other 4 models studied, in part due to a shared tendency for smaller spines. This observation is consistent with previous studies on Setd1a mutant mice, which showed reduced spine width, decreased mushroomtype spines, and lower spine density in the prefrontal cortex [43,56,57]. In contrast to these findings, several previous studies reported reduced numbers of small spines in the postmortem cortical tissues of schizophrenia patients [22,58]. "
(11) There is a conceptual problem with the models if being used to differentiate autism risk from Sz risk genes. It is difficult to find good mouse models for Sz, so the choice of 22q11.2del and Setd1a haploinsufficiency is completely reasonable. However, these are both syndromic. 22qdel syndrome involves multiple issues, including hearing loss, delayed development, and learning disabilities, and is associated with autism (20% have autism, as compared to 25% with Sz). Similarly, Setd1a is also strongly associated with autism as well as Sz (and also involves global developmental delay and intellectual disability). While I think this is still the best we can do, and it is reasonable to say that these models show biased risk for these developmental disorders, it definitely can't be used as an explanation for the higher variability seen in the autism risk models.
We appreciate the reviewer's suggestion for more careful consideration of the interpretation of phenotypes in mouse models, with regard to their relation to clinical phenotypes in human patients. According to the suggestion of the reviewer, we modified the relevant text as follows:
"The nanoscale features of dendritic spines in ASD-associated mouse models were more variable than those in schizophrenia-associated mouse models. This difference may be related to the broader clinical spectrum of ASD, which ranges from mild impairments in social skills to severe intellectual disability. The four ASD-associated mouse models examined in this study, Nlgn3R451C/(y or R451C) , Syngap1+/-, POGZQ1038R/+, and 15q11-13dup/+, may represent subgroups with different levels of hippocampal dysfunction. Among the four ASD-associated mouse models, 15q11-13dup/+ showed population-level spine properties closer to those of the schizophrenia models. To understand this similarity, further analysis of neural circuit changes in both ASD- and schizophrenia-associated mouse models will be necessary. Analysis of the relationships between rare genetic variants and synapse phenotypes in mouse models may contribute to their eventual categorization. This information should be useful to understand the underlying mechanisms of the broader clinical spectrum of ASD."
(12) I am not convinced that using dissociated cultures is 'more likely to reflect the direct impact of schizophrenia-related gene mutations on synaptic properties' - first, cultures do have non-neuronal cells, although here glial proliferation was arrested at 2 days, glia will be present with the protocol used (or if not, this needs demonstrating).
In our culture system, the density of non-neuronal cells is low, and most neurons are not in direct contact with non-neuronal cells. We reported this method in Nat. Neurosci. 1999, where we utilized this culture system to visualize GFP-tagged PSD-95 in neurons using recombinant adenovirus. Because recombinant adenovirus shows higher infection efficiency in glial cells, it was essential for us to establish a culture condition that isolates neurons from glial cells.
Second, activity levels will affect spine size, and activity patterns are very abnormal in dissociated cultures, so it is very possible that spine changes may not translate into in vivo scenarios. Overall, it is a weakness that the dissociated culture system has been used, which is not to say that it is not useful, and from a technical and practical perspective, there are good justifications.
We appreciate the reviewer's comment on the advantages and disadvantages of using an in vitro culture system. This comment aligns with the first reviewer's. We modified our text to have a balanced discussion on the role of the in vitro culture system in the study of mental disorder mouse models as follows:
"Finally, while the spine phenotype identified in the human postmortem brain undoubtedly resulted from complex interactions among genetic background, environmental influences, and regulation by non-neuronal cells, data from pure neuronal cultures are more likely to reflect the direct effects of schizophrenia-related gene mutations on synaptic functions. This property may be advantageous for identifying synaptic molecules that regulate synapse phenotypes in schizophrenia-related mouse models. However, the phenotype observed in the culture system requires confirmation using in vivo experiments of mouse models or human tissue samples. Efficient in vitro screening combined with reliable in vivo evaluation of synapses will facilitate translational research on mental disorders."
(13) As a minor comment, the spine time-lapse imaging is a strength of the paper. I wonder about the interpretation of Figure 5. For example, the results in Figure 5G and J look as if they may be more that the spines grow to a smaller size and start from a smaller size, rather than necessarily the rate of growth.
We thank the reviewer for the insightful comment. In the revised manuscript, we analyze the time-lapse data using linear mixed-effects models incorporating nested random effects (spine/dendrite/cell/culture plate). This analysis suggested the difference in the initial size of spines. This point is described in the revised manuscript as follows:
"Schizophrenia-associated mouse models showed higher similarity in spine morphology, driven by reduced size and growth of nascent spines."
"We further compared the initial increase in spine volume between genotypes (Figure 5G-I). Linear mixed-effects models incorporating nested random effects revealed significantly smaller initial spine volumes in both 22q11.2del/+ and Setd1a+/- models (genotype effect: p < 0.001 for 22q11.2del/+ and p < 10-7 for Setd1a+/-). The spines in both mutants also displayed a significant reduction in spine volume increase (p < 0.001). In contrast, newly formed spines in the Nlgn3R451C/(y or R451C) neurons were significantly larger than those in wild-type neurons (p < 10-4) with preserved time-course of spine growth.”
We tested whether the initial size difference in spines can be incorporated into the computational simulation. However, due to the large variability in the initial spine size, it was difficult to perform parameter optimization in the model with additional factors. Therefore, we did not further pursue this possibility in this revision. This point is described in the revised text.
Recommendations for the authors:
Reviewer #1 (Recommendations for the authors):
The manuscript would be strengthened if the following issues were adequately addressed:
(1) It would be helpful to know more about the in/ex vivo dendritic spine phenotype of the mouse models of neuropsychiatric disorders, to allow readers to judge whether and how the in vitro spine phenotype in hippocampal neuronal cultures overlaps with/replicates the spine phenotype within the mouse brain.
We appreciate this comment, but our currently available data is insufficient to specify the difference between in vitro and in vivo spine phenotypes. Our previous study, published in Nature. Comm. (2019), provided data showing that the overall distribution of spine size is similar between in vivo and in vitro conditions in the mouse hippocampus.
(2) Although the manuscript is largely well written, there are instances of ambiguous language, particularly when describing the spine phenotypes. For example, we are told that "ASD mouse models showed a tendency of decreasing spine subpopulation with small volumes." This description and other examples should be expressed more clearly.
Following the reviewer's suggestions, we revised the text to improve clarity. We modified the sentence "ASD mouse models showed a tendency of decreasing spine subpopulation with small volumes" to "ASD-related mouse models showed an opposite spine phenotype."To avoid possible confusion for readers, we have revised several sentences in the text to clarify the intended meaning.
Also, I question whether the word "decoding", meaning to convert (a coded message) into intelligible language, is the most appropriate for the title and abstract.
The original meaning of the word "decoding" is the conversion of a coded message into an intelligible form; however, in this study, we use the term in a broader sense, referring to the extraction of latent population-level properties of dendritic spines from multidimensional structural parameters. We believe this usage is consistent with its common use in neuroscience and systems biology, where "decoding" often refers to inferring underlying biological states or information from complex datasets.
(3) The authors should reconsider whether CaMKIIαK42R/K42R mice should be described as a schizophrenia model, when mutations in CAMK2A are known to cause autosomal dominant intellectual developmental disorder-53 (OMIM 617798) and autosomal recessive intellectual developmental disorder-63 (OMIM 618095), and mice carrying the CAMK2A E183V mutation exhibit ASD-related synaptic and behavioral phenotypes (PMID: 28130356).
We provided a detailed answer to this question in the previous part of the rebuttal.
(4) The title doesn't adequately summarise the contents of the manuscript. It should mention mice/mouse models and cultured neurons.
We also responded to this request in the previous part of the rebuttal.
Reviewer #2 (Recommendations for the authors):
(1) Please provide a supplementary table with all DEGs. Also, DEGs are listed if present in 'more than 2' models - does this mean they had to be in 3 or more? Please clarify.
According to the reviewer's suggestion, we added data on DEGs shared by >2 mouse models in Supplementary Figure 7. We also added Supplementary Tables 2 and 3 for all DEGs. The phrase "in more than 2 models" means "in 3 or 4 models".
(2) There are several references to 'schizophrenia mouse models' - it is worth rephrasing this to make clear that these are not mice with schizophrenia.
We replaced the expression "schizophrenia (or ASD) mouse models" with "schizophrenia (or ASD)-associated mouse models" or similar appropriate wording throughout the manuscript.
(3) Line 66: 'a recent...' - 2014 is not really recent.
We removed the word "recent" from the sentence.
(4) Figure S1: The legend says A-D, but they are not on the figure. Also, make clear whether this data is only WT data - it seems to be from disorder models, with 4 colors for each model - please clarify.
We changed the sentence from "shown as A to D" to "shown as A to C". The datasets in Supplementary Figure 1 are wild-type only. Each graph uses four colors to represent wildtype data from four imaging datasets obtained from different mouse models. Graphs A to C correspond to spine length, surface area, and volume, respectively.
(5) Methods, line 680-4: More detail here would be helpful.
We added more explanation for the generation of subtraction maps.
(6) Line 193: Make it clear this is hippocampal in the main text.
We added "cultures of embryonic hippocampi" to the text.
(7) Figure 5, D-F: Make clear that these are transient spines (as per main text)
We added "Lifetimes of transient spines" to both the main text and figure legend.
(8) Figure 6B: More detail is needed; no idea what this is - no axis label. D - also not clear what numbers on the y-axis mean. E - color scale??
We added details to the figure legend, the axis labels for Figures 6B and 6D, and the color scale for Figure 6E.
(9) Supplementary Figure 9 - not clear what matrices are actually showing, nor what the scale refers to - is this the number of shared DEGs? If so, please make it clearer.
The matrices show the shared DEG numbers, as shown in their titles. The scale indicates DEG numbers. We added the explanation of the color code to the figure legend.
(10) Please make clear in the main text that ecgr4 affected the turnover rate. It would be good to measure other parameters as well.
We added the phrase "a significant increase in spine turnover rate by Ecrg4 overexpression" to the main text.
(11) Figure 7: Suggest to label C on images as well, so obvious which is GFP/anti-HA overlay (and respective colors) and which is anti-HA staining.
We added the labels with respective colors to Figure 7.
(12) Ecgr4 is a precursor protein that is cleaved to produce several hormone-like peptides. Where is the HA tag - so which cleavage products will it label? Any antibodies that work in immunocytochem?
HA tag was attached to the C-terminal domain. We predict that anti-HA binds to four cleavage products (the full-length Ecrg4, Augurin, Argilin, and Δ16). Among several commercially available antibodies, only the SIGMA product could detect cells expressing Ecrg4-HA by immunocytochemistry.
(13) Supplementary Figure 10: Synaptosome would be a good addition.
We isolated the fraction of synaptosomes using Syn-PER™ Synaptic Protein Extraction Reagent in Supplementary Figure 9A. We added this explanation to the Materials and Methods section.
-
eLife Assessment
By investigating spine nanostructure and dynamics across multiple genetic mouse models for neurodevelopmental disorders, this important study has the potential to uncover convergent or divergent synaptic phenotypes that may be specifically associated with autism versus schizophrenia risk. While the imaging and breadth are impressive, there are potential methodological concerns, especially around statistical analyses, which render the evidence incomplete and should be addressed. The purely in vitro nature of the study also slightly limits the generalisability of the findings.
-
Reviewer #1 (Public review):
Summary:
Kashiwagi et al. undertook a population analysis of dendritic spine nanostructure applied to the objective grouping of 8 mouse models of neuropsychiatric disorders. They report that spine morphology in cultured hippocampal neurons shows a higher similarity among schizophrenia mouse models (compared with autism spectrum disorder (ASD) mouse models), and identify an effect of Ecrg4 (encoding small secretory peptides) on spine dynamics and shape in these models.
Strengths:
The study developed a method for objectively comparing spine properties in primary hippocampal neuron cultures from 8 mouse models of psychiatric disorders at the population level using high-resolution structured illumination microscopy (SIM) imaging. This novel technique identified two distinct groups of mouse models according to …
Reviewer #1 (Public review):
Summary:
Kashiwagi et al. undertook a population analysis of dendritic spine nanostructure applied to the objective grouping of 8 mouse models of neuropsychiatric disorders. They report that spine morphology in cultured hippocampal neurons shows a higher similarity among schizophrenia mouse models (compared with autism spectrum disorder (ASD) mouse models), and identify an effect of Ecrg4 (encoding small secretory peptides) on spine dynamics and shape in these models.
Strengths:
The study developed a method for objectively comparing spine properties in primary hippocampal neuron cultures from 8 mouse models of psychiatric disorders at the population level using high-resolution structured illumination microscopy (SIM) imaging. This novel technique identified two distinct groups of mouse models according to the population-level spine properties: those with ASD-related gene mutations and those with schizophrenia-related gene mutations. Functional studies, including gene knockdown and overexpression experiments, identified an effect of Ecrg4 on the spine phenotype of the schizophrenia model mice.
Weaknesses:
The main weakness is that the study is wholly in vitro, using cultured hippocampal neurons. The authors present this as an advantage, however, arguing that spine morphology as measured in a reduced culture system can demonstrate direct effects of gene mutations on neuronal phenotypes in the absence of indirect influences from nonneuronal cells or specific environments.
Another weakness is that CaMKIIαK42R/K42R mutant mice are presented as a schizophrenia model, the authors justifying this by saying that "CaMKII-related signaling pathway disruption has been implicated in the working memory deficits found in schizophrenia patients". Since mutations in CAMK2A cause autosomal dominant intellectual developmental disorder-53 (OMIM 617798) and autosomal recessive intellectual developmental disorder-63 (OMIM 618095), and mice carrying the CAMK2A E183V mutation exhibit ASD-related synaptic and behavioral phenotypes (PMID: 28130356), I think it's stretching credibility to refer to the CaMKIIαK42R/K42R mice as a schizophrenia model.
Although the manuscript is largely well written, there are some instances of ambiguous/unspecific language. This extends to the title (Decoding Spine Nanostructure in Mental Disorders Reveals a Schizophrenia-1 Linked Role for Ecrg4), which gives no indication that the work was in vitro on cultured neurons derived from mouse models.
-
Reviewer #2 (Public review):
Okabe and colleagues build on a super-resolution-based technique that they have previously developed in cultured hippocampal neurons, improving the pipeline and using it to analyze spine nanostructure differences across 8 different mouse lines with mutations in autism or schizophrenia (Sz) risk genes/pathways. It is a worthy goal to try to use multiple models to examine potential convergent (or not) phenotypes, and the authors have made a good selection of models. They identify some key differences between the autism versus the Sz risk gene models, primarily that dendritic spines are smaller in Sz models and (mostly) larger in autism risk gene models. They then focus on three models (2 Sz - 22q11.2 deletion, Setd1a; 1 ASD - Nlgn3) for time-lapse imaging of spine dynamics, and together with computational …
Reviewer #2 (Public review):
Okabe and colleagues build on a super-resolution-based technique that they have previously developed in cultured hippocampal neurons, improving the pipeline and using it to analyze spine nanostructure differences across 8 different mouse lines with mutations in autism or schizophrenia (Sz) risk genes/pathways. It is a worthy goal to try to use multiple models to examine potential convergent (or not) phenotypes, and the authors have made a good selection of models. They identify some key differences between the autism versus the Sz risk gene models, primarily that dendritic spines are smaller in Sz models and (mostly) larger in autism risk gene models. They then focus on three models (2 Sz - 22q11.2 deletion, Setd1a; 1 ASD - Nlgn3) for time-lapse imaging of spine dynamics, and together with computational modelling provide a mechanistic rationale for the smaller spines in Sz risk models. Bulk RNA sequencing of all 8 model cultures identifies several differentially expressed genes, which they go on to test in cultures, finding that ecgr4 is upregulated in several Sz models and its misexpression recapitulates spine dynamics changes seen in the Sz mutants, while knockdown rescues spine dynamics changes in the Sz mutants. Overall, these have the potential to be very interesting findings and useful for the field. However, I do have a number of major concerns.
(1) The main finding of spine nanostructure changes is done by carrying out a PCA on various structural parameters, creating spine density plots across PC1 and PC2, and then subtracting the WT density plot from the mutant. Then, spines in the areas with obvious differences only are analyzed, from which they derive the finding that, for example, spine sizes are smaller. However, this seems a circular approach. It is like first identifying where there might be a difference in the data, then only analyzing that part of the data. I welcome input from a statistician, but to me, this is at best unconventional and potentially misleading. I assume the overall means are not different (although this should be included), but could they look at the distribution of sizes and see if these are shifted?
(2) Despite extracting 64 parameters describing spine structure, only 5 of these seemed to be used for the PCA. It should be possible to use all parameters and show the same results. More information on PC1 and PC2 would be helpful, given that the rest of the paper is based on these - what features are they related to? These specific features could then be analyzed in the full dataset, without doing the cherry picking above. It would also be helpful to demonstrate whether PC1 and 2 differ across groups - for example, the authors could break their WT data into 2 subsets and repeat the analysis.
(3) Throughout the paper, the 'n' used for statistical analysis is often spine, which is not appropriate. At a minimum, cell should be used, but ideally a nested mixed model, which would take into account factors like cell, culture, and animal, would be preferable. Also, all of these factors should be listed, with sufficient independent cultures.
(4) The authors should confirm that all mutants are also on the C57BL/6J background, and clarify whether control cultures are from littermates (this would be important). Also, are control versus mutant cultures done simultaneously? There can be significant batch effects with cultures.
(5) The spine analysis uses cultures from 18-22 DIV - this is quite a large range. It would be worth checking whether age is a confounder or correlated with any parameters / principal components.
(6) The computational modelling is interesting, but again, I am concerned about some circularity. Parameter optimization was used to identify the best fit model that replicated the spine turnover rates, so it is somewhat circular to say that this matched the observations when one of these is the turnover rate. It is more convincing for spine density and size, but why not go back and test whether parameter differences are actually seen - for example, it would be possible to extract the probability of nascent spine loss, etc. More compelling would be to repeat the experiments and see if the model still fits the data. In the interpretation (line 314-318) it is stated that '... reduced spine maturation rate can account for the three key properties of schizophrenia-related spines...', which is interesting if true, but it has just been stated that the probability of spine destabilization is also higher in mutants (line 303) - the authors should test whether if the latter is set to be the same as controls whether all the findings are replicated.
(7) No validation for overexpression or knockdown is shown, although it is mentioned in the methods - please include. Also, for the knockdown, a scrambled shRNA control would be preferable.
(8) The finding regarding ecgr4 is interesting, but showing that some ecgr4 is expressed at boutons and spines and some in DCVs is not enough evidence to suggest that actively involved in the regulation of synapse formation and maturation (line 356).
(9) The same caveats that apply to the analysis also apply to the ecgr4 rescue. In addition, while for 22q the control shRNA mutant vs WT looks vaguely like Figure 2, setd1a looks completely different. And if rescued, surely shRNA in the mutant should now resemble control in WT, so there shouldn't be big differences, but in fact, there are just as many differences as comparing mutant vs wildtype? Plus, for spine features, they only compare mutant rescue with mutant control, but this is not ideal - something more like a 2-way ANOVA is really needed. Maybe input from a statistician might be useful here?
(10) Although this is a study entirely focused on spine changes in mouse models for Sz, there is no discussion (or citation) of the various studies that have examined this in the literature. For example, for Setd1a, smaller spines or reduced spine densities have been described in various papers (Mukai et al, Neuron 2019; Chen et al, Sci Adv 2022; Nagahama et al, Cell Rep 2020).
(11) There is a conceptual problem with the models if being used to differentiate autism risk from Sz risk genes. It is difficult to find good mouse models for Sz, so the choice of 22q11.2del and Setd1a haploinsufficiency is completely reasonable. However, these are both syndromic. 22qdel syndrome involves multiple issues, including hearing loss, delayed development, and learning disabilities, and is associated with autism (20% have autism, as compared to 25% with Sz). Similarly, Setd1a is also strongly associated with autism as well as Sz (and also involves global developmental delay and intellectual disability). While I think this is still the best we can do, and it is reasonable to say that these models show biased risk for these developmental disorders, it definitely can't be used as an explanation for the higher variability seen in the autism risk models.
(12) I am not convinced that using dissociated cultures is 'more likely to reflect the direct impact of schizophrenia-related gene mutations on synaptic properties' - first, cultures do have non-neuronal cells, although here glial proliferation was arrested at 2 days, glia will be present with the protocol used (or if not, this needs demonstrating). Second, activity levels will affect spine size, and activity patterns are very abnormal in dissociated cultures, so it is very possible that spine changes may not translate into in vivo scenarios. Overall, it is a weakness that the dissociated culture system has been used, which is not to say that it is not useful, and from a technical and practical perspective, there are good justifications.
(13) As a minor comment, the spine time-lapse imaging is a strength of the paper. I wonder about the interpretation of Figure 5. For example, the results in Figure 5G and J look as if they may be more that the spines grow to a smaller size and start from a smaller size, rather than necessarily the rate of growth.
-
Author response:
Reviewer #1
(1) The main weakness is that the study is wholly in vitro, using cultured hippocampal neurons.
We appreciate this reviewer's concern about the limitation of cultured hippocampal neurons in extracting disease-related spine phenotypes. While we fully recognize this limitation, we consider that this in vitro system has several advantages that contribute to translational research on mental disorders.
First, our culture system has been shown to support the development of spine morphology similar to that of the hippocampal CA1 excitatory synapse in vivo. High-resolution imaging techniques confirmed that the in vitro spine structure was highly preserved compared with in vivo preparations (Kashiwagi et al., Nature Communications, 2019). The present study used the same culture system and SIM imaging. Therefore, …
Author response:
Reviewer #1
(1) The main weakness is that the study is wholly in vitro, using cultured hippocampal neurons.
We appreciate this reviewer's concern about the limitation of cultured hippocampal neurons in extracting disease-related spine phenotypes. While we fully recognize this limitation, we consider that this in vitro system has several advantages that contribute to translational research on mental disorders.
First, our culture system has been shown to support the development of spine morphology similar to that of the hippocampal CA1 excitatory synapse in vivo. High-resolution imaging techniques confirmed that the in vitro spine structure was highly preserved compared with in vivo preparations (Kashiwagi et al., Nature Communications, 2019). The present study used the same culture system and SIM imaging. Therefore, the difference we detected in samples derived from disease models is likely to reflect impairment of molecular mechanisms underlying native structural development in vivo.
Second, super-resolution imaging of thousands of spines in tissue preparations under precisely controlled conditions cannot be practically applied using currently available techniques. The advantage of our imaging and analytical pipeline is its reproducibility, which enabled us to compare the spine population data from eight different mouse models without normalization.
Third, a reduced culture system can demonstrate the direct effects of gene mutations on synapse phenotypes, independent of environmental influences. This property is highly advantageous for screening chemical compounds that rescue spine phenotypes. Neuronal firing patterns and receptor functions can also be easily controlled in a culture system. The difference in spine structure between ASD and schizophrenia mouse models is valuable information to establish a drug screening system.
Fourth, establishing an in vitro system for evaluating synapse phenotypes could reduce the need for animal experiments. Researchers should be aware of the 3Rs principles. In the future, combined with differentiation techniques for human iPS cells, our in vitro approach will enable the evaluation of disease-related spine phenotypes without the need for animal experiments. The effort to establish a reliable culture system should not be eliminated.
(2) Another weakness is that CaMKIIαK42R/K42R mutant mice are presented as a schizophrenia model.
We agree with this reviewer that CAMK2A mutations in humans are linked to multiple mental disorders, including developmental disorders, ASD, and schizophrenia. Association of gene mutations with the categories of mental disorders is not straightforward, as the symptoms of these disorders also overlap with each other. For the CaMKIIα K42R/K42R mutant, we considered the following points in its characterization as a model of mental disorder. Analysis of CaMKIIα +/- mice in Dr. Tsuyoshi Miyakawa's lab has provided evidence for the reduced CaMKIIα in schizophrenia-related phenotypes (Yamasaki et al., Mol Brain 2008; Frankland et al., Mol Brain Editorial 2008). It is also known that the CaMKIIα R8H mutation in the kinase domain is linked to schizophrenia (Brown et al., 2021). Both CaMKIIα R8H and CaMKIIα K42R mutations are located in the N-terminal domain and eliminate kinase activity. On the other hand, the representative CaMKIIα E183V mutation identified in ASD patients exhibits unique characteristics, including reduced kinase activity, decreased protein stability and expression levels, and disrupted interactions with ASD-associated proteins such as Shank3 (Stephenson et al., 2017). Importantly, reduced dendritic spines in neurons expressing CaMKIIα E183V is a property opposite to that of the CaMKIIα K42R/K42R mutant, which showed increased spine density (Koeberle et al. 2017).
Different CAMK2A mutations likely cause distinct phenotypes observed in the broad spectrum of mental disorders. In the revised manuscript, we will include a discussion of the relevant literature to categorize this mouse model appropriately.
References related to this discussion.
(1) Yamasaki et al., Mol Brain. 2008 DOI: 10.1186/1756-6606-1-6
(2) Frankland et al. Mol Brain. 2008 DOI: 10.1186/1756-6606-1-5
(3) Stephenson et al., J Neurosci. 2017 DOI: 10.1523/JNEUROSCI.2068-16.2017
(4) Koeberle et al. Sci Rep. 2017 DOI: 10.1038/s41598-017-13728-y
(5) Brown et al., iScience. 2021 DOI: 10.1016/j.isci.2021.103184
Reviewer #2
We recognize the reviewer's comments as important for improving our manuscript. We outline our general approach to addressing major concerns. Detailed responses to each point, along with additional data, will be provided in a formal revised manuscript.
(1) Demonstrating the robustness of statistical analyses
We appreciate this reviewer's concern about our strategies for the quantitative analysis of the large spine population. For the PCA analysis (Point 2), our preliminary results indicated that including all parameters or the selected five parameters did not make a significant difference in the relative placement of spines with specific morphologies in the feature space defined by the principal components. This point will be discussed in the revised manuscript. The potential problem of selecting a particular region within a feature space for spine shape analysis (Point 1) can be addressed by using alternative simulation-based approaches, such as bootstrap or permutation tests. These analyses will be included in the revised manuscript. The use of sample numbers in statistical analyses should align with the analysis's purpose (Point 3). When analyzing the distribution of samples in the feature space, it is necessary to use spine numbers for statistical assessment. We will recheck the statistical methods and apply the appropriate method for each analysis. The spine population data in Figures 2 and 8 cannot be directly compared, as the spine visualization methods differ (Figure 2 with membrane DiI labeling; Figure 8 with cytoplasmic GFP labeling) (Point 9). Spine populations of the same size are inevitably plotted in different feature spaces. This point will be discussed more clearly in the revised manuscript.
(2) Clarification of experimental conditions and data reliability
Per this reviewer's suggestion, we will provide more information on the genetic background of mice and the differences in spine structure from DIV 18-22 (Points 4 and 5). We will also provide additional validation data for the functional analyses using knockdown and overexpression methods, for which we already have preliminary data (Point 7). Concerns about the interpretation of data obtained from in vitro culture (Point 12), raised by this reviewer, are also noted by reviewer #1. As explained in the response to reviewer #1, we intentionally selected an in vitro culture system to analyze multiple samples derived from mouse models of mental disorders for several reasons. Nevertheless, we will revise the discussion and incorporate the points this reviewer raised regarding the disadvantages of in vitro systems.
(3) Validation of biological mechanisms and interpretation
In the computational modeling (Point 6), we started from the data of spine turnover (excluding the data of spine volume increase/decrease), fitted the model with the data, and found that the best-fit model showed three features: fast spine turnover, lower spine density, and smaller size of transient spines in schizophrenia mouse models. As the reviewer noted, information about spine turnover is already present in the input data. However, the other two properties are generated independently of the input data, indicating the value of this model. We plan to add additional confirmatory analyses to this model in the revised manuscript.
In response to Point 8, we will provide supporting data on the functional role of Ecgr4 in synapse regulation. We will also refine our discussion on the ASD and Schizophrenia phenotypes based on the suggested literature (Points 10 and 11). Quantification of the initial growth of spines is technically demanding, as it requires higher imaging frequency and longer time-lapse recordings to capture rare events. It is difficult to conclude which of the two possibilities, slow spine growth or initial size differences, is correct, based on our available data. This point will be discussed in the revised manuscript (Point 13).
-
-
