Visuomotor mismatch EEG responses over occipital cortex of freely moving human subjects
Curation statements for this article:-
Curated by eLife

eLife Assessment
This valuable study demonstrates that self-motion strongly affects neural responses to visual stimuli, comparing humans moving through a virtual environment to passive viewing. The evidence for visuomotor mismatch responses is solid, although the interpretation in terms of prediction remains somewhat preliminary. This study bridges human and rodent studies on the role of prediction in sensory processing, and is therefore expected to be of interest to a large community of neuroscientists.
This article has been Reviewed by the following groups
Discuss this preprint
Start a discussion What are Sciety discussions?Listed in
- Evaluated articles (eLife)
Abstract
Likely the strongest predictor of visual feedback is self-motion. In mice, the coupling between movement and visual feedback is learned with first visual experience of the world (Attinger et al., 2017), and brief perturbations of the coupling result in strong visuomotor mismatch responses in visual cortex that possibly reflect prediction errors (Keller et al., 2012; Zmarz and Keller, 2016). In humans, predictive coding has primarily been studied using oddball paradigms which rely on violations of stimulus probability based on recent sensory history. It was still unclear, however, whether humans exhibit visuomotor mismatch responses similar to those observed in mice. This question was important for two reasons. First, visuomotor mismatch responses in humans constitute a basis to start translating the mechanistic understanding of the circuit that computes these responses from mouse to human cortex. Second, a paradigm that can trigger strong prediction error responses and consequently requires shorter recording times would simplify experiments in a clinical setting. Here, by combining a wireless EEG recording system with a virtual reality headset, we found robust visuomotor mismatch responses in human cortex that were characterized by a reversed polarity relative to visual evoked responses and a greater signal power than both visual responses and oddball mismatch responses.
Article activity feed
-

-
-

eLife Assessment
This valuable study demonstrates that self-motion strongly affects neural responses to visual stimuli, comparing humans moving through a virtual environment to passive viewing. The evidence for visuomotor mismatch responses is solid, although the interpretation in terms of prediction remains somewhat preliminary. This study bridges human and rodent studies on the role of prediction in sensory processing, and is therefore expected to be of interest to a large community of neuroscientists.
-
Reviewer #1 (Public review):
In this paper, Solyga, Zelechowski & Keller study human visuomotor mismatch responses as an alternative instantiation of prediction errors to classic oddball paradigms. Using VR, they created a condition in which participants were moving around thereby creating a visuomotor coupling between physical movement and visual flow. To attempt to isolate the contribution of specifically movement-related predictions in this condition, they contrasted it to a condition in which participants were seated and rewatching their movement trajectory during the 'active' condition. Visuomotor mismatches were created by temporarily decoupling movement and visual experience by halting the VR display as participants continued to move.
The core finding of the paper is that participants exhibit a positively-valenced response to the …
Reviewer #1 (Public review):
In this paper, Solyga, Zelechowski & Keller study human visuomotor mismatch responses as an alternative instantiation of prediction errors to classic oddball paradigms. Using VR, they created a condition in which participants were moving around thereby creating a visuomotor coupling between physical movement and visual flow. To attempt to isolate the contribution of specifically movement-related predictions in this condition, they contrasted it to a condition in which participants were seated and rewatching their movement trajectory during the 'active' condition. Visuomotor mismatches were created by temporarily decoupling movement and visual experience by halting the VR display as participants continued to move.
The core finding of the paper is that participants exhibit a positively-valenced response to the visuomotor decoupling in the active but not in the passive condition. Since walking speed only insignificantly slows down following decoupling events in the active conditions, the authors argue that this difference can not be accounted for by "changes in participants' behavior or to simple visual offset responses" with the latter being equal across both conditions. The following reinstatement of the coupling in turn does not differ between the two conditions. The authors additionally show that this mismatch response differs from visual onset responses elicited by checkerboard inversions and that it's "qualitatively" stronger than more commonly studied auditory oddball mismatch responses.
The design with its focus on ecological validity is impressive, well-rationalized and the results are well illustrated. I additionally appreciate the control analyses with regards to changes in walking speed and playback DOF and, now added, additional participants who experience the passive condition before the active. I have a couple of questions/comments.
My main question in round 1 regarded the isolation of visuomotor mismatch. Although the comparison with a seated control seems like a very sensible way to control for simple visual responses, there seem to be more differences than just a break in visuomotor coupling between the conditions. I therefore wonder whether the reduced offset response in the seated condition may be, in part, explained differently. For example, given that participants always conduct the active condition before rewatching their movement in the seated condition, it seemed likely that there is a component of learning across the session that flow will sometimes be halted. This is confirmed with the analyses. The explanation that there is a visuomotor component here is given further weight by their conduction of an additional group of participants who perform the conditions in the reverse order, so this has strengthened the manuscript considerably. However, it does of course remain an imperfect control because the visual stimulus is now different between the conditions for these participants. It's the best that can be achieved with this type of paradigm though and of course it yields a great deal of ecological validity.
I was also wondering whether the authors may consider the findings in frontal electrodes more closely given that the title of the paper focuses on a specifically occipital effect. Their further analyses have confirmed that there are likely interesting frontal effects. From a theoretical point of view, the spatial dissociation in adaptation effects, which were stronger in frontal and weaker in occipital areas, seems interesting and perhaps worth discussing, especially given the interpretation that "mismatch processing may initially arise in sensory visual areas before engaging higher-order frontal regions." How come the frontal decrease in responses is not accompanied by an analogous decrease in its supposed occipital source? Could these two responses reflect different kinds of prediction error signals (i.e. objective vs subjective)?
I remain concerned that the authors fight too defensively that they have absolutely isolated visuomotor prediction mechanisms with this paradigm. It's a nice, informative study, but it seems odd to argue there are no other possible explanations. One picks a design to optimize some features but they will always come at some cost to others. Prioritising ecological validity, which is a justifiable aim, necessarily usually weakens some control over confounds.
To outline my reasoning fully: My concerns wrt generic influences of action on perception are reflected in Fig 1. The P1 is smaller when walking than sitting. It seems likely that the mismatch response reflects something about extrapolation or prediction, because it is larger when walking. However, it's not necessarily sensorimotor prediction. Even if you remove action from the equation, the flow can be extrapolated or predicted most of the time in a way it cannot so well when the video is halted. Of course the sitting condition somewhat controls for it, but when it came second the visual flow disruptions were more predictable here. A reduction in effects over time is indeed confirmed with their analyses. They now have conducted a study with the conditions in the reverse order and they find the same thing. But of course this necessitates non-identical visual flow because the sitting condition is playing the previous participant's flow. So it is likely that across all of these comparisons, it is the visuomotor mismatch that is especially salient. It's just that each comparison is a bit messy/confounded. It would strengthen the manuscript if there were some consideration given to the other processes likely at play here.
As a more minor point in response to our previous review, whether particular accounts represent an 'orthodox' view at present does not determine whether they raise logical issues in need of consideration. The authors may have missed that the papers in question consider mechanisms underlying the attenuation of particular pieces of information *from perception*. Not perceptual processing. We have one percept at any one moment in time and must understand how different population types synergistically generate that percept.
Similarly a little strange is the way in which the authors aggressively defend the position that self-generated motion is 'the strongest' type of prediction. Sure, we probably experience the effects of our actions more often than ambulances. But what about objects obeying laws of gravity or others' faces being structured and moving in systematic ways? It is hard to quantify, such that presumably many scientists would be skeptical of such a claim, and it is not needed logically to justify the importance of examining mechanisms enabling action to shape perceptual processing. I'd assume it better to fight the battles you need to (and can) fight, such that the robust claims carry more weight.
Hope these comments are helpful.
-
Reviewer #2 (Public review):
Summary:
This study investigates whether visuomotor mismatch responses can be detected in humans. By adapting paradigms from rodent studies, the authors report EEG evidence of mismatch responses during visuomotor conditions and compare them to visual-only stimulation and mismatch responses in other modalities.
Strengths:
- Authors use a creative experimental design to elicit visuomotor mismatch responses in humans.
- The study provides an initial dataset and analytical framework that could support future research on human visuomotor prediction errors.
Weaknesses:
- Methodological issues (e.g., volume conduction) make it difficult to confidently attribute the observed mismatch responses to activity in visual cortical regions. This could be alleviated by increasing the number of channels.
The authors …
Reviewer #2 (Public review):
Summary:
This study investigates whether visuomotor mismatch responses can be detected in humans. By adapting paradigms from rodent studies, the authors report EEG evidence of mismatch responses during visuomotor conditions and compare them to visual-only stimulation and mismatch responses in other modalities.
Strengths:
- Authors use a creative experimental design to elicit visuomotor mismatch responses in humans.
- The study provides an initial dataset and analytical framework that could support future research on human visuomotor prediction errors.
Weaknesses:
- Methodological issues (e.g., volume conduction) make it difficult to confidently attribute the observed mismatch responses to activity in visual cortical regions. This could be alleviated by increasing the number of channels.
The authors successfully demonstrate that visuomotor mismatch paradigms can, in principle, be applied in human EEG. This approach provides a translational bridge between rodent and human work on predictive processing.
-
Reviewer #3 (Public review):
Solyga, Zelechowski, and Keller present a concise report of an innovative study demonstrating clear visuomotor mismatch responses in ambulating humans, using a mobile EEG setup and virtual reality. Human subjects walked around a virtual corridor while EEGs were recorded. Occasionally, motion and visual flow were uncoupled, and this evoked a mismatch response that was strongest in occipitally placed electrodes and had a considerable signal to noise ratio. It was robust across participants and could not be explained by the visual stimulus alone.
This is an important extension of their prior work in mice, and represents an elegant translation of those previous findings to humans, where future work can inform theories of e.g. psychiatric diseases that are believed to involve disordered predictive processing. For …
Reviewer #3 (Public review):
Solyga, Zelechowski, and Keller present a concise report of an innovative study demonstrating clear visuomotor mismatch responses in ambulating humans, using a mobile EEG setup and virtual reality. Human subjects walked around a virtual corridor while EEGs were recorded. Occasionally, motion and visual flow were uncoupled, and this evoked a mismatch response that was strongest in occipitally placed electrodes and had a considerable signal to noise ratio. It was robust across participants and could not be explained by the visual stimulus alone.
This is an important extension of their prior work in mice, and represents an elegant translation of those previous findings to humans, where future work can inform theories of e.g. psychiatric diseases that are believed to involve disordered predictive processing. For the most part, the authors are appropriately circumspect in their interpretations and discussions of the implications. The paper in its current form represents an important addition to the literature.
The authors have included analyses of the auditory mismatch using temporal electrodes, referenced to Cz (and therefore should exhibit a mismatch positivity). This added data clearly and convincingly shows that the sensorimotor mismatch is, indeed, stronger than the passive auditory MMN.
- The reference electrode placed at Cz makes it is difficult to interpret relative differences between frontal and occipital electrode responses, as the occipital electrodes are placed farther away from the Cz reference than the frontal electrodes. Similarly, signal occuring cortically near the Cz reference might only appear as though it is occipitally distributed in this montage. It is common in EEG research to re-montage the data to an averaged common reference in order to better interpret the scalp distributions. As the electrode coverage was sparse for some subjects, this could be challenging, and this reviewer does not feel that it is necessary to do this analysis step, or even to drastically rewrite the body of the paper. We only request that some discussion, however brief, is included in the discussion section or the methods that recommend more dense electrode coverage in the future to better interpret scalp distributions and potential meso-scale sources.
- This is just a suggestion. The authors are encouraged to analyse (and report) time-frequency power and phase locking for these mismatch responses, as is common in much of the literature (see Roach et al 2008 Schizophrenia Bulletin). This is not to say that doing so will yield insights into oscillations per se, but converting the data to the time-frequency domain provides another perspective that has some advantages. fosters translations to rodent models, as ERP peaks do not map well between species, but e.g. delta-theta power does (see Lee et al 2018 Neuropsychopharmacology; Javitt et all 2018 Schizophrenia research; Gallimore et al 2023 Cereb Ctx). Further, ERP peaks can be influenced by the actual neuroanatomy of an individual (especially for quantifying V1 responses). Time frequency analyses may aid in interpreting the "early negative deflection with a peak latency of 48 ms " finding as well. As it stands, the report is complete, and it would be acceptable if the authors chose to save this type of analysis for a future publication.
-
Author response:
The following is the authors’ response to the original reviews.
We thank you for the time you took to review our work and for your feedback! The main changes to the manuscript are:
(1) We have performed additional experiments to increase the number of recordings from frontal and occipital electrodes (previously 51 (occipital: O1+O2) and 26 (frontal: Fp1+Fp2), now 133 and 102). The additional data have strengthened many of our results, including for example the trend for a latency difference between occipital and frontal electrodes that was likely underpowered and is now significant (Figure 3E). We have updated all relevant figures to include the additional data (Figures 2–6, Figure S4, Figure S5). None of the main conclusions have changed.
(2) As suggested by reviewer 1, we have conducted additional experiments to rule …
Author response:
The following is the authors’ response to the original reviews.
We thank you for the time you took to review our work and for your feedback! The main changes to the manuscript are:
(1) We have performed additional experiments to increase the number of recordings from frontal and occipital electrodes (previously 51 (occipital: O1+O2) and 26 (frontal: Fp1+Fp2), now 133 and 102). The additional data have strengthened many of our results, including for example the trend for a latency difference between occipital and frontal electrodes that was likely underpowered and is now significant (Figure 3E). We have updated all relevant figures to include the additional data (Figures 2–6, Figure S4, Figure S5). None of the main conclusions have changed.
(2) As suggested by reviewer 1, we have conducted additional experiments to rule out the possibility that the observed effects were driven by the temporal order of open and closed loop sessions (new Figure S6). We also found another 9 participants who were willing to go on the ‘vomit comet’ of six degrees of freedom (6DOF) playback (previously 5, now 14). These data have further strengthened our conclusion that playback halt responses in 4DOF and 6DOF playback are not substantially different (Figure S4).
(3) To address the point of reviewers 2 and 3, that mismatch negativity (MMN) responses would be larger on temporal electrodes, we conducted additional experiments in which we also recorded from temporal electrodes T3–T6. We have now added a comparison of visuomotor mismatch and MMN responses on T3–T6 electrodes as Figures S8–S9. On all electrodes, visuomotor mismatch responses were larger than MMN responses.
(4) As suggested by reviewer 1, we have added an analysis of the experience-dependent changes in mismatch responses comparing frontal and occipital responses early and late in the session (new Figure 4).
(5) As suggested by reviewer 2, we conducted additional experiments in an independent cohort of participants (note, without concurrent EEG) to measure eye movements triggered by visuomotor mismatches. We found eye-movement speed and blink/eye-closure changes, but these had longer latency than visuomotor mismatch responses (Figure S7).
(6) Finally, as suggested by reviewers 2 and 3, we applied independent component (ICA) and time–frequency analyses to the EEG data. We show these results and explain why they are not applicable or useful in our case in the responses below.
Please note, during the revision, we found that a part of our analysis used a bandpass of 0.2-100 Hz while a 1-100 Hz bandpass filter was used elsewhere. This has now been standardized to a 1-100 Hz bandpass filter, and the corresponding methods were updated. This resulted in no relevant changes to the figures. Additionally, the 50 Hz band-stop filter was erroneously described in the methods as 49-51 Hz. The filter used was 40-60 Hz, and the methods have been updated to reflect this.
Reviewer #1 (Public review):
In this paper, the authors wished to determine human visuomotor mismatch responses in EEG in a VR setting. Participants were required to walk around a virtual corridor, where a mismatch was created by halting the display for 0.5s. This occurred every 10-15 seconds. They observe an occipital mismatch signal at 180 ms. They determine the specificity of this signal to visuomotor mismatch by subsequently playing back the same recording passively. They also show qualitatively that the mismatch response is larger than one generated in a standard auditory oddball paradigm. They conclude that humans therefore exhibit visuomotor mismatch responses like mice, and that this may provide an especially powerful paradigm for studying prediction error more generally.
Asking about the role of visuomotor prediction in sensory processing is of fundamental importance to understanding perception and action control, but I wasn't entirely sure what to conclude from the present paradigm or findings. Visuomotor prediction did not appear to have been functionally isolated. I hope the comments below are helpful.
(1) First, isolating visuomotor prediction by contrasting against a condition where the same video stream is played back subsequently does not seem to isolate visuomotor prediction. This condition always comes second, and therefore, predictability (rather than specifically visuomotor predictability) differs. Participants can learn to expect these screen freezes every 10-15 s, even precisely where they are in the session, and this will reduce the prediction error across time. Therefore, the smaller response in the passive condition may be partly explained by such learning. It's impossible to fully remove this confound, because the authors currently play back the visual specifics from the visuomotor condition, but given that the visuomotor correspondences are otherwise pretty stable, they could have an additional control condition where someone else's visual trace is played back instead of their own, and order counterbalanced. Learning that the freezes occur every 10-15 s, or even precisely where they occur, therefore, could not explain condition differences. At a minimum, it would be nice to see the traces for the first and second half of each session to see the extent to which the mismatch response gets smaller. This won't control for learning about the specific separations of the freezes, but it's a step up from the current information.
In theory, it is correct that the open loop (playback) session is predictable. However, this is relatively unrealistic. The open loop session is a 5-minute sequence that participants have only experienced once before, when they were generating it in the closed loop session a couple of minutes earlier. It is unlikely that participants would remember the entire sequence to a precision of less than a second, which is what they would need to predict the mismatch event. However, the reviewer is correct that it is possible that the mismatch events lose salience with time, for example as a consequence of participants losing interest in the task with time, or by undergoing some form of adaptation. To address this, we repeated the experiments with the sequence of closed and open loop sessions reversed (Figures S6A-S6C), and we analyzed the responses as a function of time within the session (Figures S6D and S6E), as suggested.
The reversed-order design consisted of (1) open loop session: a playback, in which participants viewed the recorded closed loop session of a previous participant. This was followed by (2) a closed loop session, in which participants actively walked through the tunnel and experienced visuomotor mismatch events. Using this design, we again found that responses in the closed loop session were significantly larger than in the open loop session (Figures S6A-S6C).
In addition, we analyzed both new and previously collected data as a function of time in the session. We computed moving average responses across 10 mismatch or playback halt trials at different percentages of progress through the paradigm (Figures S6D and S6E). This analysis revealed no consistent experience-dependent changes that could account for the observed differences between closed and open loop session. While there was indeed some form of experience dependent attenuation of visuomotor mismatch responses (see new Figure 4), the difference at the transition from mismatch to playback halt (and vice versa) far exceeded these adaptation effects (Figures S6D and S6E). This analysis was performed only on data from participants for whom we had both closed and open loop sessions and met our inclusion criteria.
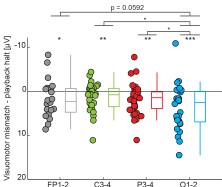
We used a similar analysis to test whether early and late responses within a session systematically differed (new Figure 4). Here, to maximize the chance of finding a difference, we compared early (first five) and late (last five) trials. Behaviorally, participants reduced their walking speed following mismatch events, with a significantly larger reduction during early trials (14.3%) than during late trials (5.7%) (Figure 4A). Neural responses mirrored this pattern primarily on frontal electrodes: frontal activity showed a clear attenuation from early to late trials (Figure 4B), consistent with the reduction in behavioral responses. In contrast, changes on occipital electrodes were much smaller between early and late trials (Figure 4C-4D). Thus, experience-related modulation is substantially stronger in frontal compared to occipital regions.
In sum, we do not believe that the difference between visuomotor mismatch responses and playback halt responses can be explained by differences in the predictability of mismatch and playback halt events.
(2) Second, the authors admirably modified their visual-only condition to remove nausea from 6 df of movement (3D position, pitch, yaw, and roll). However, despite the fact it's far from ideal to have nauseous participants, it would appear from the figures that these modifications may have changed the responses (despite some pairwise lack of significance with small N). Specifically, the trace in S3 (6DOF) and 2E look similar - i.e., comparing the visuomotor condition to the visual condition that matches. Mismatch at 4/5 microvolts in both. Do these significantly differ from each other?
Yes, the 6DOF playback halt response shown in the previous Figure S3 and the mismatch response shown in previous Figure 2E are significantly different (Author response image 1).
Author response image 1.
Comparison of visuomotor mismatch response (A) and 6DOF playback halt response (B) from the original submission with statistics of the comparison (C).
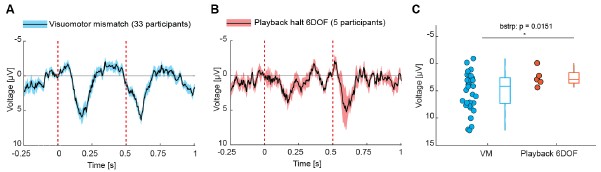
Nevertheless, to strengthen this conclusion, we collected additional data in the 6DOF condition. We show the comparison for participants for whom both closed loop (active) and open loop sessions (6DOF) were recorded within the same recording session (14 participants) in Figure S4. Consistent with our previous findings, visuomotor mismatch responses were significantly larger than 6DOF playback halt responses (Figures S4A-S4C). And we found no evidence of a difference between 6DOF and 4DOF playback halt responses (Figures S4D and S4E).
(3) It generally seems that if the authors wish to suggest that this paradigm can be used to study prediction error responses, they need to have controlled for the actions performed and the visual events. This logic is outlined in Press, Thomas, and Yon (2023), Neurosci Biobehav Rev, and Press, Kok, and Yon (2020) Trends Cogn Sci ('learning to perceive and perceiving to learn'). For example, always requiring Ps to walk and always concurrently playing similar visual events, but modifying the extent to which the visual events can be anticipated based on action. Otherwise, it seems more accurately described as a paradigm to study the influence of action on perception, which will be generated by a number of intertwined underlying mechanisms.
We are not entirely sure we understand the point here correctly. If the reviewer is suggesting that visuomotor coupling is not describable by the ideas of predictive processing, we disagree. However, given that the papers the reviewer is pointing to are premised on what seems to be a somewhat unorthodox interpretation of predictive processing when it comes to cortical circuits, we suspect this is contributing to the misunderstanding here. Let us briefly explain. In the two papers, Press and colleagues argue that most experiments cannot distinguish between “predictive cancellation” and “gated suppression”. This is indeed relatively tricky, even when one has single neuron data. The question is, does movement simply suppress sensory feedback (as is likely the case e.g. in the famous example of the cricket), or does movement result in a precise removal of only the self-generated sensory reafference? The first good evidence of the latter happening in any system is quite recent (Keller and Hahnloser, 2009). The premise the authors build their argument on is that the theory posits that “the brain predictively ‘cancels’ expected action outcomes from perception” (from the abstract of one of the papers). This is incomplete. The minimum circuit for predictive processing is composed of 3 neuron types: positive prediction error neurons, negative prediction error neurons, and internal representation neurons. Only the positive prediction error neurons have the predictive cancellation property the authors discuss. This is not the case for either negative prediction error neurons, or for the internal representation neurons. Negative prediction error neurons are excited by predictions and suppressed by sensory input (i.e. if anything, they are “predictively amplified”). This circuit is relatively well characterized in mouse cortex – for a brief summary see (Keller and Mrsic-Flogel, 2018). Note, this is not our idea of course – the original formulation of predictive processing (Rao and Ballard, 1999) was built to explain end-stopping. These are responses to the absence of an expected line that were stronger than would be expected from classical theories (i.e. negative prediction error responses). In mouse visual cortex, we know that a sudden break in the coupling between locomotion and visual flow selectively activates layer 2/3 negative prediction error neurons. Thus, if human cortex also implements a predictive processing like circuit with positive and negative prediction error neurons, we would expect a break in visuomotor coupling to drive a measurable response in visual cortex (by exciting the population of negative prediction error neurons – this is also why we are quite excited by the phase reversal of visual and mismatch responses as this could indicate that mismatch activates negative prediction error neurons first and positive prediction error neurons later, and vice versa for visual stimulation – negative prediction error neurons are more superficial in cortex (O’Toole et al., 2023)). We do indeed find a response over occipital cortex consistent with the negative prediction error response we observe in mouse cortex. The difficulty in distinguishing “predictive cancellation” and “movement driven suppression” comes only when looking at positive prediction error type responses (that are suppressed by predictive inputs) but does not apply to negative prediction error responses. The predictive processing circuit we are testing is the one described by (Keller and Mrsic-Flogel, 2018; Rao and Ballard, 1999), and here the break in visuomotor coupling is a stimulus that drives negative prediction error responses. Note, other authors who have thought about cortical implementations of predictive processing (e.g. (Bastos et al., 2012)) have glossed over the problem that individual neurons cannot trivially encode both positive and negative errors. Prediction errors are a signed quantity. If neurons signal prediction errors in firing rates and are close to zero firing rate at baseline (as is the case in layer 2/3 of cortex), they cannot (short of rather exotic ideas) encode a signed prediction error. Hence such proposals are not very useful for thinking about prediction error responses in cortex. For these reasons, we see no problem with referring to the response as a prediction error response. This is in line with a large body of mouse research (using a nearly identical paradigm) on the topic.
One could of course argue that gated suppression could also mean that movement relieves suppression. Thus, one could assume that some neurons are suppressed by movement while others are enhanced. If one allows for enough neuron and stimulus specificity in the precision of the movement related suppression and enhancement of responses, the two models (predictive processing and gated suppression) become equivalent, and the discussion becomes semantic. See (Vasilevskaya et al., 2023) for an extended discussion on this point, and the reasons why we think predictive processing is a more useful model than gated suppression (keep in mind, gated suppression only explains the data if we allow for stimulus/neuron specific gain factors of the suppression, in which case the two models are equivalent).
More minor points:
(1) I was also wondering whether the authors may consider the findings in frontal electrodes more closely. Within the statistical tests of the frontal electrodes against 0, as displayed in Figure 3c, the insignificance of the effect of Fp2 seems attributable to the small included sample size of just 13 participants for this electrode, as listed in Table S1, in combination with a single outlier skewing the result. The small sample size stands out especially in comparison to the sample size at occipital electrodes, which is double and therefore enjoys far more statistical power. It looks like the selected time window is not perfectly aligned for determining a frontal effect, and also the distribution in 3B looks like responses are absent in more central electrodes but present in occipital and frontal ones. I realise the focus of analysis is on visual processing, but there are likely to be researchers who find the frontal effect just as interesting.
That is correct; our data in frontal electrodes was likely underpowered. The reason we have fewer data in frontal electrodes is that eye-blink artifacts are particularly strong in frontal channels, resulting in a larger proportion of trials failing to meet our data inclusion criteria. We have now added more data from frontal and occipital electrodes by including additional experimental sessions. In addition, we applied less stringent trial-exclusion criteria, requiring that no artifacts occur within the time window −0.5 to 1 s relative to the event trigger (instead of −0.5 to 2 s). This adjustment allowed us to retain a larger number of trials. As anticipated by the reviewer, this increase in data was sufficient to confirm a significant response to the visuomotor mismatch event at both frontal electrodes (Figure 3C). The expanded dataset also revealed a significant difference in response onset times between occipital and frontal electrodes (Figure 3E), an effect that was not significant previously. In addition, we have included analysis comparing early and late mismatch responses in frontal and occipital electrodes (Figure 4).
(2) It is claimed throughout the manuscript that the 'strongest predictor (of sensory input) - by consistency of coupling - is self-generated movement'. This claim is going to be hard to validate, and I wonder whether it might be received better by the community to be framed as an especially strong predictor rather than necessarily the strongest. If I hear an ambulance siren, this is an especially strong predictor of subsequent visual events. If I see a traffic light turn red, then yellow, I can be pretty certain what will happen next. Etc.
This is a statistical argument. Every movement – throughout life – is directly and immediately coupled to sensory feedback and has been throughout evolutionary history. The vast majority of visual input you receive (we estimate, well above 99%) is the consequence of your own movements (e.g. every few 100 ms your eye movements cause a full field change in your visual input). The same is likely true of proprioceptive and somatosensory input – the vast majority is the direct consequence of your own movements (not other people poking you). This is likely different in the auditory system where a much larger fraction of the input is externally driven (depending a bit on how much one likes to talk). But even here the best predictor is self-motion (most non-self-generated sounds one experiences in life are very difficult to predict with millisecond precision). The example the reviewer gives is a good illustration of this. Take the siren that hails the appearance of an ambulance. The siren tells us that an ambulance will appear, but not how it will look, not when exactly it will appear, and with only very low resolution as to where it will appear. Incidentally, if you ask people to draw an ambulance they tend to draw a WWII style white square vehicle with a red cross on the side – a style of ambulance they likely have not ever seen in life. Their visual predictions of what they are about to see are very low resolution. We catastrophically fail at making pixel perfect predictions from learned stimulus associations of this nature. The traffic light example is difficult to compare to visual feedback control of movement as it is a much simpler prediction of a single bit in the form of a change in color of an existing object.
In addition, consider how often (in life) you have seen an ambulance after hearing it? 100 times maybe? Maybe less. How often have you seen traffic lights change - 10 000 times? 100 000 times? Now consider, how often you have experienced the visual consequences of moving your head or eyes to the left (keep in mind this includes micro saccades) – at a conservative, once per second, that is somewhere on the order of 1 000 000 000. This is not even in the same ballpark. Our brains can certainly learn to make the ambulance and traffic light type predictions - to some extent - but by far the best predictor of sensory feedback (simply by virtue of the physics of how our body interacts with the world) is self-motion.
We think this is an argument we can make based on first principles, and one that is frequently overlooked in the field, as experiments often focus on training people or animals to learn novel associations that, especially in the case of mice, we often have no idea whether cortical circuits can even learn. We should focus experiments on the predictive systems our brains have evolved since long before the evolutionary appearance of ambulances and traffic lights. We understand that the reviewer may disagree with this, but unless the reviewer has a concrete example of an even stronger predictor (as measured by frequency of experience, consistency in coupling, and precision in timing – we can’t think of one), it is a point we will make.
(3) The checkerboard inversion response at 48 ms is incredibly rapid. Can the authors comment more on what may drive this exceptionally fast response? It was my understanding that responses in this time window can only be isolated with human EEG by presenting spatially polarized events (cf. c1, e.g., Alilovic, Timmermans, Reteig, van Gaal, Slagter, 2019, Cerebral Cortex).
We don’t know, but it is not inconsistent with previous reports. For example, compare the “standing” and “fast walking” target ERP responses in Figure 5 of (Gramann et al., 2010). Both here and in our data, the fast response peak is only really apparent in the direct comparison of visual responses recorded while participants were walking to those when they were stationary.
While we have taken great care to calibrate the timing of the visual display with the EEG recording, one could be worried that the alignment is off by as much as tens of milliseconds. However, even if this were so, one could use P1 as a reference and determine that the fast peak roughly precedes P1 by about 40 ms. Which again would result in a latency of about 50 ms of the fast walking peak (assuming P1 peaks at about 90 ms). In sum, we have added a reference to the previous work (that we found thanks to the reviewer’s comment) but fear we have nothing intelligent to say beyond that.
Reviewer #2 (Public review):
Summary:
This study investigates whether visuomotor mismatch responses can be detected in humans. By adapting paradigms from rodent studies, the authors report EEG evidence of mismatch responses during visuomotor conditions and compare them to visual-only stimulation and mismatch responses in other modalities.
Strengths:
(1) The authors use a creative experimental design to elicit visuomotor mismatch responses in humans.
(2) The study provides an initial dataset and analytical framework that could support future research on human visuomotor prediction errors.
Weaknesses:
(1) Methodological issues (e.g., volume conduction, channel selection, lack of control for eye movements) make it difficult to confidently attribute the observed mismatch responses to activity in visual cortical regions.
(2) A very large portion of the data was excluded due to motion artefacts, raising concerns about statistical power and representativeness. The criteria for trial inclusion and the number of accepted trials per participant appear arbitrary and not justified with reference to EEG reliability standards.
(3) The comparison across sensory modalities (e.g., auditory vs. visual mismatch responses) is conceptually interesting, but due to the choice of analyzing auditory mismatch responses over occipital channels, it has limited interpretability.
We have responded to these points in the more detailed itemization below.
The authors successfully demonstrate that visuomotor mismatch paradigms can, in principle, be applied in human EEG. However, due to the issues outlined above, the current findings are relatively preliminary. If validated with improved methodology, this approach could significantly advance our understanding of predictive processing in the human visual system and provide a translational bridge between rodent and human work.
Reviewer #2 (Recommendations for the authors):
Overall, the study addresses an interesting and underexplored question (translation of the visuomotor mismatch responses observed in rodents to humans). Below, please find a list of specific suggestions for improvement
Introduction:
(1) "updating internal representations and internal models" - what is the difference between the two, and why is it relevant to this study?
In a nutshell, an internal model is the synaptic weight matrix that transforms between coding spaces. An internal representation is the activity pattern coding for the current representation. See (Aizenbud et al., 2025; Keller and Mrsic-Flogel, 2018) for more lengthy elaborations. The fact that the mechanism used for representation update can also be used to update internal models (i.e. solve the credit assignment problem) is likely the prime advantage of predictive processing (see work from the Bogacz lab). The relevance to the current study is justifying why predictive processing is a reasonable hypothesis for the function of cortex.
(2) "Certain stimuli can be predicted from the preceding sensory input" vs. "Predictions can also be based on memory" - how are these two different? Do you mean specific (e.g., long-term associative or episodic) memory types in the latter?
Correct, this is an arbitrary distinction that primarily makes sense in the light of experimental approaches. In this particular case, we were talking about spatial memory. We made this explicit to increase clarity.
(3) "the strongest predictor - by consistency of coupling - is self-generated movement"
(a) Externally induced movement, while not self-generated and therefore not predicted, will also generate sensory coupling, so is it really only about consistency?
Externally induced movement (as in somebody else moving one’s arm we are not sure this is what the reviewer means) will induce sensory-sensory coupling but not sensorimotor coupling. We might be misunderstanding the point. In case the reviewer means stimuli that trigger movement as in us asking participants to walk, or a sudden startle stimulus that makes them jump in all such cases there are of course sensorimotor predictions. Sensorimotor predictions are driven by efference copies of the motor command thus all movements whether ‘voluntarily’ executed or triggered by an external stimulus will drive sensorimotor predictions. (All of this of course assumes that the predictive processing theory is correct.)
(b) Do you mean temporal consistency (minimal lags), statistical contingencies (same movements linked to the same sensory inputs), or both? How does it differentiate sensorimotor/visuomotor mismatch responses from responses to incongruent stimuli in sensory modalities (e.g. audiovisual)?
Both. We have rephrased the sentence to try to make this clearer. See also response to reviewer 1 minor point 2 above.
How does it differentiate sensorimotor/visuomotor mismatch responses from responses to incongruent stimuli in sensory modalities (e.g. audiovisual)?
Most cross-modal associations are much less consistent (the exact sound of a glass shattering is always slightly different and impossible for us to predict), and orders of magnitude less frequently experienced, than sensorimotor associations. Again, see also response to reviewer 1 minor point 2 above.
(4) "Every movement is directly coupled to sensory feedback throughout life"
This may be the case for proprioceptive and/or somatosensory feedback, but not necessarily for visual feedback (e.g., a mouse moving its tail), which is the topic of the study.
Correct, there are movements that can be disconnected from visual feedback. Most of the time, most movements however are not, and we are studying one of the more prominent ones that is clearly not decoupled locomotion. The contrast we aim to highlight here very prominently is that there is still this vague idea in the field that you can take a participant, or a mouse, and expose them/it to a few tens or hundreds of trials of some sensory stimulus contingency and then probe for prediction error responses to a pattern only recently if at all learned. Given the life-long experience of subjects and mice, is it really surprising that oddball responses are less strong than a sensorimotor mismatch?
(5) "However, the overall level of this motor-related activity is much higher than one would expect simply from predictions of visual feedback that are compared against visual input."
Could you please clarify what one would expect in this case, and/or back it up with citations?
This is in reference to the fact that there are very strong movement related signals in the mouse visual cortex that persist even when the mouse is in complete darkness. In darkness, movements should not trigger any visual feedback change hence the activity is difficult to explain as a movement related prediction of visual flow. We have rephrased this section of the introduction to make this clearer.
(6) "The more precise the prediction and comparison, the less motor-related activity should be detectable in visual cortex."
I think this conflates two issues. A good match between prediction and input would indeed result in sensory attenuation. However, sensory precision, at least in active inference, can upregulate prediction error responses. Since predictions cannot be assumed to be perfect (due to external or internal noise), increased precision may therefore augment activity. See e.g. https://doi.org/10.1007/s10339-013-0571-3
We agree with the reviewer – the phrasing here was misleading. We do not mean precision in the predictive processing sense, but the precision of sensorimotor control necessary for the behavior. We have rephrased the corresponding section of the manuscript.
(7) Neither the introduction nor the discussion refers to previous human EEG studies on sensorimotor mismatch responses, where sensory feedback doesn't match motor actions (e.g. https://doi.org/10.3758/s13423-021-01992-z ; https://www.sciencedirect.com/science/article/pii/S0028393214003777 ; https://www.sciencedirect.com/science/article/pii/S0028393219301265).
The studies cited by the reviewer primarily test how discrete violations of learned action–outcome associations are represented in the brain, whereas our visuomotor mismatch paradigm probes violations of continuous sensorimotor coupling during ongoing action. The paradigms are conceptually different both in how strong the coupling is (lifelong vs. learned in the experiment), and in how prediction errors are likely used (visuomotor control vs. stimulus detection). We have added a brief part to our introduction discussing this.
Results:
(1) A very large proportion of the dataset was excluded due to movement artefacts. This is rather problematic as
(a) the rationale behind finding mismatch responses is that motion-related (neural) signals should affect visual cortical activity, so it's essential to disentangle these neural signals from artefacts;
Correct, we excluded 21.7% of the total data for visuomotor mismatch paradigm. Note, this percentage compares to other similar studies of EEG recordings during movement (Oliveira et al., 2016). By “problematic”, we assume the reviewer means the fact that we have artefacts, not that we exclude trials with artefacts. The movement artefacts are typically caused by the acceleration during stepping in participants with a heavy gait. None of these movement artefacts are time locked to any of the responses we investigate. Thus, they should just appear as increased levels of noise if not excluded. We don’t understand why the reviewer thinks this is particularly problematic for our analysis/conclusions (beyond the trivial consequence of increasing noise levels that would only cause us to underestimate the strength of the mismatch signals we report).
(b) the criterion for the number of trials of 15 triggers (per condition?) is arbitrary and lower than widely used in the literature, so authors should demonstrate that this is a sufficient number to observe a measurable ERP even for those participants with 15 triggers;
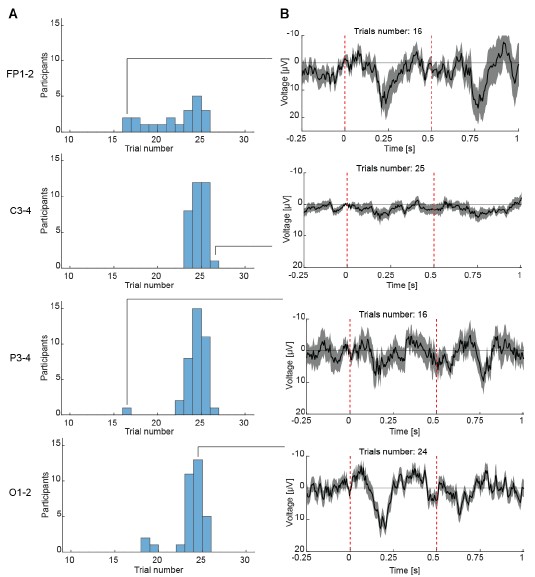
We have between 16 and 25 visuomotor mismatch events per participant. Author response image 2 is a selection of single participant examples with different number of trials. The number of mismatch events is limited by the fact that we introduce them approximately every 10 - 15 s and have a total duration of the closed loop session of 5 minutes. Thus, on average, we expect to have 24 mismatch events. But we are not sure we understand the logic of the comment, if we set exclusion too low, we just risk losing a response in the noise. And we clearly have stronger and higher signal to noise mismatch responses with an average of 20 trials compared to visual responses during movement with an average of 40 trials or MMN responses with an average of 28 trials.
Author response image 2.
Reliable ERPs can be observed with as few as 16 trials across EEG channels. (A) Histograms showing the distribution of the number of valid mismatch trials per participant for each electrode pair (Fp1–2, C3–4, P3–4, O1–2). (B) Representative EEG responses to visuomotor mismatch events from a single participant, recorded at electrode pairs Fp1–2, C3–4, P3–4, and O1–2. Waveforms were computed using the indicated number of trials (shown above each trace). Dashed vertical red lines are onset and offset of the visuomotor mismatch.
(c) it seems that the seemingly static "visual" condition resulted in a larger proportion of data rejected due to movement (or, as later mentioned, nausea) than the "visuomotor" condition, which is counterintuitive and needs further explanation;
This is a misunderstanding the ‘visual paradigm’ the reviewer is referring to are the experiments shown in Figure 1. Here we record visual responses in both sitting and walking participants. In this experiment, as in others, exclusion was primarily driven by part of the paradigm where the subjects were moving. To make this clearer we have added Table S2 to the manuscript that provides an overview of trials excluded by paradigm and session.
(d) authors mention eye movements as a potential issue, which should be possible to detect from frontal channels. Additionally, it's not entirely clear how many datasets were discarded (the results section mentions 19/48 in the visual condition, then 4+11 in the playback condition - isn't this the same condition?)
The visual paradigm corresponds to the data shown in Figure 1, in which participants viewed a flipping checkerboard in both a walking and a stationary session. The open loop session is part of the visuomotor paradigm shown in Figure 2, where participants were exposed to a replay of the visual flow that had been self-generated during the preceding closed loop session, including the visual flow halts that constituted visuomotor mismatches in the closed loop session. Please note, to avoid such confusion, we have attempted to standardize the usage of paradigm (visual vs. visuomotor) and session (sitting vs. walking, and closed loop vs. open loop) throughout. In addition, we have added a table to summarize the number of excluded trials by paradigm and session as Table S2 to the manuscript.
In comments 1 and 2 of the public review, the reviewer also points out that we did not control for eye movements and we presume relatedly claims that we did not use common EEG reliability standards. Regarding the first point, we performed additional experiments in an independent cohort of participants to test whether eye movements could account for the visuomotor mismatch responses. We recorded eye movements during closed loop sessions and found that changes in eye speed (Figure S7A) or blink rate (Figure S7B) following the mismatch stimulus had a longer latency than visuomotor mismatch responses in EEG. This suggests that the visuomotor mismatch response cannot be explained by eye blinks or changes in eye movement speed. Regarding the second point, we are not sure we understand. Trial exclusion based on a fixed voltage threshold of 100 µV is relatively common, and our rejection rates are on par, and particularly on occipital electrodes even lower, with other work in EEG recordings during locomotion or movement (see e.g. (Oliveira et al., 2016)).
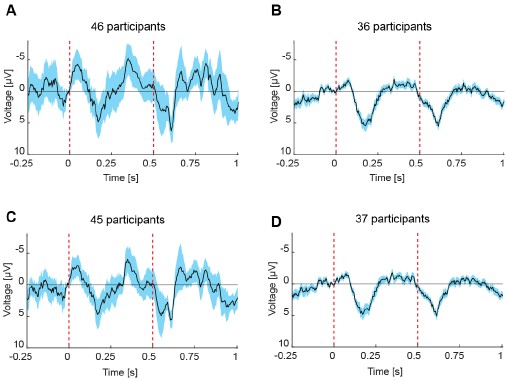
Nevertheless, we did attempt to apply independent component analysis (ICA) based filtering to the EEG data (Delorme and Makeig, 2004). However, these methods were designed for high channel density recordings. With only 8 channels, ICA is unable to reliably isolate eye movement or motion artefact components of the EEG. To illustrate this, we tested two artifact-rejection strategies. In the first approach, components associated with non-neural artifacts (e.g., muscle activity, line noise, eye movements) were removed only if at least 90% of the component’s variance was assigned to a single artifact class (Author response image 3A). In the second, more permissive approach aimed specifically at reducing eye movement artifacts, components were removed if artifact-related activity exceeded 90% for non-eye artifacts, while the threshold for eye-related components was lowered to 60% (Author response image 3C). We lowered the threshold for excluding eye-related components to ensure that EEG signals influenced by eye movements were effectively removed. In both cases - whether the eye-component threshold was set to 90% or 60% - the averaged responses to visuomotor mismatch trials remained largely similar to the previously reported data, despite higher noise in some traces. Interestingly, when we then followed the ICA filtering by our voltage threshold based exclusion with a threshold of 100 µV, the resulting traces closely resembled the patterns described in the paper (Author response image 3B and 3D). Thus, we conclude the nonICA filtered responses are easier to interpret, free of any potential ICA filtering artifacts, and far less parameter choice (of the ICA filtering) dependent.
Author response image 3.
Removal of artifacts identified with ICA does not change the visuomotor mismatch responses. (A) Visuomotor mismatch responses recorded from occipital electrodes after artifact correction. Components associated with non-neural artifacts (e.g., muscle activity, line noise, eye movements) were removed only if ≥90% of the component’s variance was attributed to a single artifact class. Solid black line represents the mean, and shading indicates the SEM across participants. Dashed vertical red lines are onset and offset of the visuomotor mismatch. (B) As in A, but excluding trials with amplitudes exceeding 100 µV. (C) As in A, but components were removed if artifact-related activity exceeded 90% for non-ocular artifacts, while the threshold for eye-related components was lowered to 60%. (D) As in C, but excluding trials with amplitudes exceeding 100 µV.
(2) The finding that mismatch responses are observed at all channels, with differences in amplitudes but not latencies, indicates that volume conduction may affect the results. I would strongly suggest accounting for this using a method appropriate for the very small number of channels, e.g., phase lag index.
We are not sure we understand. The phase lag index is a method to estimate functional connectivity in a way that corrects for volume conduction (using phase lag). We make no claims about functional connectivity; thus, we are not sure what the reviewer is suggesting we do. The fact that the visual and visuomotor mismatch responses were measurable on all electrodes could indeed be in part explained by volume conduction, but we see no way to estimate the volume conduction contribution. From mouse calcium imaging data, we know that both visual and visuomotor mismatch responses spread across large parts of dorsal cortex (including frontal regions like the ACC).
With the addition of new data, the latency difference between occipital and frontal electrodes - previously observed only as a trend - is now statistically significant (Figure 3E). Occipital responses emerge earlier than frontal responses, suggesting that mismatch-related activity likely originates in sensory visual regions and subsequently propagates to more frontal areas, as similar to what had been reported in mouse cortex (Heindorf and Keller, 2024).
(3) The authors compare different types of mismatch responses (including auditory oddballs) in the same set of (occipital) channels, but doesn't this undermine the spatial specificity of the results? Classical auditory mismatch negativity is typically observed over central channels, so weaker amplitudes of auditory mismatch responses in occipital channels are likely trivially explained by modality differences. As such, I'm not convinced that this comparison is informative even in a qualitative manner.
To address this point, we conducted additional auditory oddball experiments with recordings over the auditory cortex (channels T3, T4, T5, and T6). Given our central reference, these channels should capture the strongest mismatch negativity. The amplitude of the visuomotor mismatch response exceeded that of mismatch negativity on all tested channels (new Figures S8 and S9).
(4) On a similar note, is the polarity reversal found for visual vs. mismatch responses specific to occipital channels?
Thank you for this interesting question. In fact, polarity reversal was consistently observed across all recorded channels; this has now been added as a main figure to the manuscript (Figure 5).
(5) Figure S4C seems to cut off one outlier, and I don't see this outlier included in the boxplot.
Correct, that is why we describe the boxplots in the figure legend as: “Boxes mark median, quartiles, and range of data not considered outliers.” The axes were now adjusted to include all data points.
Discussion:
"A central tenet of the cortical circuit for predictive processing is the split into separate populations of neurons that compute positive and negative prediction errors (Keller and Mrsic-Flogel, 2018; Rao and Ballard, 1999)" - this may be the case for visuomotor mismatch signals or reward prediction errors, but signed PEs do not play a central role in other proposed microcircuits for predictive processing in the perceptual domain (e.g. Bastos)
Signed prediction errors do not play a central role in proposed cortical microcircuits for predictive processing that do not burden themselves with making a concrete proposal for the implementation of the prediction error computation. The (Bastos et al., 2012) work is a good example of this. The equation for the error term provided in that paper is clearly signed (nothing stops the error from going negative), but no proposal is made for how layer 2/3 excitatory neurons are supposed to signal this quantity. With baseline activity levels close to zero in layer 2/3, there really is only one way to do this, and that is separate populations of negative and positive prediction error neurons. With non-zero baseline firing rate, one could do this bidirectionally around a mean firing rate (as is typically thought of dopaminergic RPE neurons). There are more abstract Bayesian implementations that assume logarithmic transformations that could also implement a prediction error-like system without negative firing rates. But given the absence of any physiological evidence, we will refrain from discussing these. However, most importantly, there is now considerable evidence for the existence of both negative and positive prediction error neurons in layer 2/3 of mouse visual cortex. Thus, by “cortical circuit for predictive processing” we here mean those that make biologically plausible proposals for prediction error computations. Also note, the (Rao and Ballard, 1999) model is probably the prime example for what the reviewer calls a proposed microcircuit for predictive processing in the “perceptual domain”.
Reviewer #3 (Public review):
Summary:
Solyga, Zelechowski, and Keller present a concise report of an innovative study demonstrating clear visuomotor mismatch responses in ambulating humans, using a mobile EEG setup and virtual reality. Human subjects walked around a virtual corridor while EEGs were recorded. Occasionally, motion and visual flow were uncoupled, and this evoked a mismatch response that was strongest in occipitally placed electrodes and had a considerable signal-to-noise ratio. It was robust across participants and could not be explained by the visual stimulus alone.
Strengths:
This is an important extension of their prior work in mice, and represents an elegant translation of those previous findings to humans, where future work can inform theories of e.g., psychiatric diseases that are believed to involve disordered predictive processing. For the most part, the authors are appropriately circumspect in their interpretations and discussions of the implications. I found the discussion of the polarity differences they found in light of separate positive and negative prediction errors, intriguing.
Weaknesses:
The primary weaknesses rest in how the results are sold and interpreted.
Most notably, the interpretation of the results of the comparison of visuomotor mismatches to the passive auditory oddball induced mismatch responses is inappropriate, as suboptimal electrode choices, unclear matching of trial numbers, and other factors. To clarify, regarding the auditory oddball portion in Figure 5, the data quality is a concern for the auditory ERPs, and the choice of Occipital electrodes is a likely culprit. Typically, auditory evoked responses are maximal at Cz or FCz, although these contacts don't seem to be available with this setup. In general, caution is warranted in comparing ERP peaks between two different sensory modalities - especially if attention is directed elsewhere (to a silent movie) during one recording and not during the other. The authors discuss this as a purely "qualitative" comparison in the text, which is appreciated, and do acknowledge the limitations within the results section, but the figure title and, importantly, the abstract set a different tone. At least, for comparisons between auditory mismatch and visuomotor mismatch, trial numbers need to be equated, as ERP magnitude can be augmented by noise (which reduces with increased numbers of trials in the average).
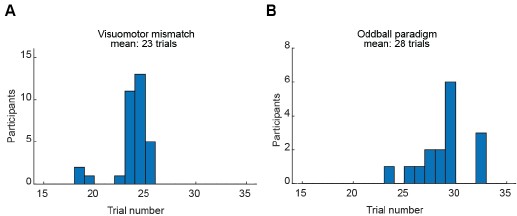
To address this point, we conducted additional auditory oddball experiments with recordings over the auditory cortex (channels T3, T4, T5, and T6). Given our central reference, these channels should capture the strongest mismatch negativity. Nevertheless, the amplitude of the visuomotor mismatch response exceeded that of mismatch negativity on all tested channels (these results are now shown in the new Figures S8 and S9), and the response power was significantly greater for the visuomotor mismatch than for mismatch negativity. Independent of electrode we test, the visuomotor mismatch response has a power 5 to 10 times higher than that of the MMN response. And the number of trials per participant that met quality criteria was comparable between the visuomotor mismatch paradigm (mean = 23 trials) and the auditory mismatch paradigm (mean = 28 trials) (Author response image 4).
Author response image 4.
Number of trials included for analysis is comparable between visuomotor and oddball paradigm. (A) Histogram showing the distribution of the number of valid trials per participant for O1-2 electrode pair in visuomotor mismatch paradigm. (B) Same as in A but for deviant stimulus presentations in the oddball paradigm.
And more generally, the size of the mismatch event at the scalp does not scale one-to-one with the size at the level of the neural tissue. One can imagine a number of variables that impact scalp level magnitudes, which are orthogonal to actual cortex-level activation - the size, spread, and polarity variance of the activated source (which all would diminish amplitude at the scalp due to polyphasic summation/cancelation). The variance of phase to a stimulus across trials (cross trial phase locking) vs magnitude of underlying power - the former, in theory, relates to bottom-up activity and the latter can reflect feedback (which has more variability in time across trials; the distance of the scalp electrode from the activated tissue (which, for the auditory system, would be larger (FCz to superior temporal gyrus) than for the visual system (O1 to V1/2)). None of this precludes the inclusion of the auditory mismatch, which is a strength of the study, but interpretations about this supporting a supremacy of sensory-motor mismatch - regardless of validity - are not warranted. I would recommend changing the way this is presented in the abstract.
We agree with the point that the EEG response does not need to reflect the total cortical activation. However, the discussion in the abstract (and elsewhere) is in the context of clinical experiments where the underlying cortical activity pattern is irrelevant if it does not trigger a clinically measurable (by EEG in this case) response. The abstract only makes a comparison to MMN implicitly in this sentence “Second, a paradigm that can trigger strong prediction error responses and consequently requires shorter recording times could simplify experiments in a clinical setting.” We are not sure how to phrase this even more carefully – the statement at face value is a truism. The reviewer, we assume, takes exception to the unstated implication that visuomotor prediction errors trigger stronger responses than MMN. Given the data we have, we assume most authors would not consider it an overstatement to make that claim outright.
Otherwise, the data are of adequate quality to derive most of their conclusions.
The authors claim that the mismatch responses emanate from within the occipital cortex, but I would require denser scalp coverage or a demonstration of consistent impedances across electrodes and across subjects to make conclusions about the underlying cortical sources (especially given the latencies of their peaks). In EEG, the distribution of voltage on the scalp is, of course, related to but not directly reflective of the distribution of the underlying sources. The authors are mostly careful in their discussion of this, but I would strongly recommend changing the work choice of "in occipital cortex" to "over occipital cortex" or even "posteriorly distributed". Even with very dense electrode coverage and co-registration to MRIs for the generation of forward models that constrain solutions, source localization of EEG signals is very challenging and not a simple problem. Given the convoluted and interior nature of human V1, the ability to reliably detect early evoked responses (which show the mismatch in mouse models) at the scalp in ERP peaks is challenging - especially if one is collapsing ERPs across subjects. And - given the latency of the mismatch responses, I'd imagine that many distributed cortical regions contribute to the responses seen at the scalp.
This is an excellent point we have rephrased throughout to “over occipital cortex” instead of “in occipital cortex”.
I think that Figure 3C, but as a difference of visual mismatch vs halting flow alone (in the open loop) might be additionally informative, as it clarifies exactly where the pure "mismatch" or prediction error is represented.
We performed the analysis as suggested (Author response image 5). Visuomotor mismatch responses are stronger on all electrodes compared to playback halt responses. This difference is also larger in data recorded on occipital electrodes.
Author response image 5.
Comparison of the difference between visuomotor mismatch and playback halt on all electrodes. Average response strength was calculated within a 100 ms window centered on the peak of the average visuomotor mismatch response across all electrodes. Boxes mark median, quartiles, and range of data not considered outliers. Each circle represents data from one participant. **: p<0.01, *: p<0.05, Fp1-2: 20 participants, C3-4: 31 participants, P3-4: 35 participants, O1-2: 32 participants.
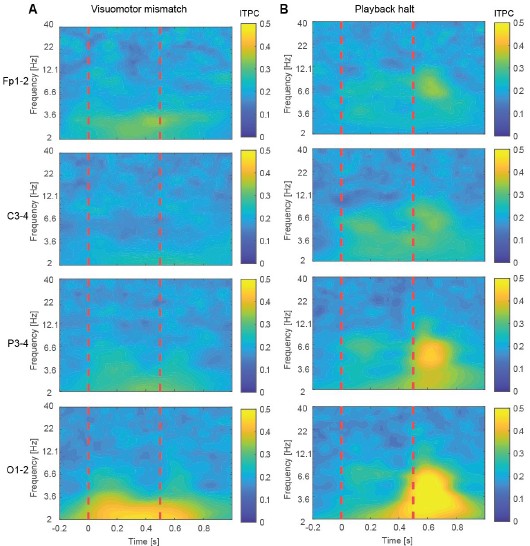
As a suggestion, the authors are encouraged to analyse time-frequency power and phase locking for these mismatch responses, as is common in much of the literature (see Roach et al 2008, Schizophrenia Bulletin). This is not to say that doing so will yield insights into oscillations per se, but converting the data to the time-frequency domain provides another perspective that has some advantages. It fosters translations to rodent models, as ERP peaks do not map well between species, but e.g., delta-theta power does (see Lee et al 2018, Neuropsychopharmacology; Javitt et al 2018, Schizophrenia research; Gallimore et al 2023, Cereb Ctx). Further, ERP peaks can be influenced by the actual neuroanatomy of an individual (especially for quantifying V1 responses). Time frequency analyses may aid in interpreting the "early negative deflection with a peak latency of 48 ms " finding as well.
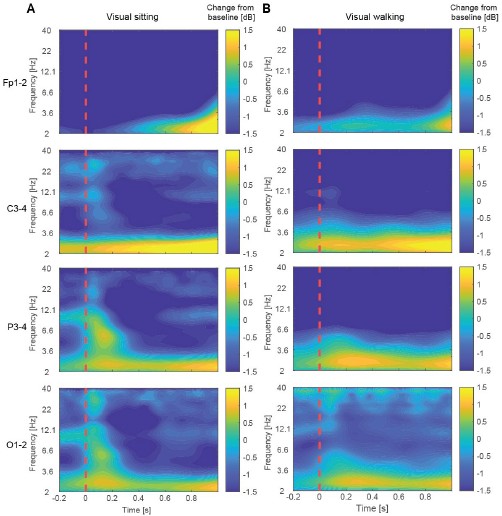
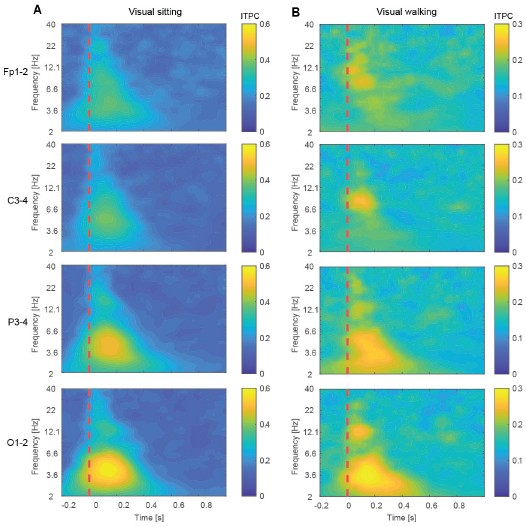
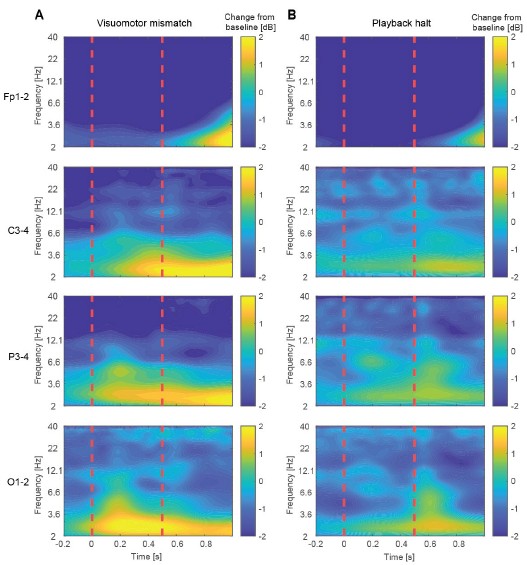
We have performed time–frequency power and phase-locking analyses for both visual responses (Author response image 6 and Author response image 7) and visuomotor mismatch and playback halt responses (Author response image 8 and Author response image 9), as suggested. We have added the results of these analyses here, as these are not fully developed yet. We may add these to a future publication, for which we would properly want to quantify stability of these effects.
In brief, time–frequency representations of power did identify potentially interesting differences between walking and sitting sessions in the visual paradigm. Inter-trial phase coherence (ITPC) revealed an early increase in alpha-band synchronization suggesting that phase alignment of alpha oscillations may contribute to the early differences in visual responses between walking and sitting. The same analyses were applied to visuomotor mismatch and playback halt responses. Time–frequency power analysis revealed an increase in delta-band power during visuomotor mismatch, consistent with previous reports linking delta activity to prediction error processing, including reward prediction errors (Cavanagh, 2015), unexpected final words (Webb and Sohoglu, 2025), and visual deviance detection (West et al., 2024). Notably, it appears as if the increase in delta power emerged first over occipital electrodes and appeared later over more frontal electrodes, forming a spatiotemporal gradient of onset across the scalp.
Delta power changes were markedly reduced in the playback halt responses at the time of visual flow cessation. While some power changes were observed, they occurred primarily at visual flow onset rather than at flow offset. Inter-trial phase coherence analysis further revealed delta-band synchronization over occipital electrodes following visuomotor mismatch, whereas the playback halt response showed strong phase synchronization in both delta and theta bands following visual flow onset.
Author response image 6.
Time–frequency representations of EEG power changes during the visual paradigm. (A) Time–frequency maps showing changes in spectral power relative to baseline for electrodes Fp1–2, C3–4, P3–4, and O1–2 following checkerboard reversal in the sitting session. The dashed red vertical line indicates the time of the checkerboard reversal (0 s). (B) As in A, but recorded while participants were walking.
Author response image 7.
Inter-trial phase coherence (ITPC) for visual trials during sitting and walking. (A) ITPC across trials for electrode pairs Fp1–2, C3–4, P3–4, and O1–2 following checkerboard reversal in the sitting session. The dashed red vertical line marks the time of the checkerboard reversal (0 s). (B) As in A, but recorded during walking.
Author response image 8.
Time–frequency representations of EEG power changes during visuomotor mismatch and playback halt responses. (A) Time–frequency maps showing changes in spectral power relative to baseline for electrodes Fp1–2, C3–4, P3–4, and O1–2 following visuomotor mismatch presentation. Dashed vertical red lines are onset and offset of the visuomotor mismatch. (B) As in A, but for playback halts.
Author response image 9.
Inter-trial phase coherence (ITPC) for the visuomotor mismatch and playback halt responses. (A) ITPC across trials for electrode pairs Fp1–2, C3–4, P3–4, and O1–2 following visuomotor mismatch presentation. Dashed vertical red lines are onset and offset of the visuomotor mismatch. (B) As in A, but for playback halts.
Finally, the sentence in the abstract that this paradigm " can trigger strong prediction error responses and consequently requires shorter recording times would simplify experiments in a clinical setting" is a nice setup to the paper, but the very fact that one third of recordings had to be removed due to movement artifact, and that hairstyle modulates the recording SnR, is reason that this paradigm, using the reported equipment, may have limited clinical utility in its current form. Further, auditory oddball paradigms are of great clinical utility because they do not require explicit attention and can be recorded very quickly with no behavioral involvement of a hospitalized patient. This should be discussed, although it does not detract from the overall scientific importance of the study. The authors should reconsider putting this statement in the abstract.
We have added a paragraph to the discussion to address these points. Note, we get robust and strong responses with very few trials (Author response image 2). The fact that we need to discard up to 21.7 % of trials due to movement/eye blink artefacts, does little to change the fact that we need much fewer trials and have larger and more robust responses compared to other EEG paradigms. Finally, we understand that sometimes not needing participants to pay attention to the task is useful. However, having a paradigm that is engaging and fun for participants and takes 5 minutes of recording time is probably equally often of advantage.
Reviewer #3 (Recommendations for the authors):
Minor points:
(1) In the Introduction, I'm not sure that the logic comes through as to what the authors aim to illustrate by comparing mice to humans, in terms of precision and "movement modulation". In some cases, the precision of the comparison is referred to, and in others, the precision of the prediction (I think?). I'm not sure if they mean for this to be different or not. Simlarly, on line 81, "If indeed the precision of visuomotor coupling determines the amount of motor modulation of visual responses" - here I'm a little confused, as "amount of motor modulation" to me, the term "modulation" refers to a conditional modifier (if moving, than suppress visual movement resposnes. if not moving, then amplify visual movement repssones) rather than movement driven activity. The way I'm reading it, the authors mean the latter, but I could be misunderstanding.
We have rephrased this section of the introduction.
(2) I think it could be helpful, in the sentence starting on line 65, to reiterate that this observation of higher-than-expected motor activity in V1 is in mice (if I'm understanding it correctly). I also found myself tangled up in the difference between motor-related activity in V1 and motor-modulation in V1 in this paragraph.
We have rephrased this section of the introduction.
(3) For signal power, was the amplitude squared on individual trials prior to averaging, or after averaging? If prior, it would help with separating amplitude modulations from phase variance.
In our previous analysis, power was computed by squaring the amplitude after trial averaging (Author response image 10A). We repeated the analysis using the alternative approach in which power was calculated for individual trials and then averaged (Author response image 10B). Although this method yields substantially higher absolute power values, the overall pattern of results remains unchanged: visuomotor mismatch responses continue to show significantly higher power than visual responses. To look at the phase variance we additionally analyze inter-trial phase coherence (Author response image 7 and Author response image 9).
Author response image 10.
Visuomotor mismatch responses have more power compared to visual responses. (A) Comparison of power between visuomotor mismatch and visual responses, calculated within a 0 - 0.5 s time window following stimulus onset. Power was computed by squaring the amplitude after trial averaging. Boxes indicate the median and interquartile range, with whiskers showing the range excluding outliers; circles represent data from individual participants. ***p < 0.001. (B) Same comparison as in (A), but with power calculated by squaring the amplitude of individual trials prior to averaging.
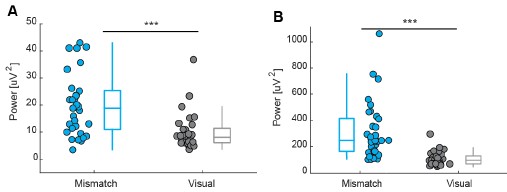
(4) The "the world suddenly flew forward!" response from the participant, I understand, and I believe that it is useful to illustrate a point. I do not understand the "Are you printing this? - Hi Mom! " part of the participant response, and I'm not sure it adds to the paper, beyond amusement, which seems inappropriate.
One of the authors (the one who did none of the experiments) finds this endlessly hilarious and as the reviewer notes, it might add amusement more generally. “Inappropriate” might be a bit harsh – according to our favorite AI chatbot: “Amusement provides significant mental, physical, and social value by offering a necessary escape from routine, reducing stress, and fostering a connection. It enhances well-being through endorphin-releasing experiences and encourages social bonding, learning, and joy.” Nevertheless, we have censored the offending passage.
Aizenbud, I., Audette, N., Auksztulewicz, R., Basiński, K., Bastos, A.M., Berry, M., Canales-Johnson, A., Choi, H., Clopath, C., Cohen, U., Costa, R.P., Filippo, R.D., Doronin, R., Errington, S.P., Gavornik, J.P., Gillon, C.J., Granier, A., Hamm, J.P., Hertäg, L., Kennedy, H., Kumar, S., Ladd, A., Ladret, H., Lecoq, J.A., Maier, A., McCarthy, P., Mei, J., Mejias, J., Mikulasch, F., Mudrik, N., Najafi, F., Nejad, K., Nejat, H., Oweiss, K., Petrovici, M.A., Priesemann, V., Rudelt, L., Ruediger, S., Russo, S., Salatiello, A., Senn, W., Sennesh, E., Sima, S., Uran, C., Vasilevskaya, A., Vezoli, J., Vinck, M., Westerberg, J.A., Wilmes, K., Xiong, Y.S., 2025. Neural mechanisms of predictive processing: a collaborative community experiment through the OpenScope program. https://doi.org/10.48550/arXiv.2504.09614
Bastos, A.M., Usrey, W.M., Adams, R.A., Mangun, G.R., Fries, P., Friston, K.J., 2012. Canonical microcircuits for predictive coding. Neuron 76, 695–711. https://doi.org/10.1016/j.neuron.2012.10.038
Cavanagh, J.F., 2015. Cortical delta activity reflects reward prediction error and related behavioral adjustments, but at different times. NeuroImage 110, 205–216. https://doi.org/10.1016/j.neuroimage.2015.02.007
Delorme, A., Makeig, S., 2004. EEGLAB: an open source toolbox for analysis of single-trial EEG dynamics including independent component analysis. J. Neurosci. Methods 134, 9–21. https://doi.org/10.1016/j.jneumeth.2003.10.009
Gramann, K., Gwin, J.T., Bigdely-Shamlo, N., Ferris, D.P., Makeig, S., 2010. Visual evoked responses during standing and walking. Front. Hum. Neurosci. 4, 202. https://doi.org/10.3389/fnhum.2010.00202
Heindorf, M., Keller, G.B., 2024. Antipsychotic drugs selectively decorrelate long-range interactions in deep cortical layers. eLife 12, RP86805. https://doi.org/10.7554/eLife.86805
Keller, G.B., Hahnloser, R.H.R., 2009. Neural processing of auditory feedback during vocal practice in a songbird. Nature 457, 187–90. https://doi.org/10.1038/nature07467
Keller, G.B., Mrsic-Flogel, T.D., 2018. Predictive Processing: A Canonical Cortical Computation. Neuron 100, 424–435. https://doi.org/10.1016/j.neuron.2018.10.003
Oliveira, A.S., Schlink, B.R., Hairston, W.D., König, P., Ferris, D.P., 2016. Proposing Metrics for Benchmarking Novel EEG Technologies Towards Real-World Measurements. Front. Hum. Neurosci. 10, 188. https://doi.org/10.3389/fnhum.2016.00188
O’Toole, S.M., Oyibo, H.K., Keller, G.B., 2023. Molecularly targetable cell types in mouse visual cortex have distinguishable prediction error responses. Neuron 111, 2918-2928.e8. https://doi.org/10.1016/j.neuron.2023.08.015
Rao, R.P.N., Ballard, D.H., 1999. Predictive coding in the visual cortex: a functional interpretation of some extra-classical receptive-field effects. Nat. Neurosci. 2, 79–87. https://doi.org/10.1038/4580
Vasilevskaya, A., Widmer, F.C., Keller, G.B., Jordan, R., 2023. Locomotion-induced gain of visual responses cannot explain visuomotor mismatch responses in layer 2/3 of primary visual cortex. Cell Rep. 42, 112096. https://doi.org/10.1016/j.celrep.2023.112096
Webb, J.M., Sohoglu, E., 2025. Cortical tracking of prediction error during perception of connected speech. https://doi.org/10.1101/2025.07.18.665498
West, C.L., Bastos, G., Duran, A., Nadeem, S., Ricci, D., Groves, A.M.R., Wargo, J.A., Peterka, D.S., Leeuwen, N.V., Hamm, J.P., 2024. A lasting impact of serotonergic psychedelics on visual processing and behavior. https://doi.org/10.1101/2024.07.03.601959
-
eLife Assessment
This valuable study demonstrates that self-motion strongly affects neural responses to visual stimuli, comparing humans moving through a virtual environment to passive viewing. However, evidence that the modulation is due to prediction is incomplete as it stands, since participants may come to expect visual freezes over the course of the experiment. This study bridges human and rodent studies on the role of prediction in sensory processing, and is therefore expected to be of interest to a large community of neuroscientists.
-
Reviewer #1 (Public review):
In this paper, the authors wished to determine human visuomotor mismatch responses in EEG in a VR setting. Participants were required to walk around a virtual corridor, where a mismatch was created by halting the display for 0.5s. This occurred every 10-15 seconds. They observe an occipital mismatch signal at 180 ms. They determine the specificity of this signal to visuomotor mismatch by subsequently playing back the same recording passively. They also show qualitatively that the mismatch response is larger than one generated in a standard auditory oddball paradigm. They conclude that humans therefore exhibit visuomotor mismatch responses like mice, and that this may provide an especially powerful paradigm for studying prediction error more generally.
Asking about the role of visuomotor prediction in sensory …
Reviewer #1 (Public review):
In this paper, the authors wished to determine human visuomotor mismatch responses in EEG in a VR setting. Participants were required to walk around a virtual corridor, where a mismatch was created by halting the display for 0.5s. This occurred every 10-15 seconds. They observe an occipital mismatch signal at 180 ms. They determine the specificity of this signal to visuomotor mismatch by subsequently playing back the same recording passively. They also show qualitatively that the mismatch response is larger than one generated in a standard auditory oddball paradigm. They conclude that humans therefore exhibit visuomotor mismatch responses like mice, and that this may provide an especially powerful paradigm for studying prediction error more generally.
Asking about the role of visuomotor prediction in sensory processing is of fundamental importance to understanding perception and action control, but I wasn't entirely sure what to conclude from the present paradigm or findings. Visuomotor prediction did not appear to have been functionally isolated. I hope the comments below are helpful.
(1) First, isolating visuomotor prediction by contrasting against a condition where the same video stream is played back subsequently does not seem to isolate visuomotor prediction. This condition always comes second, and therefore, predictability (rather than specifically visuomotor predictability) differs. Participants can learn to expect these screen freezes every 10-15 s, even precisely where they are in the session, and this will reduce the prediction error across time. Therefore, the smaller response in the passive condition may be partly explained by such learning. It's impossible to fully remove this confound, because the authors currently play back the visual specifics from the visuomotor condition, but given that the visuomotor correspondences are otherwise pretty stable, they could have an additional control condition where someone else's visual trace is played back instead of their own, and order counterbalanced. Learning that the freezes occur every 10-15 s, or even precisely where they occur, therefore, could not explain condition differences. At a minimum, it would be nice to see the traces for the first and second half of each session to see the extent to which the mismatch response gets smaller. This won't control for learning about the specific separations of the freezes, but it's a step up from the current information.
(2) Second, the authors admirably modified their visual-only condition to remove nausea from 6 df of movement (3D position, pitch, yaw, and roll). However, despite the fact it's far from ideal to have nauseous participants, it would appear from the figures that these modifications may have changed the responses (despite some pairwise lack of significance with small N). Specifically, the trace in S3 (6DOF) and 2E look similar - i.e., comparing the visuomotor condition to the visual condition that matches. Mismatch at 4/5 microvolts in both. Do these significantly differ from each other?
(3) It generally seems that if the authors wish to suggest that this paradigm can be used to study prediction error responses, they need to have controlled for the actions performed and the visual events. This logic is outlined in Press, Thomas, and Yon (2023), Neurosci Biobehav Rev, and Press, Kok, and Yon (2020) Trends Cogn Sci ('learning to perceive and perceiving to learn'). For example, always requiring Ps to walk and always concurrently playing similar visual events, but modifying the extent to which the visual events can be anticipated based on action. Otherwise, it seems more accurately described as a paradigm to study the influence of action on perception, which will be generated by a number of intertwined underlying mechanisms.
More minor points:
(1) I was also wondering whether the authors may consider the findings in frontal electrodes more closely. Within the statistical tests of the frontal electrodes against 0, as displayed in Figure 3c, the insignificance of the effect of Fp2 seems attributable to the small included sample size of just 13 participants for this electrode, as listed in Table S1, in combination with a single outlier skewing the result. The small sample size stands out especially in comparison to the sample size at occipital electrodes, which is double and therefore enjoys far more statistical power. It looks like the selected time window is not perfectly aligned for determining a frontal effect, and also the distribution in 3B looks like responses are absent in more central electrodes but present in occipital and frontal ones. I realise the focus of analysis is on visual processing, but there are likely to be researchers who find the frontal effect just as interesting.
(2) It is claimed throughout the manuscript that the 'strongest predictor (of sensory input) - by consistency of coupling - is self-generated movement'. This claim is going to be hard to validate, and I wonder whether it might be received better by the community to be framed as an especially strong predictor rather than necessarily the strongest. If I hear an ambulance siren, this is an especially strong predictor of subsequent visual events. If I see a traffic light turn red, then yellow, I can be pretty certain what will happen next. Etc.
(3) The checkerboard inversion response at 48 ms is incredibly rapid. Can the authors comment more on what may drive this exceptionally fast response? It was my understanding that responses in this time window can only be isolated with human EEG by presenting spatially polarized events (cf. c1, e.g., Alilovic, Timmermans, Reteig, van Gaal, Slagter, 2019, Cerebral Cortex)
-
Reviewer #2 (Public review):
Summary:
This study investigates whether visuomotor mismatch responses can be detected in humans. By adapting paradigms from rodent studies, the authors report EEG evidence of mismatch responses during visuomotor conditions and compare them to visual-only stimulation and mismatch responses in other modalities.
Strengths:
(1) The authors use a creative experimental design to elicit visuomotor mismatch responses in humans.
(2) The study provides an initial dataset and analytical framework that could support future research on human visuomotor prediction errors.
Weaknesses:
(1) Methodological issues (e.g., volume conduction, channel selection, lack of control for eye movements) make it difficult to confidently attribute the observed mismatch responses to activity in visual cortical regions.
(2) A very large …
Reviewer #2 (Public review):
Summary:
This study investigates whether visuomotor mismatch responses can be detected in humans. By adapting paradigms from rodent studies, the authors report EEG evidence of mismatch responses during visuomotor conditions and compare them to visual-only stimulation and mismatch responses in other modalities.
Strengths:
(1) The authors use a creative experimental design to elicit visuomotor mismatch responses in humans.
(2) The study provides an initial dataset and analytical framework that could support future research on human visuomotor prediction errors.
Weaknesses:
(1) Methodological issues (e.g., volume conduction, channel selection, lack of control for eye movements) make it difficult to confidently attribute the observed mismatch responses to activity in visual cortical regions.
(2) A very large portion of the data was excluded due to motion artefacts, raising concerns about statistical power and representativeness. The criteria for trial inclusion and the number of accepted trials per participant appear arbitrary and not justified with reference to EEG reliability standards.
(3) The comparison across sensory modalities (e.g., auditory vs. visual mismatch responses) is conceptually interesting, but due to the choice of analyzing auditory mismatch responses over occipital channels, it has limited interpretability.
The authors successfully demonstrate that visuomotor mismatch paradigms can, in principle, be applied in human EEG. However, due to the issues outlined above, the current findings are relatively preliminary. If validated with improved methodology, this approach could significantly advance our understanding of predictive processing in the human visual system and provide a translational bridge between rodent and human work.
-
Reviewer #3 (Public review):
Summary:
Solyga, Zelechowski, and Keller present a concise report of an innovative study demonstrating clear visuomotor mismatch responses in ambulating humans, using a mobile EEG setup and virtual reality. Human subjects walked around a virtual corridor while EEGs were recorded. Occasionally, motion and visual flow were uncoupled, and this evoked a mismatch response that was strongest in occipitally placed electrodes and had a considerable signal-to-noise ratio. It was robust across participants and could not be explained by the visual stimulus alone.
Strengths:
This is an important extension of their prior work in mice, and represents an elegant translation of those previous findings to humans, where future work can inform theories of e.g., psychiatric diseases that are believed to involve disordered …
Reviewer #3 (Public review):
Summary:
Solyga, Zelechowski, and Keller present a concise report of an innovative study demonstrating clear visuomotor mismatch responses in ambulating humans, using a mobile EEG setup and virtual reality. Human subjects walked around a virtual corridor while EEGs were recorded. Occasionally, motion and visual flow were uncoupled, and this evoked a mismatch response that was strongest in occipitally placed electrodes and had a considerable signal-to-noise ratio. It was robust across participants and could not be explained by the visual stimulus alone.
Strengths:
This is an important extension of their prior work in mice, and represents an elegant translation of those previous findings to humans, where future work can inform theories of e.g., psychiatric diseases that are believed to involve disordered predictive processing. For the most part, the authors are appropriately circumspect in their interpretations and discussions of the implications. I found the discussion of the polarity differences they found in light of separate positive and negative prediction errors, intriguing.
Weaknesses:
The primary weaknesses rest in how the results are sold and interpreted.
Most notably, the interpretation of the results of the comparison of visuomotor mismatches to the passive auditory oddball induced mismatch responses is inappropriate, as suboptimal electrode choices, unclear matching of trial numbers, and other factors. To clarify, regarding the auditory oddball portion in Figure 5, the data quality is a concern for the auditory ERPs, and the choice of Occipital electrodes is a likely culprit. Typically, auditory evoked responses are maximal at Cz or FCz, although these contacts don't seem to be available with this setup. In general, caution is warranted in comparing ERP peaks between two different sensory modalities - especially if attention is directed elsewhere (to a silent movie) during one recording and not during the other. The authors discuss this as a purely "qualitative" comparison in the text, which is appreciated, and do acknowledge the limitations within the results section, but the figure title and, importantly, the abstract set a different tone. At least, for comparisons between auditory mismatch and visuomotor mismatch, trial numbers need to be equated, as ERP magnitude can be augmented by noise (which reduces with increased numbers of trials in the average). And more generally, the size of the mismatch event at the scalp does not scale one-to-one with the size at the level of the neural tissue. One can imagine a number of variables that impact scalp level magnitudes, which are orthogonal to actual cortex-level activation - the size, spread, and polarity variance of the activated source (which all would diminish amplitude at the scalp due to polyphasic summation/cancelation). The variance of phase to a stimulus across trials (cross trial phase locking) vs magnitude of underlying power - the former, in theory, relates to bottom-up activity and the latter can reflect feedback (which has more variability in time across trials; the distance of the scalp electrode from the activated tissue (which, for the auditory system, would be larger (FCz to superior temporal gyrus) than for the visual system (O1 to V1/2)). None of this precludes the inclusion of the auditory mismatch, which is a strength of the study, but interpretations about this supporting a supremacy of sensory-motor mismatch - regardless of validity - are not warranted. I would recommend changing the way this is presented in the abstract.
Otherwise, the data are of adequate quality to derive most of their conclusions.
The authors claim that the mismatch responses emanate from within the occipital cortex, but I would require denser scalp coverage or a demonstration of consistent impedances across electrodes and across subjects to make conclusions about the underlying cortical sources (especially given the latencies of their peaks). In EEG, the distribution of voltage on the scalp is, of course, related to but not directly reflective of the distribution of the underlying sources. The authors are mostly careful in their discussion of this, but I would strongly recommend changing the work choice of "in occipital cortex" to "over occipital cortex" or even "posteriorly distributed". Even with very dense electrode coverage and co-registration to MRIs for the generation of forward models that constrain solutions, source localization of EEG signals is very challenging and not a simple problem. Given the convoluted and interior nature of human V1, the ability to reliably detect early evoked responses (which show the mismatch in mouse models) at the scalp in ERP peaks is challenging - especially if one is collapsing ERPs across subjects. And - given the latency of the mismatch responses, I'd imagine that many distributed cortical regions contribute to the responses seen at the scalp.
I think that Figure 3C, but as a difference of visual mismatch vs halting flow alone (in the open loop) might be additionally informative, as it clarifies exactly where the pure "mismatch" or prediction error is represented.
As a suggestion, the authors are encouraged to analyse time-frequency power and phase locking for these mismatch responses, as is common in much of the literature (see Roach et al 2008, Schizophrenia Bulletin). This is not to say that doing so will yield insights into oscillations per se, but converting the data to the time-frequency domain provides another perspective that has some advantages. It fosters translations to rodent models, as ERP peaks do not map well between species, but e.g., delta-theta power does (see Lee et al 2018, Neuropsychopharmacology; Javitt et al 2018, Schizophrenia research; Gallimore et al 2023, Cereb Ctx). Further, ERP peaks can be influenced by the actual neuroanatomy of an individual (especially for quantifying V1 responses). Time frequency analyses may aid in interpreting the "early negative deflection with a peak latency of 48 ms " finding as well.
Finally, the sentence in the abstract that this paradigm " can trigger strong prediction error responses and consequently requires shorter recording 20 times would simplify experiments in a clinical setting" is a nice setup to the paper, but the very fact that one third of recordings had to be removed due to movement artifact, and that hairstyle modulates the recording SnR, is reason that this paradigm, using the reported equipment, may have limited clinical utility in its current form. Further, auditory oddball paradigms are of great clinical utility because they do not require explicit attention and can be recorded very quickly with no behavioral involvement of a hospitalized patient. This should be discussed, although it does not detract from the overall scientific importance of the study. The authors should reconsider putting this statement in the abstract.
-
-
