Adaptive behavior is guided by integrated representations of controlled and non-controlled information
Curation statements for this article:-
Curated by eLife

eLife Assessment
This useful study uses creative scalp EEG decoding methods to attempt to demonstrate that two forms of learned associations in a Stroop task are dissociable, despite sharing similar temporal dynamics. However, the evidence supporting the conclusions is incomplete due to concerns with the experimental design and methodology. This paper would be of interest to researchers studying cognitive control and adaptive behavior, if the concerns raised in the reviews can be addressed satisfactorily.
This article has been Reviewed by the following groups
Discuss this preprint
Start a discussion What are Sciety discussions?Listed in
- Evaluated articles (eLife)
Abstract
Understanding how task knowledge is encoded neurally is crucial for uncovering the mechanisms underlying adaptive behavior. Here, we test the theory that all task information is integrated into a conjunctive task representation by investigating whether this representation simultaneously includes two types of associations that can guide behavior: stimulus-response (non-controlled) associations and stimulus-control (controlled) associations that inform how task focus should be adjusted to achieve goal-directed behavior. We extended the classic item-specific proportion congruency paradigm to dissociate the electroencephalographic (EEG) representations of controlled and non-controlled associations. Behavioral data replicated previous findings of association-driven adaptive behaviors. Decoding analyses of EEG data further showed that associations of controlled and non-controlled information were represented concurrently and differentially. Brain-behavioral analyses also showed that the strength of both associations was associated with faster responses. These findings support the idea that controlled and non-controlled associations are governed by an integrated task representation to guide adaptive behaviors simultaneously.
Article activity feed
-

eLife Assessment
This useful study uses creative scalp EEG decoding methods to attempt to demonstrate that two forms of learned associations in a Stroop task are dissociable, despite sharing similar temporal dynamics. However, the evidence supporting the conclusions is incomplete due to concerns with the experimental design and methodology. This paper would be of interest to researchers studying cognitive control and adaptive behavior, if the concerns raised in the reviews can be addressed satisfactorily.
-
Reviewer #1 (Public review):
Summary:
This study focuses on characterizing the EEG correlates of item-specific proportion congruency effects. Two types of learned associations are characterized, one being associations between stimulus features and control states (SC), and the other being stimulus features and responses (SR). Decoding methods are used to identify time-resolved SC and SR correlates, which are used to test properties of their dynamics.
The conclusion is reached that SC and SR associations can independently and simultaneously guide behavior. This conclusion is based on results showing SC and SR correlates are: (1) not entirely overlapping in cross-decoding; (2) simultaneously observed on average over trials in overlapping time bins; (3) independently correlate with RT; and (4) have a positive within-trial correlation.
Streng…
Reviewer #1 (Public review):
Summary:
This study focuses on characterizing the EEG correlates of item-specific proportion congruency effects. Two types of learned associations are characterized, one being associations between stimulus features and control states (SC), and the other being stimulus features and responses (SR). Decoding methods are used to identify time-resolved SC and SR correlates, which are used to test properties of their dynamics.
The conclusion is reached that SC and SR associations can independently and simultaneously guide behavior. This conclusion is based on results showing SC and SR correlates are: (1) not entirely overlapping in cross-decoding; (2) simultaneously observed on average over trials in overlapping time bins; (3) independently correlate with RT; and (4) have a positive within-trial correlation.
Strengths:
Fearless, creative use of EEG decoding to test tricky hypotheses regarding latent associations.
Nice idea to orthogonalize ISPC condition (MC/MI) from stimulus features.
Weaknesses:
I still have my concern from the first round that the decoders are overfit to temporally structured noise. As I wrote before, the SC and SR classes are highly confounded with phase (chunk of session). I do not see how the control analyses conducted in the revision adequately deal with this issue.
In the figures, there are several hints that these decoders are biased. Unfortunately, the figures are also constructed in such a way that hides or diminishes the salience of the clues of bias. This bias and lack of transparency discourage trust in the methods and results.
I have two main suggestions:
(1) Run a new experiment with a design that properly supports this question.
I don't make this suggestion lightly, and I understand that it may not be feasible to implement given constraints; but I feel that this suggestion is warranted. The desired inferences rely on successful identification of SC and SR representations. Solidly identifying SC and SR representations necessitates an experimental design wherein these variables are sufficiently orthogonalized, within-subject, from temporally structured noise. The experimental design reported in this paper unfortunately does not meet this bar, in my opinion (and the opinion of a colleague I solicited).
An adequate design would have enough phases to properly support "cross-phase" cross-validation. Deconfounding temporal noise is a basic requirement for decoding analyses of EEG and fMRI data (see e.g., leave-one-run-out CV that is effectively necessary in fMRI; in my experience, EEG is not much different, when the decoded classes are blocked in time, as here). In a journal with a typical acceptance-based review process, this would be grounds for rejection.
Please note that this issue of decoder bias would seem to weaken the rest of the downstream analyses that are based on the decoded values. For instance, if the decoders are biased, in the within-trial correlation analysis, how can we be sure that co-fluctuations along certain dimensions within their projected values are driven by signal or noise? A similar issue clouds the LMM decoding-RT correlations.
(2) Increase transparency in the reporting of results throughout main text.
Please do not truncate stimulus-aligned timecourses at time=0. Displaying the baseline period is very useful to identify bias, that is, to verify that stimulus-dependent conditions cannot be decoded pre-stimulus. Bias is most expected to be revealed in the baseline interval when the data are NOT baseline-corrected, which is why I previously asked to see the results omitting baseline correction. (But also note that if the decoders are biased, baseline-correcting would not remove this bias; instead, it would spread it across the rest of the epoch, while the baseline interval would, on average, be centered at zero.)
Please use a more standard p-value correction threshold, rather than Bonferroni-corrected p<0.001. This threshold is unusually conservative for this type of study. And yet, despite this conservativeness, stimulus-evoked information can be decoded from nearly every time bin, including at t=0. This does not encourage trust in the accuracy of these p-values. Instead, I suggest using permutation-based cluster correction, with corrected p<0.05. This is much more standard and would therefore allow for better comparison to many other studies.
I don't think these things should be done as control analyses, tucked away in the supplemental materials, but instead should be done as a part of the figures in the main text -- including decoding, RSA, cross-trial correlations, and RT correlations.
Other issues:
Regarding the analysis of the within-trial correlation of RSA betas, and "Cai 2019" bias:
The correction that authors perform in the revision -- estimating the correlation within the baseline time interval and subtracting this estimate from subsequent timepoints -- assumes that the "Cai 2019" bias is stationary. This is a fairly strong assumption, however, as this bias depends not only on the design matrix, but also on the structure of the noise (see the Cai paper), which can be non-stationary. No data were provided in support of stationarity. It seems safer and potentially more realistic to assume non-stationarity.
This analysis was included in the supplemental material. However, given that the correlation analysis presented in the Results is subject to the "Cai 2019" bias, it would seem to be more appropriate to replace that analysis, rather than supplement it.
Regardless, this seems to be a moot issue, given that the underlying decoders seem to be overfit to temporally structured noise (see point above regarding weakening of downstream analyses based on decoder bias).
Outliers and t-values:
More outliers with beta coefficients could be because the original SD estimates from the t-values are influenced more by extreme values. When you use a threshold on the median absolute deviation instead of mean +/-SD, do you still get more outliers with beta coefficients vs t-values?
Random slopes:
Were random slopes (by subject) for all within-subject variables included in the LMMs? If not, please include them, and report this in the Methods.
-
Reviewer #2 (Public review):
Summary:
In this EEG study, Huang et al. investigated the relative contribution of two accounts to the process of conflict control, namely the stimulus-control association (SC), which refers to the phenomenon that the ratio of congruent vs. incongruent trials affects the overall control demands, and the stimulus-response association (SR), stating that the frequency of stimulus-response pairings can also impact the level of control. The authors extended the Stroop task with novel manipulation of item congruencies across blocks in order to test whether both types of information are encoded and related to behaviour. Using decoding and RSA they showed that the SC and SR representations were concurrently present in voltage signals and they also positively co-varied. In addition, the variability in both of their …
Reviewer #2 (Public review):
Summary:
In this EEG study, Huang et al. investigated the relative contribution of two accounts to the process of conflict control, namely the stimulus-control association (SC), which refers to the phenomenon that the ratio of congruent vs. incongruent trials affects the overall control demands, and the stimulus-response association (SR), stating that the frequency of stimulus-response pairings can also impact the level of control. The authors extended the Stroop task with novel manipulation of item congruencies across blocks in order to test whether both types of information are encoded and related to behaviour. Using decoding and RSA they showed that the SC and SR representations were concurrently present in voltage signals and they also positively co-varied. In addition, the variability in both of their strengths was predictive of reaction time. In general, the experiment has a sold design and the analyses are appropriate for the research questions.
Strength:
(1) The authors used an interesting task design that extended the classic Stroop paradigm and is effective in teasing apart the relative contribution of the two different accounts regarding item-specific proportion congruency effect.
(2) Linking the strength of RSA scores with behavioural measure is critical to demonstrating the functional significance of the task representations in question.
Weakness:
(1) The distinction between Phase 2 and Phase 1&3 behavioral results, specifically the opposite effect of MC/MI in congruent trials raises some concerns with regard to the effectiveness of the ISPC manipulation. Why do RTs and error rates under MC congruent condition in Phase 2 seem to be worse than MI congruent? Could there be other factors at play here, e.g. order effect? How does this potentially affect the neural analyses where trials from different phases were combined? Also, the manuscript does not mention whether there is counterbalancing for the color groups across participants, so far as I can tell.
-
Author response:
The following is the authors’ response to the original reviews.
eLife Assessment
This useful study uses creative scalp EEG decoding methods to attempt to demonstrate that two forms of learned associations in a Stroop task are dissociable, despite sharing similar temporal dynamics. However, the evidence supporting the conclusions is incomplete due to concerns with the experimental design and methodology. This paper would be of interest to researchers studying cognitive control and adaptive behavior, if the concerns raised in the reviews can be addressed satisfactorily.
We thank the editors and the reviewers for their positive assessment of our work and for providing us with an opportunity to strengthen this manuscript. Please see below our responses to each comment raised in the reviews.
Public Reviews:
Reviewer #1 …
Author response:
The following is the authors’ response to the original reviews.
eLife Assessment
This useful study uses creative scalp EEG decoding methods to attempt to demonstrate that two forms of learned associations in a Stroop task are dissociable, despite sharing similar temporal dynamics. However, the evidence supporting the conclusions is incomplete due to concerns with the experimental design and methodology. This paper would be of interest to researchers studying cognitive control and adaptive behavior, if the concerns raised in the reviews can be addressed satisfactorily.
We thank the editors and the reviewers for their positive assessment of our work and for providing us with an opportunity to strengthen this manuscript. Please see below our responses to each comment raised in the reviews.
Public Reviews:
Reviewer #1 (Public review):
Summary:
This study focuses on characterizing the EEG correlates of item-specific proportion congruency effects. In particular, two types of learned associations are characterized. One being associations between stimulus features and control states (SC), and the other being stimulus features and responses (SR). Decoding methods are used to identify SC and SR correlates and to determine whether they have similar topographies and dynamics.
The results suggest SC and SR associations are simultaneously coactivated and have shared topographies, with the inference being that these associations may share a common generator.
Strengths:
Fearless, creative use of EEG decoding to test tricky hypotheses regarding latent associations. Nice idea to orthogonalize the ISPC condition (MC/MI) from stimulus features.
Thank you for acknowledging the strength in EEG decoding and design. We have addressed all your concerns raised below point by point.
Weaknesses:
(1a) I'm relatively concerned that these results may be spurious. I hope to be proven wrong, but I would suggest taking another look at a few things.
While a nice idea in principle, the ISPC manipulation seems to be quite confounded with the trial number. E.g., color-red is MI only during phase 2, and is MC primarily only during Phase 3 (since phase 1 is so sparsely represented). In my experience, EEG noise is highly structured across a session and easily exploited by decoders. Plus, behavior seems quite different between Phase 2 and Phase 3. So, it seems likely that the classes you are asking the decoder to separate are highly confounded with temporally structured noise.
I suggest thinking of how to handle this concern in a rigorous way. A compelling way to address this would be to perform "cross-phase" decoding, however I am not sure if that is possible given the design.
Thank you for raising this important issue. To test whether decoding might be confounded by temporally structured noise, we performed a control decoding analysis. As the reviewer correctly pointed out, cross-phase decoding is not possible due to the experimental design. Alternatively, to maximize temporal separation between the training and test data, we divided the EEG data in phase 2 and phase 1&3 into the first and second half chronologically. Phase 1 and 3 were combined because they share the same MC and MI assignments. We then trained the decoders on one half and tested them on the other half. Finally, we averaged the decoding results across all possible assignments of training and test data. The similar patterns (Supplementary Fig.1) observed confirmed that the decoding results are unlikely to be driven by temporally structured noise in the EEG data. The clarification has been added to page 13 of the revised manuscript.
(1b) The time courses also seem concerning. What are we to make of the SR and SC timecourses, which have aggregate decoding dynamics that look to be <1Hz?
As detailed in the response to your next comment, some new results using data without baseline correction show a narrower time window of above-chance decoding. We speculate that the remaining results of long-lasting above-chance decoding could be attributed to trials with slow responses (some responses were made near the response deadline of 1500 ms). Additionally, as shown in Figure 6a, the long-lasting above-chance decoding seems to be driven by color and congruency representations. Thus, it is also possible that the binding of color and congruency contributes to decoding. This interpretation has been added to page 17 of the revised manuscript.
(1c) Some sanity checks would be one place to start. Time courses were baselined, but this is often not necessary with decoding; it can cause bias (10.1016/j.jneumeth.2021.109080), and can mask deeper issues. What do things look like when not baselined? Can variables be decoded when they should not be decoded? What does cross-temporal decoding look like - everything stable across all times, etc.?
As the reviewer mentioned, baseline-corrected data may introduce bias to the decoding results. Thus, we cited the van Driel et al (2021) paper in the revised manuscript to justify the use of EEG data without baseline-correction in decoding analysis (Page 27 of the revised manuscript), and re-ran all decoding analysis accordingly. The new results revealed largely similar results (Fig. 2, 4, 6 and 8 in the revised manuscript) with the following exceptions: narrower time window for separatable SC subspace and SR subspace (Fig. 4b), narrower time window for concurrent representations of SC and SR (Fig. 6a-b), and wider time window for the correlations of SC/SR representations with RTs (Fig. 8).
(2) The nature of the shared features between SR and SC subspaces is unclear.
The simulation is framed in terms of the amount of overlap, revealing the number of shared dimensions between subspaces. In reality, it seems like it's closer to 'proportion of volume shared', i.e., a small number of dominant dimensions could drive a large degree of alignment between subspaces.
What features drive the similarity? What features drive the distinctions between SR and SC? Aside from the temporal confounds I mentioned above, is it possible that some low-dimensional feature, like EEG congruency effect (e.g., low-D ERPs associated with conflict), or RT dynamics, drives discriminability among these classes? It seems plausible to me - all one would need is non-homogeneity in the size of the congruency effect across different items (subject-level idiosyncracies could contribute: 10.1016/j.neuroimage.2013.03.039).
Thank you for this question. To test what dimensions are shared between SC and SR subspaces, we first identify which factors can be shared across SC and SR subspaces. For SC, the eight conditions are the four colors × ISPC. Thus, the possible shared dimensions are color and ISPC. Additionally, because the four colors and words are divided into two groups (e.g., red-blue and green-yellow, counterbalanced across subjects, see Methods), the group is a third potential shared dimension. Similarly, for SR decoders, potential shared dimensions are word, ISPC and group. Note that each class in SC and SR decoders has both congruent and incongruent trials. Thus, congruency is not decodable from SC/SR decoders and hence unlikely to be a shared dimension in our analysis. To test the effect of sharing for each of the potential dimensions, we performed RSA on decoding results of the SC decoder trained on SR subspace (SR | SC) (Supplementary Fig. 4a) and the SR decoder trained on SC subspace (SC | SR) (Supplementary Fig. 4b), where the decoders indicated the decoding accuracy of shared SC and SR representations. In the SC classes of SR | SC, word red and blue were mixed within the same class, same were word yellow and green. The similarity matrix for “Group” of SR | SC (Supplementary Fig. 4a) shows the comparison between two word groups (red & blue vs. yellow & green). The similarity matrix for “Group” of SC | SR (Supplementary Fig. 4b) shows the comparison between two color groups (red & blue vs. yellow & green).
The RSA results revealed that the contributions of group to the SC decoder (Supplementary Fig. 5a) and the SR decoder (Supplementary Fig. 5b) were significant. Meanwhile, a wider time window showed significant effect of color on the SC decoder (approximately 100 - 1100 ms post-stimulus onset, Supplementary Fig. 5a) and a narrower time window showed significant effect of word on SR decoder (approximately 100 - 500 ms post-stimulus onset, Supplementary Fig. 5b). However, we found no significant effect of ISPC on either SC or SR decoders. We also performed the same analyses on response-locked data from the time window -800 to 200 ms. The results showed shared representation of color in the SC decoder (Supplementary Fig. 5c) and group in both decoders (Supplementary Fig. 5c-d). Overall, the above results demonstrated that color, word and group information are shared between SC and SR subspaces.
Lastly, we would like to stress that our main hypothesis for the cross-subspace decoding analysis is that SR and SC subspaces are not identical. This hypothesis was supported by lower decoding accuracy for cross-subspace than within-subspace decoders and enables following analyses that treated SC and SR as separate representations.
We have added the interpretation to page 13-14 of the revised manuscript.
(3) The time-resolved within-trial correlation of RSA betas is a cool idea, but I am concerned it is biased. Estimating correlations among different coefficients from the same GLM design matrix is, in general, biased, i.e., when the regressors are non-orthogonal. This bias comes from the expected covariance of the betas and is discussed in detail here (10.1371/journal.pcbi.1006299). In short, correlations could be inflated due to a combination of the design matrix and the structure of the noise. The most established solution, to cross-validate across different GLM estimations, is unfortunately not available here. I would suggest that the authors think of ways to handle this issue.
Thank you for raising this important issue. Because the bias comes from the covariance between the regressors and the same GLM was applied to all time points in our analysis, we assume that the inflation would be similar at different time points. Therefore, we calculated the correlation of SC and SR betas ranging from -200 to 0 ms relative to stimulus onset as a baseline (i.e., no SC or SR representation is expected before the stimulus onset) and compared the post-stimulus onset correlation coefficients against this baseline. We hypothesized that if the positively within-trial correlation of SC and SR betas resulted from the simultaneous representation instead of inflation, we should observe significantly higher correlation when compared with the baseline. To examine this hypothesis, we first performed the linear discriminant analysis (Supplementary Fig. 7a) and RSA regression (Supplementary Fig. 7b) on the -200 - 0 ms window relative to stimulus onset. We then calculated the average rbaseline of SC and SR betas on that time window for each participant (group results at each time point are shown in Supplementary Fig. 7c) and computed the relative correlation at each post-stimulus onset time point using (fisher-z (r) - fisher-z (rbaseline)). Finally, we performed a simple t test at the group level on baseline-corrected correlation coefficients with Bonferroni correction. The results (Fig. 6c) showed significantly more positive correlation from 100 - 500 ms post-stimulus onset compared with baseline, supporting our hypothesis that the positive within-trial correlation of SC and SR betas arise from simultaneous representation rather than inflation. The related interpretation was added to page 17 of the revised manuscript.
(4) Are results robust to running response-locked analyses? Especially the EEG-behavior correlation. Could this be driven by different RTs across trials & trial-types? I.e., at 400 ms poststim onset, some trials would be near or at RT/action execution, while others may not be nearly as close, and so EEG features would differ & "predict" RT.
Thanks for this question. We now pair each of the stimulus-locked EEG analysis in the manuscript with response-locked analysis. To control for RT variations among trial types, when using the linear mixed model (LMM) to predict RTs from trial-wise RSA results, we included a separate intercept for each of the eight trial types in SC or SR. Furthermore, at each time point, we only included trials that have not generated a response (for stimulus-locked analysis) or already started (for response-locked analysis). All the results (Fig. 3, 5, 7, 9 in the revised manuscript) are in support of our hypothesis. We added these detailed to page 31 of the revised manuscript.
(5) I suggest providing more explanation about the logic of the subspace decoding method - what trialtypes exactly constitute the different classes, why we would expect this method to capture something useful regarding ISPC, & what this something might be. I felt that the first paragraph of the results breezes by a lot of important logic.
In general, this paper does not seem to be written for readers who are unfamiliar with this particular topic area. If authors think this is undesirable, I would suggest altering the text.
To improve clarity, we revised the first paragraph of the SC and SR association subspace analysis to list the conditions for each of the SC and SR decoders and explain more about how the concept of being separatable can be tested by cross-decoding between SC and SR subspaces. The revised paragraph now reads:
“Prior to testing whether controlled and non-controlled associations were represented simultaneously, we first tested whether the two representations were separable in the EEG data.
In other words, we reorganized the 16 experimental conditions into 8 conditions for SC (4 colors × MC/MI, while collapsing across SR levels) and SR (4 words × 2 possible responses per word, while collapsing across SC levels) associations separately. If SC and SR associations are not separable, it follows that they encode the same information, such that both SC and SR associations can be represented in the same subspace (i.e., by the same information encoded in both associations). For example, because (1) the word can be determined by the color and congruency and (2) the most-likely response can be determined by color and ISPC, the SR association (i.e., association between word and most-likely response) can in theory be represented using the same information as the SC association. On the other hand, if SC and SR associations are separable, they are expected to be represented in different subspaces (i.e., the information used to encode the two associations is different). Notably, if some, but not all, information is shared between SC and SR associations, they are still separable by the unique information encoded. In this case, the SC and SR subspaces will partially overlap but still differ in some dimensions. To summarize, whether SC and SR associations are separable is operationalized as whether the associations are represented in the same subspace of EEG data. To test this, we leveraged the subspace created by the LDA (see Methods). Briefly, to capture the subspace that best distinguishes our experimental conditions, we trained SC and SR decoders using their respective aforementioned 8 experimental conditions. We then projected the EEG data onto the decoding weights of the LDA for each of the SC and SR decoders to obtain its respective subspace. We hypothesized that if SC and SR subspaces are identical (i.e., not separable), SC/SR decoding accuracy should not differ by which subspace (SC or SR) the decoder is trained on. For example, SC decoders trained in SC subspace should show similar decoding performance as SC decoders trained in SR subspace. On the other hand, if SC and SR association representations are in different subspaces, the SC/SR subspace will not encode all information for SR/SC associations. As a result, decoding accuracy should be higher using its own subspace (e.g., decoding SC using the SC subspace) than using the other subspace (e.g., decoding SC using the SR subspace). We used cross-validation to avoid artificially higher decoding accuracy for decoders using their own subspace (see Methods).” (Page 11-12).
We also explicitly tested what information is shared between SC and SR representations (see response to comment #2). Lastly, to help the readers navigate the EEG results, we added a section “Overview of EEG analysis” to summarize the EEG analysis and their relations in the following manner:
“EEG analysis overview. We started by validating that the 16 experimental conditions (8 unique stimuli × MC/MI) were represented in the EEG data. Evidence of representation was provided by above-chance decoding of the experimental conditions (Fig. 2-3). We then examined whether the SC and SR associations were separable (i.e., whether SC and SR associations were different representations of equivalent information). As our results supported separable representations of SC and SR association (Fig. 4-5), we further estimated the temporal dynamics of each representation within a trial using RSA. This analysis revealed that the temporal dynamics of SC and SR association representations overlapped (Fig. 6a-b, Fig. 7a-b). To explore the potential reason behind the temporal overlap of the two representations, we investigated whether SC and SR associations were represented simultaneously as part of the task representation, independently from each other, or competitively/exclusively (e.g., on some trials only SC association was represented, while on other trials only SR association was represented). This was done by assessing the correlation between the strength of SC and SR representations across trials (Fig. 6c, Fig. 7c). Lastly, we tested how SC and SR representations facilitated performance (Fig.8-9).” (Page 8-9).
Minor suggestions:
(6) I'd suggest using single-trial RSA beta coefficients, not t-values, as they can be more stable (it's a t-value based on 16 observations against 9 or so regressors.... the SE can be tiny).
Thank you for your suggestion. To choose between using betas and t-values, we calculate the proportion of outliers (defined as values beyond mean ± 5 SD) for each predictor of the design matrix and each subject. We found that outliers were less frequent for t-values than for beta coefficients (t-values: mean = 0.07%, SD = 0.009%; beta-values: mean = 0.19%, SD = 0.033%). Thus, we decided to stay with t-values.
(7) Instead of prewhitening the RTs before the HLM with drift terms, try putting those in the HLM itself, to avoid two-stage regression bias.
Thank you for your suggestion. Because our current LMM included each of the eight trial types in SC or SR as separate predictors with their own intercepts (as mentioned above), adding regressors of trial number and mini blocks (1-100 blocks) introduced collinearity (as ISPC flipped during the experiment). We therefore excluded these regressors from the current LMM (Page 31).
(8) The text says classical MDS was performed on decoding *accuracy* - is this accurate?
We now clarify in the manuscript that it is the decoders’ probabilistic classification results (Page 28).
(9) At a few points, it was claimed that a negative correlation between SC and SR would be expected within single trials, if the two were temporally dissociable. Wouldn't it also be possible that they are not correlated/orthogonal?
We agree with the reviewer and revised the null hypothesis in the cross-trial correlation analysis to include no correlation as SC and SR association representations may be independent from each other (Page 17, 22).
Reviewer #2 (Public review):
Summary:
In this EEG study, Huang et al. investigated the relative contribution of two accounts to the process of conflict control, namely the stimulus-control association (SC), which refers to the phenomenon that the ratio of congruent vs. incongruent trials affects the overall control demands, and the stimulus-response association (SR), stating that the frequency of stimulusresponse pairings can also impact the level of control. The authors extended the Stroop task with novel manipulation of item congruencies across blocks in order to test whether both types of information are encoded and related to behaviour. Using decoding and RSA, they showed that the SC and SR representations were concurrently present in voltage signals, and they also positively co-varied. In addition, the variability in both of their strengths was predictive of reaction time. In general, the experiment has a solid design, but there are some confounding factors in the analyses that should be addressed to provide strong support for the conclusions.
Strengths:
(1) The authors used an interesting task design that extended the classic Stroop paradigm and is potentially effective in teasing apart the relative contribution of the two different accounts regarding item-specific proportion congruency effect, provided that some confounds are addressed.
(2) Linking the strength of RSA scores with behavioural measures is critical to demonstrating the functional significance of the task representations in question.
Thank you for your positive feedback. We hope our responses below address your concerns.
Weakness:
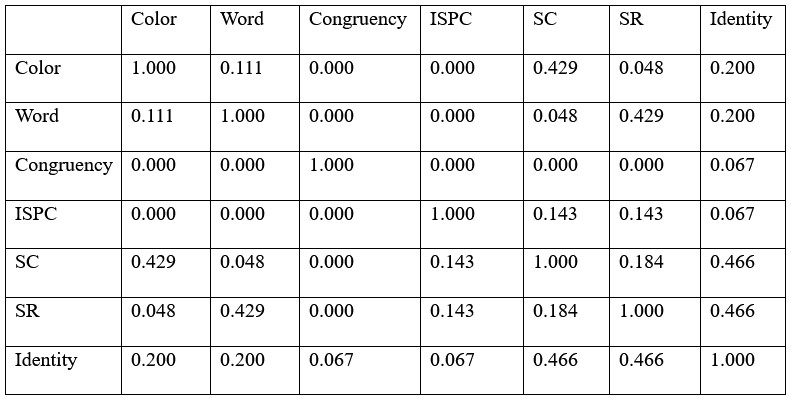
(1) While the use of RSA to model the decoding strength vector is a fitting choice, looking at the RDMs in Figure 7, it seems that SC, SR, ISPC, and Identity matrices are all somewhat correlated. I wouldn't be surprised if some correlations would be quite high if they were reported. Total orthogonality is, of course, impossible depending on the hypothesis, but from experience, having highly covaried predictors in a regression can lead to unexpected results, such as artificially boosting the significance of one predictor in one direction, and the other one to the opposite direction. Perhaps some efforts to address how stable the timed-resolved RSA correlations for SC and SR are with and without the other highly correlated predictors will be valuable to raising confidence in the findings.
Thank you for this important point. The results of proportion of variability explained shown in the Author response table 1 below, indicated relatively higher correlation of SC/SR with Color and Identity. We agree that it is impossible to fully orthogonalize them. To address the issue of collinearity, we performed a control RSA by removing predictors highly correlated with others. Specifically, we calculated the variance inflation factor (VIF) for each predictor. The Identity predictor had a high VIF of 5 and was removed from the RSA. All other predictors had VIFs < 4 and were kept in the RSA. The results (Supplementary Fig. 6) showed patterns similar to the results with the Identity predictor, suggesting that the findings are not significantly influenced by collinearity. We have added the interpretation to page 17 of the revised manuscript.
Author response table 1.
Proportion of variability explained (r2) of RSA predictors.
(2) In "task overview", SR is defined as the word-response pair; however, in the Methods, lines 495-496, the definition changed to "the pairing between word and ISPC" which is in accordance with the values in the RDMs (e.g., mccbb and mcirb have similarity of 1, but they are linked to different responses, so should they not be considered different in terms of SR?). This needs clarification as they have very different implications for the task design and interpretation of results, e.g., how correlated the SC and SR manipulations were.
Thank you for pointing out this important issue with how our operationalization captures the concept in questions. In the revised manuscript, we clarified the stimulus-response (SR) association is the link between the word and the most-likely response (i.e., not necessarily the actual response on the current trial). This association is likely to be encoded based on statistical learning over several trials. On each trial, the association is updated based on the stimulus and the actual response. Over multiple trials, the accumulated association will be driven towards the most-common (i.e., most-likely) response. In our ISPC manipulation, a color is presented in mostly congruent/incongruent (MC/MI) trials, which will also pair a word with a most-likely response. For example, if the color blue is MC, the color blue, which leads to the response blue, will co-occur with the word blue with high frequency. In other words, the SR association here is between the word blue and the response blue. As the actual response is not part of the SR association, in the RDM two trial types with different responses may share the same SR association, as long as they share the same word and the same ISPC manipulation, which, by the logic above, will produce the same most-likely response. These clarifications have been added to page 4 and 29 of the revised manuscript.
In the revised manuscript (Page 17), we addressed how much the correlated SC and SR predictors in the RDM could affect the correlation analysis between SC and SR association representation strength. Specifically, we conducted the RSA using the same GLM on EEG data prior to stimulus onset (Supplementary Fig. 7a-b). As no SC and SR associations are expected to be present before stimulus onset, the correlation between SC and SR representation would serve as a baseline of inflation due to correlated predictors in the GLM (Supplementary Fig. 7c, also see comment #3 of R1). The SC-SR correlation coefficients following stimulus onset was then compared to the baseline to control for potential inflation (Fig. 6c). Significantly above-baseline correlation was still observed between ~100-500 ms post-stimulus onset, providing support for the hypothesis that SC and SR are encoded in the same task representation.
Minor suggestions:
(3) Overall, I find that calling SC-controlled and SR-uncontrolled representations unwarranted. How is the level controlledness defined? Both are essentially types of statistical expectation that provide contextual information for the block of tasks. Is one really more automatic and requires less conscious processing than the other? More background/justification could be provided if the authors would like to use these terms.
Following your advice, we have added more discussion on how controlledness is conceptualized in this work and in the literature, which reads:
“We consider SC and SR as controlled and uncontrolled respectively based on the literature investigating the mechanism of ISPC effect. The SC account posits that the ISPC effect results from conflict and involves conflict adaptation, which requires the regulation of attention or control (Bugg & Hutchison, 2013; Bugg et al., 2011; Schmidt, 2018; Schmidt & Besner, 2008). On the other hand, the SR account argues that ISPC effect does not require conflict adaptation but instead reflects contingency leaning. That is, the response can be directly retrieved from the association between the stimulus and the most-likely response without top-down regulation of attention or control. As more empirical evidence emerged, researchers advocating control view began to acknowledge the role of associative learning in cognitive control regarding the ISPC effect (Abrahamse et al., 2016). SC association has been thought to include both automatic that is fast and resource saving and controlled processes that is flexible and generalizable (Chiu, 2019). Overall, we do not intend to claim that SC is entirely controlled or SR is completely automatic. We use SC-controlled and SR-uncontrolled representations to align with the original theoretical motivation and to highlight the conceptual difference between SC and SR associations.” (Page 24-25)
(4) Figures 3c and d: the figures could benefit from more explanation of what they try to show to the readers. Also for 3d, the dimensions were aligned with color sets and congruencies, but word identities were not linearly separable, at least for the first 3 axes. Shouldn't one expect that words can be decoded in the SR subspace if word-response pairs were decodable (e.g., Figure 3b)?
Thank you for the insightful observation. We now clarified that Fig. 3c and d in the original manuscript (Fig. 4c and d in the current manuscript) aim to show how each of the 8 trial types in the SC and SR subspaces are represented. The MDS approach we used for visualization tries to preserve dissimilarity between trial types when projecting from data from a high dimensional to a low dimensional space. However, such projection may also make patterns linearly separatable in high dimensional space not linearly separatable in low dimensional space. For example, if the word blue has two points (-1, -1) and (1, 1) and the word red has two points (-1, 1) and (1, -1), they are not linearly separatable in the 2D space. Yet, if they are projected from a 3D space with coordinates of (-1, -1, -0.1), (1, 1, -0.1), (-1, 1, 0.1) and (1, -1, 0.1), the two words can be linearly separatable using the 3rd dimension. Thus, a better way to test whether word can be linearly separated in SR subspace is to perform RSA on the original high dimensional space. We performed the RSA with word (Supplementary Fig. 2) on the SR decoder trained on the SR subspace. Note that in Fig. 3c and d of the original script (Fig. 4c and d in the current manuscript) there are two pairs of words that are not linearly separable: red-blue and yellow-green. Thus, we specifically tested the separability within the two pairs using the one predictor for each pair, as shown in Supplementary Fig. 2. The results showed that within both word pairs individual words were presented above chance level (Supplementary Fig. 3). Considering that the decoders are linear, this finding indicates linear separability of the word pairs in the original SR subspace. The clarification has been added to page 13 (the end of the second paragraph) of the revised manuscript.
References
Abrahamse, E., Braem, S., Notebaert, W., & Verguts, T. (2016). Grounding cognitive control in associative learning. Psychological Bulletin, 142(7), 693-728.doi:10.1037/bul0000047.
Bugg, J. M., & Hutchison, K. A. (2013). Converging evidence for control of color-word Stroop interference at the item level. Journal of Experimental Psychology:Human Perception and Performance, 39(2), 433-449. doi:10.1037/a0029145.
Bugg, J. M., Jacoby, L. L., & Chanani, S. (2011). Why it is too early to lose control in accounts of item-specific proportion congruency effects. Journal of Experimental Psychology: Human Perception and Performance, 37(3), 844-859. doi:10.1037/a0019957.
Chiu, Y.-C. (2019). Automating adaptive control with item-specific learning. In Psychology of Learning and Motivation (Vol. 71, pp. 1-37).
Schmidt, J. R. (2018). Evidence against conflict monitoring and adaptation: An updated review. Psychonomic Bulletin & Review, 26(3), 753-771. doi:10.3758/s13423018-1520-z.
Schmidt, J. R., & Besner, D. (2008). The Stroop effect: Why proportion congruent has nothing to do with congruency and everything to do with contingency. Journal of Experimental Psychology: Learning, Memory, and Cognition, 34(3), 514-523. doi:10.1037/0278-7393.34.3.514.
-

-
-
-
eLife Assessment
This useful study uses creative scalp EEG decoding methods to attempt to demonstrate that two forms of learned associations in a Stroop task are dissociable, despite sharing similar temporal dynamics. However, the evidence supporting the conclusions is incomplete due to concerns with the experimental design and methodology. This paper would be of interest to researchers studying cognitive control and adaptive behavior, if the concerns raised in the reviews can be addressed satisfactorily.
-
Reviewer #1 (Public review):
Summary:
This study focuses on characterizing the EEG correlates of item-specific proportion congruency effects. In particular, two types of learned associations are characterized. One being associations between stimulus features and control states (SC), and the other being stimulus features and responses (SR). Decoding methods are used to identify SC and SR correlates and to determine whether they have similar topographies and dynamics.
The results suggest SC and SR associations are simultaneously coactivated and have shared topographies, with the inference being that these associations may share a common generator.
Strengths:
Fearless, creative use of EEG decoding to test tricky hypotheses regarding latent associations.
Nice idea to orthogonalize the ISPC condition (MC/MI) from stimulus features.
Weaknesses:
(1) I'm relatively concerned that these results may be spurious. I hope to be proven wrong, but I would suggest taking another look at a few things.
While a nice idea in principle, the ISPC manipulation seems to be quite confounded with the trial number. E.g., color-red is MI only during phase 2, and is MC primarily only during Phase 3 (since phase 1 is so sparsely represented). In my experience, EEG noise is highly structured across a session and easily exploited by decoders. Plus, behavior seems quite different between Phase 2 and Phase 3. So, it seems likely that the classes you are asking the decoder to separate are highly confounded with temporally structured noise.
I suggest thinking of how to handle this concern in a rigorous way. A compelling way to address this would be to perform "cross-phase" decoding, however I am not sure if that is possible given the design.
The time courses also seem concerning. What are we to make of the SR and SC timecourses, which have aggregate decoding dynamics that look to be <1Hz?
Some sanity checks would be one place to start. Time courses were baselined, but this is often not necessary with decoding; it can cause bias (10.1016/j.jneumeth.2021.109080), and can mask deeper issues. What do things look like when not baselined? Can variables be decoded when they should not be decoded? What does cross-temporal decoding look like - everything stable across all times, etc.?
(2) The nature of the shared features between SR and SC subspaces is unclear.
The simulation is framed in terms of the amount of overlap, revealing the number of shared dimensions between subspaces. In reality, it seems like it's closer to 'proportion of volume shared', i.e., a small number of dominant dimensions could drive a large degree of alignment between subspaces.
What features drive the similarity? What features drive the distinctions between SR and SC? Aside from the temporal confounds I mentioned above, is it possible that some low-dimensional feature, like EEG congruency effect (e.g., low-D ERPs associated with conflict), or RT dynamics, drives discriminability among these classes? It seems plausible to me - all one would need is non-homogeneity in the size of the congruency effect across different items (subject-level idiosyncracies could contribute: 10.1016/j.neuroimage.2013.03.039).
(3) The time-resolved within-trial correlation of RSA betas is a cool idea, but I am concerned it is biased. Estimating correlations among different coefficients from the same GLM design matrix is, in general, biased, i.e., when the regressors are non-orthogonal. This bias comes from the expected covariance of the betas and is discussed in detail here (10.1371/journal.pcbi.1006299). In short, correlations could be inflated due to a combination of the design matrix and the structure of the noise. The most established solution, to cross-validate across different GLM estimations, is unfortunately not available here. I would suggest that the authors think of ways to handle this issue.
(4) Are results robust to running response-locked analyses? Especially the EEG-behavior correlation. Could this be driven by different RTs across trials & trial-types? I.e., at 400 ms post-stim onset, some trials would be near or at RT/action execution, while others may not be nearly as close, and so EEG features would differ & "predict" RT.
(5) I suggest providing more explanation about the logic of the subspace decoding method - what trialtypes exactly constitute the different classes, why we would expect this method to capture something useful regarding ISPC, & what this something might be. I felt that the first paragraph of the results breezes by a lot of important logic.
In general, this paper does not seem to be written for readers who are unfamiliar with this particular topic area. If authors think this is undesirable, I would suggest altering the text.
-
Reviewer #2 (Public review):
Summary:
In this EEG study, Huang et al. investigated the relative contribution of two accounts to the process of conflict control, namely the stimulus-control association (SC), which refers to the phenomenon that the ratio of congruent vs. incongruent trials affects the overall control demands, and the stimulus-response association (SR), stating that the frequency of stimulus-response pairings can also impact the level of control. The authors extended the Stroop task with novel manipulation of item congruencies across blocks in order to test whether both types of information are encoded and related to behaviour. Using decoding and RSA, they showed that the SC and SR representations were concurrently present in voltage signals, and they also positively co-varied. In addition, the variability in both of their …
Reviewer #2 (Public review):
Summary:
In this EEG study, Huang et al. investigated the relative contribution of two accounts to the process of conflict control, namely the stimulus-control association (SC), which refers to the phenomenon that the ratio of congruent vs. incongruent trials affects the overall control demands, and the stimulus-response association (SR), stating that the frequency of stimulus-response pairings can also impact the level of control. The authors extended the Stroop task with novel manipulation of item congruencies across blocks in order to test whether both types of information are encoded and related to behaviour. Using decoding and RSA, they showed that the SC and SR representations were concurrently present in voltage signals, and they also positively co-varied. In addition, the variability in both of their strengths was predictive of reaction time. In general, the experiment has a solid design, but there are some confounding factors in the analyses that should be addressed to provide strong support for the conclusions.
Strengths:
(1) The authors used an interesting task design that extended the classic Stroop paradigm and is potentially effective in teasing apart the relative contribution of the two different accounts regarding item-specific proportion congruency effect, provided that some confounds are addressed.
(2) Linking the strength of RSA scores with behavioural measures is critical to demonstrating the functional significance of the task representations in question.
Weakness:
(1) While the use of RSA to model the decoding strength vector is a fitting choice, looking at the RDMs in Figure 7, it seems that SC, SR, ISPC, and Identity matrices are all somewhat correlated. I wouldn't be surprised if some correlations would be quite high if they were reported. Total orthogonality is, of course, impossible depending on the hypothesis, but from experience, having highly covaried predictors in a regression can lead to unexpected results, such as artificially boosting the significance of one predictor in one direction, and the other one to the opposite direction. Perhaps some efforts to address how stable the timed-resolved RSA correlations for SC and SR are with and without the other highly correlated predictors will be valuable to raising confidence in the findings.
(2) In "task overview", SR is defined as the word-response pair; however, in the Methods, lines 495-496, the definition changed to "the pairing between word and ISPC" which is in accordance with the values in the RDMs (e.g., mccbb and mcirb have similarity of 1, but they are linked to different responses, so should they not be considered different in terms of SR?). This needs clarification as they have very different implications for the task design and interpretation of results, e.g., how correlated the SC and SR manipulations were.
-
