Neural Representation of Associative Threat Learning in Pulvinar Divisions, Lateral Geniculate Nucleus, and Mediodorsal Thalamus in Humans
Curation statements for this article:-
Curated by eLife

eLife Assessment
This study provides valuable insights into the role of thalamic nuclei in associative threat and extinction learning, underpinned by a large dataset and rigorous, multipronged analyses. The evidence provided is solid, supporting the main conclusions. Minor analytical refinements notwithstanding, the manuscript will be of broad interest to researchers in learning and memory, fear, thalamic circuitry, and related mental health conditions.
This article has been Reviewed by the following groups
Discuss this preprint
Start a discussion What are Sciety discussions?Listed in
- Evaluated articles (eLife)
Abstract
Understanding the neural mechanisms underlying associative threat learning is essential for advancing behavioral models of threat and adaptation. We investigated distinct activation patterns across thalamic pulvinar divisions, lateral geniculate nucleus (LGN), and mediodorsal thalamus (MD) during the acquisition of associative threat learning in the MRI. The anterior pulvinar and MD exhibited parallel activation patterns, which we interpret as relating to automatic and more deliberative learning processes. Additionally, our findings suggest a hierarchical pulvinar organization during fear conditioning, in which coordinated activation among inferior, lateral, medial, and anterior divisions may support the integration of threat-related information. Pulvinar divisions and the MD showed activation during extinction learning and exhibited patterns consistent with salience processing and safety–threat memory expression during extinction recall and threat renewal. LGN activation patterns during threat learning were consistent with feedforward processing of visual information. This study extends dominant brain models of threat learning and memory, reframing our understanding of distinct thalamic roles in these psychological processes.
Article activity feed
-

-
-

eLife Assessment
This study provides valuable insights into the role of thalamic nuclei in associative threat and extinction learning, underpinned by a large dataset and rigorous, multipronged analyses. The evidence provided is solid, supporting the main conclusions. Minor analytical refinements notwithstanding, the manuscript will be of broad interest to researchers in learning and memory, fear, thalamic circuitry, and related mental health conditions.
-
Reviewer #1 (Public review):
Summary:
Badarnee and colleagues analyse fMRI data collected during an associative threat-learning task. They find evidence for parallel processes mediated by the mediodorsal, LGn and pulvinar nuclei of the thalamus. The evidence for these conclusions is promising, but limited by a lack of clarity regarding the preprocessing and statistical methods.
Strengths:
The approach is inventive and novel, providing information about thalamocortical interactions that are scant in the current literature.
Weaknesses:
(1) There are not sufficient details present to allow for the direct interrogation of the methods used in the study.
(2) The figures do not contain sufficiently granular details, making it challenging to determine whether the observed effects were robust to individual differences.
Comments on revisions:
I …
Reviewer #1 (Public review):
Summary:
Badarnee and colleagues analyse fMRI data collected during an associative threat-learning task. They find evidence for parallel processes mediated by the mediodorsal, LGn and pulvinar nuclei of the thalamus. The evidence for these conclusions is promising, but limited by a lack of clarity regarding the preprocessing and statistical methods.
Strengths:
The approach is inventive and novel, providing information about thalamocortical interactions that are scant in the current literature.
Weaknesses:
(1) There are not sufficient details present to allow for the direct interrogation of the methods used in the study.
(2) The figures do not contain sufficiently granular details, making it challenging to determine whether the observed effects were robust to individual differences.
Comments on revisions:
I continue to recommend the plotting of individual data points. While there may be individual variance, it is important to quantify this in publication so that future studies can appreciate the uncertainty surrounding test statistics.
-
Reviewer #2 (Public review):
Summary:
The authors quantify human fMRI BOLD responses in pulvinar and mediodorsal thalamic nuclei during a fear conditioning and extinction task across two days, in a large sample size (hundreds of participants). They show that the BOLD responses in these areas differentiate the conditioned (CS+) and safety (CS-) stimulus. Additionally this changes with repeated trials which could be a neural correlate of fear learning. They show that the anterior pulvinar is most correlated with the MD, and that this is not due to anatomical proximity. They perform graph analysis on the pulvinar sub nuclei which suggests that the medial pulvinar is a hub between the sensory (lateral/inferior) and associative (anterior) pulvinar. They show different patterns of thalamic activity across conditioning, extinction, recall, and …
Reviewer #2 (Public review):
Summary:
The authors quantify human fMRI BOLD responses in pulvinar and mediodorsal thalamic nuclei during a fear conditioning and extinction task across two days, in a large sample size (hundreds of participants). They show that the BOLD responses in these areas differentiate the conditioned (CS+) and safety (CS-) stimulus. Additionally this changes with repeated trials which could be a neural correlate of fear learning. They show that the anterior pulvinar is most correlated with the MD, and that this is not due to anatomical proximity. They perform graph analysis on the pulvinar sub nuclei which suggests that the medial pulvinar is a hub between the sensory (lateral/inferior) and associative (anterior) pulvinar. They show different patterns of thalamic activity across conditioning, extinction, recall, and renewal.
Strengths:
The data has a large sample size (n=293 in some measures, n=412 in others). This is a validated human fear conditioning/extinction task that Dr Milad's group has been working with for several years. Few labs have investigated the thalamus activity during fear conditioning and extinction, particularly with a large sample size. There is an independent replication of the pulvinar network structure (Fig. 3), which suggests that the processing in the more sensory-related inferior and lateral pulvinar is relayed to the anterior pulvinar (and possibly thereby to more action-related prefrontal areas) via an intermediate step in the medial pulvinar - potentially a novel discovery but that needs more validation.
Weaknesses:
(1) The authors cannot make causal claims about their results based on correlational neuroimaging evidence. Causal claims should be pared back. E.g. Sentence 1 in results "The anterior pulvinar and MD contribute to early associative threat learning, as evidenced by increased functional activation in response to CS+ compared to CS- at the block level (Fig. 1b-c)." needs to be reworded to something like 'the anterior pulvinar and MD have increased functional activation... This suggests that these areas may contribute to early associate threat learning"
(2) Fig .1 The fact that the difference in BOLD activity between CS+ and CS- goes away on the third trial is not addressed. This is a very large effect in the data.
(3) Fig. 3 Could the observed network structure be due to anatomical proximity? Perhaps the authors should do an analogous analysis to what they did in Fig. 2 for this intra-pulvinar analysis. This analysis doesn't take into account the indirect connections through corticothalamic and thalamocortical connections with visual cortex and the pulvinar. There is an implicit assumption that there are interconnections between the pulvinar sub nuclei, but there are few strong excitatory projections between these sub nuclei to my knowledge. If visual areas are included in the graph, it would make things more complex, but would probably dramatically change the story. In this way, the message is somewhat constructed or arbitrary.
(4) In the results section describing Fig. 4-7, there are no statistics supporting the claims made.
There needs to be a set of graphs comparing the results across the study sessions and days, with statistical comparisons between the different experiments to confirm differences.(5) FIg. 7 does not include the major corticothalamic and thalamocortical projections from early, mid-level, and higher visual cortex to the different pulvinar nuclei. I doubt that there are strong direct projections between the pulvinar nuclei, rather the functional connections are probably mediated through interconnections with cortical visual areas.
(6) Stylistic: There are a lot of hypotheses and interpretations presented in this primary literature paper which may be better suited for a review or perspective piece.
(7) In the discussion there is an assumption that the fMRI BOLD responses to CS+ and CS- need to be different to indicate that an area is processing these distinctly, but the BOLD signal can only detect large scale changes in overall activity. It's easy to imagine that an area could be involved in processing these two stimuli distinctly without showing an overall difference in the gross amount of activity.
(8) There is strong evidence that the BOLD responses to the threat-related and safety-related stimuli are different, modest evidence for their claims of learning/plasticity in these pathways, and circumstantial evidence supporting their hypothesized graph network models. Overall most of the claims made in the discussion are better considered possible interpretations rather than proven findings - this is not a criticism, as these experiments and subject matter are extremely complex.
(9) This study continues to validate the power and utility of this in human fear conditioning/extinction paradigm, and extends this paradigm to investigating fear learning beyond the traditional limbic system pathways. It's possible that their models for the pulvinar nuclei interconnections could guide future neuromodulation or DBS studies that could provide more causal evidence for their hypotheses.
Comments on revisions:
The reviewers addressed my major concerns appropriately in the modified manuscript. As long as the MRI analysis concerns of Reviewer 3 are satisfied (MRI analysis is not my expertise), I am satisfied with the modified manuscript.
-
Reviewer #3 (Public review):
Summary:
The present work was aimed at investigating the specific contributions of thalamic nuclei to associative threat learning and extinction. Using fMRI, it examined activation patterns across pulvinar divisions, the lateral geniculate nucleus (LGN), and the mediodorsal thalamus (MD) during threat acquisition, extinction, and recall. It goals was to uncover whether distinct thalamic systems support different modes of learning-automatic survival mechanisms versus more deliberate processes-and to propose a hierarchical pulvinar model of fear conditioning. The manuscript also tried to refine current neuroanatomical models of threat learning and memory, highlighting the role of thalamic nuclei in it.
Strengths:
(1) Valuable theoretical elaboration and modeling regarding the differential role of pulvinar …
Reviewer #3 (Public review):
Summary:
The present work was aimed at investigating the specific contributions of thalamic nuclei to associative threat learning and extinction. Using fMRI, it examined activation patterns across pulvinar divisions, the lateral geniculate nucleus (LGN), and the mediodorsal thalamus (MD) during threat acquisition, extinction, and recall. It goals was to uncover whether distinct thalamic systems support different modes of learning-automatic survival mechanisms versus more deliberate processes-and to propose a hierarchical pulvinar model of fear conditioning. The manuscript also tried to refine current neuroanatomical models of threat learning and memory, highlighting the role of thalamic nuclei in it.
Strengths:
(1) Valuable theoretical elaboration and modeling regarding the differential role of pulvinar subdivisions on feedforward (inferior, lateral) and higher-order integration (anterior), and their functional interplay with other relevant subcortical and cortical structures in associative threat and extinction learning.
(2) Large sample sizes and multipronged analytical approaches were used for hypothesis testing.
(3) Exhaustive literature review in the field of associative threat, as well as regarding the role of thalamic nuclei and other brain structures in it.
Weaknesses:
(1) The manuscript has improved methodologically and analytically after the review. Several weaknesses remain, in my opinion, but still findings are valuable and the evidence can be considered as convincing.
a) fMRI data have low resolution (3 cubic mm), which certainly limits the examination of small nuclei such as the ones investigated here, and especially the examination of the LGN and inferior pulvinar.
b) fMRI was normalized to standard space. Analyzing the data in individual-subject space would have given you the options of avoiding altering every participant's brain and of using more precise atlases than the normalized AAL for ROI selection.
c) Motion during scanning was poorly controlled. Including the motion parameters as covariates of no interest in the GLM/analysis does not fully guarantee that motion is not influencing the results, and that motion is not differentially influencing some experimental conditions more than others. -
Author response:
The following is the authors’ response to the original reviews
Public review:
Reviewer #1 (Public review):
Summary:
Badarnee and colleagues analyse fMRI data collected during an associative threatlearning task. They find evidence for parallel processes mediated by the mediodorsal, LGn, and pulvinar nuclei of the thalamus. The evidence for these conclusions is promising, but limited by a lack of clarity regarding the preprocessing and statistical methods.
Strengths:
The approach is inventive and novel, providing information about thalamocortical interactions that are scant in the current literature.
Weaknesses:
(1) There are not sufficient details present to allow for the direct interrogation of the methods used in the study.
We thank the reviewer for this comment. We have added more detailed information about the …
Author response:
The following is the authors’ response to the original reviews
Public review:
Reviewer #1 (Public review):
Summary:
Badarnee and colleagues analyse fMRI data collected during an associative threatlearning task. They find evidence for parallel processes mediated by the mediodorsal, LGn, and pulvinar nuclei of the thalamus. The evidence for these conclusions is promising, but limited by a lack of clarity regarding the preprocessing and statistical methods.
Strengths:
The approach is inventive and novel, providing information about thalamocortical interactions that are scant in the current literature.
Weaknesses:
(1) There are not sufficient details present to allow for the direct interrogation of the methods used in the study.
We thank the reviewer for this comment. We have added more detailed information about the methods to clarify our procedure. In addition to the original description of our threat learning paradigm in humans, we included the following to page 39-40:
“Experimental procedure
Threat learning: Please see the original description in the manuscript.
Shock level: The shock intensity used in the fear learning paradigm was determined during a preexperiment calibration. Electrodes were attached to the participant’s right hand, and stimulation began at a low level (0.1 mA), gradually increasing in small increments. After each increment, participants verbally rated their discomfort. The procedure continued until the participant identified a level they described as “highly annoying but not painful.” This individualized intensity was then used for that participant throughout the experiment. For safety and ethical reasons, the maximum intensity was capped at 20 mA, and no participant received a shock above this limit.
Instructions to the participants: Each visual stimulus in our paradigm was first shown to participants for 6 seconds. This initial presentation served as habituation, allowing us to isolate the responses to genuinely new stimuli. Before the experiment began, participants were informed that they would see pictures illuminated with different colored lights, such as red or blue. During the experiment, some pictures might be paired with an electric shock, while others might not. Participants were instructed to pay attention to whether a specific color or pattern was associated with the shock. These instructions were adopted from previous studies in which our group developed this paradigm and found them highly effective for human learning. We therefore used the same approach in the current experiment. These instructions were provided throughout all phases of threat learning, and participants were informed that any shocks delivered would be at the same intensity determined on Day 1.”
(2) The figures do not contain sufficiently granular details, making it challenging to determine whether the observed effects were robust to individual differences.
We thank the reviewer for this suggestion. We agree that visualizations exposing the full data distribution can be highly informative, and we therefore present distribution-based plots for several analyses (e.g., connectivity results in Figure 7). However, for the activation analyses, our primary goal was to highlight trial-to-trial changes and overall patterns across thalamic nuclei, rather than the distribution of individual data points per se. For this purpose, bar plots with standard errors provide a clearer representation of the directional effects and facilitate comparison across trials and conditions.
Reviewer #2 (Public review):
Summary:
The authors quantify human fMRI BOLD responses in pulvinar and mediodorsal thalamic nuclei during a fear conditioning and extinction task across two days, in a large sample size (hundreds of participants). They show that the BOLD responses in these areas differentiate the conditioned (CS+) and safety (CS-) stimuli. Additionally, this changes with repeated trials, which could be a neural correlate of fear learning. They show that the anterior pulvinar is most correlated with the MD, and that this is not due to anatomical proximity. They perform graph analysis on the pulvinar subnuclei, which suggests that the medial pulvinar is a hub between the sensory (lateral/inferior) and associative (anterior) pulvinar. They show different patterns of thalamic activity across conditioning, extinction, recall, and renewal.
Strengths:
The data has a large sample size (n=293 in some measures, n=412 in others). This is a validated human fear conditioning/extinction task that Dr Milad's group has been working with for several years. Few labs have investigated the thalamus activity during fear conditioning and extinction, particularly with a large sample size. There is an independent replication of the pulvinar network structure (Figure 3), which suggests that the processing in the more sensory-related inferior and lateral pulvinar is relayed to the anterior pulvinar (and possibly thereby to more action-related prefrontal areas) via an intermediate step in the medial pulvinar - potentially a novel discovery, but that needs more validation.
Weaknesses:
(1) The authors cannot make causal claims about their results based on correlational neuroimaging evidence. Causal claims should be pared back. E.g., sentence 1 in the Results section: "The anterior pulvinar and MD contribute to early associative threat learning, as evidenced by increased functional activation in response to CS+ compared to CS- at the block level (Fig. 1b-c)." needs to be reworded to something like "The anterior pulvinar and MD have increased functional activation... This suggests that these areas may contribute to early associate threat learning."
We acknowledge the limitations of fMRI studies and agree with the reviewer that causal claims cannot be made based on correlational neuroimaging evidence. Accordingly, we revised the text to reduce causal interpretations. Specifically, we reworded the sentence identified by the reviewer in the Results section and systematically updated language throughout the manuscript.
Page 9: “At the block level, both the anterior pulvinar and MD showed increased activation to CS+ vs. CS− (anterior pulvinar: t(292) = 4.41, p = 0.00001, d = 0.25; MD: t(292) = 6.41, p = 5.83x10⁻¹⁰, d = 0.37; Fig. 1b–c), suggesting a possible involvement of these regions in early associative threat learning.”
Throughout the manuscript, we replaced terms such as “reflects” with “likely reflects” and “indicating” with “consistent with,” and introduced explicitly correlational phrasing where appropriate (e.g., “apparently,” “closely align,” and “seems to”). All revisions are highlighted in green in the revised manuscript.
(2) Figure 1: The fact that the difference in BOLD activity between CS+ and CS- goes away on the third trial is not addressed. This is a very large effect in the data.
We thank the reviewer for highlighting this important pattern in Trial 3. The CS+ vs. CS− contrast in the third trial in the mediodorsal thalamus remained statistically significant after FDR correction and was correctly reported in the Supplementary Tables. However, we acknowledge that the statistical marker was inadvertently omitted from Figure 1. We have now corrected the figure to include the appropriate significance annotation.
In addition, we now explicitly describe the attenuation of the CS+ vs. CS− difference by the third trial in the mediodorsal thalamus but not in the pulvinar (page 32):
“This suggested rapid initial acquisition of the predictive value of the CS+ is thought to be pronounced during the first two trials. The attenuated CS+ vs. CS− differentiation on the third trial specifically in the pulvinar may reflect a decreased requirement for differential thalamic engagement once the initial association has been acquired, or an initial survival fear reaction is expressed. Notably, because the MD sustained the BOLD response to the CS+ in the third trial which may indicate involvement of this nucleus in the consolidation or stabilization of the learned association. This aligns with the wellestablished MD-PFC circuit involved in cognitive processes (Wolff and Halassa, 2024). Additionally, in a previous study using a similar paradigm, we observed sustained CS+ vs. CS− differentiation on the third trial in the nucleus reuniens, as well (Tuna et al., 2025). These findings suggest that trialdependent learning dynamics may vary across thalamic nuclei rather than reflecting a uniform thalamic learning signal. Together, while our paradigm does not inherently distinguish between different stages of learning, such as early acquisition and stabilization, our findings are consistent with stronger associative learning–related engagement during the first two trials, with a reduced differential response by the third trial that may reflect the involvement of different neural processes”.
(3) Figure 3: Could the observed network structure be due to anatomical proximity? Perhaps the authors should do an analogous analysis to what they did in Figure 2 for this intra-pulvinar analysis. This analysis doesn't take into account the indirect connections through corticothalamic and thalamocortical connections with the visual cortex and the pulvinar. There is an implicit assumption that there are interconnections between the pulvinar subnuclei, but there are few strong excitatory projections between these subnuclei to my knowledge. If visual areas are included in the graph, it would make things more complex, but would probably dramatically change the story. In this way, the message is somewhat constructed or arbitrary.
We thank the reviewer for this insightful comment. We agree that the network analysis in Figure 3 does not provide a direct anatomical account of pulvinar connectivity and cannot distinguish between direct inter-nuclear interactions and indirect coupling mediated via corticothalamic and thalamocortical pathways, including visual cortex.
Our intention with this analysis was to characterize functional statistical dependencies among pulvinar divisions during conditioning, rather than to infer monosynaptic anatomical connectivity. Accordingly, the observed network structure should not be interpreted as evidence for direct excitatory projections between pulvinar subnuclei.
We agree that including visual cortical regions in the network would substantially increase model complexity and could alter the inferred network structure. However, doing so would require a trial-wise, multiregional modeling framework that goes beyond the scope of the present intra-pulvinar analysis.
In response to this comment, we have now explicitly clarified the assumptions, interpretational limits, and alternative explanations of the network model in the Discussion (page 33):
“Yet, these intrapulvinar relationships should be understood as a functional and computational model, reflecting statistical dependencies among pulvinar divisions during threat learning, rather than as evidence of direct monosynaptic anatomical connections. Because detailed inter-nuclear anatomical connectivity within the pulvinar remains incompletely characterized, our analysis does not presuppose strong direct excitatory projections between subnuclei. Instead, our findings are intended to highlight candidate functional relationships within the pulvinar during conditioning with different level of data processing, rather than to provide a definitive anatomical map.”
We also included the following in the Limitations and Future Directions section (page 36):
“The observed relationships among pulvinar divisions during conditioning are purely functional and do not distinguish direct inter-nuclear interactions from indirect coupling mediated by corticothalamic and thalamocortical pathways, including visual cortical regions. Thus, the pulvinar model may reflect indirect cortical loops, weak or currently undocumented inter-nuclear interactions, or a combination of both.”
Finally, we added this note to the legend of Fig. 3:
“Note: The functional relationships among pulvinar divisions during threat learning should be interpreted as computational dependencies derived from statistical associations. These effects may reflect indirect interactions mediated by corticothalamic and thalamocortical pathways (e.g., via visual cortex), rather than direct inter-nuclear connectivity. Elucidating the underlying anatomical mechanisms will require future studies.”
(3) In the results section describing Figures 4-7, there are no statistics supporting the claims made. There needs to be a set of graphs comparing the results across the study sessions and days, with statistical comparisons between the different experiments to confirm differences.
We thank the reviewer for this suggestion. In this study, each phase (conditioning, extinction, recall, and renewal) was analyzed separately to characterize thalamic function within that specific phase. Our primary conclusions focus on differences between CS+ and CS− within each phase, rather than comparisons across phases or sessions. Direct statistical comparisons across phases were therefore not performed, as they fall outside the scope of our main hypotheses.
We have clarified this in the revised manuscript to make the rationale for our analytic approach explicit. Added to page 8:
“The purpose of this study is to investigate thalamic function during each learning phase separately, focusing on CS+ vs. CS− differences within phases rather than comparing activation across phases. This phase-specific approach allows us to characterize thalamic functional dynamics within each stage of learning and memory, avoiding potential confounds arising from the distinct processes of conditioning, extinction, and recall.”
(4) Figure 7 does not include the major corticothalamic and thalamocortical projections from early, mid-level, and higher visual cortex to the different pulvinar nuclei. I doubt that there are strong direct projections between the pulvinar nuclei; rather, the functional connections are probably mediated through interconnections with cortical visual areas.
We thank the reviewer for this point. Reciprocal connections between the visual cortex and the pulvinar are established, but the precise projections to specific pulvinar divisions remain unknown. We have added a note to the Figure 8a caption to clarify this (Figure 7a in the original version).
“Note (panel a): Known pulvinar–cortical connections, as well as sensory input pathways (e.g., visual inputs via the retina/LGN and nociceptive inputs via the spinothalamic tract), are not explicitly shown. These connections are well established anatomically but were omitted due to their heterogeneity and incomplete characterization at the level of pulvinar subnuclei. Their absence should not be interpreted as a lack of anatomical or functional relevance.”
(5) Stylistic: There are a lot of hypotheses and interpretations presented in this primary literature paper, which may be better suited for a review or perspective piece.
We thank the reviewer for this comment. We aimed to integrate our empirical findings within a broader conceptual framework to provide a complementary narrative, rather than presenting isolated observations without connecting them to theoretical context. This approach is intended to strengthen the interpretive value of the study while remaining grounded in primary data.
(6) In the discussion, there is an assumption that the fMRI BOLD responses to CS+ and CS- need to be different to indicate that an area is processing these distinctly, but the BOLD signal can only detect large-scale changes in overall activity. It's easy to imagine that an area could be involved in processing these two stimuli distinctly without showing an overall difference in the gross amount of activity.
We thank the reviewer for raising this important point. We fully agree that the fMRI BOLD signal reflects large-scale changes in population activity and may fail to capture more subtle or distributed neural representations. Accordingly, the absence of a CS+ vs. CS− BOLD difference should not be interpreted as evidence that a region is not involved in discriminating these stimuli. Rather, our inferences are limited to differences in aggregate activation at the spatial and temporal resolution of fMRI.
To partially address this limitation, we analyzed anatomically defined thalamic subregions; however, we acknowledge that finer-scale subdivisions and cell-type– specific processing likely exist that are not currently resolvable in human fMRI. Such distinctions may be better investigated using invasive recordings or circuit-level approaches in rodents or non-human primates. This limitation has now been explicitly acknowledged in the Limitations section of the manuscript (page 36):
“Pulvinar divisions, MD, and LGN each contain diverse neuron subtypes and finer anatomical subdivisions that may serve distinct functions. Importantly, the absence of CS+ vs. CS− differences in BOLD activity should not be interpreted as a lack of stimulus-specific processing, as such distinctions may occur without changes in overall activation detectable by fMRI…”
(7) There is strong evidence that the BOLD responses to the threat-related and safetyrelated stimuli are different, modest evidence for their claims of learning/plasticity in these pathways, and circumstantial evidence supporting their hypothesized graph network models. Overall, most of the claims made in the discussion are better considered possible interpretations rather than proven findings - this is not a criticism, as these experiments and subject matter are extremely complex.
We thank the reviewer for this constructive suggestion. In response, we have revised the discussion to present our interpretations as possible or plausible explanations, rather than definitive conclusions, to better reflect the strength of the current evidence. The changes are marked in green throughout the Discussion section.
This study continues to validate the power and utility of this in human fear conditioning/extinction paradigm, and extends this paradigm to investigating fear learning beyond the traditional limbic system pathways. It's possible that their models for the pulvinar nuclei interconnections could guide future neuromodulation or DBS studies that could provide more causal evidence for their hypotheses.
Reviewer #3 (Public review):
Summary:
The present work was aimed at investigating the specific contributions of thalamic nuclei to associative threat learning and extinction. Using fMRI, they examined activation patterns across pulvinar divisions, the lateral geniculate nucleus (LGN), and the mediodorsal thalamus (MD) during threat acquisition, extinction, and recall. Their goal was to uncover whether distinct thalamic systems support different modes of learningautomatic survival mechanisms versus more deliberate processes - and to propose a hierarchical pulvinar model of fear conditioning. They also try to refine current neuroanatomical models of threat learning and memory, highlighting the role of thalamic nuclei in it.
Strengths:
(1) Valuable theoretical elaboration and modeling regarding the differential role of pulvinar subdivisions on feedforward (inferior, lateral) and higher-order integration (anterior), and their functional interplay with other relevant subcortical and cortical structures in associative threat and extinction learning.
(2) Large sample sizes and multipronged analytical approaches were used for hypothesis testing.
(3) Exhaustive literature review in the field of associative threat, as well as regarding the role of thalamic nuclei and other brain structures in it.
Weaknesses:
(1) Several weaknesses should be pointed out regarding how fMRI data were collected, as well as decisions regarding how the fMRI data were preprocessed and analyzed:
(a) fMRI data have low resolution (3 cubic mm), which certainly limits the examination of small nuclei such as the ones investigated here, and especially the examination of the LGN and inferior pulvinar.
We thank the reviewer for raising this point. While the spatial resolution of fMRI (3 mm isotropic) does limit voxel-wise examination of very small nuclei, our analyses were not performed at the single-voxel level. Instead, signals were extracted using anatomically defined masks for each thalamic nucleus, which is a standard and widely used approach for studying small subcortical structures with fMRI. This strategy increases signal-to-noise ratio and mitigates partial-volume effects by aggregating activity across voxels belonging to the same anatomical region.
(b) fMRI was normalized to standard space. Analyzing the data in individual-subject space would have given you the options of avoiding altering every participant's brain and of using a probabilistic thalamic atlas that better adapts to each subject's brain and thalamic nuclei (see, for instance, Iglesias et al., 2018). This would have been ideal and would have given the authors more precision, especially considering the low resolution of the fMRI data and the size of the thalamic nuclei of interest.
We thank the reviewer for pointing out the availability of specialized thalamic atlases. In our study we used the Automated Anatomical Labelling Atlas 3 (AAL3 atlas), which includes thalamic subdivisions (including pulvinar and other nuclei) among its 150+ whole-brain regions and is widely used for ROI extraction in normalized fMRI analyses. This choice allowed us to define consistent ROIs across the entire brain such as the amygdala and hippocampus within the same parcellation framework and to extract functional signals at the resolution of our preprocessed fMRI data.
While histology-informed probabilistic atlases offer finer microanatomical segmentation of the thalamus, they are implemented primarily for structural segmentation pipelines (e.g., FreeSurfer) and do not change the fact that AAL3’s thalamic subdivisions are established and anatomically reasonable ROIs for functional studies at standard fMRI resolutions. AAL3 thus provides a practical and valid choice for our whole-brain activation and connectivity analyses.
(c) On top of the two previous points, the authors decided to smooth the data to 6mm, which means that every single voxel within these small nuclei was blurred/mixed with the 2 immediately contiguous voxels (if they followed the standard SPM12 normalization resampling default which resamples, or upsamples the data in this case, to 2 x 2 x 2mm). Given the strong changes in structural connectivity and function that can occur, especially in the thalamus, on voxels of this size, this and the previous 2 decisions do not favor anatomical precision.
We thank the reviewer for raising this concern regarding anatomical precision. The data were resampled to 2 × 2 × 2 mm resolution in SPM12, and a 6 mm FWHM Gaussian smoothing kernel was applied. Gaussian smoothing does not uniformly mix immediately adjacent voxels; rather, it applies distance-weighted averaging with a standard deviation of approximately 2.55 mm (FWHM = 2.355σ). At 2 mm resolution, this corresponds to ~1.3 voxels, meaning that signal contribution decreases smoothly with spatial distance rather than reflecting simple voxel averaging. Moreover, all statistical analyses were conducted at the ROI level using anatomically defined masks, rather than voxel-wise inference within nuclei.
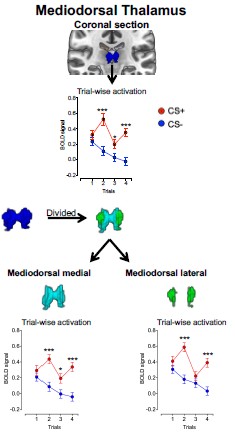
To empirically assess whether smoothing may have introduced boundary-driven spillover effects, we divided the mediodorsal (MD) thalamus into medial and lateral divisions and examined the CS effect separately in each. The CS effect did not differ between subdivisions (MD subdivision X CS interaction: F(1, 292) = 0.50, p = 0.48).
Additionally, across trials, the CS+ vs. CS− effect was observed in both subdivisions and showed comparable magnitudes (see Author response image 1). The effect sizes were also comparable across MD divisions as presented in Author response table 1).
Author response image 1.
Mean activation in MD subdivisions during threat learning
Author response table 1.
Point estimates and 95% confidence intervals of effect sizes (Cohen’s d) for CS+ vs. CS− contrasts in MD, MDm, and MDl During Early Threat Learning
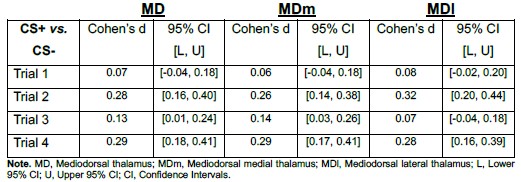
If smoothing had artificially driven the MD effect via boundary spillover, one would expect consistent asymmetry or substantially larger effects in one subdivision relative to the other. Instead, the CS effect was distributed across both medial and lateral MD, supporting the interpretation that the observed activation reflects intrinsic MD signal rather than smoothing-related contamination.
(d) Motion during scanning was poorly controlled in the preprocessing. Including the motion parameters as covariates of no interest in the GLM does not fully guarantee that motion is not influencing the results, and that motion is not differentially influencing some experimental conditions more than others.
Our analyses are within-subject, so each participant serves as their own control, minimizing the impact of motion differences across conditions. Functional data were preprocessed with fMRIPrep 20.0.2, which estimates motion parameters. The motion estimations are included in the GLM to account for residual motion-related variance in SPM12. The connectivity analyses were conducted in CONN, which also includes these motion parameters as regressors and applies additional denoising steps to further reduce motion-related effects. Together, these procedures make it highly unlikely that motion systematically influenced the observed condition differences.
(2) It is not clearly indicated in the manuscript how many subjects and how many trials went into each of the analyses. It would be important to indicate this in the text and/or the figures.
We thank the reviewer for this important comment. We have now explicitly reported the number of participants and trials contributing to each analysis throughout the manuscript, including the main text, figure captions, and supplementary materials.
Specifically, under Materials and Methods (page 38), we now clarify the sample sizes for each learning phase:
“We analyzed fMRI data from 293 participants during fear conditioning, 320 during extinction, 412 during extinction recall, and 312 during threat renewal.”
In addition, all figure captions now report the corresponding sample sizes and trial numbers. For example, the caption to Figure 1 (pages 7–8) states:
“…Block-level comparisons were assessed using paired t-tests, while trial-level effects were examined using a 2 × 2 repeated-measures ANOVA, followed by post hoc comparisons between CS+ and CS− across four trials. Multiple comparisons were controlled using false discovery rate (FDR) correction. Conditioning sample size: n = 293. Detailed statistical parameters are provided in Supplementary Tables 1–2.”
(3) It is not clear either, why, given the large sample size, some of the results were not conducted using reproducibility strategies such as dividing the sample into 2 or 3 groups or using further cross-validation strategies.
Cross-validation strategies were applied to the mediation analyses, which are regressionbased and can be sensitive to extreme values or overfitting, ensuring that observed effects generalize beyond the sample. In contrast, the repeated-measures ANOVA tests within-subject condition differences, and is inherently robust to between-subject variability. For these inferential tests, cross-validation or sample-splitting is not typically applied.
However, following the reviewer’s recommendation, we conducted a cross-validation analysis focusing on the anterior pulvinar and the mediodorsal thalamus, the primary regions of interest in this study. The full sample (N = 293) was randomly divided into three subsamples (n1 = 106, n2 = 91, n3 = 96). For each iteration, we conducted a repeatedmeasures ANOVA (RM-ANOVA) within one subsample and then examined the stability of the CS+ vs. CS− difference in the remaining two subsamples combined. The CS+ vs. CS− difference was statistically significant in most folds for both the mediodorsal thalamus and the anterior pulvinar. Importantly, effect sizes were comparable across folds within each nucleus, indicating stable estimates of the CS effect.
Finally, we observed a comparable pattern of CS+ vs. CS− differences at the trial level in both the mediodorsal thalamus and the anterior pulvinar. Critically, the effect sizes of these differences were stable across most cross-validation folds
(4) Limited testing of alternative hypotheses. The results clearly seem to be a selection of the findings supporting the hypotheses that the authors sought to confirm. (just one example: in the analysis reported in Figures 1-2; are there other correlations between the activation of the anterior pulvinar and MD with other pulvinar nuclei? only the MDanterior Puv is reported).
We thank the reviewer for raising this important point. We would like to clarify that the analyses were not limited to a single, selectively reported association. The relationship between the MD and the anterior pulvinar was evaluated while explicitly accounting for other pulvinar subdivisions, as well as for thalamic input outside the pulvinar.
Specifically, potential contributions from other pulvinar nuclei were controlled by including them in the regression model (Fig. 2 in the manuscript), and the LGN was included as an additional control region. These analyses therefore test whether the MD–anterior pulvinar association is specific, rather than reflecting a more general thalamic or pulvinar-wide effect. With respect to hypothesis testing, the study was explicitly hypothesis-driven, grounded in functional evidence motivating a specific prediction about MD–anterior pulvinar interactions.
Still, in response to the reviewer’s suggestion, we further examined pairwise relationships among thalamic subregions. Specifically, we assessed the association between the MD and each pulvinar subdivision using partial correlations, controlling for the remaining pulvinar subdivisions in each analysis. For example, the partial correlation between the MD and the lateral pulvinar was computed while controlling for the activation of the anterior, inferior, and medial pulvinar subdivisions.
The partial correlation between the MD and the anterior pulvinar was consistent across all four trials of threat learning, whereas the other pulvinar subdivisions did not exhibit a consistent pattern. To evaluate the robustness of these effects, we applied a bootstrap procedure (10,000 resamples) to estimate 95% confidence intervals for each partial correlation. As presented in Figure 4b, only the anterior pulvinar–MD association remained robust, with confidence intervals that did not include zero. In contrast, the confidence intervals for most other pulvinar subdivisions included zero, indicating non-robust associations.
(5) The manuscript does not contain a limitations subsection. Practically every study has limitations, and this one is not an exception. Better to tell the limitations to the readers upfront so they can factor them into their evaluation of the relevance of the manuscript and reported evidence.
We thank the reviewer for this constructive suggestion. While the original manuscript already discussed key limitations in the Discussion section (page 36; e.g., “Although distinct thalamic roles in threat learning have been proposed, fMRI data do not fully capture the complexity of this structure…”), we agree that these considerations would benefit from clearer organization and visibility.
To address this point directly, we have now added a dedicated “Limitations and Future Directions” subsection to the manuscript. This subsection explicitly summarizes the principal limitations of the study—including methodological constraints of fMRI and anatomical resolution—and outlines specific avenues for future research to address them. This change makes the limitations more transparent and allows readers to more easily incorporate them into their evaluation of the findings.
(6) Data should be made available to the scientific community. Code too. Even if you just used standard fMRI toolboxes, any code used to run analyses will be helpful to the community, or if someone decides to try to replicate your findings.
We thank the reviewer for this important suggestion and fully agree with the value of data and code sharing for transparency and reproducibility.
The data supporting the findings of this study are derived from a larger, actively used database that is currently involved in ongoing projects. For this reason, the full dataset cannot yet be publicly released. However, the data underlying the reported analyses are available upon reasonable request from the corresponding author, subject to standard data-use agreements.
To facilitate reproducibility, all analysis scripts and pipelines used in this study—including preprocessing and analysis workflows implemented in SPM12, and CONN—are available upon request and can be shared with researchers seeking to replicate or extend the reported findings.
We have clarified this data and code availability statement in the manuscript (page 46).
Despite these weaknesses and what can be derived from them, this manuscript constitutes a valuable contribution to the field to start characterizing and conceptualizing the involvement of thalamic nuclei and their interactions with other brain regions in the associative threat learning circuitries. It also paves the road for further testing of the functional dynamics among these regions and circuitries, and modeling testing.
Recommendations for the authors:
Editor's note:
Should you choose to revise your manuscript, if you have not already done so, please include full statistical reporting including exact p-values wherever possible alongside the summary statistics (test statistic and df) and, where appropriate, 95% confidence intervals. These should be reported for all key questions and not only when the p-value is less than 0.05 in the main manuscript.
We thank the editors for this important note. Full statistical reporting, including test statistics, degrees of freedom, exact (raw and corrected) p-values, effect sizes, and 95% confidence intervals, is provided for all key analyses in Supplementary Tables 1–9. In addition, uncertainty estimates and major statistics tests are now explicitly reported throughout the main text, as recommended by the reviewers, irrespective of statistical significance.
During this revision process, we conducted a comprehensive internal consistency check of all reported statistics and figure annotations. We identified and corrected minor discrepancies between some statistical annotations in the figures and the corresponding results reported in the Supplementary Tables. All figures have now been updated to ensure full consistency with the reported analyses. These corrections do not alter the results or conclusions of the study.
Reviewer #1 (Recommendations for the authors):
(1) What is the significance of using two different head coils? Were the data comparable from each coil? How did the authors determine this?
We thank the reviewer for this important question. Data were acquired using two different receiver head coils across participants. Receiver coils primarily influence signal-to-noise ratio (SNR) and spatial sensitivity profiles, rather than the physiological basis of the BOLD response itself (Triantafyllou et al., 2011).
Importantly, all analyses were based on within-subject contrasts (CS+ vs. CS−), which are robust to global signal scaling differences that may arise from coil sensitivity variations. In addition, standard preprocessing procedures—including intensity normalization, spatial normalization, and nuisance regression—further minimized potential coil-related variability.
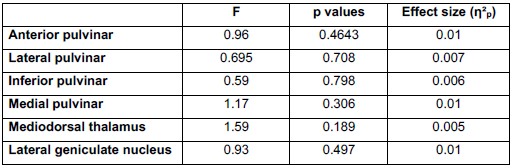
To empirically evaluate whether acquisition differences influenced our results, we conducted a repeated-measures ANOVA testing the Trial × CS × Site interaction (where Site reflects acquisition location and associated scanning setup, including receiver coil configuration) during fear conditioning (N = 293). As shown in Author response table 2, none of the thalamic nuclei demonstrated a significant interaction effect, and all effect sizes were negligible (η2p ≤ .01)
Author response table 2.
Repeated-Measures ANOVA results for the Trial X CS X site interaction across all relevant thalamic nuclei during fear conditioning.
(2) Why were the data smoothed? This could have a negative impact on the specificity of the signals averaged within the pre-defined thalamic ROIs.
Spatial smoothing was applied to improve signal-to-noise ratio and statistical stability in small, deep thalamic subregions, which are particularly susceptible to noise. We acknowledge that smoothing can reduce spatial specificity. However, our analyses were based on anatomically predefined thalamic ROIs and focused on average activation within each region rather than voxel-wise localization. Under this approach, modest smoothing (i.e., a 6-mm full-width at half-maximum smoothing kernel, rather than the commonly used 8-mm kernel) primarily increases reliability while any signal mixing across adjacent regions would be expected to reduce regional specificity and bias effects toward the null, rather than produce spurious or false-positive differences.
Additionally, we conducted robustness analyses to examine whether spatial smoothing artificially influenced our results. Specifically, we subdivided the mediodorsal thalamus into medial and lateral anatomical regions and compared activation across these subregions. The activation patterns were comparable across both subdivisions, indicating that the observed mediodorsal thalamus effect is unlikely to reflect boundary spillover resulting from smoothing. If smoothing had driven the effect, we would expect differential signal patterns across the subdivisions rather than comparable activation. (See full response to Weakness C, Reviewer 3, as well as Author response image 1 and Author response table 1 in our response).
(3) Did the authors consider using any null models to determine whether the observed PPI results could have been observed by chance? E.g., block-resampling nulls scramble temporal order while preserving temporal autocorrelation, and can determine whether subtle differences in autocorrelation across regions can give rise to the observed signatures.
We thank the reviewer for this thoughtful suggestion. All PPI analyses were conducted using the default CONN toolbox pipeline. In this framework, PPI effects are estimated within a GLM at the first level following standard denoising procedures that reduce motion- and physiology-related variance and apply temporal filtering. Importantly, PPI effects are modeled as subject-level contrast terms rather than computed from raw timeseries correlations.
Group-level inference was performed on these subject-level contrast estimates using paired t-tests with FDR correction across regions. To further assess whether the observed effects could arise by chance, we additionally performed 10,000 bootstrap resamples of the CS+ vs. CS− differences to evaluate the stability of the effects. While we did not implement explicit block-resampling null models that preserve temporal autocorrelation, the combination of first-level GLM modeling following denoising, large sample size (N ≈ 300), and convergent inferential and resampling procedures provides a rigorous and standard assessment of PPI effects. We have revised the manuscript to clarify these procedures and their rationale.
We added this language to directly address the reviewer’s concern and revised the connectivity analyses section to clarify the workflow (page 44):
“Following standard denoising procedures—including regression of motion- and physiology-related confounds and temporal filtering—condition-dependent connectivity effects were inferred from subjectlevel generalized psychophysiological interaction (gPPI) contrast estimates rather than from raw timeseries correlations. This GLM-based framework reduces the likelihood that observed PPI effects reflect differences in temporal autocorrelation or spectral properties across regions rather than genuine task-dependent interactions.”
(4) The authors may wish to report results in text, as there are currently many demonstrative statements that are not associated with requisite uncertainty estimates, making inference challenging.
We thank the reviewer for this helpful suggestion. We have revised the Results section to explicitly report statistical outcomes in the main text for all key findings, including appropriate uncertainty estimates (e.g., test statistics, effect sizes, and p-values) alongside demonstrative statements. This ensures that all inferences in the text are directly supported by quantitative evidence.
Additionally, the full statistical details, including test statistics, degrees of freedom, effect sizes, 95% confidence intervals, and both raw and FDR-corrected p-values, are provided in Supplementary Tables 1–9. These changes improve clarity and transparency while avoiding redundancy. Newly added text in the Results section is highlighted in green.
(5) I could not find any information about the EBICglasso model in the Methods section, nor information about how the centrality measures were estimated. Given the lack of transparency, I recommend down-weighting the often overly-strong language regarding the conclusions of this analysis.
We have revised and added these details along with other details to the Statistical tests section on pages 42-44:
“Statistical tests
All statistical tests were conducted using JASP versions 0.18.3 and 0.19.3(JASP Team, 2024).
Activation Differences across all phases of threat learning
In each threat learning phase, we used paired t-tests to examen the differences in activation of the thalamic nuclei in response to CS+ vs. CS- at the block level (average activation across trials), and 2x2 RM-ANOVA to estimate the differences in activation at the trial-wise level. Assumptions of sphericity were checked, and Greenhouse-Geisser corrections were applied where necessary. This model was followed by post hoc tests to estimate the differences at the trial level and False discovery rate (FDR) correction was applied for each question.
Network analyses of the within pulvinar relationships during conditioning
The network analyses examined functional relationships between pulvinar divisions. Nodes corresponded to block-level activation estimates of the CS+ minus CS− contrast for each pulvinar division, yielding four nodes (one per division). Networks were estimated using a Gaussian graphical model with EBICglasso (LASSO regularization) based on Pearson correlation matrices, with the EBIC tuning parameter set to γ = 0.5. Edge weights represent partial correlations.
Three centrality measures were computed on the estimated weighted partial-correlation network: node strength, defined as the sum of the absolute edge weights directly connected to a node; closeness, defined as the inverse of the average shortest path length from a node to all other nodes; and betweenness, defined as the proportion of shortest paths between all pairs of nodes that pass through a given node. Shortest paths were computed using inverse edge weights, consistent with standard practice for weighted networks. Centrality indices were normalized.
Network accuracy and centrality stability were assessed using nonparametric bootstrapping (10,000 iterations) to estimate confidence intervals for edge weights and centrality measures. All analyses were conducted in JASP (versions 0.18.3 and 0.19.3) using default settings unless otherwise specified, following the procedures described in Epskamp, Borsboom, and Fried (2018).
Mediation analyses of within pulvinar relationships during conditioning
Mediation models of the relationships between the activations in pulvinar divisions were estimated using the lavaan package (Rosseel, 2012) with maximum likelihood estimation. All variables were zstandardized prior to analysis. Block-level activation estimates from the inferior and lateral pulvinar were entered as predictors, activation in the medial pulvinar was specified as the mediator, and activation in the anterior pulvinar was specified as the outcome variable.
To assess the robustness and generalizability of the mediation effects, we conducted 3-fold crossvalidation. The full sample (N = 293) was randomly partitioned into three non-overlapping sub-samples (n = 91, 96, and 106). In each iteration, the mediation model was estimated in one sub-sample, while the remaining sub-samples were used to assess the stability of parameter estimates and indirect effects. This procedure resulted in six cross-validation iterations, allowing evaluation of whether the direction and magnitude of the indirect effect were consistent across independent subsets of the data. Mediation models were estimated using the lavaan package (Rosseel, 2012) with maximum likelihood estimation. Indirect effects were evaluated using bias-corrected percentile bootstrap confidence intervals based on 10,000 resamples, as recommended by Biesanz, Falk, and Savalei (2010). An indirect effect was considered significant when the 95% confidence interval did not include zero (p < 0.05).”
(6) Bar plots are not effective ways to report group-level data. I recommend replacing all bar plots with visualisations that expose the distribution of the data, such as a violin plot or a raincloud plot.
We thank the reviewer for this suggestion. In general, we agree that visualizations exposing the full data distribution can be highly informative, and we therefore present distribution-based plots for several analyses (e.g., connectivity results). However, for the activation analyses, our primary goal was to highlight trial-to-trial changes and overall patterns across conditions, rather than the distribution of individual data points per se. For this purpose, bar plots provide a clearer representation of the directional effects and facilitate comparison across trials and conditions.
(7) The thought bubbles are atypical of scientific figures.
The figure has been revised to remove the thought bubbles.
(8) Figure 7 - there are many connections not shown in this figure, suggesting that it is sufficiently oversimplified as to be potentially misleading. For instance, the authors offer no anatomical connections between pulvinar and the cortical hierarchy; however, these connections are ample and (likely) highly important for the functionality assessed here. Similarly, there is no room in the figure for the integration of the shock stimuli (presumably via the spinothalamic tract) and the visual stimuli (via the retina/LGn).
We agree that the pulvinar has extensive cortical and sensory input/output connections that are not depicted in Figure 7. Our intention was not to provide a complete anatomical wiring diagram, but rather a simplified functional model derived from observed statistical dependencies. We have revised the figure and added an explicit note to the legend clarifying that pulvinar–cortical and sensory pathways (e.g., retina/LGN and spinothalamic inputs) are intentionally omitted due to incomplete subnuclear-level anatomical characterization, and that their omission should not be interpreted as a lack of importance. We added this to Figure 7 legend:
“Note (panel a):
Known pulvinar–cortical connections, as well as sensory input pathways (e.g., visual inputs via the retina/LGN and nociceptive inputs via the spinothalamic tract), are not explicitly shown. These connections are well established anatomically but were omitted due to their heterogeneity and incomplete characterization at the level of pulvinar subnuclei. Their absence should not be interpreted as a lack of anatomical or functional relevance.”
Reviewer #2 (Recommendations for the authors):
(1) It's somewhat confusing that Figures 1,4,5 D and E are not in the text until later in the results section. Perhaps these should be presented in the figures in the same order they are discussed in the text, although this is a stylistic issue.
We thank the reviewer for this comment. To improve clarity and align the figures with the structure of the Results section, we reorganized the figures. Specifically, we added a new figure (Figure 7) that consolidates all connectivity analyses. Figures 1, 4, and 5 now focus exclusively on activation results, while Figure 7 presents connectivity results only. This reorganization allows the figures to follow the flow of the text more closely and makes the narrative of each figure clearer.
(2) Stylistic: I would strongly recommend adding n numbers and describing the basics of statistical tests used and how multiple comparisons were accounted for in the legend for Figures 1,4, and 5.
We thank the reviewer for this recommendation. We have added the sample sizes (n) and brief descriptions of the statistical tests used, including how multiple comparisons were handled, to the legends of Figures 1, 4, and 5. In addition, we direct the reader to the Supplementary Tables, which were submitted with the original manuscript and provide full statistical details, including test statistics (t, F), degrees of freedom, effect sizes, 95% confidence intervals, raw p values, and corrected p values. Finally, we further elaborated on the statistical tests on pages 42–44, as detailed in our response to Recommendation 5 (Reviewer 1).
Reviewer #3 (Recommendations for the authors):
As previously indicated, please note that no information is included in the manuscript about data and code availability. Although you mainly use toolboxes for data analyses, any script(s) that you have used to run things would be great to upload for reproducibility purposes.
Also, it would be good to include a limitations subsection in the manuscript.
Thank you for these recommendations. We added limitations subsection to the manuscript. See our responses under Comments 5 and 6 (Reviewer 3, Public Review).
In terms of data analyses:
(1) It would be ideal if you quantify in-scanner motion for the different conditions to see if there were no differences in motion due to the task.
Head motion was estimated at each time point as part of standard preprocessing, and motion parameters were included as nuisance regressors in all first-level models. Because motion estimates are defined per volume rather than per experimental condition, condition-specific motion metrics were not explicitly computed. Importantly, this approach removes motion-related variance uniformly across the time series and therefore controls for potential motion effects across all task conditions. Any residual motion would be expected to increase noise rather than systematically bias condition contrasts.
(2) You also may want to indicate if normalization followed the SPM 12 default and the data was resampled to 2 x 2 x 2 mm, or kept the same. It is not stated in the data preprocessing subsection of the methods.
We thank the reviewer for this suggestion. We have now clarified this point in the manuscript (page 41):
“In addition, spatial normalization was performed with data normalized to Montreal Neurological Institute (MNI) space and resampled to a 2 × 2 × 2 mm3 voxel grid, followed by spatial smoothing with a 6-mm full-width at half-maximum Gaussian kernel.”
(3) It is important to indicate how many subjects went into each analysis. Also, it is not clear, based on the current methods section, how many observations per condition were used. That can be reported in the text or the figures.
We thank the reviewer for this comment. This information has now been added to the Methods section and the relevant figure legends, as described in our response to Comment 2 (Reviewer 3, Public Review).
References
Triantafyllou C, Polimeni JR, Wald LL. 2011. Physiological noise and signal-to-noise ratio in fMRI with multi-channel array coils. NeuroImage 55:597–606. DOI: https://doi.org/10.1016/j.neuroimage.2010.11.084, PMID: 21167946
-
-
Author response:
We thank the reviewers and editors for their thoughtful and constructive feedback. We have carefully considered the comments and plan to revise the manuscript as follows:
· Methods: We will expand the Methods section to provide additional details regarding the Pavlovian fear conditioning procedure, including instructions, experimental parameters, and the randomization process.
· Figures and Statistical Reporting: We will break down some figures where appropriate and clearly display the distributions of key variables. We will also include additional statistical details in the main text and elaborate on the analyses where needed.
· Language and Interpretation: We will revise the text to consistently use correlational rather than causal terminology, ensuring that our conclusions accurately reflect the findings from the …
Author response:
We thank the reviewers and editors for their thoughtful and constructive feedback. We have carefully considered the comments and plan to revise the manuscript as follows:
· Methods: We will expand the Methods section to provide additional details regarding the Pavlovian fear conditioning procedure, including instructions, experimental parameters, and the randomization process.
· Figures and Statistical Reporting: We will break down some figures where appropriate and clearly display the distributions of key variables. We will also include additional statistical details in the main text and elaborate on the analyses where needed.
· Language and Interpretation: We will revise the text to consistently use correlational rather than causal terminology, ensuring that our conclusions accurately reflect the findings from the fMRI data.
· Computational Model of the Pulvinar: We will further elaborate on the assumptions and limitations of the intra-pulvinar model, discuss potential neural pathways and candidate regions (e.g., visual cortex), and highlight directions for future work, including studies in nonhuman primates to investigate anatomical connectivity.
· Alternative Hypotheses of the mediodorsal thalamus-anterior pulvinar relationships: Other pulvinar subregions were already included as covariates in our hierarchical regression analyses, allowing us to account for anatomical proximity and shared variance. We will make this analysis more explicit and clarify the thinking process behind this analysis to allow readers to assess the specificity of the anterior pulvinar-mediodorsal thalamus relationship.
· Limitations: We will add a dedicated subsection outlining key limitations, including considerations specific to fMRI studies.
· Data Availability: All data and materials used in this study will be made available upon request from the corresponding author, subject to obtaining the necessary institutional authorization for the data-sharing agreement.
We are confident that these revisions will enhance the clarity, transparency, and interpretability of the work, and we are grateful to the reviewers for their valuable suggestions. We will provide a detailed, point-by-point response along with the revised submission as soon as possible.
-
eLife Assessment
The study provides valuable insights into the role of thalamic nuclei in associative threat and extinction learning, supported by a large dataset and multipronged analyses. However, aspects of the evidence remain incomplete, particularly regarding the statistical methods, the claims of plasticity, and the network modeling framework. With this addressed, this manuscript will be of interest to those interested in learning and memory, fear, thalamic circuitry, and related mental heath conditions.
-
Reviewer #1 (Public review):
Summary:
Badarnee and colleagues analyse fMRI data collected during an associative threat-learning task. They find evidence for parallel processes mediated by the mediodorsal, LGn, and pulvinar nuclei of the thalamus. The evidence for these conclusions is promising, but limited by a lack of clarity regarding the preprocessing and statistical methods.
Strengths:
The approach is inventive and novel, providing information about thalamocortical interactions that are scant in the current literature.
Weaknesses:
(1) There are not sufficient details present to allow for the direct interrogation of the methods used in the study.
(2) The figures do not contain sufficiently granular details, making it challenging to determine whether the observed effects were robust to individual differences.
-
Reviewer #2 (Public review):
Summary:
The authors quantify human fMRI BOLD responses in pulvinar and mediodorsal thalamic nuclei during a fear conditioning and extinction task across two days, in a large sample size (hundreds of participants). They show that the BOLD responses in these areas differentiate the conditioned (CS+) and safety (CS-) stimuli. Additionally, this changes with repeated trials, which could be a neural correlate of fear learning. They show that the anterior pulvinar is most correlated with the MD, and that this is not due to anatomical proximity. They perform graph analysis on the pulvinar subnuclei, which suggests that the medial pulvinar is a hub between the sensory (lateral/inferior) and associative (anterior) pulvinar. They show different patterns of thalamic activity across conditioning, extinction, recall, …
Reviewer #2 (Public review):
Summary:
The authors quantify human fMRI BOLD responses in pulvinar and mediodorsal thalamic nuclei during a fear conditioning and extinction task across two days, in a large sample size (hundreds of participants). They show that the BOLD responses in these areas differentiate the conditioned (CS+) and safety (CS-) stimuli. Additionally, this changes with repeated trials, which could be a neural correlate of fear learning. They show that the anterior pulvinar is most correlated with the MD, and that this is not due to anatomical proximity. They perform graph analysis on the pulvinar subnuclei, which suggests that the medial pulvinar is a hub between the sensory (lateral/inferior) and associative (anterior) pulvinar. They show different patterns of thalamic activity across conditioning, extinction, recall, and renewal.
Strengths:
The data has a large sample size (n=293 in some measures, n=412 in others). This is a validated human fear conditioning/extinction task that Dr Milad's group has been working with for several years. Few labs have investigated the thalamus activity during fear conditioning and extinction, particularly with a large sample size. There is an independent replication of the pulvinar network structure (Figure 3), which suggests that the processing in the more sensory-related inferior and lateral pulvinar is relayed to the anterior pulvinar (and possibly thereby to more action-related prefrontal areas) via an intermediate step in the medial pulvinar - potentially a novel discovery, but that needs more validation.
Weaknesses:
(1) The authors cannot make causal claims about their results based on correlational neuroimaging evidence. Causal claims should be pared back. E.g., sentence 1 in the Results section: "The anterior pulvinar and MD contribute to early associative threat learning, as evidenced by increased functional activation in response to CS+ compared to CS- at the block level (Fig. 1b-c)." needs to be reworded to something like "The anterior pulvinar and MD have increased functional activation... This suggests that these areas may contribute to early associate threat learning."
(2) Figure 1: The fact that the difference in BOLD activity between CS+ and CS- goes away on the third trial is not addressed. This is a very large effect in the data.
(3) Figure 3: Could the observed network structure be due to anatomical proximity? Perhaps the authors should do an analogous analysis to what they did in Figure 2 for this intra-pulvinar analysis. This analysis doesn't take into account the indirect connections through corticothalamic and thalamocortical connections with the visual cortex and the pulvinar. There is an implicit assumption that there are interconnections between the pulvinar subnuclei, but there are few strong excitatory projections between these subnuclei to my knowledge. If visual areas are included in the graph, it would make things more complex, but would probably dramatically change the story. In this way, the message is somewhat constructed or arbitrary.
(3) In the results section describing Figures 4-7, there are no statistics supporting the claims made. There needs to be a set of graphs comparing the results across the study sessions and days, with statistical comparisons between the different experiments to confirm differences.
(4) Figure 7 does not include the major corticothalamic and thalamocortical projections from early, mid-level, and higher visual cortex to the different pulvinar nuclei. I doubt that there are strong direct projections between the pulvinar nuclei; rather, the functional connections are probably mediated through interconnections with cortical visual areas.
(5) Stylistic: There are a lot of hypotheses and interpretations presented in this primary literature paper, which may be better suited for a review or perspective piece.
(6) In the discussion, there is an assumption that the fMRI BOLD responses to CS+ and CS- need to be different to indicate that an area is processing these distinctly, but the BOLD signal can only detect large-scale changes in overall activity. It's easy to imagine that an area could be involved in processing these two stimuli distinctly without showing an overall difference in the gross amount of activity.
(7) There is strong evidence that the BOLD responses to the threat-related and safety-related stimuli are different, modest evidence for their claims of learning/plasticity in these pathways, and circumstantial evidence supporting their hypothesized graph network models. Overall, most of the claims made in the discussion are better considered possible interpretations rather than proven findings - this is not a criticism, as these experiments and subject matter are extremely complex.
This study continues to validate the power and utility of this in human fear conditioning/extinction paradigm, and extends this paradigm to investigating fear learning beyond the traditional limbic system pathways. It's possible that their models for the pulvinar nuclei interconnections could guide future neuromodulation or DBS studies that could provide more causal evidence for their hypotheses.
-
Reviewer #3 (Public review):
Summary:
The present work was aimed at investigating the specific contributions of thalamic nuclei to associative threat learning and extinction. Using fMRI, they examined activation patterns across pulvinar divisions, the lateral geniculate nucleus (LGN), and the mediodorsal thalamus (MD) during threat acquisition, extinction, and recall. Their goal was to uncover whether distinct thalamic systems support different modes of learning-automatic survival mechanisms versus more deliberate processes - and to propose a hierarchical pulvinar model of fear conditioning. They also try to refine current neuroanatomical models of threat learning and memory, highlighting the role of thalamic nuclei in it.
Strengths:
(1) Valuable theoretical elaboration and modeling regarding the differential role of pulvinar …
Reviewer #3 (Public review):
Summary:
The present work was aimed at investigating the specific contributions of thalamic nuclei to associative threat learning and extinction. Using fMRI, they examined activation patterns across pulvinar divisions, the lateral geniculate nucleus (LGN), and the mediodorsal thalamus (MD) during threat acquisition, extinction, and recall. Their goal was to uncover whether distinct thalamic systems support different modes of learning-automatic survival mechanisms versus more deliberate processes - and to propose a hierarchical pulvinar model of fear conditioning. They also try to refine current neuroanatomical models of threat learning and memory, highlighting the role of thalamic nuclei in it.
Strengths:
(1) Valuable theoretical elaboration and modeling regarding the differential role of pulvinar subdivisions on feedforward (inferior, lateral) and higher-order integration (anterior), and their functional interplay with other relevant subcortical and cortical structures in associative threat and extinction learning.
(2) Large sample sizes and multipronged analytical approaches were used for hypothesis testing.
(3) Exhaustive literature review in the field of associative threat, as well as regarding the role of thalamic nuclei and other brain structures in it.
Weaknesses:
(1) Several weaknesses should be pointed out regarding how fMRI data were collected, as well as decisions regarding how the fMRI data were preprocessed and analyzed:
a) fMRI data have low resolution (3 cubic mm), which certainly limits the examination of small nuclei such as the ones investigated here, and especially the examination of the LGN and inferior pulvinar.
b) fMRI was normalized to standard space. Analyzing the data in individual-subject space would have given you the options of avoiding altering every participant's brain and of using a probabilistic thalamic atlas that better adapts to each subject's brain and thalamic nuclei (see, for instance, Iglesias et al., 2018). This would have been ideal and would have given the authors more precision, especially considering the low resolution of the fMRI data and the size of the thalamic nuclei of interest.
c) On top of the two previous points, the authors decided to smooth the data to 6mm, which means that every single voxel within these small nuclei was blurred/mixed with the 2 immediately contiguous voxels (if they followed the standard SPM12 normalization resampling default which resamples, or upsamples the data in this case, to 2 x 2 x 2mm). Given the strong changes in structural connectivity and function that can occur, especially in the thalamus, on voxels of this size, this and the previous 2 decisions do not favor anatomical precision.
d) Motion during scanning was poorly controlled in the preprocessing. Including the motion parameters as covariates of no interest in the GLM does not fully guarantee that motion is not influencing the results, and that motion is not differentially influencing some experimental conditions more than others.
(2) It is not clearly indicated in the manuscript how many subjects and how many trials went into each of the analyses. It would be important to indicate this in the text and/or the figures.
(3) It is not clear either, why, given the large sample size, some of the results were not conducted using reproducibility strategies such as dividing the sample into 2 or 3 groups or using further cross-validation strategies.
(4) Limited testing of alternative hypotheses. The results clearly seem to be a selection of the findings supporting the hypotheses that the authors sought to confirm. (just one example: in the analysis reported in Figures 1-2; are there other correlations between the activation of the anterior pulvinar and MD with other pulvinar nuclei? only the MD-anterior Puv is reported).
(5) The manuscript does not contain a limitations subsection. Practically every study has limitations, and this one is not an exception. Better to tell the limitations to the readers upfront so they can factor them into their evaluation of the relevance of the manuscript and reported evidence.
(6) Data should be made available to the scientific community. Code too. Even if you just used standard fMRI toolboxes, any code used to run analyses will be helpful to the community, or if someone decides to try to replicate your findings.
Despite these weaknesses and what can be derived from them, this manuscript constitutes a valuable contribution to the field to start characterizing and conceptualizing the involvement of thalamic nuclei and their interactions with other brain regions in the associative threat learning circuitries. It also paves the road for further testing of the functional dynamics among these regions and circuitries, and modeling testing.
-
