Differential Regulation of Hepatic Macrophage Fate by Chi3l1 in MASLD
Curation statements for this article:-
Curated by eLife

eLife Assessment
This study provides an insight into the role of a Chi3l1 in liver macrophages during metabolic disease. The evidence is solid with the authors now addressing most concerns, although one key conclusion is not fully supported by the data presented. Overall, the work offers a useful contribution to the field.
This article has been Reviewed by the following groups
Discuss this preprint
Start a discussion What are Sciety discussions?Listed in
- Evaluated articles (eLife)
Abstract
Metabolic dysfunction-associated steatotic liver disease (MASLD) progression involves the replacement of protective embryo-derived Kupffer cells (KCs) by inflammatory monocyte-derived macrophages (MoMFs), yet the regulatory mechanisms remain unclear. Here, we identify chitinase 3-like 1 (Chi3l1/YKL-40) as a critical metabolic regulator of hepatic macrophage fate. We observed high expression of Chi3l1 in both KCs and MoMFs during MASLD development. Genetic deletion of Chi3l1 specifically in KCs significantly exacerbated MASLD severity and metabolic dysfunction, whereas MoMF-specific Chi3l1 deletion showed minimal metabolic effects. Mechanistic studies revealed that this cell type-specific regulation arises from differential metabolic requirements: KCs display elevated glucose metabolism compared to MoMFs. Chi3l1 directly interacts with glucose to inhibit its cellular uptake, thereby selectively protecting glucose-dependent KCs from metabolic stress-induced cell death while having negligible effects on less glucose-dependent MoMFs. These findings uncover a novel Chi3l1-mediated metabolic checkpoint that preferentially maintains KCs populations through glucose metabolism modulation, providing important new insights into the pathogenesis of MASLD and potential therapeutic strategies targeting macrophage-specific metabolic pathways.
Article activity feed
-

-
-

eLife Assessment
This study provides an insight into the role of a Chi3l1 in liver macrophages during metabolic disease. The evidence is solid with the authors now addressing most concerns, although one key conclusion is not fully supported by the data presented. Overall, the work offers a useful contribution to the field.
-
Reviewer #2 (Public review):
In this revised version of the manuscript, the authors have addressed many of my concerns. The representative confocal images now provided, allow for a much better assessment of the claims being made and hence the data to be understood, for example the level of protein expression of Chi3l1 in the macrophages.
There is just 1 concern remaining, which is a main claim of the manuscript, that loss of Chi3l1 drives KC death in MASLD. This claim is made based on gene expression profiles and the presence of Tunel staining in liver sections. However the KC numbers are not altered compared with WT when assessed by flow cytometry. This discrepancy is not really addressed. If the cells are not actually dying this would explain the lack of moKCs (a concern raised by reviewer 1) and would indeed suggest that the loss of …
Reviewer #2 (Public review):
In this revised version of the manuscript, the authors have addressed many of my concerns. The representative confocal images now provided, allow for a much better assessment of the claims being made and hence the data to be understood, for example the level of protein expression of Chi3l1 in the macrophages.
There is just 1 concern remaining, which is a main claim of the manuscript, that loss of Chi3l1 drives KC death in MASLD. This claim is made based on gene expression profiles and the presence of Tunel staining in liver sections. However the KC numbers are not altered compared with WT when assessed by flow cytometry. This discrepancy is not really addressed. If the cells are not actually dying this would explain the lack of moKCs (a concern raised by reviewer 1) and would indeed suggest that the loss of these cells is, as suggested by that reviewer, trivial in this timeframe. The authors propose in their rebuttal that the KCs are in a prolonged state of stress, explaining the Tunel staining, but to make the claim that they die, the authors need to show their eventual loss from the liver. Otherwise the claims of death should be revised.
-
Reviewer #3 (Public review):
This paper investigates the role of Chi3l1 in regulating the fate of liver macrophages in the context of metabolic dysfunction leading to the development of MASLD.
Comments on revisions:
My comments have been addressed.
-
Author response:
The following is the authors’ response to the previous reviews
Public Reviews:
Reviewer #1 (Public review):
The manuscript by Shan et al seeks to define the role of the CHI3L1 protein in macrophages during the progression of MASH. The authors argue that the Chil1 gene is expressed highly in hepatic macrophages. Subsequently, they use Chil1 flx mice crossed to Clec4F-Cre or LysM-Cre to assess the role of this factor in the progression of MASH using a high fat high, fructose diet (HFFC). They found that loss of Chil1 in KCs (Clec4F Cre) leads to enhanced KC death and worsened hepatic steatosis. Using scRNA seq they also provide evidence that loss of this factor promotes gene programs related to cell death. From a mechanistic perspective they provide evidence that CHI3L serves as a glucose sink and thus loss of this …
Author response:
The following is the authors’ response to the previous reviews
Public Reviews:
Reviewer #1 (Public review):
The manuscript by Shan et al seeks to define the role of the CHI3L1 protein in macrophages during the progression of MASH. The authors argue that the Chil1 gene is expressed highly in hepatic macrophages. Subsequently, they use Chil1 flx mice crossed to Clec4F-Cre or LysM-Cre to assess the role of this factor in the progression of MASH using a high fat high, fructose diet (HFFC). They found that loss of Chil1 in KCs (Clec4F Cre) leads to enhanced KC death and worsened hepatic steatosis. Using scRNA seq they also provide evidence that loss of this factor promotes gene programs related to cell death. From a mechanistic perspective they provide evidence that CHI3L serves as a glucose sink and thus loss of this molecule enhances macrophage glucose uptake and susceptibility to cell death. Using a bone marrow macrophage system and KCs they demonstrate that cell death induced by palmitic acid is attenuated by the addition of rCHI3L1. While the article is well written and potentially highlights a new mechanism of macrophage dysfunction in MASH and the authors have addressed some of my concerns there are some concerns about the current data that continue to limit my enthusiasm for the study. Please see my specific comments below.
Major:
(1) The authors' interpretation of the results from the KC (Clec4F) and MdM KO (LysMCre) experiments is flawed. The authors have added new data that suggests LyM-Cre only leads to a 40% reduction of Chil1 in KCs and that this explains the difference in the phenotype compared to the Clec4F-Cre. However, this claim would be made stronger using flow sorted TIM4hi KCs as the plating method can lead to heterogenous populations and thus an underestimation of knockdown by qPCR. Moreover, in the supplemental data the authors show that Clec4f-Cre x Chil1flx leads to a significant knockdown of this gene in BMDMs. As BMDMs do not express Clec4f this data calls into question the rigor of the data. I am still concerned that the phenotype differences between Clec4f-cre and LyxM-cre is not related to the degree of knockdown in KCs but rather some other aspect of the model (microbiota etc). It woudl be more convincing if the authors could show the CHI3L reduction via IF in the tissue of these mice.
We thank the reviewer for these constructive comments. We have performed FACSsorting of KCs (CD45+ F4/80hi CD11blow TIM4hi) or MoMFs (CD45+ F4/80low CD11bhi Ly6G- TIM4-) from Chil1fl/fl and Lyz2∆Chil1 or Clec4f∆Chil1mice, respectively. Compared with Chil1fl/fl mice, mRNA levels of Chil1 was reduced more than 90% in KCs from Clec4f∆Chil1 mice while not different in MoMFs (Revised Figure S3B). Besides, compared with Chil1fl/fl mice, mRNA levels of Chil1 was reduced more than 90% in MoMFs from Lyz2∆Chil1 mice while roughly 40% in KCs (Revised Figure S5B). This revised data support the phenotypic difference between Lyz2-CKO and Clec4f-CKO mice.
We agree with the reviewer that the significant knockdown of Chil1 in BMDM from Clec4f∆Chil1mice is confusing. To keep the rigor of our data, we remove this part from our manuscript.
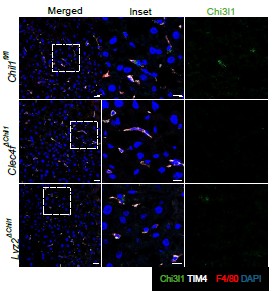
Additionally, we performed immunofluorescence staining to detect Chi3l1 expression in liver tissues of these mice. The results show a reduction of Chi3l1 expression in KCs (TIM4+F4/80+ cells) of both Lyz2∆Chil1and Clec4f∆Chil1mice, with a more pronounced decrease in Clec4f∆Chil1mice (Author response image 1).
Author response image 1.
The expression of Chi3l1 in liver tissues of Chil1fl/fl, Lyz2∆Chil1and Clec4f∆Chil1mice. Immunofluorescent staining to detect Chi3l1(green) expression in liver sections of Chil1fl/fl, Lyz2∆Chil1and Clec4f∆Chil1mice under normal chow diet. TIM4 (KCs marker, white), F4/80 (macrophage marker, red), nuclei were counterstained with DAPI, Scale bar=20 µm and 10 µm (Inset).
(2) Figure 4 suggests that KC death is increased with KO of Chil1. The authors have added new data with TIM4 tht better characterizes this phenotype. The lack of TIM4 low, F4/80 hi cells further supports that their diet model is not producing any signs of the inflammatory changes that occur with MASLD and MASH. This is also supported by no meaningful changes in the CD11b hi, F4/80 int cells that are predominantly monocytes and early Mdms). It is also concerning that loss of KCs does not lead to an increase in Mo-KCs as has been demonstrated in several studies (PMID37639126, PMID:33997821). This would suggest that the degree of resident KC loss is trivial.
We appreciate the reviewer’s insightful comment. We agree that our data show no substantial generation of monocyte-derived Kupffer cells (MoKCs) within the 16-week HFHC model. However, we do not believe the degree of resident KC loss is trivial, since 60% of KCs die at 16 weeks compared with 0 week (Revised Figure 5D). Instead, our observations align with a phased replacement model: recruited monocytes first differentiate into monocyte-derived macrophages (MoMFs), which we see accumulate (Revised Figure 5D), and only later adopt a KC phenotype. Consistent with this, our 16-week model shows significant EmKC loss and MoMFs expansion, but not yet the emergence of TIM4-MoKCs. This timing is supported by prior studies, where TIM4KCs were observed at 24 weeks, but not at 16 weeks, on similar diets (PMID: 33440159; PMID: 32888418). Therefore, we interpret our findings as capturing an earlier phase of MASLD progression, characterized by EmKC death and MoMF accumulation, prior to their full differentiation into MoKCs.
(3) The authors demonstrated that Clec4f-Cre itself was not responsible for the observed phenotype, which mitigates my concerns about this influencing their model.
We thank the reviewer for this comment and are pleased they agree that our control experiment using Clec4f-Cre alone confirms that the phenotype is specific to our genetic manipulation and not an artifact of the Cre driver.
(4) I remain somewhat concerned about the conclusion that Chil1 is highly expressed in liver macrophages. The author agrees that mRNA levels of this gene are hard to see in the datasets; however, they argue that IF demonstrates clear evidence of the protein, CHI3L. The IF in the paper only shows a high power view of one KC. I would like to see what percentage of KCs express CHI3L and how this changes with HFHC diet. In addition, showing the knockout IF would further validate the IF staining patterns.
We thank the reviewer for their thoughtful and constructive feedback. We agree that our initial conclusion regarding Chil1 expression in liver macrophages relied heavily on prior observations and was not sufficiently supported by the data presented. In response, we have revised our conclusion to state: "Hepatic macrophages express Chi3l1 and upregulate its expression following HFHC feeding." (Revised manuscript, page 4, line 136-137)
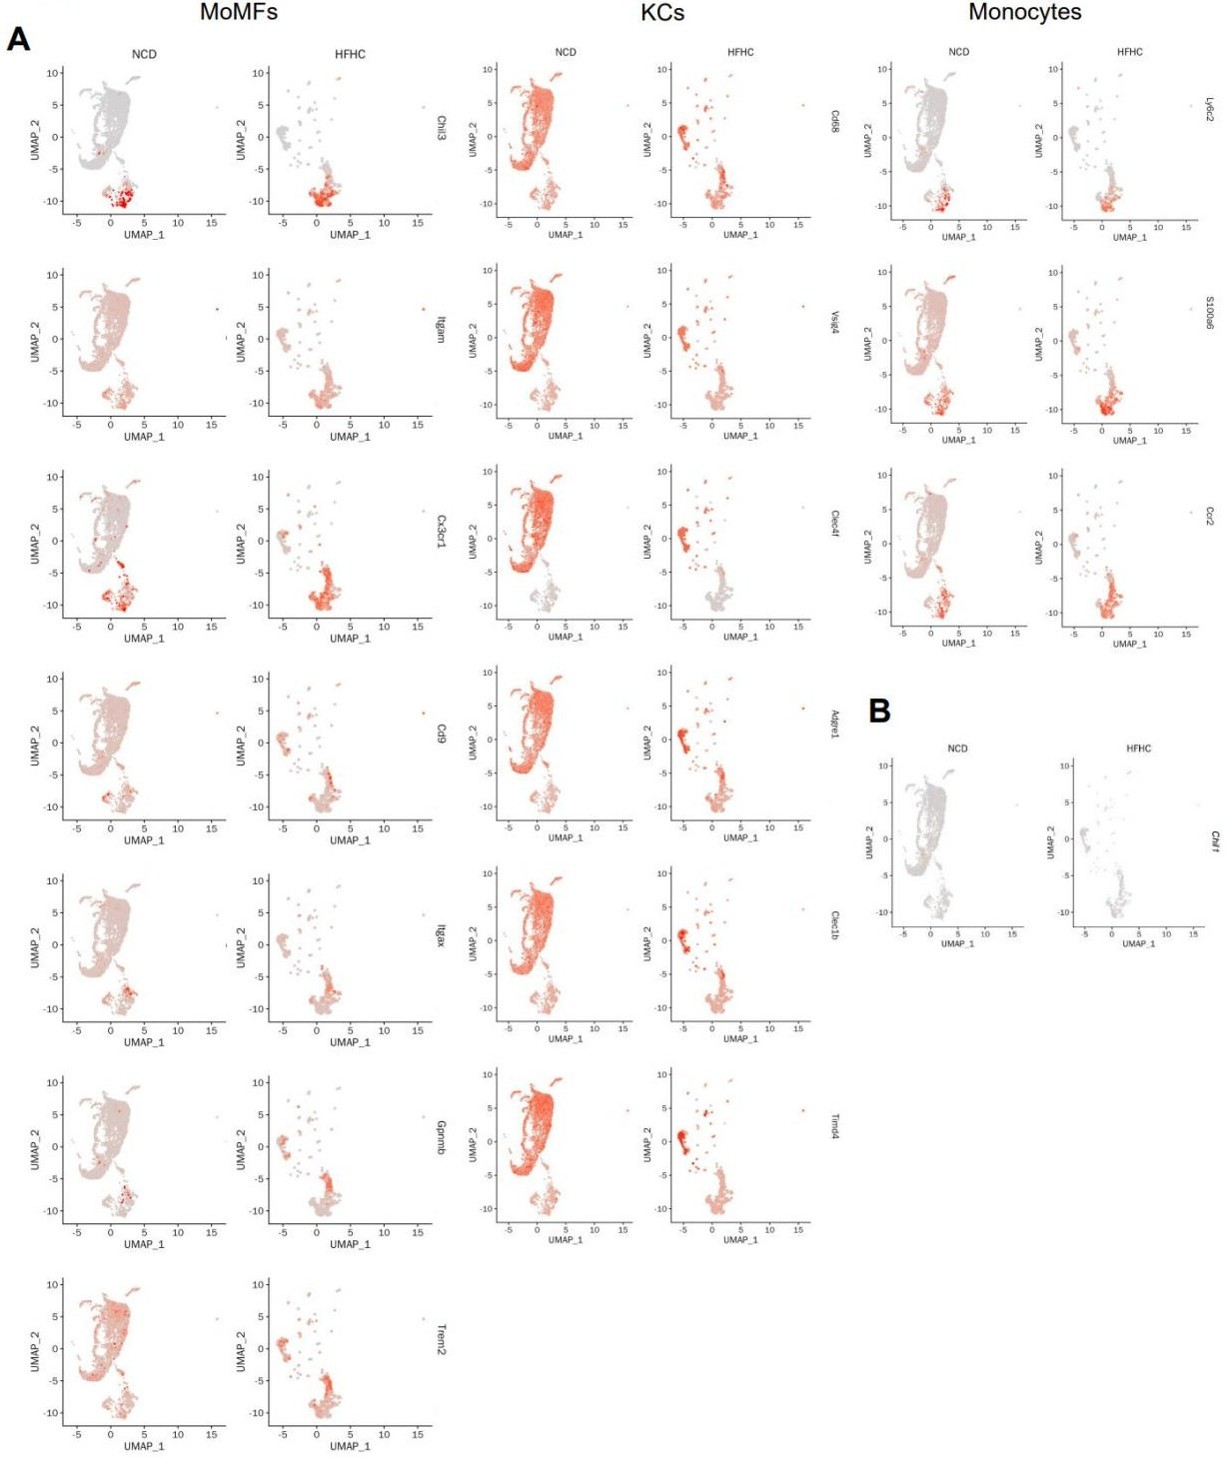
To strengthen this finding, we have replaced the original high-power image of a single Kupffer cell with a representative low-power view showing multiple F4/80+ macrophages (Revised Figure 1A). Furthermore, we performed quantitative colocalization analysis, which revealed that under normal chow diet (NCD), approximately 8% of F4/80+ macrophages are Chi3l1-positive. This proportion significantly increases to 15% upon HFHC feeding (Revised Figure 1A).
Additionally, to validate the specificity of the Chi3l1 immunofluorescence signal, we have included staining of liver sections from Chil1 knockout mice. In contrast to wildtype mice, Chi3l1 signal was completely absent within F4/80+ macrophages in Chil1-/- mice, confirming the specificity of the staining (Revised Figure 1B, Revised manuscript, page 4, line 152-157).
Minor:
(1) The authors have answered my question about liver fibrosis. In line with their macrophage data their diet model does not appear to induce even mild MASH.
We thank the reviewer for this observation. We agree that under our HFHC dietary conditions, the mice do not develop MASH pathology. However, we believe this earlystage model is a strength of our study, as it allows us to dissect the initial role of the Chi3l1-glucose interaction in regulating Kupffer cell fate during early MASLD, prior to the onset of significant fibrosis. This approach enables us to capture early macrophage adaptations (such as Chi3l1 upregulation) that might otherwise be masked or become secondary to the overt inflammation and scarring characteristic of late-stage MASH models.
Reviewer #2 (Public review):
In the revised version of the manuscript, the authors have attempted to address my questions, however, a number of my original concerns still remain.
Firstly, I had asked for a validation of the different CRE lines used - Lysm and Clec4f. The authors have now looked at BMDMs and KCs (steady state) from these animals. They conclude LysM only targets BMDMs not KCs, while CLEC4F targets both KCs and BMDMs. This I do not understand, BMDMs do not express CLEC4F so why are they targeted with this CRE? Additionally, BMDMs are not the correct control here, rather the authors should look at the incoming moMFs in the livers of these mice in the MASLD setting. Similarly, the KO in the MASLD KCs should be verified.
We thank the reviewer for these constructive comments. We have performed FACSsorting of KCs (CD45+ F4/80hi CD11blow TIM4hi) or MoMFs (CD45+ F4/80low CD11bhi Ly6G- TIM4-) from Chil1fl/fl and Lyz2∆Chil1 or Clec4f∆Chil1mice fed NCD or HFHC for 4 weeks, respectively. Compared with Chil1fl/fl mice, mRNA levels of Chil1 was reduced more than 90% in KCs from Clec4f∆Chil1 mice while not different in MoMFs at both 0 and 4 weeks (Revised Figure S3B). Besides, compared with Chil1fl/fI</sup mice, mRNA levels of Chil1fl/fI</sup was reduced more than 90% in MoMFs from Lyz2∆Chil1 mice while roughly 40% in KCs at both 0 and 4 weeks (Revised Figure S5B). This revised data support the phenotypic difference between Lyz2-CKO and Clec4f-CKO mice.
Then I had asked for validation of macrophage expression of Chil1 in other MASLD human and mouse datasets. The authors have looked into this, but the data provided do not suggest it is highly expressed by these cells either in the other mouse models or in the human. Nevertheless, they include a statement suggesting a similar expression pattern (although also being expressed by other cells). This is not an accurate discussion of the data and hence must be revised. This also prompted me to take another look at their data and this has left me querying the data in Figure 1D. Is the percent expressed 1%? In Figure 1C the scale goes from 0-100 but here 0-1. If we are talking about expression in 1% of cells which would fit with the additional public mouse data now analysed then how relevant are any of these claims? How sure are the authors that the effects seen are through KCs/moMFs? In figure 1D all cells profiled by scRNA-seq should be shown not just MFs to get a better sense of this data. What is macrophage expression of Chil1 compared with all other liver cells?
We thank the reviewer for the thoughtful feedback. We agree that the expression pattern of Chil1 should be described more accurately. To address this point, we examined four additional publicly available scRNA-seq datasets, including two mouse MASLD models and two human MASLD datasets (Author response image 2). Across these studies, the cell type with the highest Chil1 expression varied, whereas Chil1 transcripts were detected at relatively low frequency in macrophages (~1% of cells; Author response image 2C, E, K). To better present these data, we regenerated the UMAP plots to include all captured liver non-parenchymal cells, defined using the top two lineage specific markers (Author response image 3A–B). Consistent with Figure 2A–C, violin plots show that Chil1 is highly expressed in neutrophils, with only modest expression detected in macrophages (Author response image 3C). Further analysis of monocyte/macrophage subsets indicates that approximately ~1% of MoMFs or KCs express Chil1 (Author response image 3D–F). As the reviewer noted, the y-axis in Author response image 3F ranges from 0–1%, reflecting the low transcriptional detection frequency of Chil1 in macrophages, which is consistent with the additional public datasets analyzed.
We also recognize that mRNA detection by scRNA-seq does not necessarily reflect protein abundance. Therefore, we assessed Chi3l1 protein expression in hepatic macrophages using immunofluorescence staining for F4/80, TIM4, and Chi3l1 in liver sections from mice fed either normal chow diet (NCD) or HFHC diet. These analyses show that Chi3l1 protein is detectable in both KCs (TIM4+F4/80+) and MoMFs (TIM4-F4/80+) (Revised Figure 1A). Quantitative colocalization analysis revealed that under NCD conditions, approximately 8% of F4/80+ macrophages are Chi3l1-positive, which increases to ~15% following HFHC feeding (Revised Figure 1A). To confirm antibody specificity, we additionally performed staining in Chil1 knockout mice. In contrast to wild-type mice, Chi3l1 signal was completely absent in F4/80+ macrophages from Chil1-/- mice, validating the specificity of the staining (Revised Figure 1B). Together, these results suggest that low-abundance Chil1 transcripts may be under-detected by scRNA-seq, whereas immunofluorescence captures accumulated protein. Importantly, our functional experiments using Clec4f-Cre– mediated deletion directly support that the observed phenotypes are mediated through Kupffer cells, regardless of expression levels in other liver cell types.
In response to the reviewer’s comments, we have made the following revisions:
(1) Softened our conclusion to: “Hepatic macrophages express CHI3L1 and upregulate its expression following HFHC feeding” (Revised manuscript, page 4, lines 136–137).
(2) Included representative low-magnification images showing multiple F4/80+ macrophages along with quantitative analysis (Revised Figure 1A).
(3) Added immunofluorescence staining of Chil1-/- liver sections demonstrating complete absence of Chi3l1 signal in F4/80+ macrophages, validating antibody specificity (Revised Figure 1B).
(4) Regenerated UMAP plots to display all liver non-parenchymal cells and clearly indicate the low detection frequency of Chil1 transcripts in macrophages (Author response image 3).
(5) Revised the relevant text to more accurately describe Chil1 expression patterns in hepatic macrophages (Revised manuscript, page 4, lines 136–157).
Author response image 2.
Analysis of Chil1 expression in additional single-cell RNA sequencing datasets. (A-C) Chil1 expression in a mouse model of NASH. (A) t-SNE projection of cell clusters from scRNA-seq data (GSE1283338) of livers from C57BL/6J mice fed a control or NASH diet for 30 weeks. (B) Dot plot showing scaled Chil1 expression across all identified cell clusters. (C) Dot plot of scaled Chil1 expression after excluding the neutrophil cluster, highlighting expression in macrophage populations. Analyzed cell clusters and cell numbers: KC_H (healthy, 1178); KC3_Control (1142); KC_N (NASH, 1045); KN_RM (recruited macrophage in KC niche, 950); Proliferating_KC (364); PDC_Control (356); Ly6CHi_RM (320); LSEC (299); NK_NKT (393); B_cell (244); DC_1 (107); DC_2 (118); Ly6CLo_RM (127); Hepatocyte (57); PDC_NASH (46); Neutrophil (21). (D-E) Chil1 expression during NAFLD progression in a mouse Western diet model. (D) t-SNE projection of cell clusters from scRNA-seq data (GSE156059) of livers from C57BL/6J mice fed a Western diet with fructose/sucrose for 12, 24, and 36 weeks. (E) Dot plot showing scaled Chil1 expression across all identified cell clusters. Analyzed cell clusters and cell numbers: capsule macs (250), LAMs (1419), Ly6chi monocytes (6912), mac1 (638), moKCs (767), Patrolling monocytes (690), Prolif.macs (521), Resident KCs (3629), Transitioning monocytes (3615). (F-H) Chil1 expression in human cirrhotic liver biopsies. (F) t-SNE projection of cell clusters from scRNA-seq data (GSE136103) of healthy and cirrhotic human liver samples. (G) Dot plot showing scaled Chil1 expression across major cell lineages. (H) Dot plot of scaled Chil1 expression specifically within the mononuclear phagocyte (MP) population. Analyzed cell clusters and cell numbers: B cell (1951); cycling (967); Epithelia (3751); ILC (10091); mast cell (2511); Mesenchyme (2382); MP (10874); pDC (317); Plasma cell (877); T cell (19076). (I-K) Chil1 expression in a human NAFLD explant. (I) t-SNE projection of cell clusters from scRNA-seq data (GSE190487) of a human NAFLD liver explant. (J) Dot plot showing scaled Chil1 expression across all identified cell clusters. (K) Dot plot of scaled Chil1 expression within the MP subpopulations. Analyzed cell clusters and cell numbers: B cell (1278); Cycling (152); MP (2897); pDC (391); Plasma cell (85); T cell (1551); KC (403); SAMac (scar-associated macrophages, 723); TM (tissue monocytes, 1265).
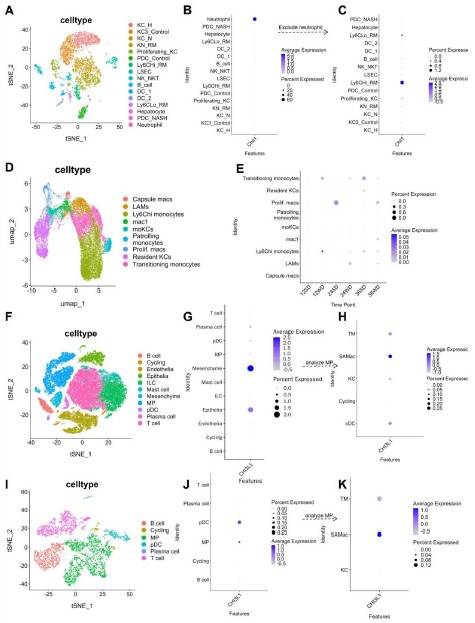
Author response image 3.
Hepatic macrophages express Chi3l1. (A-D) Wildtype C57BL/6J mice were fed either a normal chow diet (NCD) or HFHC for 16 weeks. NPCs were isolated and subjected to BD Rhapsody scRNA sequencing. (A) Uniform manifold approximation and projection (UMAP) plots illustrate the clustering of NPCs from the livers of mice fed NCD and HFHC. Major cell types are colored. (B) Heatmap showing the mean expression of top2 markers of each cell type. (C) Violin plots show the RNA expression of Chil1 between NCD and HFHC livers in each cell cluster. (D) UMAP plots depict the clustering of Monocytes/Macrophages in the livers of mice fed NCD and HFHC. Cell clusters are color-coded. (E) Dot plot displays the scaled gene expression levels of lineage-specific marker genes in different cell clusters. (F) Dot plot shows the scaled gene expression levels of Chil1 in the indicated cell clusters.
The cell death had also previously concerned me that 40-60% of KCs were tunel +ve. I do not understand how 60% are +ve at 8 weeks but then they have more or less same number of TIM4+ cells at 16 weeks? How can this be? why do the tunel +ve cells not die? This concern remains as I don't understand how they reached these numbers given the images. Additional, larger images were also not provided to be sure that they are representative images in the figure. Now in the images provided, there are clearly cells which are TIM4+ where the tunel does not overlap, likely it is in a LSEC or other neighbouring cell. Indeed also taking Fig S11b as an example there are ˜7KCs and at best 1 expresses tunel so how do they get to 60%?
We thank the reviewer for these constructive feedback. We agree that the sustained TUNEL positivity without corresponding KC depletion presents an apparent paradox. Based on our data, we propose that TUNEL-positive KCs represent cells in a prolonged stressed or pre-apoptotic state rather than undergoing immediate clearance. This interpretation is supported by the relatively stable TIM4+ cell numbers between 8 and 16 weeks, which would be inconsistent with rapid cell death and removal. Previous studies (PMID: 33440159; PMID: 32888418) have similarly documented gradual KC loss during MASLD progression, supporting our view that KC death occurs over an extended timeframe rather than acutely.
Regarding quantification concerns, we acknowledge that the representative images in the original figure may have been misleading. To address this, we have now quantified KC apoptosis using low-magnification fields across multiple liver sections to ensure statistical rigor. Figure S11B (now Revised Figure S9B) presents these data, showing that under NCD conditions, KC apoptosis rates are minimal in both genotypes. Following HFHC feeding, apoptosis rates are comparable between Chil1fl/fl and Lyz2Δ Chil1 mice. Importantly, we have replaced all TIM4/TUNEL co-staining images with lowmagnification representative images in the revised figures (Revised Figure 1A, 1B, 5E, S9A, S9B). These images better reflect the quantitative data and confirm that the originally highlighted high-magnification fields were not representative of global apoptosis rates.
Reviewer #3 (Public review):
This paper investigates the role of Chi3l1 in regulating the fate of liver macrophages in the context of metabolic dysfunction leading to the development of MASLD. I do see value in this work, but some issues exist that should be addressed as well as possible.
Here are my comments:
(1) Chi3l1 has been linked to macrophage functions in MASLD/MASH, acute liver injury, and fibrosis models before (e.g., PMID: 37166517), which limits the novelty of the current work. It has even been linked to macrophage cell death/survival (PMID:31250532) in the context of fibrosis, which is a main observation from the current study.
We thank the reviewer for raising this important point and acknowledge previous studies linking Chi3l1 to macrophage function in liver disease. However, several aspects of our work extend beyond these prior reports. First, although global Chi3l1 deficiency has been shown to promote macrophage apoptosis in toxin-induced fibrosis models (PMID: 31250532), our study demonstrates that Chi3l1 differentially regulates the fate of distinct hepatic macrophage subsets embryo-derived Kupffer cells (KCs) and monocyte-derived macrophages (MoMFs)—in MASLD. To our knowledge, this subset-specific regulation of hepatic macrophages has not been previously described. Second, we identify a previously unrecognized metabolic mechanism by which Chi3l1 regulates macrophage survival. Specifically, we find that Chi3l1 binds glucose and promotes glucose uptake, thereby protecting the highly glucose-dependent KCs from metabolic stress–induced death, while exerting minimal effects on MoMFs. This mechanism is distinct from the previously reported Fas/Akt-mediated pathway (PMID: 31250532) and highlights a metabolic checkpoint controlling macrophage subset– specific vulnerability. Third, our findings reveal context- and cell type-dependent roles of Chi3l1. While myeloid-specific deletion of Chi3l1 has been reported to ameliorate steatohepatitis and fibrosis (PMID: 37166517), our KC-specific deletion model shows that loss of Chi3l1 in KCs exacerbates disease, indicating a previously unrecognized protective role of Chi3l1 in KCs during early MASLD. Together, these findings provide new insights into macrophage subset-specific regulation, identify a novel glucose related metabolic mechanism, and reveal context-dependent functions of Chi3l1 in MASLD pathogenesis.
(2) The LysCre-experiments differ from experiments conducted by Ariel Feldstein's team (PMID: 37166517). What is the explanation for this difference? - The LysCre system is neither specific to macrophages (it also depletes in neutrophils, etc), nor is this system necessarily efficient in all myeloid cells (e.g., Kupffer cells vs other macrophages). The authors need to show the efficacy and specificity of the conditional KO regarding Chi3l1 in the different myeloid populations in the liver and the circulation.
We thank the reviewer for raising this important point regarding the specificity of the genetic models and the apparent discrepancy with the study by Feldstein and colleagues (PMID: 37166517). To address these concerns, we performed additional experiments to directly assess the efficiency and cell-type specificity of Chi3l1 deletion in our models.
(1) Efficiency and specificity of LysM-Cre and Clec4f-Cre models
We isolated KCs (CD45+ F4/80hi CD11blow TIM4hi) or MoMFs (CD45+ F4/80low CD11bhi Ly6G- TIM4-) by FACS from Chil1fl/fl, Lyz2∆Chil1 and Clec4f∆Chil1mice fed either NCD or HFHC diet. Consistent with the known specificity of these Cre lines, Clec4f-Cre resulted in >90% reduction of Chil1 mRNA in KCs with no significant change in MoMFs (Revised Figure S3B), confirming efficient KC-specific deletion. In contrast, LysM-Cre reduced Chil1 expression by >90% in MoMFs but only ~40% in KCs (Revised Figure S5B). These data support the reviewer’s concern that LysM-Cre mediates incomplete recombination in KCs, whereas the Clec4f-Cre model provides KC-specific deletion, explaining why the phenotype observed in Lyz2∆Chil1 mice is relatively modest.
(2) Relationship to the study by Feldstein et al.
We agree that our LysM-Cre results appear different from those reported by Feldstein and colleagues. However, considering the new recombination data and differences in disease models, we believe the findings are complementary rather than contradictory. First, the disease models differ substantially. Feldstein et al. used a CDAA-HFAT diet for 10 weeks, which rapidly induces severe inflammation and fibrosis, whereas our study employed a long-term HFHC diet, modeling the more gradual metabolic progression of MASLD. These distinct disease contexts may engage different CHI3L1dependent pathways. Second, the mechanistic focus differs. Feldstein et al. reported that myeloid Chi3l1 promotes steatohepatitis and fibrosis through inflammatory macrophage recruitment and IL13Rα2-mediated stellate cell activation. In contrast, our study identifies a metabolic mechanism in which CHI3L1 binds glucose and promotes glucose uptake, protecting metabolically vulnerable KCs from stress-induced death. Finally, and importantly, KC-specific deletion using Clec4f-Cre recapitulates the key phenotypes observed in our study, including effects on KC survival and metabolic regulation. This confirms that the observed effects are KC-autonomous and not due to broader Cre activity in other myeloid populations.
Together, these additional experiments clarify the recombination efficiency of our models and demonstrate that our conclusions are supported by KC-specific genetic evidence.
(3) The conclusions are exclusively based on one MASLD model. I recommend confirming the key findings in a second, ideally a more fibrotic, MASH model.
We thank the reviewer for this valuable suggestion. To address this point, we tested our key findings in an additional MASH model using a methionine–choline-deficient (MCD) diet. First, we examined Chi3l1 expression in this model. Wild-type mice fed an MCD diet for 6 weeks showed significantly increased Chi3l1 mRNA and protein levels in liver tissues compared with NCD controls, confirming diet-induced upregulation (Revised Figure 3A–B). To determine the functional contribution of Kupffer cell–derived Chi3l1, we subjected Clec4fΔChil1 mice and Chil1fl/fl controls to MCD feeding for 6 weeks. Body weight was comparable between genotypes throughout the feeding period (Revised Figure 3C). However, KC-specific deletion of Chi3l1 significantly exacerbated MCD diet–induced liver pathology, including increased steatosis, inflammation, and fibrosis, as indicated by higher MASLD activity scores, enhanced Oil Red O staining, increased Sirius Red deposition, and elevated α-SMA expression (Revised Figure 3D). Consistent with these histological findings, Clec4fΔChil1 mice exhibited an increased liver index, whereas serum ALT levels remained comparable between groups, suggesting increased hepatic lipid accumulation rather than aggravated hepatocellular injury (Revised Figure 3E). In addition, serum and hepatic triglyceride levels and serum cholesterol were significantly elevated, while hepatic cholesterol levels were not significantly different from controls (Revised Figure 3E). Together, these results validate our findings in an independent MASH model and further support a protective role for Kupffer cell–derived Chi3l1 in limiting steatosis and disease progression (Revised manuscript, page 5, line 188-205).
(4) Very few human data are being provided (e.g., no work with own human liver samples, work with primary human cells). Thus, the translational relevance of the observations remains unclear.
We thank the reviewer for raising this important point. We agree that additional human validation would further strengthen the translational relevance of our findings. We initially attempted to examine macrophage cell death in human liver samples by performing TUNEL and F4/80 co-staining on human liver cancer tissues. However, we did not detect clear colocalization in these samples. We speculate that this may reflect differences in disease context and stage, as the available samples represent endstage liver disease, whereas our study focuses on early MASLD progression. Despite this limitation, we provide several lines of evidence supporting the human relevance of our findings. First, analysis of multiple public human MASLD scRNA-seq datasets demonstrates Chi3l1 expression in hepatic macrophages (Figure 2F–K). Second, analysis of public bulk RNA-seq datasets shows that Chi3l1 expression positively correlates with MASLD disease activity and progression (Revised Figure 1EF). Third, our observations are consistent with previous clinical studies reporting elevated CHI3L1 levels in patients with MASLD/MASH and advanced liver disease. We acknowledge that functional validation in primary human macrophages or human liver tissues would further strengthen the translational significance of this work. This limitation and future direction have now been added to the Discussion (Revised manuscript, page 10, lines 409–411).
Comments on revisions:
The authors have done a thorough job addressing my comments. However, I am not convinced about the MCD diet model, which is somewhat hidden in the Supplementary Files. Neither seems MASH different nor are any fibrosis data shown to support the conclusions. I am not satisfied with this part of the revised manuscript, and I do not agree that the second MASH model would support the conclusions.
We thank the reviewer for their continued careful evaluation and for highlighting the need for clearer presentation of the MCD model data. To address this concern, we have substantially revised this section of the manuscript. First, the MCD model results have now been moved from the Supplementary Figure to a new main figure (Revised Figure 3) to improve visibility and clarity. Second, we have added additional fibrosis analyses, including Sirius Red staining and α-SMA immunostaining, to directly assess fibrotic changes. These analyses show that MCD feeding induces significant collagen deposition in control mice and that fibrosis is further increased in Clec4fΔChil1 mice (Revised Figure 3D). Importantly, the MCD model recapitulates the key phenotypes observed in the HFHC model, with KC-specific Chi3l1 deletion leading to increased MASLD progression. These findings support the conclusion that the protective role of Kupffer cell–derived Chi3l1 is not restricted to a single dietary model, but is observed across distinct models of steatohepatitis. We hope that these revisions clarify the results and strengthen the evidence supporting our conclusions.
Recommendations for the authors:
Reviewer #2 (Recommendations for the authors):
Minor:
Line 73 - should be moMfs not moKCs
We thank the reviewer for this helpful comment. The term moKCs was used intentionally in line 73 to refer to monocyte-derived Kupffer cells, rather than MoMFs (monocyte-derived macrophages). To avoid potential confusion, we have clarified the terminology in the revised manuscript.
Methods: diet is mentioned for 6 weeks but for HFHC should be 16.
The correction has been made in the Methods section (page 3,line115).
Liver/body weight ratios are >3 then I think it is body/liver weight ratio?
We thank the reviewer for this query. The reported values represent liver-to-body weight ratios, calculated as (liver weight ÷ body weight) × 100%. A value of ~3% is consistent with the expected range for mice with MASLD-associated hepatomegaly.
This clarification has been added to the revised figure legend.
Figure 5F - what happens in Clec4f-CRE mice fed HFHC?
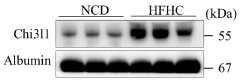
We thank the reviewer for this question. Western blot analysis showed that the HFHC diet upregulated Chi3l1 protein in the livers of Clec4f-Cre mice post HFHC diet (Author response image 4.), similar to the increase observed in wild-type mice.
Author response image 4.
The expression of Chi3l1 in serum of Clec4f cre mice. (A) Western blot to detect Chi3l1 expression in murine serum of Clec4f cre mice before and after HFHC feeding. n=3 mice/group.
-
-
eLife Assessment
This study investigates the function of Chi3l1 in hepatic macrophages in the context of MASLD, providing useful insights at a time when the distinct roles of Kupffer cells or monocyte-derived macrophages in this disease remain incompletely defined. The data suggests that CHI3L1 in Kupffer cells modulates glucose handling in obesity and mitigates systemic metabolic dysfunction and hepatic steatosis during high-fat, high-fructose feeding. However, the loss-of-function studies employing Kupffer cell restricted versus a pan myeloid Cre lines are not sufficient to support the assertion that CHI3L1 activity is confined to resident Kupffer cells. Additionally, the flow-cytometric analyses reveal a modest depletion of Kupffer cells and no recruitment of TIM4low monocyte-derived macrophages, indicating that the system reflects …
eLife Assessment
This study investigates the function of Chi3l1 in hepatic macrophages in the context of MASLD, providing useful insights at a time when the distinct roles of Kupffer cells or monocyte-derived macrophages in this disease remain incompletely defined. The data suggests that CHI3L1 in Kupffer cells modulates glucose handling in obesity and mitigates systemic metabolic dysfunction and hepatic steatosis during high-fat, high-fructose feeding. However, the loss-of-function studies employing Kupffer cell restricted versus a pan myeloid Cre lines are not sufficient to support the assertion that CHI3L1 activity is confined to resident Kupffer cells. Additionally, the flow-cytometric analyses reveal a modest depletion of Kupffer cells and no recruitment of TIM4low monocyte-derived macrophages, indicating that the system reflects simple steatosis rather than substantial macrophage turnover or niche remodelling. While the findings are intriguing, further experimentation is required to clarify the cellular specificity and mechanistic basis of the phenotypes observed.
-
Reviewer #1 (Public review):
The manuscript by Shan et al seeks to define the role of the CHI3L1 protein in macrophages during the progression of MASH. The authors argue that the Chil1 gene is expressed highly in hepatic macrophages. Subsequently, they use Chil1 flx mice crossed to Clec4F-Cre or LysM-Cre to assess the role of this factor in the progression of MASH using a high fat high, fructose diet (HFFC). They found that loss of Chil1 in KCs (Clec4F Cre) leads to enhanced KC death and worsened hepatic steatosis. Using scRNA seq they also provide evidence that loss of this factor promotes gene programs related to cell death. From a mechanistic perspective they provide evidence that CHI3L serves as a glucose sink and thus loss of this molecule enhances macrophage glucose uptake and susceptibility to cell death. Using a bone marrow …
Reviewer #1 (Public review):
The manuscript by Shan et al seeks to define the role of the CHI3L1 protein in macrophages during the progression of MASH. The authors argue that the Chil1 gene is expressed highly in hepatic macrophages. Subsequently, they use Chil1 flx mice crossed to Clec4F-Cre or LysM-Cre to assess the role of this factor in the progression of MASH using a high fat high, fructose diet (HFFC). They found that loss of Chil1 in KCs (Clec4F Cre) leads to enhanced KC death and worsened hepatic steatosis. Using scRNA seq they also provide evidence that loss of this factor promotes gene programs related to cell death. From a mechanistic perspective they provide evidence that CHI3L serves as a glucose sink and thus loss of this molecule enhances macrophage glucose uptake and susceptibility to cell death. Using a bone marrow macrophage system and KCs they demonstrate that cell death induced by palmitic acid is attenuated by the addition of rCHI3L1. While the article is well written and potentially highlights a new mechanism of macrophage dysfunction in MASH and the authors have addressed some of my concerns there are some concerns about the current data that continue to limit my enthusiasm for the study. Please see my specific comments below.
Major:
(1) The authors' interpretation of the results from the KC ( Clec4F) and MdM KO (LysM-Cre) experiments is flawed. The authors have added new data that suggests LyM-Cre only leads to a 40% reduction of Chil1 in KCs and that this explains the difference in the phenotype compared to the Clec4F-Cre. However, this claim would be made stronger using flow sorted TIM4hi KCs as the plating method can lead to heterogenous populations and thus an underestimation of knockdown by qPCR. Moreover, in the supplemental data the authors show that Clec4f-Cre x Chil1flx leads to a significant knockdown of this gene in BMDMs. As BMDMs do not express Clec4f this data calls into question the rigor of the data. I am still concerned that the phenotype differences between Clec4f-cre and LyxM-cre is not related to the degree of knockdown in KCs but rather some other aspect of the model (microbiota etc). It woudl be more convincing if the authors could show the CHI3L reduction via IF in the tissue of these mice.
(2) Figure 4 suggests that KC death is increased with KO of Chil1. The authors have added new data with TIM4 that better characterizes this phenotype. The lack of TIM4 low, F4/80 hi cells further supports that their diet model is not producing any signs of the inflammatory changes that occur with MASLD and MASH. This is also supported by no meaningful changes in the CD11b hi, F4/80 int cells that are predominantly monocytes and early Mdms). It is also concerning that loss of KCs does not lead to an increase in Mo-KCs as has been demonstrated in several studies (PMID37639126, PMID:33997821). This would suggest that the degree of resident KC loss is trivial.
(3) The authors demonstrated that Clec4f-Cre itself was not responsible for the observed phenotype, which mitigates my concerns about this influencing their model.
(4) I remain somewhat concerned about the conclusion that Chil1 is highly expressed in liver macrophages. The author agrees that mRNA levels of this gene are hard to see in the datasets; however, they argue that IF demonstrates clear evidence of the protein, CHI3L. The IF in the paper only shows a high power view of one KC. I would like to see what percentage of KCs express CHI3L and how this changes with HFHC diet. In addition, showing the knockout IF would further validate the IF staining patterns.
Minor:
(1) The authors have answered my question about liver fibrosis. In line with their macrophage data their diet model does not appear to induce even mild MASH.
-
Reviewer #2 (Public review):
In the revised version of the manuscript, the authors have attempted to address my questions, however, a number of my original concerns still remain.
Firstly, I had asked for a validation of the different CRE lines used - Lysm and Clec4f. The authors have now looked at BMDMs and KCs (steady state) from these animals. They conclude LysM only targets BMDMs not KCs, while CLEC4F targets both KCs and BMDMs. This I do not understand, BMDMs do not express CLEC4F so why are they targeted with this CRE? Additionally, BMDMs are not the correct control here, rather the authors should look at the incoming moMFs in the livers of these mice in the MASLD setting. Similarly, the KO in the MASLD KCs should be verified.
Then I had asked for validation of macrophage expression of Chil1 in other MASLD human and mouse datasets. …
Reviewer #2 (Public review):
In the revised version of the manuscript, the authors have attempted to address my questions, however, a number of my original concerns still remain.
Firstly, I had asked for a validation of the different CRE lines used - Lysm and Clec4f. The authors have now looked at BMDMs and KCs (steady state) from these animals. They conclude LysM only targets BMDMs not KCs, while CLEC4F targets both KCs and BMDMs. This I do not understand, BMDMs do not express CLEC4F so why are they targeted with this CRE? Additionally, BMDMs are not the correct control here, rather the authors should look at the incoming moMFs in the livers of these mice in the MASLD setting. Similarly, the KO in the MASLD KCs should be verified.
Then I had asked for validation of macrophage expression of Chil1 in other MASLD human and mouse datasets. The authors have looked into this, but the data provided do not suggest it is highly expressed by these cells either in the other mouse models or in the human. Nevertheless, they include a statement suggesting a similar expression pattern (although also being expressed by other cells). This is not an accurate discussion of the data and hence must be revised. This also prompted me to take another look at their data and this has left me querying the data in Figure 1D. Is the percent expressed 1%? In Figure 1C the scale goes from 0-100 but here 0-1. If we are talking about expression in 1% of cells which would fit with the additional public mouse data now analysed then how relevant are any of these claims? How sure are the authors that the effects seen are through KCs/moMFs? In figure 1D all cells profiled by scRNA-seq should be shown not just MFs to get a better sense of this data. What is macrophage expression of Chil1 compared with all other liver cells?
The cell death had also previously concerned me that 40-60% of KCs were tunel +ve. I do not understand how 60% are +ve at 8 weeks but then they have more or less same number of TIM4+ cells at 16 weeks? How can this be? why do the tunel +ve cells not die? This concern remains as I don't understand how they reached these numbers given the images. Additional, larger images were also not provided to be sure that they are representative images in the figure. Now in the images provided, there are clearly cells which are TIM4+ where the tunel does not overlap, likely it is in a LSEC or other neighbouring cell. Indeed also taking Fig S11b as an example there are ˜7KCs and at best 1 expresses tunel so how do they get to 60%?
-
Reviewer #3 (Public review):
This paper investigates the role of Chi3l1 in regulating the fate of liver macrophages in the context of metabolic dysfunction leading to the development of MASLD. I do see value in this work, but some issues exist that should be addressed as well as possible.
Here are my comments:
(1) Chi3l1 has been linked to macrophage functions in MASLD/MASH, acute liver injury, and fibrosis models before (e.g., PMID: 37166517), which limits the novelty of the current work. It has even been linked to macrophage cell death/survival (PMID: 31250532) in the context of fibrosis, which is a main observation from the current study.
(2) The LysCre-experiments differ from experiments conducted by Ariel Feldstein's team (PMID: 37166517). What is the explanation for this difference? - The LysCre system is neither specific to …
Reviewer #3 (Public review):
This paper investigates the role of Chi3l1 in regulating the fate of liver macrophages in the context of metabolic dysfunction leading to the development of MASLD. I do see value in this work, but some issues exist that should be addressed as well as possible.
Here are my comments:
(1) Chi3l1 has been linked to macrophage functions in MASLD/MASH, acute liver injury, and fibrosis models before (e.g., PMID: 37166517), which limits the novelty of the current work. It has even been linked to macrophage cell death/survival (PMID: 31250532) in the context of fibrosis, which is a main observation from the current study.
(2) The LysCre-experiments differ from experiments conducted by Ariel Feldstein's team (PMID: 37166517). What is the explanation for this difference? - The LysCre system is neither specific to macrophages (it also depletes in neutrophils, etc), nor is this system necessarily efficient in all myeloid cells (e.g., Kupffer cells vs other macrophages). The authors need to show the efficacy and specificity of the conditional KO regarding Chi3l1 in the different myeloid populations in the liver and the circulation.
(3) The conclusions are exclusively based on one MASLD model. I recommend confirming the key findings in a second, ideally a more fibrotic, MASH model.
(4) Very few human data are being provided (e.g., no work with own human liver samples, work with primary human cells). Thus, the translational relevance of the observations remains unclear.
Comments on revisions:
The authors have done a thorough job addressing my comments. However, I am not convinced about the MCD diet model, which is somewhat hidden in the Supplementary Files. Neither seems MASH different nor are any fibrosis data shown to support the conclusions. I am not satisfied with this part of the revised manuscript, and I do not agree that the second MASH model would support the conclusions.
-
Author response:
The following is the authors’ response to the original reviews
Reviewer #1 (Public review):
The manuscript by Shan et al seeks to define the role of the CHI3L1 protein in macrophages during the progression of MASH. The authors argue that the Chil1 gene is expressed highly in hepatic macrophages. Subsequently, they use Chil1 flx mice crossed to Clec4F-Cre or LysM-Cre to assess the role of this factor in the progression of MASH using a high-fat, high-cholesterol diet (HFHC). They found that loss of Chil1 in KCs (Clec4F Cre) leads to enhanced KC death and worsened hepatic steatosis. Using scRNA seq, they also provide evidence that loss of this factor promotes gene programs related to cell death. From a mechanistic perspective, they provide evidence that CHI3L serves as a glucose sink and thus loss of this molecule …
Author response:
The following is the authors’ response to the original reviews
Reviewer #1 (Public review):
The manuscript by Shan et al seeks to define the role of the CHI3L1 protein in macrophages during the progression of MASH. The authors argue that the Chil1 gene is expressed highly in hepatic macrophages. Subsequently, they use Chil1 flx mice crossed to Clec4F-Cre or LysM-Cre to assess the role of this factor in the progression of MASH using a high-fat, high-cholesterol diet (HFHC). They found that loss of Chil1 in KCs (Clec4F Cre) leads to enhanced KC death and worsened hepatic steatosis. Using scRNA seq, they also provide evidence that loss of this factor promotes gene programs related to cell death. From a mechanistic perspective, they provide evidence that CHI3L serves as a glucose sink and thus loss of this molecule enhances macrophage glucose uptake and susceptibility to cell death. Using a bone marrow macrophage system and KCs they demonstrate that cell death induced by palmitic acid is attenuated by the addition of rCHI3L1. While the article is well written and potentially highlights a new mechanism of macrophage dysfunction in MASH, there are some concerns about the current data that limit my enthusiasm for the study in its current form. Please see my specific comments below.
(1) The authors' interpretation of the results from the KC (Clec4F) and MdM KO (LysM-Cre) experiments is flawed. For example, in Figure 2 the authors present data that knockout of Chil1 in KCs using Clec4f Cre produces worse liver steatosis and insulin resistance. However, in supplemental Figure 4, they perform the same experiment in LysM-Cre mice and find a somewhat different phenotype. The authors appear to be under the impression that LysM-Cre does not cause recombination in KCs and therefore interpret this data to mean that Chil1 is relevant in KCs and not MdMs. However, LysM-Cre DOES lead to efficient recombination in KCs and therefore Chil1 expression will be decreased in both KCs and MdM (along with PMNs) in this line.
Therefore, a phenotype observed with KC-KO should also be present in this model unless the authors argue that loss of Chil1 from the MdMs has the opposite phenotype of KCs and therefore attenuates the phenotype. The Cx3Cr1 CreER tamoxifen inducible system is currently the only macrophage Cre strategy that will avoid KC recombination. The authors need to rethink their results with the understanding that Chil1 is deleted from KCs in the LysM-Cre experiment. In addition, it appears that only one experiment was performed, with only 5 mice in each group for both the Clec4f and LysM-Cre data. This is generally not enough to make a firm conclusion for MASH diet experiments.
We thank the reviewer for raising this important point regarding our data interpretation. We have carefully examined the deletion efficiency of Chi3l1 in primary Kupffer cells (KCs) from Lyz2∆Chil1 (LysM-Cre) mice. Our results show roughly a 40% reduction in Chi3l1 expression at both the mRNA and protein levels (Revised Manuscript, Figure S7B and C). Given this modest decrease, Chi3l1 deletion in KCs of Lyz2∆Chil1 mice was incomplete, which likely accounts for the phenotypic differences observed between Clec4f∆Chil1 and Lyz2∆Chil1 mice in the MASLD model.
Furthermore, we have increased the sample size in both the Clec4f- and LysM-Cre experiments to 9–12 mice per group following the HFHC diet, thereby strengthening the statistical power and reliability of our findings (Revised Figures 2 and S8).
(2) The mouse weight gain is missing from Figure 2 and Supplementary Figure 4. This data is critical to interpret the changes in liver pathology, especially since they have worse insulin resistance.
We thank the reviewer for this valuable comment. We have now included the mouse body weight data in the revised manuscript (Figure 2A, B and Figures S8A, B). Compared with mice on a normal chow diet (NCD), all groups exhibited progressive weight gain during HFHC diet feeding. Notably, Clec4f∆Chil1 mice gained significantly more body weight than Chil1fl/fl controls, whereas Lyz2∆Chil1 mice showed a similar weight gain trajectory to Chil1fl/fl mice under the same conditions.
(3) Figure 4 suggests that KC death is increased with KO of Chil1. However, this data cannot be concluded from the plots shown. In Supplementary Figure 6 the authors provide a more appropriate gating scheme to quantify resident KCs that includes TIM4. The TIM4 data needs to be shown and quantified in Figure 4. As shown in Supplementary Figure 6, the F4/80 hi population is predominantly KCs at baseline; however, this is not true with MASH diets. Most of the recruited MoMFs also reside in the F4/80 hi gate where they can be identified by their lower expression of TIM4. The MoMF gate shown in this figure is incorrect. The CD11b hi population is predominantly PMNs, monocytes, and cDC,2 not MoMFs (PMID:33997821). In addition, the authors should stain the tissue for TIM4, which would also be expected to reveal a decrease in the number of resident KCs.
We thank the reviewer for raising this critical point regarding the gating strategy and interpretation of KC death. We have now refined our flow cytometry gating based on the reviewer’s suggestion. Specifically, we analyzed TIM4 expression and attempted to identify TIM4low MoMFs populations in our model. However, we did not detect a distinct TIM4low population, likely because our mice were fed the HFHC diet for only 16 weeks and had not yet developed liver fibrosis. We therefore reason that MoMFs have not fully acquired TIM4 expression at this stage.
To improve our analysis, we referred to published strategies (PMID: 41131393; PMID: 32562600) and gated KCs as CD45+CD11b+F4/80hi TIM4hi and MoMFs as CD45+Ly6G-CD11b+F4/80low TIM4low/-. Using this approach, we observed a gradual reduction of KCs and a corresponding increase in MoMFs in WT mice, with a significantly faster loss of KCs in Chil1-/- mice (Revised Figure 4C, D; Figure S10A).
Furthermore, immunofluorescence staining for TIM4 combined with TUNEL or cleaved caspase-3 confirmed an increased number of dying KCs in Chil1-/- mice compared to WT following HFHC diet feeding (Revised Figure 4E; Figure S10B).
(4) While the Clec4F Cre is specific to KCs, there is also less data about the impact of the Cre system on KC biology. Therefore, when looking at cell death, the authors need to include some mice that express Clec4F cre without the floxed allele to rule out any effects of the Cre itself. In addition, if the cell death phenotype is real, it should also be present in LysM Cre system for the reasons described above. Therefore, the authors should quantify the KC number and dying KCs in this mouse line as well.
We thank the reviewer for raising this important point. During our study, we indeed observed an increased number of KCs in Clec4f-Cre mice compared to WT controls, suggesting that the Clec4f-Cre system itself may modestly affect KC homeostasis. To address this, we compared KCs numbers between Clec4f∆Chil1 and Clec4f-Cre mice and found that Clec4f∆Chil1 mice displayed a significant reduction in KCs numbers following HFHC diet feeding. Moreover, co-staining for TIM4 and TUNEL revealed a marked increase in KCs death in Clec4f∆Chil1 mice relative to Clec4f-Cre mice, indicating that the observed phenotype is attributable to Chil1 deletion rather than Cre expression alone. These data have been reported in our related manuscript (He et al., bioRxiv, 2025.09.26.678483; doi: 10.1101/2025.09.26.678483).
In addition, we quantified KCs numbers and KCs death in the Lyz2-Cre line. TIM4/TUNEL co-staining showed comparable levels of KCs death between Chil1fl/fl and Lyz2∆Chil1 mice (Revised Figure S11B). Consistently, flow cytometry analyses revealed no significant differences in KCs numbers between these two groups before (0 weeks) or after (20 weeks) HFHC diet feeding (Revised Figures S11C, D). As discussed in our response to Comment 1, this may be due to the incomplete deletion of Chi3l1 in KCs (<50%) in the Lyz2-Cre line, which likely attenuates the phenotype.
(5) I am somewhat concerned about the conclusion that Chil1 is highly expressed in liver macrophages. Looking at our own data and those from the Liver Atlas it appears that this gene is primarily expressed in neutrophils. At a minimum, the authors should address the expression of Chil1 in macrophage populations from other publicly available datasets in mouse MASH to validate their findings (several options include - PMID: 33440159, 32888418, 32362324). If expression of Chil1 is not present in these other data sets, perhaps an environmental/microbiome difference may account for the distinct expression pattern observed. Either way, it is important to address this issue.
We thank the reviewer for this insightful comment and agree that analysis of scRNA-seq data, including our own and those reported in the Liver Atlas as well as in the referenced studies (PMID: 33440159, 32888418, 32362324), indicates that Chil1 is predominantly expressed in neutrophils.
However, our immunofluorescence staining under normal physiological conditions revealed that Chi3l1 protein is primarily localized in Kupffer cells (KCs), as demonstrated by strong co-staining with TIM4 (Revised Figure 1E). In MASLD mouse models induced by HFHC or MCD diets, we observed that both KCs and monocyte-derived macrophages (MoMFs) express Chi3l1, with particularly high levels in MoMFs.
We speculate that the apparent discrepancy between scRNA-seq datasets and our in situ findings may reflect differences in cellular proportions and detection sensitivity. Since hepatic macrophages (particularly KCs and MoMFs) constitute a larger proportion of total liver immune cells compared with neutrophils, their contribution to total Chi3l1 protein levels in tissue staining may appear dominant, despite lower transcript abundance per cell in sequencing datasets. We have included a discussion of this point in the revised manuscript to clarify this distinction (Revised manuscript, page 8,line 341-350 ).
Minor points:
(1) Were there any changes in liver fibrosis or liver fibrosis markers present in these experiments?
We assessed liver fibrosis using Sirius Red staining and α-SMA Western blot analysis.
We found no induction of liver fibrosis in our HFHC-induced MASLD model (Revised Figure S1A, B), but a clear elevation of fibrosis markers in the MCD-induced MASH model (Revised Figure S6A, B).
(2) In Supplementary Figure 3, the authors do a western blot for CHI3L1 in BMDMs. This should also be done for KCs isolated from these mice. Does this antibody work for immunofluorescence? Staining liver tissue would provide valuable information on the expression patterns.
We have included qPCR and western blot for Chi3l1 in isolated primary KCs from Lyz2∆Chil1 mice. The data show a slight, non-significant reduction in both mRNA and protein levels in KCs (Revised Figure S7B, C). The immunofluorescence staining on liver tissue showed that Chi3l1 is more likely expressed in the plasma membranes of TIM4+ F4/80+ KCs both under NCD and HFHC diet (Revised Figure 1E).
(3) What is the impact of MASH diet feeding on Chil1 expression in KCs or in the liver in general?
In both our MASLD and MASH models, diet feeding consistently upregulates Chi3l1 in KCs or in the liver in general (Revised Figure 1F, G, S6C,D).
(4) In Figure S1 the authors show tSNE plots of various monocyte and macrophage genes in the liver. Are these plots both diets together? How do things look when comparing these markers between the STD and HFHC diet? The population of recruited LAMs seems very small for 16 weeks of diet. Moreover, Chil1 should also be shown on these tSNE plots as well.
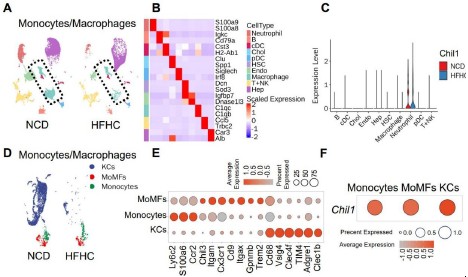
Yes, these plots are both diets together. When compared separately, the core marker expression is consistent between NCD and HFHC diets. However, the HFHC diet induces a relative increase in KC marker expression within the MoMF cluster, suggesting phenotypic adaptation (Author response image 1A, below). Moreover, Chil1 expression on the t-SNE plot was shown (Author response image 1B, below). However, compared to lineage-specific marker genes, Chi3l1 expression is rather low.
Author response image 1.
Gene expression levels of lineage-specific marker genes in monocytes/macrophages clusters between NCD and HFHC diets. (A) UMAP plots show the scaled expression changes of lineage-specific markers in KCs/monocyte/macrophage clusters from mice under NCD and HFHC diets. Color represents the level of gene expression. (B) UMAP plots show the scaled expression changes of Chil1 in KCs/monocyte/macrophage clusters from mice under NCD and HFHC diets. Color represents the level of gene expression.
(5) In Figure 5, the authors demonstrate that CHI3L1 binds to glucose. However, given that all chitin molecules bind to carbohydrates, is this a new finding? The data showing that CHI3L is elevated in the serum after diet is interesting. What happens to serum levels of this molecule in KC KO or total macrophage KO mice? Do the authors think it primarily acts as a secreted molecule or in a cell-intrinsic manner?
We thank the reviewer for these insightful comments, which helped us clarify the novelty of our findings.
(1) Novelty of CHI3L1-Glucose Binding:
While chitin-binding domains are known to interact with carbohydrate polymers, our key discovery is that CHI3L1 (YKL-40)—a mammalian chitinase-like protein lacking enzymatic activity—specifically binds to glucose, a simple monosaccharide. This differs fundamentally from canonical binding to insoluble polysaccharides such as chitin and reveals a potential role for CHI3L1 in monosaccharide recognition, linking it to glucose metabolism and energy sensing. We clarified this point in the revised manuscript (page 9, line374-379).
(2) Serum CHI3L1 in Knockout Models:
Consistent with the reviewer’s suggestion, serum Chi3l1 levels are altered in our knockout models:
KC-specific KO (Clec4fΔChil1): Under normal chow, serum CHI3L1 is markedly reduced compared to controls and remains lower following HFHC feeding (Author response image 2A, below), indicating that Kupffer cells are the main source of circulating CHI3L1 under basal and disease conditions.
Macrophage KO (Lyz2ΔChil1): No significant changes were observed between Chil1fl/fl and Lyz2ΔChil1 mice under either diet (Author response image 2B, below), likely due to minimal monocyte-derived macrophage recruitment in this HFHC model (see Revised Figure 4C,D).
(3) Secreted vs. Cell-Intrinsic Role:
CHI3L1 predominantly localizes to the KC plasma membrane, consistent with a secreted role, and its serum reduction in KC-specific knockouts supports the physiological relevance of its secreted role. While cell-intrinsic effects have been reported elsewhere, our current data do not address this in KCs and warrant future investigation.
Author response image 2.
Chi3l1 expression in serum before and after HFHC in CKO mice. (A) Western blot to detect Chi3l1 expression in serum of Chil1fl/fl and Clec4fΔChil1 mice before and after 16 weeks’ HFHC diet. n=3 mice/group. (B) Western blot to detect Chi3l1 expression in serum of Chil1fl/fl and Lyz2ΔChil1 before and after 16 weeks’ HFHC diet. n=3 mice/group.
Reviewer #2 (Public review):
The manuscript from Shan et al., sets out to investigate the role of Chi3l1 in different hepatic macrophage subsets (KCs and moMFs) in MASLD following their identification that KCs highly express this gene. To this end, they utilise Chi3l1KO, Clec4f-CrexChi3l1fl, and Lyz2-CrexChi3l1fl mice and WT controls fed a HFHC for different periods of time.
Major:
Firstly, the authors perform scRNA-seq, which led to the identification of Chi3l1 (encoded by Chil1) in macrophages. However, this is on a limited number of cells (especially in the HFHC context), and hence it would also be important to validate this finding in other publicly available MASLD/Fibrosis scRNA-seq datasets. Similarly, it would be important to examine if cells other than monocytes/macrophages also express this gene, given the use of the full KO in the manuscript. Along these lines, utilisation of publicly available human MASLD scRNA-seq datasets would also be important to understand where the increased expression observed in patients comes from and the overall relevance of macrophages in this finding.
We thank the reviewer for this valuable suggestion and acknowledge the limited number of cells analyzed under the HFHC condition in our original dataset. To strengthen our findings, we have now examined four additional publicly available scRNA-seq datasets— two from mouse models and two from human MASLD patients (Revised Figure S3, manuscript page 4, line 164-172). Across these datasets, the specific cell type showing the highest Chil1 expression varied somewhat between studies, likely reflecting model differences and disease stages. Nevertheless, Chil1 expression was consistently enriched in hepatic macrophage populations, including both Kupffer cells and infiltrating macrophages, in mouse and human livers. Notably, Chil1 expression was higher in infiltrating macrophages compared to resident Kupffer cells, supporting its upregulation during MASLD progression. These additional analyses confirm the robustness and crossspecies relevance of our finding that macrophages are the primary Chil1-expressing cell type in the liver.
Next, the authors use two different Cre lines (Clec4f-Cre and Lyz2-Cre) to target KCs and moMFs respectively. However, no evidence is provided to demonstrate that Chil1 is only deleted from the respective cells in the two CRE lines. Thus, KCs and moMFs should be sorted from both lines, and a qPCR performed to check the deletion of Chil1. This is especially important for the Lyz2-Cre, which has been routinely used in the literature to target KCs (as well as moMFs) and has (at least partial) penetrance in KCs (depending on the gene to be floxed). Also, while the Clec4f-Cre mice show an exacerbated MASLD phenotype, there is currently no baseline phenotype of these animals (or the Lyz2Cre) in steady state in relation to the same readouts provided in MASLD and the macrophage compartment. This is critical to understand if the phenotype is MASLD-specific or if loss of Chi3l1 already affects the macrophages under homeostatic conditions.
We thank the reviewer for raising this important point.
(1) Chil1 deletion efficiency in Clec4f-Cre and Lyz2-Cre lines:
We have assessed the efficiency of Chil1 deletion in both Lyz2∆Chil1 and Clec4f∆Chil1 mice by evaluating mRNA and protein levels of Chi3l1. For the Lyz2∆Chil1 mice, we measured Chi3l1 expression in bone marrow-derived macrophages (BMDMs) and primary Kupffer cells (KCs). Both qPCR (for mRNA) and Western blotting (for protein) reveal that Chi3l1 is almost undetectable in BMDMs from Lyz2∆Chil1 mice when compared to Chil1fl/fl controls. In contrast, we observe no significant reduction in Chi3l1 expression in KCs from these animals (Revised Figure S7B, C), suggesting Chil1 is deleted in BMDMs but not in KCs in Lyz2-Cre line.
For the Clec4f∆Chil1 mice, both mRNA and protein levels of Chi3l1 are barely detectable in BMDMs and primary KCs when compared to Chil1fl/fl controls (Revised Figure S4B, C). However, we did observe a faint Chi3l1 band in KCs of Clec4f∆Chil1 mice, which we suspect is due to contamination from LSECs during the KC isolation process, given that the TIM4 staining for KCs was approximately 90%. Overall, Chil1 is deleted in both KCs and BMDMs in Clec4f-Cre line.
Notably, since we observed a pronounced MASLD phenotype in Clec4f-Cre mice but not in Lyz2-Cre mice, these findings further underscore the critical role of Kupffer cells in the progression of MASLD.
(2) Whether the phenotype is MASLD-specific or whether loss of Chi3l1 already affects the macrophages under homeostatic conditions: We now included phenotypic data of Clec4fΔChil1 mice (KC-specific KO) and Lyz2∆Chil1 mice (MoMFs-specific KO) fed with NCD 16w (Revised Figure 2A-F, S8A-F). Shortly speaking, there is no baseline difference between Chil1fl/fl and Clec4fΔChil1 or Lyz2∆Chil1 mice in steady state in relation to the same readouts provided in MASLD.
Next, the authors suggest that loss of Chi3l1 promotes KC death. However, to examine this, they use Chi3l1 full KO mice instead of the Clec4f-Cre line. The reason for this is not clear, because in this regard, it is now not clear whether the effects are regulated by loss of Chi3l1 from KCs or from other hepatic cells (see point above). The authors mention that Chi3l1 is a secreted protein, so does this mean other cells are also secreting it, and are these needed for KC death? In that case, this would not explain the phenotype in the CLEC4F-Cre mice. Here, the authors do perform a basic immunophenotyping of the macrophage populations; however, the markers used are outdated, making it difficult to interpret the findings. Instead of F4/80 and CD11b, which do not allow a perfect discrimination of KCs and moMFs, especially in HFHC diet-fed mice, more robust and specific markers of KCs should be used, including CLEC4F, VSIG4, and TIM4.
We thank the reviewer for raising this important point. We performed experiments in Clec4f∆Chil1 (KC-specific KO) model. The phenotype in these mice closely mirrors that of the full KO: we observed a significant reduction in KC numbers and a concurrent increase in KC cell death following an HFHC diet in Clec4f∆Chil1 mice post HFHC diet compared to Clec4f-cre mice. We have reported these data in the following related manuscript (Figure 6 D-G). This confirms that the loss of CHI3L1 specifically from KCs is sufficient to drive this effect.
Hyperactivated Glycolysis Drives Spatially-Patterned Kupffer Cell Depletion in MASLD Jia He, Ran Li, Cheng Xie, Xiane Zhu, Keqin Wang, Zhao Shan bioRxiv 2025.09.26.678483; doi: https://doi.org/10.1101/2025.09.26.678483
While other hepatic cells (e.g., neutrophils and liver sinusoidal endothelial cells) also express Chi3l1, our data indicate that KC-secreted Chi3l1 plays a dominant and cellautonomous role in maintaining KCs viability. The potential contribution of other cellular sources to this phenotype remains an interesting direction for future study.
We apologize for the lack of clarity in our initial immunophenotyping. We have revised the flow cytometry data to clearly show that KCs are rigorously defined as TIM4+ cells (Revised Figure 4C, D).
Additionally, while the authors report a reduction of KCs in terms of absolute numbers, there are no differences in proportions. Thus, coupled with a decrease also in moMF numbers at 16 weeks (when one would expect an increase if KCs are decreased, based on previous literature) suggests that the differences in KC numbers may be due to differences in total cell counts obtained from the obese livers compared with controls. To rule this out, total cell counts and total live CD45+ cell counts should be provided. Here, the authors also provide tunnel staining in situ to demonstrate increased KC death, but as it is typically notoriously difficult to visualise dying KCs in MASLD models, here it would be important to provide more images. Similarly, there appear to be many more Tunel+ cells in the KO that are not KCs; thus, it would be important to examine this in the CLEC4F-Cre line to ascertain direct versus indirect effects on cell survival.
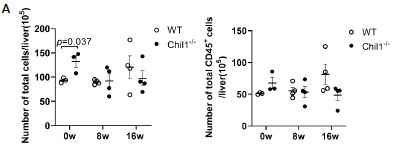
We thank the reviewer for raising this important point. We have now included the total cell counts and total live CD45+ cell counts, which showed similar numbers between WT and Chil1-/- mice post HFHC diet (Figure 3A, below).
Moreover, we included cleavaged caspase 3 and TIM4 co-staining in WT and Chil1-/- mice before and after HFHC diets, which confirmed increased KCs death in Chil1-/- mice (Revised Figure S10B). We have compared KCs number and KCs death between Clec4fcre and Clec4f∆Chil1 mice under NCD and HFHC diet in the following manuscript (Figure 6 D-G). The data showed similar KCs number under NCD and reduced KCs number in Clec4f∆Chil1 mice compared to Clec4f-cre mice, which confirms direct effects of Chi3l1 on cell survival but not because of cre insertion.
Hyperactivated Glycolysis Drives Spatially-Patterned Kupffer Cell Depletion in MASLD Jia He, Ran Li, Cheng Xie, Xiane Zhu, Keqin Wang, Zhao Shan bioRxiv 2025.09.26.678483; doi: https://doi.org/10.1101/2025.09.26.678483
Author response image 3.
Number of total cells and total live CD45+ cells in liver of WT and Chil1-/- mice. (A) Number of total cells and total live CD45+ cells/liver were statistically analyzed. n= 3-4 mice per group.
Finally, the authors suggest that Chi3l1 exerts its effects through binding glucose and preventing its uptake. They use ex vivo/in vitro models to assess this with rChi3l1; however, here I miss the key in vivo experiment using the CLEC4F-Cre mice to prove that this in KCs is sufficient for the phenotype. This is critical to confirm the take-home message of the manuscript.
We agree that it is essential to confirm the in vivo relevance of Chi3l1-mediated glucose regulation in Kupffer cells (KCs). Our data suggest that KCs undergo cell death not because they express Chi3l1 per se, but because they exhibit a glucose-hungry metabolic phenotype that makes them uniquely dependent on Chi3l1-mediated regulation of glucose uptake. To directly assess this mechanism in vivo, we injected 2-NBDG, a fluorescent glucose analog, into overnight-fasted and refed mice and quantified its uptake in hepatic KCs. Notably, Chi3l1-deficient KCs exhibited significantly increased 2-NBDG uptake compared with controls, and this effect was markedly suppressed by co-treatment with recombinant Chi3l1 (rChi3l1) (Revised Figure 6G, H). These findings demonstrate that Chi3l1 regulates glucose uptake by KCs in vivo, supporting our proposed mechanism that Chi3l1 controls KC metabolic homeostasis through modulation of glucose availability.
Minor points:
(1) Some key references of macrophage heterogeneity in MASLD are not cited: PMID: 32362324 and PMID: 32888418.
We thank the reviewer for highlighting these critical references and have included them in the introduction (Revised manuscript, page 2, line 64-73).
(2) In the discussion, Figure 3H is referenced (Serum data), but there is no Figure 3H. If the authors have this data (increased Chi3l1 in serum of mice fed HFHC diet), what happens in CLEC4F-Cre mice fed the diet? Is this lost completely? This comes back to the point regarding the specificity of expression.
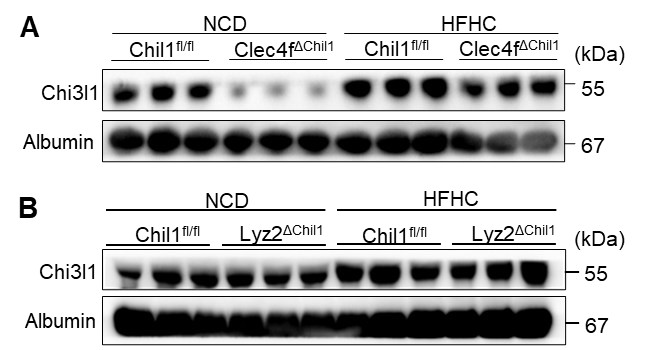
We apologize for the mistake. It should be Figure 5F now in the revised version, in which serum Chi3l1 was significantly upregulated after HFHC diet. Moreover, under a normal chow diet (NCD), serum CHI3L1 is significantly lower in Clec4fΔChil1 mice compared to controls (Chil1fl/fl). Following an HFHC diet, levels increase in both genotypes but remain relatively lower in the KC-KO mice (please see Figure 2A above). This data strongly suggests that Kupffer Cells (KCs) are the primary source of serum CHI3L1 under basal conditions and a major contributor during MASLD progression.
Reviewer #3 (Public review):
This paper investigates the role of Chi3l1 in regulating the fate of liver macrophages in the context of metabolic dysfunction leading to the development of MASLD. I do see value in this work, but some issues exist that should be addressed as well as possible.
(1) Chi3l1 has been linked to macrophage functions in MASLD/MASH, acute liver injury, and fibrosis models before (e.g., PMID: 37166517), which limits the novelty of the current work. It has even been linked to macrophage cell death/survival (PMID: 31250532) in the context of fibrosis, which is a main observation from the current study.
We thank the reviewer for this insightful comment regarding the novelty of our findings. We agree that Chi3l1 has previously been linked to macrophage survival and function in models of liver injury and fibrosis (e.g., PMID: 37166517, 31250532). However, our study focuses specifically on the early stage of MASLD, prior to the onset of fibrosis, revealing a distinct mechanistic role for CHI3L1 in this context.
We demonstrate that CHI3L1 directly interacts with extracellular glucose to regulate its cellular uptake—a previously unrecognized biochemical function. Furthermore, we show that CHI3L1’s protective role is metabolically dependent, safeguarding glucose-dependent Kupffer cells (KCs) but not monocyte-derived macrophages (MoMFs). This metabolic dichotomy and the direct link between CHI3L1 and glucose sensing represent conceptual advances beyond previous studies of CHI3L1 in fibrotic or injury models.
(2) The LysCre-experiments differ from experiments conducted by Ariel Feldstein's team (PMID: 37166517). What is the explanation for this difference? - The LysCre system is neither specific to macrophages (it also depletes in neutrophils, etc), nor is this system necessarily efficient in all myeloid cells (e.g., Kupffer cells vs other macrophages). The authors need to show the efficacy and specificity of the conditional KO regarding Chi3l1 in the different myeloid populations in the liver and the circulation.
We thank the reviewer for this important comment and the opportunity to clarify both the efficiency and specificity of our conditional knockouts, as well as the differences from the study by Feldstein’s group (PMID: 37166517).
(1) Chil1 deletion efficiency in Clec4f-Cre and Lyz2-Cre lines:
We have assessed the efficiency of Chil1 deletion in both Lyz2∆Chil1 and Clec4f∆Chil1 mice by evaluating mRNA and protein levels of Chi3l1. For the Lyz2∆Chil1 mice, we measured Chi3l1 expression in bone marrow-derived macrophages (BMDMs) and primary Kupffer cells (KCs). Both qPCR (for mRNA) and Western blotting (for protein) reveal that Chi3l1 is almost undetectable in BMDMs from Lyz2∆Chil1 mice when compared to Chil1fl/fl controls. In contrast, we observe no significant reduction in Chi3l1 expression in KCs from these animals (Revised Figure S7B, C), suggesting that Chil1 is deleted in BMDMs but not in KCs in Lyz2-Cre line.
For the Clec4f∆Chil1 mice, both mRNA and protein levels of Chi3l1 are barely detectable in BMDMs and primary KCs when compared to Chil1fl/fl controls (Revised Figure S4B, C). However, we did observe a faint Chi3l1 band in KCs of Clec4f∆Chil1 mice, which we suspect is due to contamination from LSECs during the KC isolation process, given that the TIM4 staining for KCs was approximately 90%. Overall, Chil1 is deleted in both KCs and BMDMs in Clec4f-Cre line.
Notably, since we observed a pronounced MASLD phenotype in Clec4f-Cre mice but not in Lyz2-Cre mice, these findings further underscore the critical role of Kupffer cells in the progression of MASLD.
(2) Explanation for Differences from Feldstein et al. (PMID: 37166517):
Our findings differ from those reported by Feldstein’s group primarily due to differences in disease stage and model. We used a high-fat, high-cholesterol (HFHC) diet to model earlystage MASLD characterized by steatosis and inflammation without fibrosis (Revised Figure S1A,B). In this context, we observed KC death but minimal MoMF infiltration (Revised Figure 4D). Accordingly, deletion of Chi3l1 in MoMFs (Lyz2∆Chil1) had no measurable effect on insulin resistance or steatosis, consistent with limited MoMF involvement at this stage. In contrast, the Feldstein study employed a CDAA-HFAT diet that models later-stage MASH with fibrosis. In that setting, Lyz2∆Chil1 mice showed reduced recruitment of neutrophils and MoMFs, which likely underlies the attenuation of fibrosis and disease severity reported. Together, these data support a model in which KCs and MoMFs play temporally distinct roles during MASLD progression: KCs primarily drive early lipid accumulation and metabolic dysfunction, whereas MoMFs contribute more substantially to inflammation and fibrosis at later stages.
(3) The conclusions are exclusively based on one MASLD model. I recommend confirming the key findings in a second, ideally a more fibrotic, MASH model.
We thank the reviewer for this valuable suggestion to validate our findings in an additional MASH model. We have now included data from a methionine- and choline-deficient (MCD) diet–induced MASH model, which exhibits pronounced hepatic lipid accumulation and fibrosis (Revised Figure S6A,B). Consistent with our HFHC results, Clec4f∆Chil1 mice displayed exacerbated MASH progression in this model, including increased lipid deposition, inflammation, and fibrosis (Revised Figure S6E-G).These findings confirm that CHI3L1 deficiency in Kupffer cells promotes hepatic lipid accumulation and disease progression across distinct MASLD/MASH models.
(4) Very few human data are being provided (e.g., no work with own human liver samples, work with primary human cells). Thus, the translational relevance of the observations remains unclear.
We thank the reviewer for this important comment regarding translational relevance. We fully agree that validation in human liver samples would further strengthen our study. However, obtaining tissue from early-stage steatotic livers is challenging due to the asymptomatic nature of this disease stage. Nonetheless, multiple studies have consistently reported Chi3l1 upregulation in human fibrotic and steatotic liver disease (PMID: 31250532, 40352927, 35360517), supporting the clinical significance of our mechanistic findings. We have now expanded the Discussion to highlight these human data and better contextualize our results within the spectrum of human MASLD/MASH progression (Revised manuscript, page 9, line390-394).
Minor points:
The authors need to follow the new nomenclature (e.g., MASLD instead of MAFLD, e.g., in Figure 1).
"MASLD" used throughout.
We thank the reviewers for their rigorous critique again. We thank eLife for fostering an environment of fairness and transparency that enables authors to communicate openly and present their data honestly.
Reference
(1) Tran, S. Baba I, Poupel L, et al(2020) Impaired Kupffer Cell Self-Renewal Alters the Liver Response to Lipid Overload during Non-alcoholic Steatohepatitis. Immunity 53, 627-640.
-
eLife Assessment
This is a useful study in the role of CHI3L1 in Kupffer cells, the macrophages of the liver, showing that CHI3L1 alters glucose regulation in obesity. Specifically, Chi3l1 protects glucose-dependent Kupffer cells during Metabolic dysfunction-associated steatotic liver disease (MASLD) by inhibiting glucose uptake, preventing metabolic stress and death. These data are compelling, yet require further validation.
-
Reviewer #1 (Public review):
The manuscript by Shan et al seeks to define the role of the CHI3L1 protein in macrophages during the progression of MASH. The authors argue that the Chil1 gene is expressed highly in hepatic macrophages. Subsequently, they use Chil1 flx mice crossed to Clec4F-Cre or LysM-Cre to assess the role of this factor in the progression of MASH using a high-fat, high-fructose diet (HFFC). They found that loss of Chil1 in KCs (Clec4F Cre) leads to enhanced KC death and worsened hepatic steatosis. Using scRNA seq, they also provide evidence that loss of this factor promotes gene programs related to cell death. From a mechanistic perspective, they provide evidence that CHI3L serves as a glucose sink and thus loss of this molecule enhances macrophage glucose uptake and susceptibility to cell death. Using a bone marrow …
Reviewer #1 (Public review):
The manuscript by Shan et al seeks to define the role of the CHI3L1 protein in macrophages during the progression of MASH. The authors argue that the Chil1 gene is expressed highly in hepatic macrophages. Subsequently, they use Chil1 flx mice crossed to Clec4F-Cre or LysM-Cre to assess the role of this factor in the progression of MASH using a high-fat, high-fructose diet (HFFC). They found that loss of Chil1 in KCs (Clec4F Cre) leads to enhanced KC death and worsened hepatic steatosis. Using scRNA seq, they also provide evidence that loss of this factor promotes gene programs related to cell death. From a mechanistic perspective, they provide evidence that CHI3L serves as a glucose sink and thus loss of this molecule enhances macrophage glucose uptake and susceptibility to cell death. Using a bone marrow macrophage system and KCs they demonstrate that cell death induced by palmitic acid is attenuated by the addition of rCHI3L1. While the article is well written and potentially highlights a new mechanism of macrophage dysfunction in MASH, there are some concerns about the current data that limit my enthusiasm for the study in its current form. Please see my specific comments below.
Major:
(1) The authors' interpretation of the results from the KC ( Clec4F) and MdM KO (LysM-Cre) experiments is flawed. For example, in Figure 2 the authors present data that knockout of Chil1 in KCs using Clec4f Cre produces worse liver steatosis and insulin resistance. However, in supplemental Figure 4, they perform the same experiment in LysM-Cre mice and find a somewhat different phenotype. The authors appear to be under the impression that LysM-Cre does not cause recombination in KCs and therefore interpret this data to mean that Chil1 is relevant in KCs and not MdMs. However, LysM-Cre DOES lead to efficient recombination in KCs and therefore Chil1 expression will be decreased in both KCs and MdM (along with PMNs) in this line.
Therefore, a phenotype observed with KC-KO should also be present in this model unless the authors argue that loss of Chil1 from the MdMs has the opposite phenotype of KCs and therefore attenuates the phenotype. The Cx3Cr1 CreER tamoxifen inducible system is currently the only macrophage Cre strategy that will avoid KC recombination. The authors need to rethink their results with the understanding that Chil1 is deleted from KCs in the LysM-Cre experiment. In addition, it appears that only one experiment was performed, with only 5 mice in each group for both the Clec4f and LysM-Cre data. This is generally not enough to make a firm conclusion for MASH diet experiments.
(2) The mouse weight gain is missing from Figure 2 and Supplementary Figure 4. This data is critical to interpret the changes in liver pathology, especially since they have worse insulin resistance.
(3) Figure 4 suggests that KC death is increased with KO of Chil1. However, this data cannot be concluded from the plots shown. In Supplementary Figure 6 the authors provide a more appropriate gating scheme to quantify resident KCs that includes TIM4. The TIM4 data needs to be shown and quantified in Figure 4. As shown in Supplementary Figure 6, the F4/80 hi population is predominantly KCs at baseline; however, this is not true with MASH diets. Most of the recruited MoMFs also reside in the F4/80 hi gate where they can be identified by their lower expression of TIM4. The MoMF gate shown in this figure is incorrect. The CD11b hi population is predominantly PMNs, monocytes, and cDC,2 not MoMFs (PMID:33997821). In addition, the authors should stain the tissue for TIM4, which would also be expected to reveal a decrease in the number of resident KCs.
(4) While the Clec4F Cre is specific to KCs, there is also less data about the impact of the Cre system on KC biology. Therefore, when looking at cell death, the authors need to include some mice that express Clec4F cre without the floxed allele to rule out any effects of the Cre itself. In addition, if the cell death phenotype is real, it should also be present in LysM Cre system for the reasons described above. Therefore, the authors should quantify the KC number and dying KCs in this mouse line as well.
(5) I am somewhat concerned about the conclusion that Chil1 is highly expressed in liver macrophages. Looking at our own data and those from the Liver Atlas it appears that this gene is primarily expressed in neutrophils. At a minimum, the authors should address the expression of Chil1 in macrophage populations from other publicly available datasets in mouse MASH to validate their findings (several options include - PMID: 33440159, 32888418, 32362324). If expression of Chil1 is not present in these other data sets, perhaps an environmental/microbiome difference may account for the distinct expression pattern observed. Either way, it is important to address this issue.
-
Reviewer #2 (Public review):
The manuscript from Shan et al., sets out to investigate the role of Chi3l1 in different hepatic macrophage subsets (KCs and moMFs) in MASLD following their identification that KCs highly express this gene. To this end, they utilise Chi3l1KO, Clec4f-CrexChi3l1fl, and Lyz2-CrexChi3l1fl mice and WT controls fed a HFHC for different periods of time.
Firstly, the authors perform scRNA-seq, which led to the identification of Chi3l1 (encoded by Chil1) in macrophages. However, this is on a limited number of cells (especially in the HFHC context), and hence it would also be important to validate this finding in other publicly available MASLD/Fibrosis scRNA-seq datasets. Similarly, it would be important to examine if cells other than monocytes/macrophages also express this gene, given the use of the full KO in the …
Reviewer #2 (Public review):
The manuscript from Shan et al., sets out to investigate the role of Chi3l1 in different hepatic macrophage subsets (KCs and moMFs) in MASLD following their identification that KCs highly express this gene. To this end, they utilise Chi3l1KO, Clec4f-CrexChi3l1fl, and Lyz2-CrexChi3l1fl mice and WT controls fed a HFHC for different periods of time.
Firstly, the authors perform scRNA-seq, which led to the identification of Chi3l1 (encoded by Chil1) in macrophages. However, this is on a limited number of cells (especially in the HFHC context), and hence it would also be important to validate this finding in other publicly available MASLD/Fibrosis scRNA-seq datasets. Similarly, it would be important to examine if cells other than monocytes/macrophages also express this gene, given the use of the full KO in the manuscript. Along these lines, utilisation of publicly available human MASLD scRNA-seq datasets would also be important to understand where the increased expression observed in patients comes from and the overall relevance of macrophages in this finding.
Next, the authors use two different Cre lines (Clec4f-Cre and Lyz2-Cre) to target KCs and moMFs respectively. However, no evidence is provided to demonstrate that Chil1 is only deleted from the respective cells in the two CRE lines. Thus, KCs and moMFs should be sorted from both lines, and a qPCR performed to check the deletion of Chil1. This is especially important for the Lyz2-Cre, which has been routinely used in the literature to target KCs (as well as moMFs) and has (at least partial) penetrance in KCs (depending on the gene to be floxed). Also, while the Clec4f-Cre mice show an exacerbated MASLD phenotype, there is currently no baseline phenotype of these animals (or the Lyz2Cre) in steady state in relation to the same readouts provided in MASLD and the macrophage compartment. This is critical to understand if the phenotype is MASLD-specific or if loss of Chi3l1 already affects the macrophages under homeostatic conditions.
Next, the authors suggest that loss of Chi3l1 promotes KC death. However, to examine this, they use Chi3l1 full KO mice instead of the Clec4f-Cre line. The reason for this is not clear, because in this regard, it is now not clear whether the effects are regulated by loss of Chi3l1 from KCs or from other hepatic cells (see point above). The authors mention that Chi3l1 is a secreted protein, so does this mean other cells are also secreting it, and are these needed for KC death? In that case, this would not explain the phenotype in the CLEC4F-Cre mice. Here, the authors do perform a basic immunophenotyping of the macrophage populations; however, the markers used are outdated, making it difficult to interpret the findings. Instead of F4/80 and CD11b, which do not allow a perfect discrimination of KCs and moMFs, especially in HFHC diet-fed mice, more robust and specific markers of KCs should be used, including CLEC4F, VSIG4, and TIM4.
Additionally, while the authors report a reduction of KCs in terms of absolute numbers, there are no differences in proportions. This, coupled with a decrease also in moMF numbers at 16 weeks (when one would expect an increase if KCs are decreased, based on previous literature) suggests that the differences in KC numbers may be due to differences in total cell counts obtained from the obese livers compared with controls. To rule this out, total cell counts and total live CD45+ cell counts should be provided. Here, the authors also provide tunnel staining in situ to demonstrate increased KC death, but as it is typically notoriously difficult to visualise dying KCs in MASLD models, here it would be important to provide more images. Similarly, there appear to be many more Tunel+ cells in the KO that are not KCs; thus, it would be important to examine this in the CLEC4F-Cre line to ascertain direct versus indirect effects on cell survival.
Finally, the authors suggest that Chi3l1 exerts its effects through binding glucose and preventing its uptake. They use ex vivo/in vitro models to assess this with rChi3l1; however, here I miss the key in vivo experiment using the CLEC4F-Cre mice to prove that this in KCs is sufficient for the phenotype. This is critical to confirm the take-home message of the manuscript.
-
Reviewer #3 (Public review):
This paper investigates the role of Chi3l1 in regulating the fate of liver macrophages in the context of metabolic dysfunction leading to the development of MASLD. I do see value in this work, but some issues exist that should be addressed as well as possible.
Here are my comments:
(1) Chi3l1 has been linked to macrophage functions in MASLD/MASH, acute liver injury, and fibrosis models before (e.g., PMID: 37166517), which limits the novelty of the current work. It has even been linked to macrophage cell death/survival (PMID: 31250532) in the context of fibrosis, which is a main observation from the current study.
(2) The LysCre-experiments differ from experiments conducted by Ariel Feldstein's team (PMID: 37166517). What is the explanation for this difference? - The LysCre system is neither specific to …
Reviewer #3 (Public review):
This paper investigates the role of Chi3l1 in regulating the fate of liver macrophages in the context of metabolic dysfunction leading to the development of MASLD. I do see value in this work, but some issues exist that should be addressed as well as possible.
Here are my comments:
(1) Chi3l1 has been linked to macrophage functions in MASLD/MASH, acute liver injury, and fibrosis models before (e.g., PMID: 37166517), which limits the novelty of the current work. It has even been linked to macrophage cell death/survival (PMID: 31250532) in the context of fibrosis, which is a main observation from the current study.
(2) The LysCre-experiments differ from experiments conducted by Ariel Feldstein's team (PMID: 37166517). What is the explanation for this difference? - The LysCre system is neither specific to macrophages (it also depletes in neutrophils, etc), nor is this system necessarily efficient in all myeloid cells (e.g., Kupffer cells vs other macrophages). The authors need to show the efficacy and specificity of the conditional KO regarding Chi3l1 in the different myeloid populations in the liver and the circulation.
(3) The conclusions are exclusively based on one MASLD model. I recommend confirming the key findings in a second, ideally a more fibrotic, MASH model.
(4) Very few human data are being provided (e.g., no work with own human liver samples, work with primary human cells). Thus, the translational relevance of the observations remains unclear.
-
-
