Heterotypic interfacial tension between oncogenic and wild-type populations forms the mechanical basis of tissue-specific oncogenesis in epithelia
Curation statements for this article:-
Curated by eLife

eLife Assessment
This important study reports that an oncogenic population in an epithelium can either be repressed or spread, depending on the tissues. This work provides convincing evidence, supported by pharmacological perturbations and numerical simulations using the vertex model, that the principle of "high heterotypic interfacial tension" that appears to drive cell sorting and tissue segregation in embryonic models similarly applies to cancer cell behaviour.
This article has been Reviewed by the following groups
Discuss this preprint
Start a discussion What are Sciety discussions?Listed in
- Evaluated articles (eLife)
Abstract
Why does the same oncogenic mutation drive tumor formation in some tissues but not in others? While cancer driver mutations are well-documented, their tissue-specific effects remain largely attributed to genetic factors, leaving the biophysical aspects underexplored. Here, we demonstrate that mechanical interactions, specifically interfacial tension between newly transformed and wildtype epithelial cells are critical in determining survival and growth of HRasV12 oncogenic mutants in human mammary and bronchial epithelia, leading to contrasting outcomes in the two tissues. In mammary epithelium, isolated oncogenic cells are extruded-a typical mechanism of defense against cancer in epithelia-while oncogenic groups become spatially confined in a kinetically arrested, jammed state, marked by an actomyosin belt at the interface. In contrast, bronchial epithelium permits persistent spreading of the same oncogenic cells, which form long protrusions regardless of colony size. Furthermore, oncogenic clusters in these two tissues exhibit distinct biophysical properties, including variations in cell shapes, intracellular pressure, cell-cell tension, and cellular motility. Using a cell shape-tension coupled bi-disperse vertex model, we reveal that differences in interfacial tension at mutant–wild-type boundaries dictate whether oncogenic cells are eliminated, restrained, or expanded and that modulating the heterotypic interfacial tension alters mutant cell fate within the epithelium. Together, our findings uncover a mechanical basis for tissue-specific oncogenesis by highlighting how differential cellular mechanics at the oncogenic–host cell interface regulate tumor initiation and progression.
Article activity feed
-

-
-

eLife Assessment
This important study reports that an oncogenic population in an epithelium can either be repressed or spread, depending on the tissues. This work provides convincing evidence, supported by pharmacological perturbations and numerical simulations using the vertex model, that the principle of "high heterotypic interfacial tension" that appears to drive cell sorting and tissue segregation in embryonic models similarly applies to cancer cell behaviour.
-
Reviewer #1 (Public review):
[Editors' note: this version has been assessed by the Reviewing Editor without further input from the original reviewers. The authors have addressed the comments raised in the previous round of review.]
Summary:
The behaviour of cells expressing constitutively active HRas is examined in mosaic monolayers, both in MCF10a breast epithelial and Beas2b bronchial epithelial cell lines, mimicking the potential initial phase of development of carcinoma. Single HRas-positive cells are excluded from MCF10a but not Beas2b monolayers. Most interestingly, however, when in groups, these cells are not excluded, but rather sharply segregated within a MCF10a monolayer. In contrast, they freely mix with wt Beas2b cells. Biophysical analysis identifies high tension at heterotypic interfaces between HRas and wild-type cells as …
Reviewer #1 (Public review):
[Editors' note: this version has been assessed by the Reviewing Editor without further input from the original reviewers. The authors have addressed the comments raised in the previous round of review.]
Summary:
The behaviour of cells expressing constitutively active HRas is examined in mosaic monolayers, both in MCF10a breast epithelial and Beas2b bronchial epithelial cell lines, mimicking the potential initial phase of development of carcinoma. Single HRas-positive cells are excluded from MCF10a but not Beas2b monolayers. Most interestingly, however, when in groups, these cells are not excluded, but rather sharply segregated within a MCF10a monolayer. In contrast, they freely mix with wt Beas2b cells. Biophysical analysis identifies high tension at heterotypic interfaces between HRas and wild-type cells as the likely reason for segregation of MCF10a cells. The hypothesis is supported experimentally, as myosin inhibition abolishes segregation. The probable reason for lack of segregation in the bronchial epithelium is to be found in the different intrinsic properties of these cells, which form a looser tissue with lower basal actomyosin activity. The behaviour of single cells and groups is recapitulated in a vortex model based on the principle of differential interfacial tension, under the condition of high heterotypic interfacial tension.
Strengths:
Despite being long recognized as a crucial event during cancer development, segregation of oncogenic cells has been a largely understudied question. This nice work addresses the mechanics of this phenomenon through a straightforward experimental design, applying the biophysical analytical approaches established in the field of morphogenesis. Comparison between two cell types provides some preliminary clues on the diversity of effects in various cancers.
-
Reviewer #2 (Public review):
Summary:
The authors investigate the behavior of oncogenic cells in mammary and bronchial epithelia. They observe that individual oncogenic cells are preferentially excluded from the mammary epithelium, but they remain integrated in the bronchial epithelium. They also observe that clusters of oncogenic cells form a compact cluster in mammary epithelium, but they disperse in the bronchial epithelium. The authors demonstrate experimentally and in the vertex model simulations that the difference in observed behavior is due to the differential tension between the mutant and wild-type cells due to a differential expression of actin and myosin.
Strengths:
(1) Very detailed analysis of experiments to systematically characterize and quantify differences between mammary and bronchial epithelia.
(2) Detailed …
Reviewer #2 (Public review):
Summary:
The authors investigate the behavior of oncogenic cells in mammary and bronchial epithelia. They observe that individual oncogenic cells are preferentially excluded from the mammary epithelium, but they remain integrated in the bronchial epithelium. They also observe that clusters of oncogenic cells form a compact cluster in mammary epithelium, but they disperse in the bronchial epithelium. The authors demonstrate experimentally and in the vertex model simulations that the difference in observed behavior is due to the differential tension between the mutant and wild-type cells due to a differential expression of actin and myosin.
Strengths:
(1) Very detailed analysis of experiments to systematically characterize and quantify differences between mammary and bronchial epithelia.
(2) Detailed comparison between the experiments and vertex model simulations to identify the differential cell line tension between the oncogenic and wild-type cells as one of the key parameters that are responsible for the different behavior of oncogenic cells in mammary and bronchial epithelia.
-
Author response:
The following is the authors’ response to the previous reviews
Public Reviews:
Reviewer #1 (Public review):
Summary:
The behaviour of cells expressing constitutively active HRas is examined in mosaic monolayers, both in MCF10a breast epithelial and Beas2b bronchial epithelial cell lines, mimicking the potential initial phase of development of carcinoma. Single HRas-positive cells are excluded from MCF10a but not Beas2b monolayers. Most interestingly, however, when in groups, these cells are not excluded, but rather sharply segregated within a MCF10a monolayer. In contrast, they freely mix with wt Beas2b cells. Biophysical analysis identifies high tension at heterotypic interfaces between HRas and wild-type cells as the likely reason for segregation of MCF10a cells. The hypothesis is supported experimentally, as myosin …
Author response:
The following is the authors’ response to the previous reviews
Public Reviews:
Reviewer #1 (Public review):
Summary:
The behaviour of cells expressing constitutively active HRas is examined in mosaic monolayers, both in MCF10a breast epithelial and Beas2b bronchial epithelial cell lines, mimicking the potential initial phase of development of carcinoma. Single HRas-positive cells are excluded from MCF10a but not Beas2b monolayers. Most interestingly, however, when in groups, these cells are not excluded, but rather sharply segregated within a MCF10a monolayer. In contrast, they freely mix with wt Beas2b cells. Biophysical analysis identifies high tension at heterotypic interfaces between HRas and wild-type cells as the likely reason for segregation of MCF10a cells. The hypothesis is supported experimentally, as myosin inhibition abolishes segregation. The probable reason for lack of segregation in the bronchial epithelium is to be found in the different intrinsic properties of these cells, which form a looser tissue with lower basal actomyosin activity. The behaviour of single cells and groups is recapitulated in a vortex model based on the principle of differential interfacial tension, under the condition of high heterotypic interfacial tension.
Strengths:
Despite being long recognized as a crucial event during cancer development, segregation of oncogenic cells has been a largely understudied question. This nice work addresses the mechanics of this phenomenon through a straightforward experimental design, applying the biophysical analytical approaches established in the field of morphogenesis. Comparison between two cell types provides some preliminary clues on the diversity of effects in various cancers.
Weaknesses:
Although not calling into question the main message of this study, there are a few issues that one may want to address:
(1) One may be careful in interpreting the comparison between MCF10a and Beas2b cells as used in this study. The conditions may not necessarily be representative of the actual properties of breast and bronchial epithelia. How much of the epithelial organization is reconstituted under these experimental conditions remains to be established. This is particularly obvious for bronchial cells, which would need quite specific culture conditions to build a proper bronchial layer. In this study, they seemed to be on the verge of a mesenchymal phenotype (large gaps, huge protrusions, cells growing on top of each other, as mentioned in the manuscript).
As an alternative to Beas2b, comparison of MCF10a with another cell line capable of more robust in vitro epithelial organization, but ideally with different adhesive and/or tensile properties, would be highly interesting, as it may narrow down the parameters involved in segregation of oncogenic cells.
(2) While the seminal description of tissue properties based on interfacial tensions (Brodland 2002) is clearly key to interpreting these data, the actual "Differential Interfacial Tension Hypothesis" poses that segregation results from global differences, i.e., juxtaposition of two tissues displaying different intrinsic tensions. On the contrary, the results of the present work support a different scenario, where what counts is the actual difference in tension ALONG the tissue boundary, in other words, that segregation is driven by high HETEROTYPIC interfacial tension. This is an important distinction that should be clarified.
(3) Related: The fact that actomyosin accumulates at the heterotypic interface is key here. It would be quite informative to better document the pattern of this accumulation, which is not clear enough from the images of the current manuscript: Are we talking about the actual interface between mutant and wt cells (membrane/cortex of heterotypic contacts)? Or is it more globally overactivated in the whole cell layer along the border? Some better images and some quantification would help.
(4) In the case of Beas2b cells, mutant cells show higher actin than wt cells, while actin is, on the contrary, lower in mutant MCF10a cells (Figure 2b). Has this been taken into account in the model? It may be in line with the idea that HRas may have a different action on the two cell types, a possibility that would certainly be worth considering and discussing.
Comments on revisions:
There is still one last point that should be made even clearer:
The system is being modelled based on the principle of INTERFACIAL TENSION, a description pioneered by the works of Steinberg and of Harris, and nicely conceptualized by Brodland (2002). Now the observed behaviour is a perfect case of sorting based on higher interfacial tension AT the boundary between cell types (with nice additional documentation of local actin and myosin enrichment in the revised manuscript). What needs to be made crystal clear it that this is NOT equivalent to the model of DITH ("DIFFERENTIAL INTERFACIAL TENSION HYPOTHESIS)" (Brodland 2002, Krieg et al 2008). It is important to stop using DITH in this context, as it leads to confusion and misinterpretations. Indeed, DITH predicts cell/tissue sorting based on differences in interfacial tension WITHIN the two cell types. While DITH accounts for relative POSITIONING (one tissue engulfing the other), it is now established that this is not the motor for cell sorting and tissue segregation, the key parameter is being heterotypic tension at the heterotypic interface. I thus invite the authors to avoid the terms "differential"/DITH, and rather use either "interfacial tension", or specifically to "HIGH HETEROTYPIC INTERFACIAL TENSION".
Related: the authors correctly cite Canty et al NatComm2017 when discussing this phenomenon. I suggest to add an additional key supporting reference "D.M. Sussman, J.M. Schwarz, M.C. Marchetti, M.L. Manning, Soft yet sharp interfaces in a vertex model of confluent tissue, Phys. Rev. Letters 120 (2018) 058001". One may also include another pioneer work in Drosophila is "M. Aliee, J.C. Roper, K.P. Landsberg, C. Pentzold, T.J. Widmann, F. Julicher, C. Dahmann, Physical mechanisms shaping the Drosophila dorsoventral compartment boundary, Curr. Biol. 22 (2012) 967-976."
We thank the reviewer for this important clarification. We fully agree that the mechanism underlying the observed segregation in our system is best described in terms of elevated heterotypic interfacial tension, rather than the classical Differential Interfacial Tension Hypothesis (DITH). As the reviewer correctly points out, DITH in its original formulation refers to differences in intrinsic interfacial tensions within each cell population, which primarily governs relative positioning (e.g., tissue engulfment), rather than the local sorting dynamics we observe here.
In contrast, our experimental and modeling results support a scenario in which segregation is driven by increased tension specifically at heterotypic interfaces between HRasV12 and wild-type cells. We agree that continued use of the term “Differential interfacial tension” in this context may lead to conceptual ambiguity.
Accordingly, we have revised the manuscript throughout to replace references to “differential interfacial tension” with more precise terminology, namely “interfacial tension” or “heterotypic interfacial tension”, wherever appropriate. We have also updated the Discussion to explicitly clarify this distinction and its implications for interpreting our results.
We thank the reviewer for suggesting additional relevant literature which have now included.
Reviewer #2 (Public review):
Summary:
The authors investigate the behavior of oncogenic cells in mammary and bronchial epithelia. They observe that individual oncogenic cells are preferentially excluded from the mammary epithelium, but they remain integrated in the bronchial epithelium. They also observe that clusters of oncogenic cells form a compact cluster in mammary epithelium, but they disperse in the bronchial epithelium. The authors demonstrate experimentally and in the vertex model simulations that the difference in observed behavior is due to the differential tension between the mutant and wild-type cells due to a differential expression of actin and myosin.
Strengths:
Very detailed analysis of experiments to systematically characterize and quantify differences between mammary and bronchial epithelia
Detailed comparison between the experiments and vertex model simulations to identify the differential cell line tension between the oncogenic and wild-type cells as one of the key parameters that are responsible for the different behavior of oncogenic cells in mammary and bronchial epithelia
Weaknesses:
It is unclear what is the mechanistic origin of the shape-tension coupling, which is used in the vertex model, and how important that coupling is for the presented results. Authors claim that the shape-tension coupling is due to the anisotropic distribution of stress fibers when cells are under external stress. It is unclear why the stress fibers should affect an effective line tension on the cell boundaries and why the stress fibers should be sensitive to the magnitude of the internal isotropic cell pressure. In experiments, it makes sense that stress fibers form when cells are stretched. Similar stress fibers form when cytoskeleton or polymer networks are stretched. It is unclear why the stress fibers should be sensitive to the magnitude of internal isotropic cell pressure. If all the surrounding cells have the same internal pressure, then the cell would not be significantly deformed due to that pressure and stress fibers would not form. Authors should better justify the use of the shape-tension coupling in the model, since most of the observed behavior is already captured by the differential tension even if there is no shape-tension coupling.
We thank the reviewer for this comment. We agree that we did not provide a mechanistic origin for the shape-tension coupling. In our model, stress fiber formation, along with actin ring formation, indicated that cells at the interface were elongated. Hence, we hypothesised that an interfacial force could induce nematic alignment at the interface. However, such an activity would only be feasible if the interface interaction were sufficiently high. Thus, the isotropic pressure at the heterotypic interface served as a proxy for cell-cell interactions in our model. However, inspired by recent work [1], we have tested whether activation of cells at the interface by shear stress would produce similar results. Exploring this aspect will require additional simulations.
(1) Pérez-Verdugo, F., Maniou, E., Galea, G. L., & Banerjee, S. (2026). Mechanosensitive feedback organizes cell shape and motion during hindbrain neuropore morphogenesis. Current Biology.
The observed difference of shape indices between the interfacial and bulk cells in simulations in the absence of differential line tension is concerning. This suggests that either there are not enough statistics from the simulations or that something is wrong with the simulations. For all presented simulation results, the authors should repeat multiple simulations and then present both averages and standard deviations. This way it would be easier to determine whether the observed differences in simulations are statistically significant.
The observed differences in shape indices between interfacial and bulk cells in simulations in the zero-line-tension case (Lambda=0) remain non-zero at the zero-stress threshold because the interface cells are still subject to the shape-dependent contribution gamma_ij, since the current model treats gamma_ij as independent of Lambda. We are exploring the possible relationship between Lambda and gamma_ij, and we will update this in the next version of the manuscript.
Recommendations for the authors:
The editor recommends considering the new comment made by reviewer #1 in his/her report:
"There is still one last point that should be made even more clear:
The system is being modelled based on the principle of INTERFACIAL TENSION, a description pioneered by the works of Steinberg and of Harris, and nicely conceptualized by Brodland (2002). Now the observed behaviour is a perfect case of sorting based on higher interfacial tension AT the boundary between cell types (with nice additional documentation of local actin and myosin enrichment in the revised manuscript). What needs to be made crystal clear it that this is NOT equivalent to the model of DITH ("DIFFERENTIAL INTERFACIAL TENSION HYPOTHESIS)" (Brodland 2002, Krieg et al 2008). It is important to stop using DITH in this context, as it leads to confusion and misinterpretations. Indeed, DITH predicts cell/tissue sorting based on differences in interfacial tension WITHIN the two cell types. While DITH accounts for relative POSITIONING (one tissue engulfing the other), it is now established that this is not the motor for cell sorting and tissue segregation, the key parameter is being heterotypic tension at the heterotypic interface. I thus invite the authors to avoid the terms "differential"/DITH, and rather use either "interfacial tension", or specifically to "HIGH HETEROTYPIC INTERFACIAL TENSION".
Related: the authors correctly cite Canty et al NatComm2017 when discussing this phenomenon. I suggest to add an additional key supporting reference "D.M. Sussman, J.M. Schwarz, M.C. Marchetti, M.L. Manning, Soft yet sharp interfaces in a vertex model of confluent tissue, Phys. Rev. Letters 120 (2018) 058001". One may also include another pioneer work in Drosophila is "M. Aliee, J.C. Roper, K.P. Landsberg, C. Pentzold, T.J. Widmann, F. Julicher, C. Dahmann, Physical mechanisms shaping the Drosophila dorsoventral compartment boundary, Curr. Biol. 22 (2012) 967-976."
Please see response to Reviewer 1
Reviewer #2 (Recommendations for the authors):
The authors have improved the manuscript and addressed some of my concerns. However, some of the questions were not adequately addressed.
(1) I appreciate additional justification regarding the need for the shape-tension coupling in the vertex model. However, the authors have not answered my question regarding why the shape-tension coupling model should be sensitive to the magnitude of the internal isotropic cell pressure. In experiments, it makes sense that stress fibers form when cells are stretched, but it is unclear why the stress fibers should be sensitive to the magnitude of internal isotropic cell pressure. If all the surrounding cells have the same internal pressure, then the cell would not be significantly deformed due to that pressure, and stress fibers would not form.
We thank the reviewer for pointing this out. We agree that we did not provide a mechanistic origin for the shape-tension coupling. In our model, stress fiber formation, along with actin ring formation, indicated that cells at the interface were elongated. Hence, we hypothesized that an interfacial force could induce nematic alignment at the interface. However, such an activity would only be feasible if the interface interaction were sufficiently high. Thus, the isotropic pressure at the heterotypic interface served as a proxy for cell-cell interactions in our model.
However, inspired by recent work [1], we have tested whether activation of cells at the interface by shear stress would produce similar results. Exploring this aspect will require additional simulations.
(1) Pérez-Verdugo, F., Maniou, E., Galea, G. L., & Banerjee, S. (2026). Mechanosensitive feedback organizes cell shape and motion during hindbrain neuropore morphogenesis. Current Biology.
(2) I appreciate that the authors provided additional statistics related to simulations. I am still very concerned about the observed difference in the shape indices between the cells at the interface and the bulk, when the interfacial line tension is exactly zero (Lambda=0). In that case, the cells at the interface and at the boundary are identical, and there should be no difference in the shape indices. Are cells at the interface for the zero-line tension case (Lambda=0) still subject to the shape dependent contribution gamma_ij? If that contribution is still included for the cells at the interface, then this could explain why cells at the interface are still different from cells in the bulk even when Lambda=0.
The observed differences in shape indices between interfacial and bulk cells in simulations in the zero-line-tension case (Lambda=0) remain non-zero at the zero-stress threshold because the interface cells are still subject to the shape-dependent contribution gamma_ij, since the current model treats gamma_ij as independent of Lambda. We are exploring the possible relationship between Lambda and gamma_ij, and we will update this in the next version of the manuscript.
(3) Authors included several additional supplemental figures (Figs. S4, S5, S6, S7) , but they are not discussed in the manuscript text. These new supplemental figures were only discussed in the rebuttal letter. These figures should also be discussed in the manuscript text.
We have cited the new supplementary figures in the main text.
(4) Authors have answered in the rebuttal letter what experimental data was used in Fig. 4c. This information also needs to be provided in the manuscript text.
We have added this information in the caption of Figure 4
(5) Supplementary Figure 3 is missing. That figure got moved to the appendix.
This has been rectified in the Supplementary file and the citations have been updated accordingly in the main text.
(6) At the end of section 4 in the main text, the authors introduced a new sentence regarding simulations of the vertex model with interfacial tension and mechanochemical feedback. The details of that model are described in the appendix, but it would be helpful to add a sentence or two already in the main text describing what is the mechanism of the mechanochemcial feedback.
We have added a line describing the mechanism of mechanochemical feedback.
(7) In the definition of the eccentricity, 'a' should be the minor axis and 'b' the major axis, i.e., 'a' and 'b' should be swapped.
We have corrected this.
(8) There is a typo at the end of the vertex model description in the methods section. "The details of the shape-tension coupling is described in the interface." The word interface should be an appendix.
We have fixed the typo.
(9) In the appendix section describing the shape-tension coupling, the authors should explain how the cell's director n is defined.
We have added a line in the appendix section describing shape-tension coupling explaining how the cell’s director n is defined.
(10) In Appendix Fig. 1, the two angles are defined as theta and theta' but the figure caption is defining angles theta_1 and theta_2. These angles need to be consistent.
This has been fixed.
-
-
eLife Assessment
This important study reports that an oncogenic population in an epithelium can either be repressed or spread, depending on the tissues. This is explained by hypothesising the existence of a heterotypic tension at the boundary between different cell types, and supported by pharmacological perturbations and numerical simulations using the vertex model. The solid study conveys a key message, although some uncertainty remains regarding the origin of the heterotypic tension in relation to acto-myosin organisation in the boundary cells.
-
Reviewer #1 (Public review):
Summary:
The behaviour of cells expressing constitutively active HRas is examined in mosaic monolayers, both in MCF10a breast epithelial and Beas2b bronchial epithelial cell lines, mimicking the potential initial phase of development of carcinoma. Single HRas-positive cells are excluded from MCF10a but not Beas2b monolayers. Most interestingly, however, when in groups, these cells are not excluded, but rather sharply segregated within a MCF10a monolayer. In contrast, they freely mix with wt Beas2b cells. Biophysical analysis identifies high tension at heterotypic interfaces between HRas and wild-type cells as the likely reason for segregation of MCF10a cells. The hypothesis is supported experimentally, as myosin inhibition abolishes segregation. The probable reason for lack of segregation in the bronchial …
Reviewer #1 (Public review):
Summary:
The behaviour of cells expressing constitutively active HRas is examined in mosaic monolayers, both in MCF10a breast epithelial and Beas2b bronchial epithelial cell lines, mimicking the potential initial phase of development of carcinoma. Single HRas-positive cells are excluded from MCF10a but not Beas2b monolayers. Most interestingly, however, when in groups, these cells are not excluded, but rather sharply segregated within a MCF10a monolayer. In contrast, they freely mix with wt Beas2b cells. Biophysical analysis identifies high tension at heterotypic interfaces between HRas and wild-type cells as the likely reason for segregation of MCF10a cells. The hypothesis is supported experimentally, as myosin inhibition abolishes segregation. The probable reason for lack of segregation in the bronchial epithelium is to be found in the different intrinsic properties of these cells, which form a looser tissue with lower basal actomyosin activity. The behaviour of single cells and groups is recapitulated in a vortex model based on the principle of differential interfacial tension, under the condition of high heterotypic interfacial tension.
Strengths:
Despite being long recognized as a crucial event during cancer development, segregation of oncogenic cells has been a largely understudied question. This nice work addresses the mechanics of this phenomenon through a straightforward experimental design, applying the biophysical analytical approaches established in the field of morphogenesis. Comparison between two cell types provides some preliminary clues on the diversity of effects in various cancers.
Weaknesses:
Although not calling into question the main message of this study, there are a few issues that one may want to address:
(1) One may be careful in interpreting the comparison between MCF10a and Beas2b cells as used in this study. The conditions may not necessarily be representative of the actual properties of breast and bronchial epithelia. How much of the epithelial organization is reconstituted under these experimental conditions remains to be established. This is particularly obvious for bronchial cells, which would need quite specific culture conditions to build a proper bronchial layer. In this study, they seemed to be on the verge of a mesenchymal phenotype (large gaps, huge protrusions, cells growing on top of each other, as mentioned in the manuscript).
As an alternative to Beas2b, comparison of MCF10a with another cell line capable of more robust in vitro epithelial organization, but ideally with different adhesive and/or tensile properties, would be highly interesting, as it may narrow down the parameters involved in segregation of oncogenic cells.
(2) While the seminal description of tissue properties based on interfacial tensions (Brodland 2002) is clearly key to interpreting these data, the actual "Differential Interfacial Tension Hypothesis" poses that segregation results from global differences, i.e., juxtaposition of two tissues displaying different intrinsic tensions. On the contrary, the results of the present work support a different scenario, where what counts is the actual difference in tension ALONG the tissue boundary, in other words, that segregation is driven by high HETEROTYPIC interfacial tension. This is an important distinction that should be clarified.
(3) Related: The fact that actomyosin accumulates at the heterotypic interface is key here. It would be quite informative to better document the pattern of this accumulation, which is not clear enough from the images of the current manuscript: Are we talking about the actual interface between mutant and wt cells (membrane/cortex of heterotypic contacts)? Or is it more globally overactivated in the whole cell layer along the border? Some better images and some quantification would help.
(4) In the case of Beas2b cells, mutant cells show higher actin than wt cells, while actin is, on the contrary, lower in mutant MCF10a cells (Figure 2b). Has this been taken into account in the model? It may be in line with the idea that HRas may have a different action on the two cell types, a possibility that would certainly be worth considering and discussing.
Comments on revisions:
There is still one last point that should be made even clearer:
The system is being modelled based on the principle of INTERFACIAL TENSION, a description pioneered by the works of Steinberg and of Harris, and nicely conceptualized by Brodland (2002). Now the observed behaviour is a perfect case of sorting based on higher interfacial tension AT the boundary between cell types (with nice additional documentation of local actin and myosin enrichment in the revised manuscript). What needs to be made crystal clear it that this is NOT equivalent to the model of DITH ("DIFFERENTIAL INTERFACIAL TENSION HYPOTHESIS)" (Brodland 2002, Krieg et al 2008). It is important to stop using DITH in this context, as it leads to confusion and misinterpretations. Indeed, DITH predicts cell/tissue sorting based on differences in interfacial tension WITHIN the two cell types. While DITH accounts for relative POSITIONING (one tissue engulfing the other), it is now established that this is not the motor for cell sorting and tissue segregation, the key parameter is being heterotypic tension at the heterotypic interface. I thus invite the authors to avoid the terms "differential"/DITH, and rather use either "interfacial tension", or specifically to "HIGH HETEROTYPIC INTERFACIAL TENSION".
Related: the authors correctly cite Canty et al NatComm2017 when discussing this phenomenon. I suggest to add an additional key supporting reference "D.M. Sussman, J.M. Schwarz, M.C. Marchetti, M.L. Manning, Soft yet sharp interfaces in a vertex model of confluent tissue, Phys. Rev. Letters 120 (2018) 058001". One may also include another pioneer work in Drosophila is "M. Aliee, J.C. Roper, K.P. Landsberg, C. Pentzold, T.J. Widmann, F. Julicher, C. Dahmann, Physical mechanisms shaping the Drosophila dorsoventral compartment boundary, Curr. Biol. 22 (2012) 967-976."
-
Reviewer #2 (Public review):
Summary:
The authors investigate the behavior of oncogenic cells in mammary and bronchial epithelia. They observe that individual oncogenic cells are preferentially excluded from the mammary epithelium, but they remain integrated in the bronchial epithelium. They also observe that clusters of oncogenic cells form a compact cluster in mammary epithelium, but they disperse in the bronchial epithelium. The authors demonstrate experimentally and in the vertex model simulations that the difference in observed behavior is due to the differential tension between the mutant and wild-type cells due to a differential expression of actin and myosin.
Strengths:
* Very detailed analysis of experiments to systematically characterize and quantify differences between mammary and bronchial epithelia
* Detailed comparison …
Reviewer #2 (Public review):
Summary:
The authors investigate the behavior of oncogenic cells in mammary and bronchial epithelia. They observe that individual oncogenic cells are preferentially excluded from the mammary epithelium, but they remain integrated in the bronchial epithelium. They also observe that clusters of oncogenic cells form a compact cluster in mammary epithelium, but they disperse in the bronchial epithelium. The authors demonstrate experimentally and in the vertex model simulations that the difference in observed behavior is due to the differential tension between the mutant and wild-type cells due to a differential expression of actin and myosin.
Strengths:
* Very detailed analysis of experiments to systematically characterize and quantify differences between mammary and bronchial epithelia
* Detailed comparison between the experiments and vertex model simulations to identify the differential cell line tension between the oncogenic and wild-type cells as one of the key parameters that are responsible for the different behavior of oncogenic cells in mammary and bronchial epithelia
Weaknesses:
* It is unclear what is the mechanistic origin of the shape-tension coupling, which is used in the vertex model, and how important that coupling is for the presented results. Authors claim that the shape-tension coupling is due to the anisotropic distribution of stress fibers when cells are under external stress. It is unclear why the stress fibers should affect an effective line tension on the cell boundaries and why the stress fibers should be sensitive to the magnitude of the internal isotropic cell pressure. In experiments, it makes sense that stress fibers form when cells are stretched. Similar stress fibers form when cytoskeleton or polymer networks are stretched. It is unclear why the stress fibers should be sensitive to the magnitude of internal isotropic cell pressure. If all the surrounding cells have the same internal pressure, then the cell would not be significantly deformed due to that pressure and stress fibers would not form. Authors should better justify the use of the shape-tension coupling in the model, since most of the observed behavior is already captured by the differential tension even if there is no shape-tension coupling.
* The observed difference of shape indices between the interfacial and bulk cells in simulations in the absence of differential line tension is concerning. This suggests that either there are not enough statistics from the simulations or that something is wrong with the simulations. For all presented simulation results, the authors should repeat multiple simulations and then present both averages and standard deviations. This way it would be easier to determine whether the observed differences in simulations are statistically significant.
-
Author response:
The following is the authors’ response to the original reviews
Public Reviews:
Reviewer #1 (Public review):
(1) One may be careful in interpreting the comparison between MCF10a and Beas2b cells as used in this study. The conditions may not necessarily be representative of the actual properties of breast and bronchial epithelia. How much of the epithelial organization is reconstituted under these experimental conditions remains to be established. This is particularly obvious for bronchial cells, which would need quite specific culture conditions to build a proper bronchial layer. In this study, they seemed to be on the verge of a mesenchymal phenotype (large gaps, huge protrusions, cells growing on top of each other, as mentioned in the manuscript).
We thank the reviewer for this important point. We agree that our …
Author response:
The following is the authors’ response to the original reviews
Public Reviews:
Reviewer #1 (Public review):
(1) One may be careful in interpreting the comparison between MCF10a and Beas2b cells as used in this study. The conditions may not necessarily be representative of the actual properties of breast and bronchial epithelia. How much of the epithelial organization is reconstituted under these experimental conditions remains to be established. This is particularly obvious for bronchial cells, which would need quite specific culture conditions to build a proper bronchial layer. In this study, they seemed to be on the verge of a mesenchymal phenotype (large gaps, huge protrusions, cells growing on top of each other, as mentioned in the manuscript).
We thank the reviewer for this important point. We agree that our experimental conditions do not fully recapitulate the in vivo architecture of either breast or bronchial epithelia. As the reviewer points out, the two cell lines need typical culture conditions to grow in an in-vivo like architecture, such as acinar structures for mammary tissue, and a pseudostratified architecture for the bronchial tissue, and it certainly would be interesting to subject the cell lines in these organotypic architectures and study the fate of oncogenic mutant cells. However, this would be an independent study on its own and is out of the scope of the current manuscript. Here, we intend to compare these two well-established epithelial lines from mammary and bronchial epithelial tissues, with distinct intrinsic mechanical and organisational properties, in minimal culture conditions, and study how just the context of having two different sources of epithelial cells can change the fate of oncogenic cells present in the wild-type population. We have now also performed experiments with the MDCK cell line, which is not like the BEAS2B line, and has well-defined cell-cell adhesions [Supplementary figure. 4a], and epithelial morphology, and shown that the fate of HRasV12 mutants is different here as well, as compared to the MCF10A cell line.
(2) As an alternative to Beas2b, comparison of MCF10a with another cell line capable of more robust in vitro epithelial organization, but ideally with different adhesive and/or tensile properties, would be highly interesting, as it may narrow down the parameters involved in the segregation of oncogenic cells.
We agree with the reviewer and in line with this suggestion, we have repeated the key experiments using Madin-Darby Canine Kidney (MDCK) cells, a well-established model epithelial cell line. Our results show that even though MDCK cells show significantly distinct properties compared to BEAS2B cells (MDCK being more epithelial like than BEAS2B), the dynamics of the HRasV12 clusters in both these systems are similar [Supplementary figure. 4b], and distinctly different from the mammary epithelial cells (MCF10A). We did not observe the formation of an actin belt around HRasV12 clusters in MDCK monolayers, which indeed forms in MCF10A monolayers. Additionally, in MDCK cells, the HRasV12 mutant clusters are not under compaction or jamming, instead, they form protrusions similar to the ones seen in BEAS2B monolayers. These results solidify our hypothesis of tissue-specific differences in the mechanics of cancer initiation.
(3) While the seminal description of tissue properties based on interfacial tensions (Brodland 2002) is clearly key to interpreting these data, the actual "Differential Interfacial Tension Hypothesis" poses that segregation results from global differences, i.e., juxtaposition of two tissues displaying different intrinsic tensions. On the contrary, the results of the present work support a different scenario, where what counts is the actual difference in tension ALONG the tissue boundary, in other words, that segregation is driven by high HETEROTYPIC interfacial tension. This is an important distinction that should be clarified.
We thank the reviewer for this insightful comment. As correctly noted, Brodland’s 2002 work provided a foundational formulation of the Differential Interfacial Tension Hypothesis (DITH), which frames tissue organization in terms of effective interfacial tensions.
While in its original form, DITH emphasised segregation as a consequence of global differences in the intrinsic (bulk) tensions of juxtaposed tissues, our results specifically show that segregation is determined by local interfacial mechanics between transformed- and host cells. These local interfacial dynamics, however, is related to global contractility of cells- From our experiments with blebbistatin, we have observed a loss in the efficiency of segregation upon reducing global contractility, consequently inhibiting the formation of the interfacial actomyosin belt, which serves as the source of the interfacial tension between healthy and mutant populations. Therefore, the differences in local interfacial mechanics stem from intrinsic global contractility of cells in discussion here.
We have also clarified this distinction more clearly in the discussion and have explicitly stated that while DITH provided the foundation for conceptualizing tissue mechanics, our findings on transformed cell- healthy cell interactions specifically demonstrate that a higher efficiency of segregation is driven by high heterotypic interfacial tension at the tissue boundary.
(4) Related: The fact that actomyosin accumulates at the heterotypic interface is key here. It would be quite informative to better document the pattern of this accumulation, which is not clear enough from the images of the current manuscript: Are we talking about the actual interface between mutant and wt cells (membrane/cortex of heterotypic contacts)? Or is it more globally overactivated in the whole cell layer along the border? Some better images and some quantification would help.
We agree that a detailed visualisation of actomyosin distribution would strengthen our conclusions. We have now added a few more images of the interface to the Supplementary Data [Supplementary figure. 5], which show that cortical actin accumulates in individual cells, at the wild type cell-mutant cell interface, and actin levels go up in both wild type and mutant populations at the interface. This is also clear from the quantifications of different region of interests [Figure 2e], which is done by segmenting individual cells in these regions and quantifying actin intensity in each cell.
(5) In the case of Beas2b cells, mutant cells show higher actin than wt cells, while actin is, on the contrary, lower in mutant MCF10a cells (Author response image 2). Has this been taken into account in the model? It may be in line with the idea that HRas may have a different action on the two cell types, a possibility that would certainly be worth considering and discussing.
We thank the reviewer for raising this important point. While a direct experimental dissection of how HRasV12 mutation affects actin levels in BEAS2B and MCF10A cells individually is beyond the scope of the present study, we do not rule out the possibility that a HRasV12 mutation may exert cell-type-specific biochemical effects on actin regulation in these two epithelial systems.
Although the difference in actin between the mutants and the wild-type cells has not been incorporated into the model presented in the manuscript, we have now shown how actin levels change in response to the interfacial tension formed between the mutant and wildtype cells by adding a mechanochemical feedback to the model. Rather than prescribing intrinsic differences in actin levels between mutant and wild-type cells, we asked whether the feedback between the actin cytoskeleton and mechanical stress alone is sufficient to generate the observed actin reorganization. To address this, we incorporate a mechanochemical feedback loop (MCFL-I), originally developed in our earlier work [35], into the vertex model framework. This feedback captures the experimentally observed coupling between cell shape, actomyosin organization, and mechanical stress (i.e., heterotypic interfacial tension), and has previously been shown to reproduce biologically realistic epithelial behaviours such as dynamic cell shapes and heterogeneous actomyosin distributions [35].
In this framework, actin is not introduced as an explicit or intrinsic variable. Instead, changes in actomyosin organization emerge dynamically in response to mechanical stresses. Specifically, MCFL-I allows the preferred area and preferred perimeter of cells to evolve depending on cell shape and actomyosin binding, rather than remaining fixed. From these evolving parameters, we compute the normalized contractility,
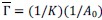 , which we interpret as a proxy for bulk actin, and normalized line tension
  which we interpret as a proxy for junctional actin. These normalized quantities provide size-independent measures of actomyosin organization across the tissue.
The equations for MCFL-I can be written as:
Thus, with MCFLs, the vertex model does not have fixed 𝐴0 and 𝑃0. The cells dynamically change these parameters depending on the vertex model dynamics. The constitutive relations for the
 and
and  are given below [1]:
Here,
 is the fraction of myosin bound to actin as a function of cell area 𝐴. This nonlinear dependence arises from the load or strain-dependent binding of myosin to actin, and
  is a model parameter which is proportional to the binding affinity of myosin to actin in the absence of any strain. We consider to the be the same for both mutant and wild-type
  . Importantly, both mutant and wild-type cells obey identical mechanochemical rules in the model. Differences in actin organization arise solely due to differences in mechanical stress generated by differential interfacial tension. Positive differential interfacial tension compresses mutant cells within clusters. This will lead to different
  and P0>/sub> across the monolayer via MCFL-I, and thus reduced bulk actin and increased junctional actin [Appendix figure. 4], consistent with experimental observations. Conversely, when differential interfacial tension is weak or negative, mutant and wild-type cells experience similar stresses, and the model predicts minimal differences in actin organization [Appendix figure. 5].
Thus, while HRasV12-dependent biochemical effects may indeed differ between BEAS2B and MCF10A cells, our results demonstrate that mechanical interactions at mutant– wild-type interfaces are sufficient to generate distinct actin signatures in the two tissues, without invoking cell-type-specific actin regulation. We have added the details of the mechanochemical feedback loop in the model to the Appendix to emphasize that the model tests the sufficiency of mechanics-driven actin reorganization rather than excluding additional biochemical contributions.
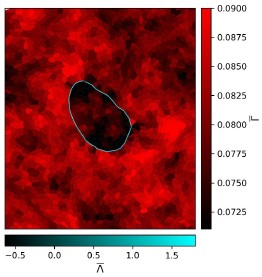
Although it looks that even for Λ > 0 we see that the normalized line tension
 seems to be negative. This is however just an artefact of the colorbar limits we have used to compare with the Λ < 0 case. If we plot with different colorbar limits, we see that the interface has
  as shown in Author response image 1.
Author response image 1.
Reviewer #2 (Public review):
(1) It is unclear what the mechanistic origin of the shape-tension coupling is, which is used in the vertex model, and how important that coupling is for the presented results. The authors claim that the shape-tension coupling is due to the anisotropic distribution of stress fibers when cells are under external stress. It is unclear why the stress fibers should affect an effective line tension on the cell boundaries and why the stress fibers should be sensitive to the magnitude of the internal isotropic cell pressure. In experiments, it makes sense that stress fibers form when cells are stretched. Similar stress fibers form when the cytoskeleton or polymer networks are stretched. It is unclear why the stress fibers should be sensitive to the magnitude of internal isotropic cell pressure. If all the surrounding cells have the same internal pressure, then the cell would not be significantly deformed due to that pressure, and stress fibers would not form. The authors should better justify the use of the shape-tension coupling in the model and also present simulation results without that coupling. I expect that most of the observed behavior is already captured by the differential tension, even if there is no shape-tension coupling.
The reviewer is correct in stating that most of the observed behaviour is already captured by the differential tension, without the shape-tension coupling. However, the shape tension coupling has been used here in accordance with the experimental observation that the cells at the interface are aligned and elongated along the interface [Fig. 2h], which can not be captured without the shape-tension coupling. The difference between shape indices of cells at the interface and away from the boundary is plotted versus the interfacial tension in the case of no shape-tension coupling [Appendix figure 2]. The red dashed line represents the experimental value of the shape index difference. The blue line is the shape index difference between two randomly chosen groups of cells (half of the total number of cells in each group is taken). At zero line-tension, the difference in shape index between interface cells and cells away from the interface is same as that between randomly chosen groups of cells, which is expected since there should be no interface at zero line-tension. The no shape-tension data presented here are averaged over 19 seeds. Although the results without shape-tension coupling reaches experimental values at high enough differential tension [Appendix figure 3], a closer inspection of the simulation results show that the cells are just squeezed and are aligned perpendicular to the interface, which is contrary to what is seen in experiments [Fig. 2h].
Calculating the average of the absolute value of the dot product of the nematic director and the interface edge for simulations with and without shape-tension coupling [Appendix figure 3] clearly shows that with shape-tension coupling, the cells align and elongate along the interface as is seen in experiment, given by an interface dot product value > 0.5 at high enough line-tension values. Further, shape-tension coupling or biased edge tension has been used before to model for cell elongation during embryo elongation [45] and here we use it as an active line-tension force, which elongates cells along the interface, in addition to the differential tension which is passive. This additional quantification of the alignment and elongation of cells along the interface will be added to the Appendix.
(2) The observed difference of shape indices between the interfacial and bulk cells in simulations in the absence of differential line tension is concerning. This suggests that either there are not enough statistics from the simulations or that something is wrong with the simulations. For all presented simulation results, the authors should repeat multiple simulations and then present both averages and standard deviations. This way, it would be easier to determine whether the observed differences in simulations are statistically significant.
The difference in shape indices between the interfacial and bulk cells in simulations has now been calculated over 11 different seed values. The observed differences in simulations, along with the standard deviations have been plotted in Figure 4b. This figure will be updated to include the standard deviations. The nonzero difference in shape index in the absence of differential line tension for low values of stress threshold is due to the shape-tension coupling acting even at low differential tension. Thus, a non-zero, sufficiently high value of the stress threshold is required in our model with shape-tension coupling. This has also been stated in section 4 of the paper. The importance of the shape-tension coupling has been stated in response to the previous point.
(3) The authors should also analyze the cell line tension data in simulations and make a comparison with experiments.
The line tension for each edge can be calculated as
 .
.Although the line tension distributions look similar to the ones obtained from Bayesian Force Inference, a better comparison is between the normalized line tension and actin seen in experiment as we have discussed under point (4) asked by Reviewer 1.
Recommendations for the authors:
Reviewer #2 (Recommendations for the authors):
(1) The authors claim that the negative tension Lambda<0 resembles the Beas2b phenotype. This is not consistent with the expression of actin in Figure 2f, which seems very similar in all four regions of interest (ROIs). Also, the segregation index data for Beas2b in Figure 1h looks very different from the demixing parameter in Figure 4f for the negative value of Lambda.
In the model presented in the previous version of the manuscript, actin differences have not been incorporated. We have only added an interfacial line tension, which might arise only at the interface between cells. In response to comment (4) from Reviewer 1, we have considered a vertex model with mechanochemical feedback and interfacial line tension to understand how actin distribution in the tissue is affected by interfacial tension. The results presented match very well with experimental images.
The reviewer has rightly pointed out that the segregation index (SI) data presented in Fig. 1h have a different trend compared to those in Fig. 4f. However, it is essential to note that in the simulation, the initial condition is one in which the mutant cluster is already fully segregated, and thus, at the initial time point. This is not the case in experiments, and at initial time points. Thus, the two plots are not directly comparable and only show how SI changes in our simulations. It is more effective to compare the final time points in Fig. 2f with those in Fig. 4e, where we observe that Mcf10a has a higher SI compared to Beas2b, and the case with Λ > 0 has a higher SI than the case with Λ < 0. This supports our claim that Λ < 0 resembles the Beas2b phenotype and Λ > 0 resembles the Mcf10a phenotype.
(2) It is unclear how the threshold pressure Pi_0 is implemented for the shape-tension coupling in the vertex model. Is the value of the additional tension gamma_ij equal to 0 if the internal pressure is below that threshold?
The stress threshold is implemented for the shape-tension in the vertex model in the following way. The line tension forces can be written as:
where,
 and
and 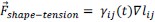 . If the stress on the cell is below the threshold,
  then
then 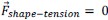 for those cells.
(3) In vertex model simulations, the authors use identical parameters for wild-type and mutant cells. This does not seem to be consistent with experimental observations in Figure 2, where the expression of actin is different, and also, cell shape indices are different for the wild-type and mutant cells. The authors should comment on how that choice affects their simulation results.
We thank the reviewer for this comment. As noted in our response to comment 4 from reviewer 1, we have now attempted our simulations after adding a mechanochemical feedback to the model. Here, both wild-type and mutant cells follow identical mechanochemical rules within the vertex model. This choice does not imply that the cells are mechanically identical in the tissue; rather, it allows us to test whether differences in cell shape and actin organization can emerge purely from mechanical interactions.
By incorporating the mechanochemical feedback loop (MCFL-I), the model captures how heterotypic interfacial tension redistributes mechanical stresses between mutant and wild-type cells. These stresses lead to differences in cell area, perimeter, and shape, which are then translated via MCFL-I into distinct bulk and junctional actin signatures. Consequently, even though the intrinsic parameters are the same, the emergent mechanical environment reproduces the experimentally observed differences in actin intensity and cell shape indices (as shown in Figure 2).
Thus, our approach demonstrates that the experimentally observed heterogeneity between mutant and wild-type cells can arise solely from interface-driven mechanical effects, without prescribing any cell-type-specific parameters in the model.
(4) Also provide data for cell line tensions in the vertex model, which can then be compared with the experimental data in Figure 2. This is especially important because the differential cell line tension at the interface of mutants and wild-type cells seems to be playing a very important role.
The cell tensions from the vertex model have been plotted in the response to main comment (3) from Reviewer 2. Since the interfacial tension has been included as an extra term in the vertex model by hand, it is not trivial to simply compare the line tensions from the vertex model to the experimental data. However, we can understand how the tensions are by looking at the normalised tension and normalised contractility plotted as a response to comment (4) from Reviewer 1. Those plots are from a vertex model with mechanochemical feedback and the plots match well with experimental actin images.
(5) In Figure 2j, the authors should report the relative cell pressure and line tension for all four ROIs. The data is only shown for the wild-type cells and for mutants in clusters, even though the figure caption states that the data is presented for all four ROIs. It would also be useful to report the cell tension at the interface between the mutant cells and wild-type cells since this is the key parameter for the vertex model simulations.
We agree and have updated the graph [Figure 2j].
(6) The tangential motion of cells around oncogenic clusters only shows up towards the end of Supplementary Video 3. It is unclear whether this is a transient effect or whether this tangential motion would persist for a longer time.
We thank the reviewer for raising this point. In our experiments, tangential cell motion in the wild type population along the boundary of oncogenic cluster consistently emerges as the oncogenic cluster becomes compacted. We have plotted tangential velocity in interfacial wild type cells over time (Supplementary Fig. 6b), and show that such a motion persist at the cluster-wild-type interface, until the end of time-lapse recordings in all cases.
(7) It is very awkward that the authors are representing an integral of the tangential velocity over different loops in Figures 3c and 4i. Thus, it is very hard to separate how much of the increase in the integrated velocity is due to larger loops and how much is due to changes in the average tangential velocity. Since different loops have different perimeters, it would have been better to report the average tangential velocity by dividing the integrated tangential velocity by the perimeter length of each loop. In the methods, the authors state that the concentric circles go from the center to a point twice the radius of the mutant cluster, but this is not consistent with the image in Figure 3c, where the concentric circles seem to go only to the boundary of the mutant cluster.
We thank the reviewer for raising the point regarding the dependence of the loop-integrated tangential velocity on the perimeter length. While the circulation (loop-integrated tangential velocity) indeed scales with loop size, it increases with radius only if tangential velocity components are directionally coherent along the loop.
In our data, concentric-loop analysis centered on mutant clusters reveals a systematic increase in tangential motion with radius, with the largest values occurring at the outermost loops corresponding to the cluster–tissue interface. In contrast, applying the identical analysis to randomly selected wild-type regions does not yield any monotonic increase with radius, despite the increasing perimeter of the loops, and instead shows fluctuations around zero. This control demonstrates that the observed increase around mutant clusters is not a trivial geometric consequence of larger loop size but reflects the emergence of coherent tangential motion specifically at the mutant cluster boundary.
To further address the reviewer’s concern, we additionally computed the mean tangential velocity by normalizing the loop-integrated tangential velocity by the loop perimeter. As shown in Supplementary figure. 6a, this normalization preserves the same qualitative trend: tangential motion peaks near the periphery of mutant clusters, whereas no such trend is observed in wild-type regions. We therefore conclude that both metrics capture the same physical phenomenon: enhanced tangential cell motion localized to the mutant cluster boundary, consistent with the behavior observed in the time-lapse videos.
Author response image 2.
From simulation data
(8) The authors should comment on how jamming and unjamming are related to shape indices because some readers may not be familiar with them.
We have updated the same in the text of Results 2.
(9) In the captions of Figure 3, the authors state that the bronchial epithelium gets kinetically arrested. This is not evident from the data in Figure 3d, where the velocity magnitude drops just a little bit for the bronchial epithelium, and it remains much higher compared to the mammary epithelium at long times.
We agree with this comment, and that using the word, kinetically arrested, for Beas2b cells is misleading, since their motion is much higher, even after the initial drop. We have updated the text in the caption accordingly.
(10) It is unclear why the authors have used the segregation index for analyzing experiments and the demixing parameter for analyzing simulations. Both parameters are trying to quantify the same thing, so it would have been better to use the same quantity for both experiments and simulations to enable easier comparison.
We agree that using the same quantity for both experiments and simulation would enable easier comparison. Thus, we have replaced the demixing parameter with segregation index in Figure 4.
(11) It is unclear what experimental data were used for shape indices in Figure 4c. Was it the data from Mcf10a or Beas2b? It is also unclear which ROIs were used because different ROIs have very different shape indices in experiments, according to Figure 2e,f.
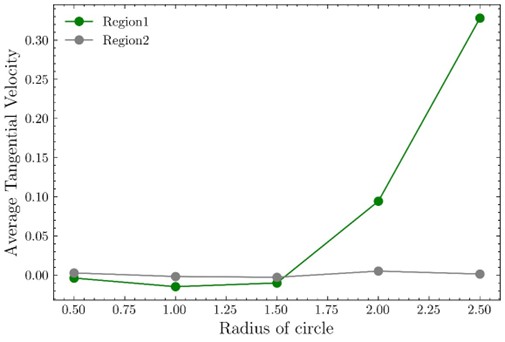
We have used the experimental ∆(𝑆ℎ𝑎𝑝𝑒 𝑖𝑛𝑑𝑒𝑥) = 0.75, which is a rough estimate of the difference between the shape indices for ROI 2 (interface), and ROI 1, ROI 3 and ROI 4 (away from interface) from Fig. 2 e for MCFL10a.
(12) The authors find that the differences in shape indices are non-zero even for Lambda=0 for some threshold pressure parameters Pi_0 in Figure 4c. This should not happen because all the cells are identical in that case. This suggests that either there are not enough statistics from the simulations or that something is wrong with the simulations. How is this simulation data obtained? Is it from a single simulation, or is this averaged over a certain number of simulations? Authors should perform multiple simulations and report both the mean values and the standard deviation.
We have addressed this in the response under main comments (1) and (2) from Reviewer 2.
(13) It is unclear how the cell extrusion was simulated in the vertex model.
Extrusion probability calculation: Simulations with just a single mutant cell were run for a range of differential interfacial line tension values (Λ = 0, 0.1, 0.4, 0.8, 1.2, 1.6) with shape tension coupling. The simulation was run till the area of the mutant cell fell below a threshold area = 0.1, after which we consider the mutant cell to be extruded. 9 different random initial seeds were run and analysed. Each seed gives a binary result – either extruded or not. This was used to calculate the extrusion probability. We have added this section to the Appendix.
(14) The authors claim that HRas^V12 clusters in bronchial epithelium grew on top of one another, but it is not clear how this can be observed in Figure 2b or in any other Figure.
We thank the reviewer for raising this point. Our original statement that cells were growing on top of each other was based on observations from the Z-stack images, which allowed us to resolve cell positions along the apico–basal axis. However, since these Zstack data are not included in the current manuscript, we agree that this claim cannot be directly supported by the figures shown. We have therefore removed this statement from the text and restricted our conclusions to what is directly supported by the presented data.
(15) In the main text, the authors state that bronchial epithelial cells exhibited higher F-actin intensities compared to mammary bronchial cells, but this difference is not statistically significant according to Figure 5e.
We agree with the reviewer and have thus changed the text because even though the Factin intensities seemed higher in bronchial epithelium visually, the difference was not statistically significant.
(16) The definition of eccentricity is incorrect in the text. The authors state that the eccentricity is quantified as the ratio of the length of the minor axis to the major axis of an ellipse. According to this definition, the eccentricity would be 1 for a circle and not 0.
We have updated the definition of eccentricity in the text to the correct one, including the correct equation.
(17) It is unclear whether the active force F_act is used in the vertex model simulations. The active force is defined, but then its value is never specified. Note that the motility force is also an active force, so it is unclear why the motility and active forces were separated.
In our model, the line tension force arising from the shape tension coupling is the active force. We agree that the motility force is also an active force, however, in the absence of any directional movement for instance, the homeostatic tissues in discussion here, we have discounted the role of motility force in our mode, presented here.
(18) The authors use inconsistent naming for different types of epithelia throughout the manuscript. Mcf10a cells are referred to as either mammary epithelium or breast epithelium, and Beas2b cells are referred to as either lung epithelium or bronchial epithelium. Because of the very broad spectrum of journal readers, it may not be obvious to all readers that different names refer to the same cell types.
We have updated the text to keep the naming consistent throughout.
(19) Many references to individual figure panels in the main text are incorrect. The authors should carefully check all the references to figures.
We apologize for these errors. We have updated the incorrect references after carefully reviewing the entire manuscript.
(20) In Figure 5, panel b is incorrectly labeled as d.
We have corrected the same.
-
eLife Assessment
This important study reports that an oncogenic population in an epithelium can either be repressed or spread, depending on the tissues. This is explained based on the differential interfacial tension hypothesis, and supported by pharmacological perturbations and numerical simulations using the vertex model. The study conveys a key message, but, as it stands, the strength of evidence is incomplete, and a more detailed analysis of the mechanistic origin of the different tensions and better comparison between experiments and simulations would strongly strengthen the message.
-
Reviewer #1 (Public review):
Summary:
The behaviour of cells expressing constitutively active HRas is examined in mosaic monolayers, both in MCF10a breast epithelial and Beas2b bronchial epithelial cell lines, mimicking the potential initial phase of development of carcinoma. Single HRas-positive cells are excluded from MCF10a but not Beas2b monolayers. Most interestingly, however, when in groups, these cells are not excluded, but rather sharply segregated within a MCF10a monolayer. In contrast, they freely mix with wt Beas2b cells. Biophysical analysis identifies high tension at heterotypic interfaces between HRas and wild-type cells as the likely reason for segregation of MCF10a cells. The hypothesis is supported experimentally, as myosin inhibition abolishes segregation. The probable reason for the lack of segregation in the …
Reviewer #1 (Public review):
Summary:
The behaviour of cells expressing constitutively active HRas is examined in mosaic monolayers, both in MCF10a breast epithelial and Beas2b bronchial epithelial cell lines, mimicking the potential initial phase of development of carcinoma. Single HRas-positive cells are excluded from MCF10a but not Beas2b monolayers. Most interestingly, however, when in groups, these cells are not excluded, but rather sharply segregated within a MCF10a monolayer. In contrast, they freely mix with wt Beas2b cells. Biophysical analysis identifies high tension at heterotypic interfaces between HRas and wild-type cells as the likely reason for segregation of MCF10a cells. The hypothesis is supported experimentally, as myosin inhibition abolishes segregation. The probable reason for the lack of segregation in the bronchial epithelium is to be found in the different intrinsic properties of these cells, which form a looser tissue with lower basal actomyosin activity. The behaviour of single cells and groups is recapitulated in a vortex model based on the principle of differential interfacial tension, under the condition of high heterotypic interfacial tension.
Strengths:
Despite being long recognized as a crucial event during cancer development, segregation of oncogenic cells has been a largely understudied question. This nice work addresses the mechanics of this phenomenon through a straightforward experimental design, applying the biophysical analytical approaches established in the field of morphogenesis. Comparison between two cell types provides some preliminary clues on the diversity of effects in various cancers.
Weaknesses:
Although not calling into question the main message of this study, there are a few issues that one may want to address:
(1) One may be careful in interpreting the comparison between MCF10a and Beas2b cells as used in this study. The conditions may not necessarily be representative of the actual properties of breast and bronchial epithelia. How much of the epithelial organization is reconstituted under these experimental conditions remains to be established. This is particularly obvious for bronchial cells, which would need quite specific culture conditions to build a proper bronchial layer. In this study, they seemed to be on the verge of a mesenchymal phenotype (large gaps, huge protrusions, cells growing on top of each other, as mentioned in the manuscript).
As an alternative to Beas2b, comparison of MCF10a with another cell line capable of more robust in vitro epithelial organization, but ideally with different adhesive and/or tensile properties, would be highly interesting, as it may narrow down the parameters involved in segregation of oncogenic cells.
(2) While the seminal description of tissue properties based on interfacial tensions (Brodland 2002) is clearly key to interpreting these data, the actual "Differential Interfacial Tension Hypothesis" poses that segregation results from global differences, i.e., juxtaposition of two tissues displaying different intrinsic tensions. On the contrary, the results of the present work support a different scenario, where what counts is the actual difference in tension ALONG the tissue boundary, in other words, that segregation is driven by high HETEROTYPIC interfacial tension. This is an important distinction that should be clarified.
(3) Related: The fact that actomyosin accumulates at the heterotypic interface is key here. It would be quite informative to better document the pattern of this accumulation, which is not clear enough from the images of the current manuscript: Are we talking about the actual interface between mutant and wt cells (membrane/cortex of heterotypic contacts)? Or is it more globally overactivated in the whole cell layer along the border? Some better images and some quantification would help.
(4) In the case of Beas2b cells, mutant cells show higher actin than wt cells, while actin is, on the contrary, lower in mutant MCF10a cells (Figure 2b). Has this been taken into account in the model? It may be in line with the idea that HRas may have a different action on the two cell types, a possibility that would certainly be worth considering and discussing.
In conclusion, the study conveys an important message, but, as it stands, the strength of evidence is incomplete. It would greatly benefit from a more detailed and complete analysis of the experimental data, a better fit between this analysis and the corresponding vertex model, and a more in-depth discussion of biological and biophysical aspects. These revisions should be rather easily done, and would then make the evidence much more solid.
-
Reviewer #2 (Public review):
Summary:
The authors investigate the behavior of oncogenic cells in mammary and bronchial epithelia. They observe that individual oncogenic cells are preferentially excluded from the mammary epithelium, but they remain integrated in the bronchial epithelium. They also observe that clusters of oncogenic cells form a compact cluster in the mammary epithelium, but they disperse in the bronchial epithelium. The authors demonstrate experimentally and in the vertex model simulations that the difference in observed behavior is due to the differential tension between the mutant and wild-type cells due to a differential expression of actin and myosin.
Strengths:
(1) Very detailed analysis of experiments to systematically characterize and quantify differences between mammary and bronchial epithelia.
(2) Detailed …
Reviewer #2 (Public review):
Summary:
The authors investigate the behavior of oncogenic cells in mammary and bronchial epithelia. They observe that individual oncogenic cells are preferentially excluded from the mammary epithelium, but they remain integrated in the bronchial epithelium. They also observe that clusters of oncogenic cells form a compact cluster in the mammary epithelium, but they disperse in the bronchial epithelium. The authors demonstrate experimentally and in the vertex model simulations that the difference in observed behavior is due to the differential tension between the mutant and wild-type cells due to a differential expression of actin and myosin.
Strengths:
(1) Very detailed analysis of experiments to systematically characterize and quantify differences between mammary and bronchial epithelia.
(2) Detailed comparison between the experiments and vertex model simulations to identify the differential cell line tension between the oncogenic and wild-type cells as one of the key parameters that are responsible for the different behavior of oncogenic cells in mammary and bronchial epithelia
Weaknesses:
(1) It is unclear what the mechanistic origin of the shape-tension coupling is, which is used in the vertex model, and how important that coupling is for the presented results. The authors claim that the shape-tension coupling is due to the anisotropic distribution of stress fibers when cells are under external stress. It is unclear why the stress fibers should affect an effective line tension on the cell boundaries and why the stress fibers should be sensitive to the magnitude of the internal isotropic cell pressure. In experiments, it makes sense that stress fibers form when cells are stretched. Similar stress fibers form when the cytoskeleton or polymer networks are stretched. It is unclear why the stress fibers should be sensitive to the magnitude of internal isotropic cell pressure. If all the surrounding cells have the same internal pressure, then the cell would not be significantly deformed due to that pressure, and stress fibers would not form. The authors should better justify the use of the shape-tension coupling in the model and also present simulation results without that coupling. I expect that most of the observed behavior is already captured by the differential tension, even if there is no shape-tension coupling.
(2) The observed difference of shape indices between the interfacial and bulk cells in simulations in the absence of differential line tension is concerning. This suggests that either there are not enough statistics from the simulations or that something is wrong with the simulations. For all presented simulation results, the authors should repeat multiple simulations and then present both averages and standard deviations. This way, it would be easier to determine whether the observed differences in simulations are statistically significant.
(3) The authors should also analyze the cell line tension data in simulations and make a comparison with experiments.
-
Author response:
Reviewer #1 (Public review):
Summary:
The behavior of cells expressing constitutively active HRas is examined in mosaic monolayers, both in MCF10a breast epithelial and Beas2b bronchial epithelial cell lines, mimicking the potential initial phase of development of carcinoma. Single HRas-positive cells are excluded from MCF10a but not Beas2b monolayers. Most interestingly, however, when in groups, these cells are not excluded, but rather sharply segregated within a MCF10a monolayer. In contrast, they freely mix with wt Beas2b cells. Biophysical analysis identifies high tension at heterotypic interfaces between HRas and wild-type cells as the likely reason for segregation of MCF10a cells. The hypothesis is supported experimentally, as myosin inhibition abolishes segregation. The probable reason for the lack of …
Author response:
Reviewer #1 (Public review):
Summary:
The behavior of cells expressing constitutively active HRas is examined in mosaic monolayers, both in MCF10a breast epithelial and Beas2b bronchial epithelial cell lines, mimicking the potential initial phase of development of carcinoma. Single HRas-positive cells are excluded from MCF10a but not Beas2b monolayers. Most interestingly, however, when in groups, these cells are not excluded, but rather sharply segregated within a MCF10a monolayer. In contrast, they freely mix with wt Beas2b cells. Biophysical analysis identifies high tension at heterotypic interfaces between HRas and wild-type cells as the likely reason for segregation of MCF10a cells. The hypothesis is supported experimentally, as myosin inhibition abolishes segregation. The probable reason for the lack of segregation in the bronchial epithelium is to be found in the different intrinsic properties of these cells, which form a looser tissue with lower basal actomyosin activity. The behaviour of single cells and groups is recapitulated in a vortex model based on the principle of differential interfacial tension, under the condition of high heterotypic interfacial tension.
Strengths:
Despite being long recognized as a crucial event during cancer development, segregation of oncogenic cells has been a largely understudied question. This nice work addresses the mechanics of this phenomenon through a straightforward experimental design, applying the biophysical analytical approaches established in the field of morphogenesis. Comparison between two cell types provides some preliminary clues on the diversity of effects in various cancers.
Weaknesses:
Although not calling into question the main message of this study, there are a few issues that one may want to address:
(1) One may be careful in interpreting the comparison between MCF10a and Beas2b cells as used in this study. The conditions may not necessarily be representative of the actual properties of breast and bronchial epithelia. How much of the epithelial organization is reconstituted under these experimental conditions remains to be established. This is particularly obvious for bronchial cells, which would need quite specific culture conditions to build a proper bronchial layer. In this study, they seemed to be on the verge of a mesenchymal phenotype (large gaps, huge protrusions, cells growing on top of each other, as mentioned in the manuscript).
We thank the reviewer for this important point. We agree that our experimental conditions do not fully recapitulate the in vivo architecture of either breast or bronchial epithelia. However, here, our intention is to compare two well-established epithelial lines with distinct intrinsic mechanical and organizational properties, rather than to reproduce in-vivo microenvironment. Nevertheless, to address this, we have now strengthened our quantitative analysis of epithelial integrity in Beas2b monolayers, by including ZO-1 immunofluorescence along with E-cadherin immunofluorescence. These measurements confirm that Beas2b monolayers under our culture conditions retain junctional organization, albeit with larger gaps and protrusions compared to MCF10a. We will revise the text to make this distinction explicit.
As an alternative to Beas2b, comparison of MCF10a with another cell line capable of more robust in vitro epithelial organization, but ideally with different adhesive and/or tensile properties, would be highly interesting, as it may narrow down the parameters involved in segregation of oncogenic cells.
We agree with the reviewer that the inclusion of an additional epithelial model system with distinct adhesive and organizational properties would provide valuable insights. In line with this suggestion, we are currently repeating the key experiments using Madin-Darby Canine Kidney (MDCK) cells, a well-established model epithelial cell line. We believe this complementary system will allow us to further dissect the behaviour of HRasV12-expressing cells.
(2) While the seminal description of tissue properties based on interfacial tensions (Brodland 2002) is clearly key to interpreting these data, the actual "Differential Interfacial Tension Hypothesis" poses that segregation results from global differences, i.e., juxtaposition of two tissues displaying different intrinsic tensions. On the contrary, the results of the present work support a different scenario, where what counts is the actual difference in tension ALONG the tissue boundary, in other words, that segregation is driven by high HETEROTYPIC interfacial tension. This is an important distinction that should be clarified.
We thank the reviewer for this insightful comment. As correctly noted, Brodland’s 2002 work provided a seminal formulation of the Differential Interfacial Tension Hypothesis (DITH), which frames tissue organization in terms of effective interfacial tensions. In its original form, DITH emphasized segregation as a consequence of global differences in the intrinsic (bulk) tensions of juxtaposed tissues.
While our results specifically show that segregation is determined by local interfacial mechanics between transformed- and host cells, from our experiments with blebbistatin, where we observed lost in segregation upon reducing global contractility, we believe that the differences in local interfacial mechanics also stem from global differences which belong intrinsically to the tissues in discussion here.
To directly map global interfacial tension, in the revised manuscript, we aim to perform staining with E-cadherin, and actin in the two tissues, and measure cortical actin, stress fibers, and E-cadherin levels at the cell-cell junctions. Once the global tissue mechanics are mapped, we can be more confident about our claim on DITH. Nevertheless, we will also clarify this distinction, more clearly in the text and explicitly state that while DITH provided the foundation for conceptualizing tissue mechanics, our findings on transformed cell- healthy cell interactions specifically demonstrate that segregation is driven by high heterotypic interfacial tension at the tissue boundary.
(3) Related: The fact that actomyosin accumulates at the heterotypic interface is key here. It would be quite informative to better document the pattern of this accumulation, which is not clear enough from the images of the current manuscript: Are we talking about the actual interface between mutant and wt cells (membrane/cortex of heterotypic contacts)? Or is it more globally overactivated in the whole cell layer along the border? Some better images and some quantification would help.
We agree that more detailed visualization of actomyosin distribution would strengthen our conclusion. We are currently working on re-imaging the heterotypic interfaces at higher magnification and are quantifying fluorescence intensity of actin and myosin-II along cell–cell boundaries. All of this will be integrated in the next version of the manuscript.
(4) In the case of Beas2b cells, mutant cells show higher actin than wt cells, while actin is, on the contrary, lower in mutant MCF10a cells (Author response image 2). Has this been taken into account in the model? It may be in line with the idea that HRas may have a different action on the two cell types, a possibility that would certainly be worth considering and discussing.
Our current vertex model does not explicitly incorporate actin levels; rather, it captures their functional consequences indirectly through effective mechanical parameters such as cortical tension and adhesion strength. Nonetheless, we agree that the opposite trends in actin enrichment between Beas2b and MCF10a HRasV12 mutants raise the important possibility that HRas signaling may act through distinct mechanisms in the two cell types.
To further investigate this, we are currently culturing MCF10a and Beas2b HRasV12 mutant populations separately (i.e., without wild-type cells) to assess their intrinsic organization and behavior in isolation. These experiments will help us disentangle how HRas activation differentially impacts epithelial architecture in these two cellular contexts, and we will discuss these ongoing efforts in the revised manuscript.
From the modelling perspective, the model currently does not account for the different actin levels of mutants with respect to wt cells in the two tissues. This can be accounted for by having different and for mutants and wt in the two cases in simulation.
In conclusion, the study conveys an important message, but, as it stands, the strength of evidence is incomplete. It would greatly benefit from a more detailed and complete analysis of the experimental data, a better fit between this analysis and the corresponding vertex model, and a more in-depth discussion of biological and biophysical aspects. These revisions should be rather easily done, and would then make the evidence much more solid.
Reviewer #2 (Public review):
Summary:
The authors investigate the behavior of oncogenic cells in mammary and bronchial epithelia. They observe that individual oncogenic cells are preferentially excluded from the mammary epithelium, but they remain integrated in the bronchial epithelium. They also observe that clusters of oncogenic cells form a compact cluster in the mammary epithelium, but they disperse in the bronchial epithelium. The authors demonstrate experimentally and in the vertex model simulations that the difference in observed behavior is due to the differential tension between the mutant and wild-type cells due to a differential expression of actin and myosin.
Strengths:
(1) Very detailed analysis of experiments to systematically characterize and quantify differences between mammary and bronchial epithelia.
(2) Detailed comparison between the experiments and vertex model simulations to identify the differential cell line tension between the oncogenic and wild-type cells as one of the key parameters that are responsible for the different behavior of oncogenic cells in mammary and bronchial epithelia
Weaknesses:
(1) It is unclear what the mechanistic origin of the shape-tension coupling is, which is used in the vertex model, and how important that coupling is for the presented results. The authors claim that the shape-tension coupling is due to the anisotropic distribution of stress fibers when cells are under external stress. It is unclear why the stress fibers should affect an effective line tension on the cell boundaries and why the stress fibers should be sensitive to the magnitude of the internal isotropic cell pressure. In experiments, it makes sense that stress fibers form when cells are stretched. Similar stress fibers form when the cytoskeleton or polymer networks are stretched. It is unclear why the stress fibers should be sensitive to the magnitude of internal isotropic cell pressure. If all the surrounding cells have the same internal pressure, then the cell would not be significantly deformed due to that pressure, and stress fibers would not form. The authors should better justify the use of the shape-tension coupling in the model and also present simulation results without that coupling. I expect that most of the observed behavior is already captured by the differential tension, even if there is no shape-tension coupling.
While the segregation behavior can be captured by the differential tension, without the shape-tension coupling, we noticed unjamming and aligned movement of wild type cells at the mutant-cell interface. This was only captured when we incorporated shape tension coupling in the model, suggesting changes in cell shapes due to differential interfacial tension is essential in driving the fate of the mutants. Below, difference between shape indices of cells at the interface and away from the boundary is plotted versus the interfacial tension in the case of no shape-tension coupling [Author response image 1]. The red dashed line represents the experimental value of the shape index difference. The blue line is the shape index difference between two randomly chosen groups of cells (half of the total number of cells in each group is taken). At zero line-tension, the difference in shape index between interface cells and cells away from the interface is same as that between randomly chosen groups of cells, which is expected since there should be no interface at zero line-tension. The no shape-tension data presented here are averaged over 19 seeds. Although the results without shape-tension coupling reaches experimental values at high enough differential tension [Author response image 2], a closer inspection of the simulation results show that the cells are just squeezed and are aligned perpendicular to the interface, which is contrary to what is seen in experiments.
Author response image 1.
Shape indices versus the interfacial line tension
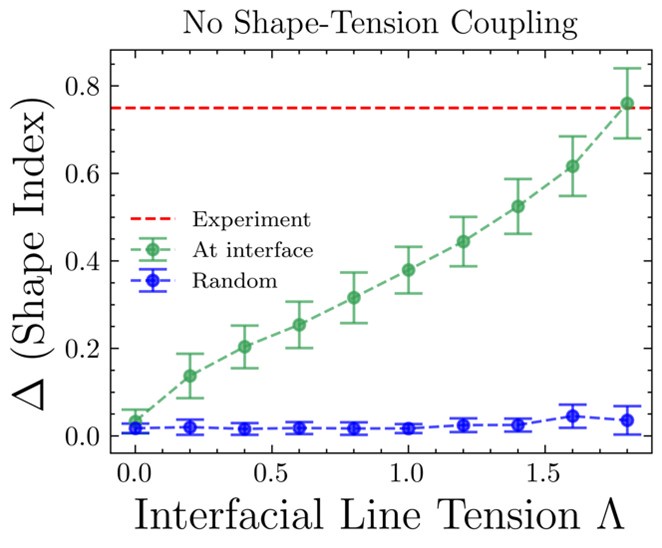
Calculating the average of the absolute value of the dot product of the nematic director and the interface edge for simulations with and without shape-tension coupling clearly shows that with shape-tension coupling, the cells align and elongate along the interface as is seen in experiment, given by an interface dot product value > 0.5 at high enough line-tension values. Further, shape-tension coupling or biased edge tension has been used before to model for cell elongation during embryo elongation [1] and here we use it as an active line-tension force, which elongates cells along the interface, in addition to the differential tension which is passive. This additional quantification of the alignment and elongation of cells along the interface will be added to the Supplementary Information (SI).
[1] Dye, N. A., Popović, M., Iyer, K. V., Fuhrmann, J. F., Piscitello-Gómez, R., Eaton, S., & Jülicher, F. (2021). Self-organized patterning of cell morphology via mechanosensitive feedback. Elife, 10, e57964.
Author response image 2.
Change in interfacial tension with and without shape tension coupling
(2) The observed difference of shape indices between the interfacial and bulk cells in simulations in the absence of differential line tension is concerning. This suggests that either there are not enough statistics from the simulations or that something is wrong with the simulations. For all presented simulation results, the authors should repeat multiple simulations and then present both averages and standard deviations. This way, it would be easier to determine whether the observed differences in simulations are statistically significant.
The reviewer is right in pointing out that statistics for the plots must be shown. The difference in shape indices between the interfacial and bulk cells in simulations has been calculated over 11 different seed values. The observed differences in simulations along with the standard deviations have been plotted below [Author response image 3]. This figure in the paper will be updated to include the standard deviations. The non-zero difference in shape index in the absence of differential line tension for low values of stress threshold is due to the shape-tension coupling acting even at low differential tension. Thus, a non-zero, sufficiently high value of the stress threshold is required in our model with shape-tension coupling, for the model to make sense. This has also been stated in section 4 of the paper. The importance of the stress-tension coupling has been stated in response to the previous point.
Author response image 3.
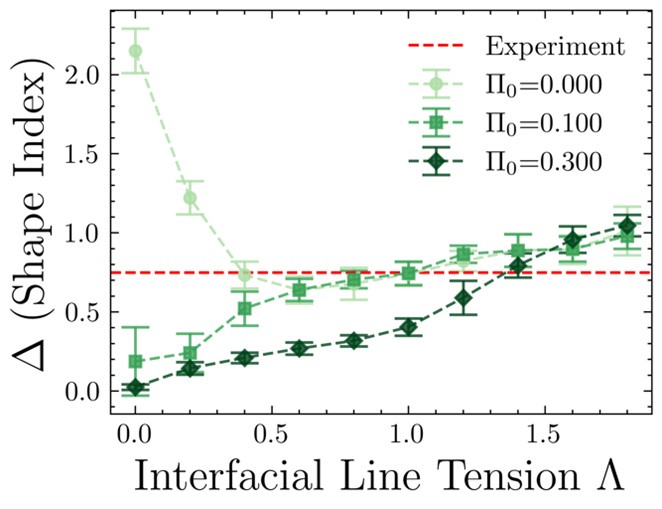
(3) The authors should also analyze the cell line tension data in simulations and make a comparison with experiments.
We agree with the reviewer that cell line tension data should also be analyzed and compared with experiments. This will be added to the next version of the paper.
-
-
