High-throughput neutralization measurements correlate strongly with evolutionary success of human influenza strains
Curation statements for this article:-
Curated by eLife

eLife Assessment
This fundamental study advances our understanding of population-level immune responses to influenza in both children and adults. The strength of the evidence supporting the conclusions is compelling, with high-throughput profiling assays and mathematical modeling. The work will be of interest to immunologists, virologists, vaccine developers, and those working on mathematical modeling of infectious diseases.
This article has been Reviewed by the following groups
Discuss this preprint
Start a discussion What are Sciety discussions?Listed in
- Evaluated articles (eLife)
Abstract
Human influenza viruses rapidly acquire mutations in their hemagglutinin (HA) protein that erode neutralization by antibodies from prior exposures. Here, we use a sequencing-based assay to measure neutralization titers for 78 recent H3N2 HA strains against a large set of children and adult sera, measuring ∼10,000 total titers. There is substantial person-to-person heterogeneity in the titers against different viral strains, both within and across age cohorts. The growth rates of H3N2 strains in the human population in 2023 are highly correlated with the fraction of sera with low titers against each strain. Notably, strain growth rates are less correlated with neutralization titers against pools of human sera, demonstrating the importance of population heterogeneity in shaping viral evolution. Overall, these results suggest that high-throughput neutralization measurements of human sera against many different viral strains can help explain the evolution of human influenza.
Article activity feed
-

eLife Assessment
This fundamental study advances our understanding of population-level immune responses to influenza in both children and adults. The strength of the evidence supporting the conclusions is compelling, with high-throughput profiling assays and mathematical modeling. The work will be of interest to immunologists, virologists, vaccine developers, and those working on mathematical modeling of infectious diseases.
-
Reviewer #1 (Public review):
The authors present exciting new experimental data on the antigenic recognition of 78 H3N2 strains (from the beginning of the 2023 Northern Hemisphere season) against a set of 150 serum samples. The authors compare protection profiles of individual sera and find that the antigenic effect of amino acid substitutions at specific sites depends on the immune class of the sera, differentiating between children and adults. Person-to-person heterogeneity in the measured titers is strong, specifically in the group of children's sera. The authors find that the fraction of sera with low titers correlates with the inferred growth rate using maximum likelihood regression (MLR), a correlation that does not hold for pooled sera. The authors then measure the protection profile of the sera against historical vaccine strains …
Reviewer #1 (Public review):
The authors present exciting new experimental data on the antigenic recognition of 78 H3N2 strains (from the beginning of the 2023 Northern Hemisphere season) against a set of 150 serum samples. The authors compare protection profiles of individual sera and find that the antigenic effect of amino acid substitutions at specific sites depends on the immune class of the sera, differentiating between children and adults. Person-to-person heterogeneity in the measured titers is strong, specifically in the group of children's sera. The authors find that the fraction of sera with low titers correlates with the inferred growth rate using maximum likelihood regression (MLR), a correlation that does not hold for pooled sera. The authors then measure the protection profile of the sera against historical vaccine strains and find that it can be explained by birth cohort for children. Finally, the authors present data comparing pre- and post- vaccination protection profiles for 39 (USA) and 8 (Australia) adults. The data shows a cohort-specific vaccination effect as measured by the average titer increase, and also a virus-specific vaccination effect for the historical vaccine strains. The generated data is shared by the authors and they also note that these methods can be applied to inform the bi-annual vaccine composition meetings, which could be highly valuable.
Comments on revisions:
Thanks to the authors for the revised version of the manuscript. This version contains extended explanations clarifying the growth analysis by MLR. The other points of the initial report were addressed as well by language adjustments. As discussed during the revision process, future work might focus on the observed heterogeneity among the serum titers to different strains and its causes, which requires additional in-depth analysis.
-
Reviewer #2 (Public review):
This is an excellent paper. The ability to measure the immune response to multiple viruses in parallel is a major advancement for the field, that will be relevant across pathogens (assuming the assay can be appropriately adapted). I only had a few comments, focused on maximising the information provided by the sera.
Comments on revisions:
These concerns were all addressed in the revised paper.
-
Author response:
The following is the authors’ response to the previous reviews
Public Reviews:
Reviewer #1 (Public review):
The authors present exciting new experimental data on the antigenic recognition of 78 H3N2 strains (from the beginning of the 2023 Northern Hemisphere season) against a set of 150 serum samples. The authors compare protection profiles of individual sera and find that the antigenic effect of amino acid substitutions at specific sites depends on the immune class of the sera, differentiating between children and adults. Person-to-person heterogeneity in the measured titers is strong, specifically in the group of children's sera. The authors find that the fraction of sera with low titers correlates with the inferred growth rate using maximum likelihood regression (MLR), a correlation that does not hold for pooled …
Author response:
The following is the authors’ response to the previous reviews
Public Reviews:
Reviewer #1 (Public review):
The authors present exciting new experimental data on the antigenic recognition of 78 H3N2 strains (from the beginning of the 2023 Northern Hemisphere season) against a set of 150 serum samples. The authors compare protection profiles of individual sera and find that the antigenic effect of amino acid substitutions at specific sites depends on the immune class of the sera, differentiating between children and adults. Person-to-person heterogeneity in the measured titers is strong, specifically in the group of children's sera. The authors find that the fraction of sera with low titers correlates with the inferred growth rate using maximum likelihood regression (MLR), a correlation that does not hold for pooled sera. The authors then measure the protection profile of the sera against historical vaccine strains and find that it can be explained by birth cohort for children. Finally, the authors present data comparing pre- and post- vaccination protection profiles for 39 (USA) and 8 (Australia) adults. The data shows a cohort-specific vaccination effect as measured by the average titer increase, and also a virus-specific vaccination effect for the historical vaccine strains. The generated data is shared by the authors and they also note that these methods can be applied to inform the bi-annual vaccine composition meetings, which could be highly valuable.
We appreciate the reviewer’s clear summary of our work.
Thanks to the authors for the revised version of the manuscript. A few concerns remain after the revision:
(1) We appreciate the additional computational analysis the authors have performed on normalizing the titers with the geometric mean titer for each individual, as shown in the new Supplemental Figure 6. We agree with the authors statement that, after averaging again within specific age groups, "there are no obvious age group-specific patterns." A discussion of this should be added to the revised manuscript, for example in the section "Pooled sera fail to capture the heterogeneity of individual sera," referring to the new Supplemental Figure 6.
However, we also suggested that after this normalization, patterns might emerge that are not necessarily defined by birth cohort. This possibility remains unexplored and could provide an interesting addition to support potential effects of substitutions at sites 145 and 275/276 in individuals with specific titer profiles, which as stated above do not necessarily follow birth cohort patterns.
The reviewer is correct that there remains heterogeneity among the serum titers to different strains that we cannot easily explain via age group, and suggests that additional patterns could emerge. We certainly agree that explaining this heterogeneity remains an interesting goal, but as described in the manuscript we have analyzed the possible causes of the heterogeneity as exhaustively as possible given the available metadata. At this point, the most we can say is that the strain-specific neutralization titers are highly heterogeneous in a way that cannot be completely explained by birth cohort. We agree that further analysis of the cause is an area for future work, and have made all of our data available so that others can continue to explore additional hypotheses. It may be that these questions can only be answered by experiments on sera from newer cohorts where more detailed metadata on infection and vaccination history are available.
(2) Thank you for elaborating further on the method used to estimate growth rates in your reply to the reviewers. To clarify: the reason that we infer from Fig. 5a that A/Massachusetts has a higher fitness than A/Sydney is not because it reaches a higher maximum frequency, but because it seems to have a higher slope. The discrepancy between this plot and the MLR inferred fitness could be clarified by plotting the frequency trajectories on a log-scale.
For the MLR, we understand that the initial frequency matters in assessing a variant's growth. However, when starting points of two clades differ in time (i.e., in different contexts of competing clades), this affects comparability, particularly between A/Massachusetts and A/Ontario, as well as for other strains. We still think that mentioning these time-dependent effects, which are not captured by the MLR analysis, would be appropriate. To support this, it could be helpful to include the MLR fits as an appendix figure, showing the different starting and/or time points used.
Multinomial logistic regression is a widely used technique to estimate viral growth rates from sequencing counts (PLoS Computational Biology, 20:e1012443; Nature, 597:703-708; Science, 376:1327-1332). As the reviewer points out, it does assume that the relative viral growth rates are constant over the time period analyzed. However, most of the patterns mentioned by the reviewer are not deviations from this assumption, but rather just due to the fact that frequencies are plotted on a linear scale. More specifically, our multinomial logistic regression implementation defines two parameters per variant: the initial frequency and the growth rate. The absolute variant growth rate is effectively the slope of the logit-transformed variant frequencies. Each variant's relative fitness depends on that variant's growth rate relative to a predefined baseline variant. Plotting frequencies on a logit scale does help emphasize the importance of the slope by showing exponential growth as a linear trajectory. We have added a new Supplemental Figure 9 that plots the frequencies from Figure 5A on a logit scale. As can be seen the frequency trajectories are closer to linear on the logit scale.
We have updated the results text to clarify the nature of the fixed relative growth rates per strain and to refer to this new supplemental figure as follows:
To estimate the evolutionary success of different human H3N2 influenza strains during 2023, we used multinomial logistic regression, which uses sequence counts to estimate fixed strain growth rates relative to a baseline strain for the entire analysis time period (in this case, 2023) [50–52]. Relative growth rates estimated by multinomial logistic regression represent relative fitnesses of strains over that time period. There were sufficient sequencing counts to reliably estimate growth rates in 2023 for 12 of the HAs for which we measured titers using our sequencing-based neutralization assay libraries (Figure 5a,b and Supplemental Figure 9). We estimated strain growth rates relative to the baseline strain of A/Massachusetts/18/2022. Note that these growth rates estimate how rapidly each strain grows relative to the baseline strain, rather than the absolute highest frequency reached by each strain. Each strain’s absolute growth rate corresponds to the slope of the strain’s logit-transformed frequencies at the end of the analysis time period (Supplemental Figure 9).
As the reviewer notes, the multinomial logistic regression implementation assumes a fixed growth rate for each strain over the time period being analyzed. This limitation causes the inferred growth rates to emphasize the latest trends in the analysis time period. For example, at the end of December 2023 in Figure 5A, the A/Ontario/RV00796/2023 strain is growing rapidly and replacing all other variants. Correspondingly, the multinomial logistic regression infers a high growth rate for that Ontario strain relative to the A/Massachusetts/18/2022 baseline strain. However, the A/Massachusetts/18/2022 strain was growing relative to other strains in the first half of 2023 since it has a higher growth rate than they do. However, there are modest deviations from linearity on the logit scale shown in the added supplementary figure likely because the assumption of a fixed set of relative growth rates over the analyzed time period is an approximation.
We have added the following text to the discussion to highlight this limitation of the multinomial logistic regression:
Our comparisons of the neutralization titers to the growth rates of different H3N2 strains was limited by the fact that only a modest number of strains had adequate sequence data to estimate their growth rates. Strains with more sequencing counts tend to be those with moderate-to-high fitness, which therefore limited the dynamic range of growth rates across strains we were able to analyze. Relatedly, the multinomial logistic regression infers a single fixed growth rate per strain for the entire analysis time period of 2023, and cannot represent changes in relative fitness of strains over that relatively short time period. Additionally, because the strains for which we estimated growth rates are phylogenetically related it is difficult to assess the statistical significance of the correlation [53], so it will be important for future work to reassess the correlations with new neutralization data against the dominant strains in future years.
(3) Regarding my previous suggestion to test an older vaccine strain than A/Texas/50/2012 to assess whether the observed peak in titer measurements is virus-specific: We understand that the authors want to focus the scope of this paper on the relative fitness of contemporary strains, and that this additional experimental effort would go beyond the main objectives outlined in this manuscript. However, the authors explicitly note that "Adults across age groups also have their highest titers to the oldest vaccine strain tested, consistent with the fact that these adults were first imprinted by exposure to an older strain." This statement gives the impression that imprinting effects increase titers for older strains, whereas this does not seem to be true from their results, but only true for A/Texas. It should be modified accordingly.
We agree with the reviewer’s suggestion that the specific language describing the potential trend of adults having the highest titers to the oldest strain tested could be further caveated. To this end, we have made the following edits to the portion of the main text that they highlighted:
Adults across age groups also have their highest titers to the oldest vaccine strain tested (Figure 6), consistent with the fact that these adults were likely first imprinted by exposure to an older strain more antigenically similar to A/Texas/50/2012 (the oldest strain tested here) than more recent strains. Note that a similar trend towards adult sera having higher titers to older vaccine strains was also observed in a more recent study we have performed using the same methodology described here [60].
Notably, this trend of adults across age groups having the highest titers to the oldest vaccine strains tested has held true in subsequent work we’ve performed with H1N1 viruses (Kikawa et al., 2025 Virus Evolution, DOI: https://doi.org/10.1093/ve/veaf086). In that more recent study, we again saw that adults (cohorts EPIHK, NIID, and UWMC) tended to have their highest titers to the oldest cell-passaged strain tested (A/California/07/2009), whereas children (cohort SCH) had more similar neutralization titers across strains. These additional data therefore support the idea that adults tend to have their highest titers to older vaccine strains, a finding that is also consistent with substantial prior work (eg, Science, 346:996-1000).
Reviewer #2 (Public review):
This is an excellent paper. The ability to measure the immune response to multiple viruses in parallel is a major advancement for the field, that will be relevant across pathogens (assuming the assay can be appropriately adapted). I only had a few comments, focused on maximising the information provided by the sera. These concerns were all addressed in the revised paper.
We thank this reviewer for the summary of our work and their helpful comments in the first revision.
Reviewer #3 (Public review):
The authors use high throughput neutralisation data to explore how different summary statistics for population immune responses relate to strain success, as measured by growth rate during the 2023 season. The question of how serological measurements relate to epidemic growth is an important one, and I thought the authors present a thoughtful analysis tackling this question, with some clear figures. In particular, they found that stratifying the population based on the magnitude of their antibody titres correlates more with strain growth than using measurements derived from pooled serum data. The updated manuscript has a stronger motivation, and there is substantial potential to build on this work in future research.
Comments on revisions:
I have no additional recommendations. There are several areas where the work could be further developed, which were not addressed in detail in the responses, but given this is a strong manuscript as it stands, it is fine that these aspects are for consideration only at this point.
We appreciate this reviewer’s summary of our work, and we are glad they feel the motivation is stronger in the revised manuscript.
-

-
-
-
eLife Assessment
This important study advances our understanding of population-level immune responses to influenza in both children and adults. The strength of the evidence supporting the conclusions is compelling, with high-throughput profiling assays and mathematical modeling. The work will be of interest to immunologists, virologists, vaccine developers, and those working on mathematical modeling of infectious diseases.
-
Reviewer #1 (Public review):
The authors present exciting new experimental data on the antigenic recognition of 78 H3N2 strains (from the beginning of the 2023 Northern Hemisphere season) against a set of 150 serum samples. The authors compare protection profiles of individual sera and find that the antigenic effect of amino acid substitutions at specific sites depends on the immune class of the sera, differentiating between children and adults. Person-to-person heterogeneity in the measured titers is strong, specifically in the group of children's sera. The authors find that the fraction of sera with low titers correlates with the inferred growth rate using maximum likelihood regression (MLR), a correlation that does not hold for pooled sera. The authors then measure the protection profile of the sera against historical vaccine strains …
Reviewer #1 (Public review):
The authors present exciting new experimental data on the antigenic recognition of 78 H3N2 strains (from the beginning of the 2023 Northern Hemisphere season) against a set of 150 serum samples. The authors compare protection profiles of individual sera and find that the antigenic effect of amino acid substitutions at specific sites depends on the immune class of the sera, differentiating between children and adults. Person-to-person heterogeneity in the measured titers is strong, specifically in the group of children's sera. The authors find that the fraction of sera with low titers correlates with the inferred growth rate using maximum likelihood regression (MLR), a correlation that does not hold for pooled sera. The authors then measure the protection profile of the sera against historical vaccine strains and find that it can be explained by birth cohort for children. Finally, the authors present data comparing pre- and post- vaccination protection profiles for 39 (USA) and 8 (Australia) adults. The data shows a cohort-specific vaccination effect as measured by the average titer increase, and also a virus-specific vaccination effect for the historical vaccine strains. The generated data is shared by the authors and they also note that these methods can be applied to inform the bi-annual vaccine composition meetings, which could be highly valuable.
Thanks to the authors for the revised version of the manuscript. A few concerns remain after the revision:
(1) We appreciate the additional computational analysis the authors have performed on normalizing the titers with the geometric mean titer for each individual, as shown in the new Supplemental Figure 6. We agree with the authors statement that, after averaging again within specific age groups, "there are no obvious age group-specific patterns." A discussion of this should be added to the revised manuscript, for example in the section "Pooled sera fail to capture the heterogeneity of individual sera," referring to the new Supplemental Figure 6.
However, we also suggested that after this normalization, patterns might emerge that are not necessarily defined by birth cohort. This possibility remains unexplored and could provide an interesting addition to support potential effects of substitutions at sites 145 and 275/276 in individuals with specific titer profiles, which as stated above do not necessarily follow birth cohort patterns.
(2) Thank you for elaborating further on the method used to estimate growth rates in your reply to the reviewers. To clarify: the reason that we infer from Fig. 5a that A/Massachusetts has a higher fitness than A/Sydney is not because it reaches a higher maximum frequency, but because it seems to have a higher slope. The discrepancy between this plot and the MLR inferred fitness could be clarified by plotting the frequency trajectories on a log-scale.
For the MLR, we understand that the initial frequency matters in assessing a variant's growth. However, when starting points of two clades differ in time (i.e., in different contexts of competing clades), this affects comparability, particularly between A/Massachusetts and A/Ontario, as well as for other strains. We still think that mentioning these time-dependent effects, which are not captured by the MLR analysis, would be appropriate. To support this, it could be helpful to include the MLR fits as an appendix figure, showing the different starting and/or time points used.
(3) Regarding my previous suggestion to test an older vaccine strain than A/Texas/50/2012 to assess whether the observed peak in titer measurements is virus-specific: We understand that the authors want to focus the scope of this paper on the relative fitness of contemporary strains, and that this additional experimental effort would go beyond the main objectives outlined in this manuscript. However, the authors explicitly note that "Adults across age groups also have their highest titers to the oldest vaccine strain tested, consistent with the fact that these adults were first imprinted by exposure to an older strain." This statement gives the impression that imprinting effects increase titers for older strains, whereas this does not seem to be true from their results, but only true for A/Texas. It should be modified accordingly.
-
Reviewer #2 (Public review):
This is an excellent paper. The ability to measure the immune response to multiple viruses in parallel is a major advancement for the field, that will be relevant across pathogens (assuming the assay can be appropriately adapted). I only had a few comments, focused on maximising the information provided by the sera. These concerns were all addressed in the revised paper.
-
Reviewer #3 (Public review):
The authors use high throughput neutralisation data to explore how different summary statistics for population immune responses relate to strain success, as measured by growth rate during the 2023 season. The question of how serological measurements relate to epidemic growth is an important one, and I thought the authors present a thoughtful analysis tackling this question, with some clear figures. In particular, they found that stratifying the population based on the magnitude of their antibody titres correlates more with strain growth than using measurements derived from pooled serum data. The updated manuscript has a stronger motivation, and there is substantial potential to build on this work in future research.
Comments on revisions:
I have no additional recommendations. There are several areas where …
Reviewer #3 (Public review):
The authors use high throughput neutralisation data to explore how different summary statistics for population immune responses relate to strain success, as measured by growth rate during the 2023 season. The question of how serological measurements relate to epidemic growth is an important one, and I thought the authors present a thoughtful analysis tackling this question, with some clear figures. In particular, they found that stratifying the population based on the magnitude of their antibody titres correlates more with strain growth than using measurements derived from pooled serum data. The updated manuscript has a stronger motivation, and there is substantial potential to build on this work in future research.
Comments on revisions:
I have no additional recommendations. There are several areas where the work could be further developed, which were not addressed in detail in the responses, but given this is a strong manuscript as it stands, it is fine that these aspects are for consideration only at this point.
-
Author response:
The following is the authors’ response to the original reviews.
Reviewer #1 (Public review):
The authors present exciting new experimental data on the antigenic recognition of 78 H3N2 strains (from the beginning of the 2023 Northern Hemisphere season) against a set of 150 serum samples. The authors compare protection profiles of individual sera and find that the antigenic effect of amino acid substitutions at specific sites depends on the immune class of the sera, differentiating between children and adults. Person-to-person heterogeneity in the measured titers is strong, specifically in the group of children's sera. The authors find that the fraction of sera with low titers correlates with the inferred growth rate using maximum likelihood regression (MLR), a correlation that does not hold for pooled sera. The authors …
Author response:
The following is the authors’ response to the original reviews.
Reviewer #1 (Public review):
The authors present exciting new experimental data on the antigenic recognition of 78 H3N2 strains (from the beginning of the 2023 Northern Hemisphere season) against a set of 150 serum samples. The authors compare protection profiles of individual sera and find that the antigenic effect of amino acid substitutions at specific sites depends on the immune class of the sera, differentiating between children and adults. Person-to-person heterogeneity in the measured titers is strong, specifically in the group of children's sera. The authors find that the fraction of sera with low titers correlates with the inferred growth rate using maximum likelihood regression (MLR), a correlation that does not hold for pooled sera. The authors then measure the protection profile of the sera against historical vaccine strains and find that it can be explained by birth cohort for children. Finally, the authors present data comparing pre- and post- vaccination protection profiles for 39 (USA) and 8 (Australia) adults. The data shows a cohort-specific vaccination effect as measured by the average titer increase, and also a virus-specific vaccination effect for the historical vaccine strains. The generated data is shared by the authors and they also note that these methods can be applied to inform the bi-annual vaccine composition meetings, which could be highly valuable.
Thanks for this nice summary of our paper.
The following points could be addressed in a revision:
(1) The authors conclude that much of the person-to-person and strain-to-strain variation seems idiosyncratic to individual sera rather than age groups. This point is not yet fully convincing. While the mean titer of an individual may be idiosyncratic to the individual sera, the strain-to-strain variation still reveals some patterns that are consistent across individuals (the authors note the effects of substitutions at sites 145 and 275/276). A more detailed analysis, removing the individual-specific mean titer, could still show shared patterns in groups of individuals that are not necessarily defined by the birth cohort.
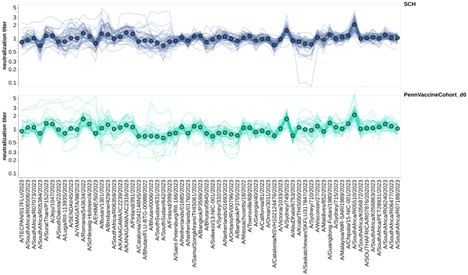
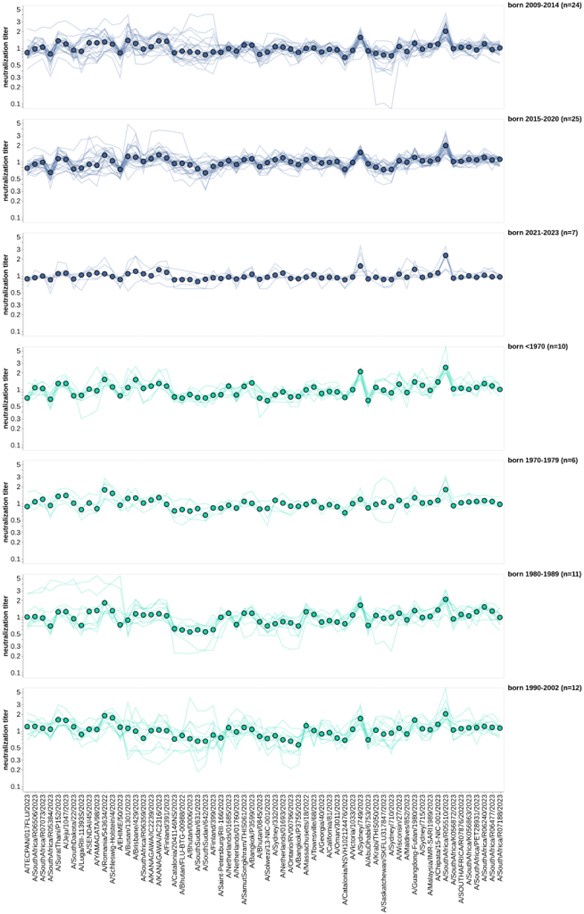
As the reviewer suggests, we normalized the titers for all sera to the geometric mean titer for each individual in the US-based pre-vaccination adults and children. This is only for the 2023-circulating viral strains. We then faceted these normalized titers by the same age groups we used in Figure 6, and the resulting plot is shown. Although there are differences among virus strains (some are better neutralized than others), there are not obvious age group-specific patterns (eg, the trends in the two facets are similar). This observation suggests that at least for these relatively closely related recent H3N2 strains, the strain-to-strain variation does not obviously segregate by age group. Obviously, it is possible (we think likely) that there would be more obvious age-group specific trends if we looked at a larger swath of viral strains covering a longer time range (eg, over decades of influenza evolution). We have added the new plots shown as a Supplemental Figure 6 in the revised manuscript.
(2) The authors show that the fraction of sera with a titer 138 correlates strongly with the inferred growth rate using MLR. However, the authors also note that there exists a strong correlation between the MLR growth rate and the number of HA1 mutations. This analysis does not yet show that the titers provide substantially more information about the evolutionary success. The actual relation between the measured titers and fitness is certainly more subtle than suggested by the correlation plot in Figure 5. For example, the clades A/Massachusetts and A/Sydney both have a positive fitness at the beginning of 2023, but A/Massachusetts has substantially higher relative fitness than A/Sydney. The growth inference in Figure 5b does not appear to map that difference, and the antigenic data would give the opposite ranking. Similarly, the clades A/Massachusetts and A/Ontario have both positive relative fitness, as correctly identified by the antigenic ranking, but at quite different times (i.e., in different contexts of competing clades). Other clades, like A/St. Petersburg are assigned high growth and high escape but remain at low frequency throughout. Some mention of these effects not mapped by the analysis may be appropriate.
Thanks for the nice summary of our findings in Figure 5. However, the reviewer is misreading the growth charts when they say that A/Massachusetts/18/2022 has a substantially higher fitness than A/Sydney/332/2023. Figure 5a (reprinted at left panel) shows the frequency trajectory of different variants over time. While A/Massachusetts/18/2022 reaches a higher frequency than A/Sydney/332/2023, the trajectory is similar and the reason that A/Massachusetts/18/2022 reached a higher max frequency is that it started at a higher frequency at the beginning of 2023. The MLR growth rate estimates differ from the maximum absolute frequency reached: instead, they reflect how rapidly each strain grows relative to others. In fact, A/Massachusetts/18/2022 and A/Sydney/332/2023 have similar growth rates, as shown in Supplemental Figure 6b (reprinted at right). Similarly, A/Saint-Petersburg/RII-166/2023 starts at a low initial frequency but then grows even as A/Massachusetts/18/2022 and A/Sydney/332/2023 are declining, and so has a higher growth rate than both of those.
In the revised manuscript, we have clarified how viral growth rates are estimated from frequency trajectories, and how growth rate differs from max frequency in the text below:
“To estimate the evolutionary success of different human H3N2 influenza strains during 2023, we used multinomial logistic regression, which analyzes strain frequencies over time to calculate strain-specific relative growth rates [51–53]. There were sufficient sequencing counts to reliably estimate growth rates in 2023 for 12 of the HAs for which we measured titers using our sequencing-based neutralization assay libraries (Figure 5a,b and Supplemental Figure 9a,b). Note that these growth rates estimate how rapidly each strain grows relative to the other strains, rather than the absolute highest frequency reached by each strain “.
(3) For the protection profile against the vaccine strains, the authors find for the adult cohort that the highest titer is always against the oldest vaccine strain tested, which is A/Texas/50/2012. However, the adult sera do not show an increase in titer towards older strains, but only a peak at A/Texas. Therefore, it could be that this is a virus-specific effect, rather than a property of the protection profile. Could the authors test with one older vaccine virus (A/Perth/16/2009?) whether this really can be a general property?
We are interested in studying immune imprinting more thoroughly using sequencing-based neutralization assays, but we note that the adults in the cohorts we studied would have been imprinted with much older strains than included in this library. As this paper focuses on the relative fitness of contemporary strains with minor secondary points regarding imprinting, these experiments are beyond the scope of this study. We’re excited for future work (from our group or others) to explore these points by making a new virus library with strains from multiple decades of influenza evolution.
Reviewer #2 (Public review):
This is an excellent paper. The ability to measure the immune response to multiple viruses in parallel is a major advancement for the field, which will be relevant across pathogens (assuming the assay can be appropriately adapted). I only have a few comments, focused on maximising the information provided by the sera.
Thanks very much!
Firstly, one of the major findings is that there is wide heterogeneity in responses across individuals. However, we could expect that individuals' responses should be at least correlated across the viruses considered, especially when individuals are of a similar age. It would be interesting to quantify the correlation in responses as a function of the difference in ages between pairs of individuals. I am also left wondering what the potential drivers of the differences in responses are, with age being presumably key. It would be interesting to explore individual factors associated with responses to specific viruses (beyond simply comparing adults versus children).
We thank the reviewer for this interesting idea. We performed this analysis (and the related analyses described) and added this as a new Supplemental Figure 7, which is pasted after the response to the next related comment by the reviewer.
For 2023-circulating strains, we observed basically no correlation between the strength of correlation between pairs of sera and the difference in age between those pairs of sera (Supplemental Figure 7), which was unsurprising given the high degree of heterogeneity between individual sera (Figure 3, Supplemental Figure 6, and Supplemental Figure 8). For vaccine strains, there is a moderate negative correlation only in the children, but not in the adults or the combined group of adults and children. This could be because the children are younger with limited and potentially more similar vaccine and exposure histories than the adults. It could also be because the children are overall closer in age than the adults.
Relatedly, is the phylogenetic distance between pairs of viruses associated with similarity in responses?
For 2023-circulating strains, across sera cohorts we observed a weak-to-moderate correlation between the strength of correlation between the neutralizing titers across all sera to pairs of viruses and the Hamming distances between virus pairs. For the same comparison with vaccine strains, we observed moderate correlations, but this must be caveated with the slightly larger range of Hamming distances between vaccine strains. Notably, many of the points on the negative correlation slope are a mix of egg- and cell-produced vaccine strains from similar years, but there are some strain comparisons where the same year’s egg- and cell-produced vaccine strains correlate poorly.
Figure 5C is also a really interesting result. To be able to predict growth rates based on titers in the sera is fascinating. As touched upon in the discussion, I suspect it is really dependent on the representativeness of the sera of the population (so, e.g., if only elderly individuals provided sera, it would be a different result than if only children provided samples). It may be interesting to compare different hypotheses - so e.g., see if a population-weighted titer is even better correlated with fitness - so the contribution from each individual's titer is linked to a number of individuals of that age in the population. Alternatively, maybe only the titers in younger individuals are most relevant to fitness, etc.
We’re very interested in these analyses, but suggest they may be better explored in subsequent works that could sample more children, teenagers and adults across age groups. Our sera set, as the reviewer suggests, may be under-powered to perform the proposed analysis on subsetted age groups of our larger age cohorts.
In Figure 6, the authors lump together individuals within 10-year age categories - however, this is potentially throwing away the nuances of what is happening at individual ages, especially for the children, where the measured viruses cross different groups. I realise the numbers are small and the viruses only come from a small numbers of years, however, it may be preferable to order all the individuals by age (y-axis) and the viral responses in ascending order (x-axis) and plot the response as a heatmap. As currently plotted, it is difficult to compare across panels
This is a good suggestion. In the revised manuscript we have included a heatmap of the children and pre-vaccination adults, ordered by the year of birth of each individual, as Supplemental figure 8. That new figure is also pasted in this response.
Reviewer #3 (Public review):
The authors use high-throughput neutralisation data to explore how different summary statistics for population immune responses relate to strain success, as measured by growth rate during the 2023 season. The question of how serological measurements relate to epidemic growth is an important one, and I thought the authors present a thoughtful analysis tackling this question, with some clear figures. In particular, they found that stratifying the population based on the magnitude of their antibody titres correlates more with strain growth than using measurements derived from pooled serum data. However, there are some areas where I thought the work could be more strongly motivated and linked together. In particular, how the vaccine responses in US and Australia in Figures 6-7 relate to the earlier analysis around growth rates, and what we would expect the relationship between growth rate and population immunity to be based on epidemic theory.
Thank you for this nice summary. This reviewer also notes that the text related to figures 6 and 7 are more secondary to the main story presented in figures 3-5. The main motivation for including figures 6 and 7 were to demonstrate the wide-ranging applications of sequencing-based neutralization data. We have tried to clarify this with the following minor text revisions, which do not add new content but we hope smooth the transition between results sections.
While the preceding analyses demonstrated the utility of sequencing-based neutralization assays for measuring titers of currently circulating strains, our library also included viruses with HAs from each of the H3N2 influenza Northern Hemisphere vaccine strains from the last decade (2014 to 2024, see Supplemental Table 1). These historical vaccine strains cover a much wider span of evolutionary diversity that the 2023-circulating strains analyzed in the preceding sections (Figure 2a,b and Supplemental Figure 2b-e). For this analysis, we focused on the cell-passaged strains for each vaccine, as these are more antigenically similar to their contemporary circulating strains than the egg-passaged vaccine strains since they lack the mutations that arise during growth of viruses in eggs [55–57] (Supplemental Table 1).
Our sequencing-based assay could also be used to assess the impact of vaccination on neutralization titers against the full set of strains in our H3N2 library. To do this, we analyzed matched 28-day post-vaccination samples for each of the above-described 39 pre-vaccination samples from the cohort of adults based in the USA (Table 1). We also analyzed a smaller set of matched pre- and post-vaccination sera samples from a cohort of eight adults based in Australia (Table 1). Note that there are several differences between these cohorts: the USA-based cohort received the 2023-2024 Northern Hemisphere egg-grown vaccine whereas the Australia-based cohort received the 2024 Southern Hemisphere cell-grown vaccine, and most individuals in the USA-based cohort had also been vaccinated in the prior season whereas most individuals in the Australia-based cohort had not. Therefore, multiple factors could contribute to observed differences in vaccine response between the cohorts.
Reviewer #3 (Recommendations for the authors):
Main comments:
(1) The authors compare titres of the pooled sera with the median titres across individual sera, finding a weak correlation (Figure 4). I was therefore interested in the finding that geometric mean titre and median across a study population are well correlated with growth rate (Supplemental Figure 6c). It would be useful to have some more discussion on why estimates from a pool are so much worse than pooled estimates.
We thank this reviewer for this point. We would clarify that pooling sera is the equivalent of taking the arithmetic mean of the individual sera, rather than the geometric mean or median, which tends to bias the measurements of the pool to the outliers within the pool. To address this reviewer’s point, we’ve added the following text to the manuscript:
“To confirm that sera pools are not reflective of the full heterogeneity of their constituent sera, we created equal volume pools of the children and adult sera and measured the titers of these pools using the sequencing-based neutralization assay. As expected, neutralization titers of the pooled sera were always higher than the median across the individual constituent sera, and the pool titers against different viral strains were only modestly correlated with the median titers across individual sera (Figure 4). The differences in titers across strains were also compressed in the serum pools relative to the median across individual sera (Figure 4). The failure of the serum pools to capture the median titers of all the individual sera is especially dramatic for the children sera (Figure 4) because these sera are so heterogeneous in their individual titers (Figure 3b). Taken together, these results show that serum pools do not fully represent individual-level heterogeneity, and are similar to taking the arithmetic mean of the titers for a pool of individuals, which tends to be biased by the highest titer sera”.
(2) Perhaps I missed it, but are growth rates weekly growth rates? (I assume so?)
The growth rates are relative exponential growth rates calculated assuming a serial interval of 3.6 days. We also added clarifying language and a citation for the serial growth interval to the methods section:
The analysis performing H3 HA strain growth rate estimates using the evofr[51] package is at https://github.com/jbloomlab/flu_H3_2023_seqneut_vs_growth. Briefly, we sought to make growth rate estimates for the strains in 2023 since this was the same timeframe when the sera were collected. To achieve this, we downloaded all publicly-available H3N2 sequences from the GISAID[88] EpiFlu database, filtering to only those sequences that closely matched a library HA1 sequence (within one HA1 amino-acid mutation) and were collected between January 2023 and December 2023. If a sequence was within one HA1 amino-acid mutation of multiple library HA1 proteins then it was assigned to the closest one; if there were multiple equally close matches then it was assigned fractionally to each match. We only made growth rate estimates for library strains with at least 80 sequencing counts (Supplemental Figure 9a), and ignored counts for sequences that did not match a library strain (equivalent results were obtained if we instead fit a growth rate for these sequences as an “other” category). We then fit multinomial logistic regression models using the evofr[51] package assuming a serial interval of 3.6 days[101] to the strain counts. For the plot in Figure 5a the frequencies are averaged over a 14-day sliding window for visual clarity, but the fits were to the raw sequencing counts. For most of the analyses in this paper we used models based on requiring 80 sequencing counts to make an estimate for strain growth rates, and counting a sequence as a match if it was within one amino-acid mutation; see https://jbloomlab.github.io/flu_H3_2023_seqneut_vs_growth/ for comparable analyses using different reasonable sequence count cutoffs (e.g., 60, 50, 40 and 30, as depicted in Supplemental Figure 9). Across sequence cutoffs, we found that the fraction of individuals with low neutralization titers and number of HA1 mutations correlated strongly with these MLR-estimated strain growth rates.
(3) I found Figure 3 useful in that it presents phylogenetic structure alongside titres, to make it clearer why certain clusters of strains have a lower response. In contrast, I found it harder to meaningfully interpret Figure 7a beyond the conclusion that vaccines lead to a fairly uniform rise in titre. Do the 275 or 276 mutations that seem important for adults in Figure 3 have any impact?
We are certainly interested in the questions this reviewer raises, and in trying to understand how well a seasonal vaccine protects against the most successful influenza variants that season. However, these post-vaccination sera were taken when neutralizing titers peak ~30 days after vaccination. Because of this, in the larger cohort of US-based post-vaccination adults, the median titers across sera to most strains appear uniformly high. In the Australian-based post-vaccination adults, there was some strain-to-strain variation in median titers across sera, but of course this must be caveated with the much smaller sample size. It might be more relevant to answer this question with longitudinally sampled sera, when titers begin to wane in the following months.
(4) It could be useful to define a mechanistic relationship about how you would expect susceptibility (e.g. fraction with titre < X, where X is a good correlate) to relate to growth via the reproduction number: R = R0 x S. For example, under the assumption the generation interval G is the same for all, we have R = exp(r*G), which would make it possible to make a prediction about how much we would expect the growth rate to change between S = 0.45 and 0.6, as in Fig 5c. This sort of brief calculation (or at least some discussion) could add some more theoretical underpinning to the analysis, and help others build on the work in settings with different fractions with low titres. It would also provide some intuition into whether we would expect relationships to be linear.
This is an interesting idea for future work! However, the scope of our current study is to provide these experimental data and show a correlation with growth; we hope this can be used to build more mechanistic models in future.
(5) A key conclusion from the analysis is that the fraction above a threshold of ~140 is particularly informative for growth rate prediction, so would it be worth including this in Figure 6-7 to give a clearer indication of how much vaccination reduces contribution to strain growth among those who are vaccinated? This could also help link these figures more clearly with the main analysis and question.
Although our data do find ~140 to be the threshold that gives max correlation with growth rate, we are not comfortable strongly concluding 140 is a correlate of protection, as titers could influence viral fitness without completely protecting against infection. In addition, inspection of Figure 5d shows that while ~140 does give the maximal correlation, a good correlation is observed for most cutoffs in the range from ~40 to 200, so we are not sure how robustly we can be sure that ~140 is the optimal threshold.
(6) In Figure 5, the caption doesn't seem to include a description for (e).
Thank you to the reviewer for catching this – this is fixed now.
(7) The US vs Australia comparison could have benefited from more motivation. The authors conclude ,"Due to the multiple differences between cohorts we are unable to confidently ascribe a cause to these differences in magnitude of vaccine response" - given the small sample sizes, what hypotheses could have been tested with these data? The comparison isn't covered in the Discussion, so it seems a bit tangential currently.
Thank you to the reviewer for this comment, but we should clarify our aim was not to directly compare US and Australian adults. We are interested in regional comparisons between serum cohorts, but did not have the numbers to adequately address those questions here. This section (and the preceding question) were indeed both intended to be tangential to the main finding, and hopefully this will be clarified with our text additions in response to Reviewer #3’s public reviews.
-
-
eLife Assessment
This important study advances our understanding of population-level immune responses to influenza in both children and adults. The strength of the evidence supporting the conclusions is compelling, with high-throughput profiling assays and mathematical modeling. The work will be of interest to immunologists, virologists, vaccine developers, and those working on mathematical modeling of infectious diseases.
-
Reviewer #1 (Public review):
The authors present exciting new experimental data on the antigenic recognition of 78 H3N2 strains (from the beginning of the 2023 Northern Hemisphere season) against a set of 150 serum samples. The authors compare protection profiles of individual sera and find that the antigenic effect of amino acid substitutions at specific sites depends on the immune class of the sera, differentiating between children and adults. Person-to-person heterogeneity in the measured titers is strong, specifically in the group of children's sera. The authors find that the fraction of sera with low titers correlates with the inferred growth rate using maximum likelihood regression (MLR), a correlation that does not hold for pooled sera. The authors then measure the protection profile of the sera against historical vaccine strains …
Reviewer #1 (Public review):
The authors present exciting new experimental data on the antigenic recognition of 78 H3N2 strains (from the beginning of the 2023 Northern Hemisphere season) against a set of 150 serum samples. The authors compare protection profiles of individual sera and find that the antigenic effect of amino acid substitutions at specific sites depends on the immune class of the sera, differentiating between children and adults. Person-to-person heterogeneity in the measured titers is strong, specifically in the group of children's sera. The authors find that the fraction of sera with low titers correlates with the inferred growth rate using maximum likelihood regression (MLR), a correlation that does not hold for pooled sera. The authors then measure the protection profile of the sera against historical vaccine strains and find that it can be explained by birth cohort for children. Finally, the authors present data comparing pre- and post- vaccination protection profiles for 39 (USA) and 8 (Australia) adults. The data shows a cohort-specific vaccination effect as measured by the average titer increase, and also a virus-specific vaccination effect for the historical vaccine strains. The generated data is shared by the authors and they also note that these methods can be applied to inform the bi-annual vaccine composition meetings, which could be highly valuable.
The following points could be addressed in a revision:
(1) The authors conclude that much of the person-to-person and strain-to-strain variation seems idiosyncratic to individual sera rather than age groups. This point is not yet fully convincing. While the mean titer of an individual may be idiosyncratic to the individual sera, the strain-to-strain variation still reveals some patterns that are consistent across individuals (the authors note the effects of substitutions at sites 145 and 275/276). A more detailed analysis, removing the individual-specific mean titer, could still show shared patterns in groups of individuals that are not necessarily defined by the birth cohort.
(2) The authors show that the fraction of sera with a titer below 138 correlates strongly with the inferred growth rate using MLR. However, the authors also note that there exists a strong correlation between the MLR growth rate and the number of HA1 mutations. This analysis does not yet show that the titers provide substantially more information about the evolutionary success. The actual relation between the measured titers and fitness is certainly more subtle than suggested by the correlation plot in Figure 5. For example, the clades A/Massachusetts and A/Sydney both have a positive fitness at the beginning of 2023, but A/Massachusetts has substantially higher relative fitness than A/Sydney. The growth inference in Figure 5b does not appear to map that difference, and the antigenic data would give the opposite ranking. Similarly, the clades A/Massachusetts and A/Ontario have both positive relative fitness, as correctly identified by the antigenic ranking, but at quite different times (i.e., in different contexts of competing clades). Other clades, like A/St. Petersburg are assigned high growth and high escape but remain at low frequency throughout. Some mention of these effects not mapped by the analysis may be appropriate.
(3) For the protection profile against the vaccine strains, the authors find for the adult cohort that the highest titer is always against the oldest vaccine strain tested, which is A/Texas/50/2012. However, the adult sera do not show an increase in titer towards older strains, but only a peak at A/Texas. Therefore, it could be that this is a virus-specific effect, rather than a property of the protection profile. Could the authors test with one older vaccine virus (A/Perth/16/2009?) whether this really can be a general property?
-
Reviewer #2 (Public review):
This is an excellent paper. The ability to measure the immune response to multiple viruses in parallel is a major advancement for the field, which will be relevant across pathogens (assuming the assay can be appropriately adapted). I only have a few comments, focused on maximising the information provided by the sera.
Firstly, one of the major findings is that there is wide heterogeneity in responses across individuals. However, we could expect that individuals' responses should be at least correlated across the viruses considered, especially when individuals are of a similar age. It would be interesting to quantify the correlation in responses as a function of the difference in ages between pairs of individuals. I am also left wondering what the potential drivers of the differences in responses are, with …
Reviewer #2 (Public review):
This is an excellent paper. The ability to measure the immune response to multiple viruses in parallel is a major advancement for the field, which will be relevant across pathogens (assuming the assay can be appropriately adapted). I only have a few comments, focused on maximising the information provided by the sera.
Firstly, one of the major findings is that there is wide heterogeneity in responses across individuals. However, we could expect that individuals' responses should be at least correlated across the viruses considered, especially when individuals are of a similar age. It would be interesting to quantify the correlation in responses as a function of the difference in ages between pairs of individuals. I am also left wondering what the potential drivers of the differences in responses are, with age being presumably key. It would be interesting to explore individual factors associated with responses to specific viruses (beyond simply comparing adults versus children).
Relatedly, is the phylogenetic distance between pairs of viruses associated with similarity in responses?
Figure 5C is also a really interesting result. To be able to predict growth rates based on titers in the sera is fascinating. As touched upon in the discussion, I suspect it is really dependent on the representativeness of the sera of the population (so, e.g., if only elderly individuals provided sera, it would be a different result than if only children provided samples). It may be interesting to compare different hypotheses - so e.g., see if a population-weighted titer is even better correlated with fitness - so the contribution from each individual's titer is linked to a number of individuals of that age in the population. Alternatively, maybe only the titers in younger individuals are most relevant to fitness, etc.
In Figure 6, the authors lump together individuals within 10-year age categories - however, this is potentially throwing away the nuances of what is happening at individual ages, especially for the children, where the measured viruses cross different groups. I realise the numbers are small and the viruses only come from a small numbers of years, however, it may be preferable to order all the individuals by age (y-axis) and the viral responses in ascending order (x-axis) and plot the response as a heatmap. As currently plotted, it is difficult to compare across panels
-
Reviewer #3 (Public review):
The authors use high-throughput neutralisation data to explore how different summary statistics for population immune responses relate to strain success, as measured by growth rate during the 2023 season. The question of how serological measurements relate to epidemic growth is an important one, and I thought the authors present a thoughtful analysis tackling this question, with some clear figures. In particular, they found that stratifying the population based on the magnitude of their antibody titres correlates more with strain growth than using measurements derived from pooled serum data. However, there are some areas where I thought the work could be more strongly motivated and linked together. In particular, how the vaccine responses in US and Australia in Figures 6-7 relate to the earlier analysis …
Reviewer #3 (Public review):
The authors use high-throughput neutralisation data to explore how different summary statistics for population immune responses relate to strain success, as measured by growth rate during the 2023 season. The question of how serological measurements relate to epidemic growth is an important one, and I thought the authors present a thoughtful analysis tackling this question, with some clear figures. In particular, they found that stratifying the population based on the magnitude of their antibody titres correlates more with strain growth than using measurements derived from pooled serum data. However, there are some areas where I thought the work could be more strongly motivated and linked together. In particular, how the vaccine responses in US and Australia in Figures 6-7 relate to the earlier analysis around growth rates, and what we would expect the relationship between growth rate and population immunity to be based on epidemic theory.
-
Author response:
Public Reviews:
Reviewer #1 (Public review):
The authors present exciting new experimental data on the antigenic recognition of 78 H3N2 strains (from the beginning of the 2023 Northern Hemisphere season) against a set of 150 serum samples. The authors compare protection profiles of individual sera and find that the antigenic effect of amino acid substitutions at specific sites depends on the immune class of the sera, differentiating between children and adults. Person-to-person heterogeneity in the measured titers is strong, specifically in the group of children's sera. The authors find that the fraction of sera with low titers correlates with the inferred growth rate using maximum likelihood regression (MLR), a correlation that does not hold for pooled sera. The authors then measure the protection profile of the sera …
Author response:
Public Reviews:
Reviewer #1 (Public review):
The authors present exciting new experimental data on the antigenic recognition of 78 H3N2 strains (from the beginning of the 2023 Northern Hemisphere season) against a set of 150 serum samples. The authors compare protection profiles of individual sera and find that the antigenic effect of amino acid substitutions at specific sites depends on the immune class of the sera, differentiating between children and adults. Person-to-person heterogeneity in the measured titers is strong, specifically in the group of children's sera. The authors find that the fraction of sera with low titers correlates with the inferred growth rate using maximum likelihood regression (MLR), a correlation that does not hold for pooled sera. The authors then measure the protection profile of the sera against historical vaccine strains and find that it can be explained by birth cohort for children. Finally, the authors present data comparing pre- and post- vaccination protection profiles for 39 (USA) and 8 (Australia) adults. The data shows a cohort-specific vaccination effect as measured by the average titer increase, and also a virus-specific vaccination effect for the historical vaccine strains. The generated data is shared by the authors and they also note that these methods can be applied to inform the bi-annual vaccine composition meetings, which could be highly valuable.
Thanks for this nice summary of our paper.
The following points could be addressed in a revision:
(1) The authors conclude that much of the person-to-person and strain-to-strain variation seems idiosyncratic to individual sera rather than age groups. This point is not yet fully convincing. While the mean titer of an individual may be idiosyncratic to the individual sera, the strain-to-strain variation still reveals some patterns that are consistent across individuals (the authors note the effects of substitutions at sites 145 and 275/276). A more detailed analysis, removing the individual-specific mean titer, could still show shared patterns in groups of individuals that are not necessarily defined by the birth cohort.
As the reviewer suggests, we normalized the titers for all sera to the geometric mean titer for each individual in the US-based pre-vaccination adults and children. This is only for the 2023-circulating viral strains. We then faceted these normalized titers by the same age groups we used in Figure 6, and the resulting plot is shown below. Although there are differences among virus strains (some are better neutralized than others), there are not obvious age group-specific patterns (eg, the trends in the two facets are similar). To us this suggests that at least for these relatively closely related recent H3N2 strains, the strain-to-strain variation does not obviously segregate by age group. Obviously, it is possible (we think likely) that there would be more obvious age-group specific trends if we looked at a larger swath of viral strains covering a longer time range (eg, over decades of influenza evolution). We plan to add the new plots shown below to a supplemental figure in the revised manuscript.
Author response image 1.
Author response image 2.
(2) The authors show that the fraction of sera with a titer below 138 correlates strongly with the inferred growth rate using MLR. However, the authors also note that there exists a strong correlation between the MLR growth rate and the number of HA1 mutations. This analysis does not yet show that the titers provide substantially more information about the evolutionary success. The actual relation between the measured titers and fitness is certainly more subtle than suggested by the correlation plot in Figure 5. For example, the clades A/Massachusetts and A/Sydney both have a positive fitness at the beginning of 2023, but A/Massachusetts has substantially higher relative fitness than A/Sydney. The growth inference in Figure 5b does not appear to map that difference, and the antigenic data would give the opposite ranking. Similarly, the clades A/Massachusetts and A/Ontario have both positive relative fitness, as correctly identified by the antigenic ranking, but at quite different times (i.e., in different contexts of competing clades). Other clades, like A/St. Petersburg are assigned high growth and high escape but remain at low frequency throughout. Some mention of these effects not mapped by the analysis may be appropriate.
Thanks for the nice summary of our findings in Figure 5. However, the reviewer is misreading the growth charts when they say that A/Massachusetts/18/2022 has a substantially higher fitness than A/Sydney/332/2023. Figure 5a shows the frequency trajectory of different variants over time. While A/Massachusetts/18/2022 reaches a higher frequency than A/Sydney/332/2023, the trajectory is similar and the reason that A/Massachusetts/18/2022 reached a higher max frequency is that it started at a higher frequency at the beginning of 2023. The MLR growth rate estimates differ from the maximum absolute frequency reached: instead, they reflect how rapidly each strain grows relative to others. In fact, A/Massachusetts/18/2022 and A/Sydney/332/2023 have similar growth rates, as shown in Supplementary Figure 6b. Similarly, A/Saint-Petersburg/RII-166/2023 starts at a low initial frequency but then grows even as A/Massachusetts/18/2022 and A/Sydney/332/2023 are declining, and so has a higher growth rate than both of those. In the revised manuscript, we will clarify how viral growth rates are estimated from frequency trajectories, and how growth rate differs from max frequency.
(3) For the protection profile against the vaccine strains, the authors find for the adult cohort that the highest titer is always against the oldest vaccine strain tested, which is A/Texas/50/2012. However, the adult sera do not show an increase in titer towards older strains, but only a peak at A/Texas. Therefore, it could be that this is a virus-specific effect, rather than a property of the protection profile. Could the authors test with one older vaccine virus (A/Perth/16/2009?) whether this really can be a general property?
We are interested in studying immune imprinting more thoroughly using sequencing-based neutralization assays, but we note that the adults in the cohorts we studied would have been imprinted with much older strains than included in this library. As this paper focuses on the relative fitness of contemporary strains with minor secondary points regarding imprinting, these experiments are beyond the scope of this study. We’re excited for future work (from our group or others) to explore these points by making a new virus library with strains from multiple decades of influenza evolution.
Reviewer #2 (Public review):
This is an excellent paper. The ability to measure the immune response to multiple viruses in parallel is a major advancement for the field, which will be relevant across pathogens (assuming the assay can be appropriately adapted). I only have a few comments, focused on maximising the information provided by the sera.
Thanks very much!
Firstly, one of the major findings is that there is wide heterogeneity in responses across individuals. However, we could expect that individuals' responses should be at least correlated across the viruses considered, especially when individuals are of a similar age. It would be interesting to quantify the correlation in responses as a function of the difference in ages between pairs of individuals. I am also left wondering what the potential drivers of the differences in responses are, with age being presumably key. It would be interesting to explore individual factors associated with responses to specific viruses (beyond simply comparing adults versus children).
We’re excited by this idea! We plan to include these analyses in our revised pre-print.
Relatedly, is the phylogenetic distance between pairs of viruses associated with similarity in responses?
As above, we like this idea and our revised pre-print will include this analysis.
Figure 5C is also a really interesting result. To be able to predict growth rates based on titers in the sera is fascinating. As touched upon in the discussion, I suspect it is really dependent on the representativeness of the sera of the population (so, e.g., if only elderly individuals provided sera, it would be a different result than if only children provided samples). It may be interesting to compare different hypotheses - so e.g., see if a population-weighted titer is even better correlated with fitness - so the contribution from each individual's titer is linked to a number of individuals of that age in the population. Alternatively, maybe only the titers in younger individuals are most relevant to fitness, etc.
We’re very interested in these analyses, but suggest they may be better explored in subsequent works that could sample more children, teenagers and adults across age groups. Our sera set, as the reviewer suggests, may be under-powered to perform the proposed analysis on subsetted age groups of our larger age cohorts.
In Figure 6, the authors lump together individuals within 10-year age categories - however, this is potentially throwing away the nuances of what is happening at individual ages, especially for the children, where the measured viruses cross different groups. I realise the numbers are small and the viruses only come from a small numbers of years, however, it may be preferable to order all the individuals by age (y-axis) and the viral responses in ascending order (x-axis) and plot the response as a heatmap. As currently plotted, it is difficult to compare across panels
This is a good suggestion, and a revised pre-print will include heatmaps of the different cohorts, ordered by ages of individuals.
Reviewer #3 (Public review):
The authors use high-throughput neutralisation data to explore how different summary statistics for population immune responses relate to strain success, as measured by growth rate during the 2023 season. The question of how serological measurements relate to epidemic growth is an important one, and I thought the authors present a thoughtful analysis tackling this question, with some clear figures. In particular, they found that stratifying the population based on the magnitude of their antibody titres correlates more with strain growth than using measurements derived from pooled serum data. However, there are some areas where I thought the work could be more strongly motivated and linked together. In particular, how the vaccine responses in US and Australia in Figures 6-7 relate to the earlier analysis around growth rates, and what we would expect the relationship between growth rate and population immunity to be based on epidemic theory.
Thank you for this nice summary. This reviewer also notes that the text related to figures 6 and 7 are more secondary to the main story presented in figures 3-5. The main motivation for including figures 6 and 7 were to demonstrate the wide-ranging applications of sequencing-based neutralization data, and this can certainly be clarified in minor text revisions.
-
