Nanophysiology approach reveals diversity in calcium microdomains across zebrafish retinal bipolar ribbon synapses
Curation statements for this article:-
Curated by eLife

eLife Assessment
The study introduces new tools for measuring the intracellular calcium concentration close to transmitter release sites, which may be relevant for synaptic vesicle fusion and replenishment. This approach yields important new information about the spatial and temporal profile of calcium concentrations near the site of entry at the plasma membrane. This experimental work is complemented by a coherent, open-source, computational model that successfully describes changes in calcium domains. The conclusions are solid and well supported by the data.
This article has been Reviewed by the following groups
Discuss this preprint
Start a discussion What are Sciety discussions?Listed in
- Evaluated articles (eLife)
Abstract
Rapid and high local calcium (Ca 2+ ) signals are essential for triggering neurotransmitter release from presynaptic terminals. In specialized bipolar ribbon synapses of the retina, these local Ca 2+ signals control multiple processes, including the priming, docking, and translocation of vesicles on the ribbon before exocytosis, endocytosis, and the replenishment of release-ready vesicles to the fusion sites for sustained neurotransmission. However, our knowledge about Ca 2+ signals along the axis of the ribbon active zone is limited. Here, we used fast confocal quantitative dual-color ratiometric line-scan imaging of a fluorescently labeled ribbon binding peptide and Ca 2+ indicators to monitor the spatial and temporal aspects of Ca 2+ transients of individual ribbon active zones in zebrafish retinal rod bipolar cells (RBCs). We observed that a Ca 2+ transient elicited a much greater fluorescence amplitude when the Ca 2+ indicator was conjugated to a ribeye-binding peptide than when using a soluble Ca 2+ indicator, and the estimated Ca 2+ levels at the ribbon active zone exceeded 26 μM in response to a 10 millisecond stimulus, as measured by a ribbon-bound low-affinity Ca 2+ indicator. Our quantitative modeling of Ca 2+ diffusion and buffering is consistent with this estimate and provides a detailed view of the spatiotemporal [Ca 2+ ] dynamics near the ribbon. Importantly, our data demonstrates that the local Ca 2+ levels may vary between ribbons of different RBCs and within the same cells. The variation in local Ca 2+ signals is found to correlate with ribbon size and active zone extent. Our serial electron microscopy results provide new information about the heterogeneity in ribbon size, shape, and area of the ribbon in contact with the plasma membrane.
Article activity feed
-

-
-
-

eLife Assessment
The study introduces new tools for measuring the intracellular calcium concentration close to transmitter release sites, which may be relevant for synaptic vesicle fusion and replenishment. This approach yields important new information about the spatial and temporal profile of calcium concentrations near the site of entry at the plasma membrane. This experimental work is complemented by a coherent, open-source, computational model that successfully describes changes in calcium domains. The conclusions are solid and well supported by the data.
-
Reviewer #1 (Public Review):
This paper describes technically impressive measurements of calcium signals near synaptic ribbons in zebrafish bipolar cells. The data presented provides high spatial and temporal resolution information about calcium concentrations along the ribbon at various distances from the site of entry at the plasma membrane. This is important information. The experiments appear to be well-done and provide strong evidence for the main conclusions reached.
Strengths
The technical aspects of the measurements are impressive. The authors use calcium indicators bound to the ribbon and high-speed line scans to resolve changes with a spatial resolution of ~250 nm and temporal resolution of less than 10 ms. These spatial and temporal scales are much closer to those relevant for vesicle release than previous measurements. Hence …
Reviewer #1 (Public Review):
This paper describes technically impressive measurements of calcium signals near synaptic ribbons in zebrafish bipolar cells. The data presented provides high spatial and temporal resolution information about calcium concentrations along the ribbon at various distances from the site of entry at the plasma membrane. This is important information. The experiments appear to be well-done and provide strong evidence for the main conclusions reached.
Strengths
The technical aspects of the measurements are impressive. The authors use calcium indicators bound to the ribbon and high-speed line scans to resolve changes with a spatial resolution of ~250 nm and temporal resolution of less than 10 ms. These spatial and temporal scales are much closer to those relevant for vesicle release than previous measurements. Hence the results provide a unique window onto these events.
The use of calcium indicators with very different affinities and of different intracellular calcium buffers helps provide confirmation of key results.
-
Reviewer #2 (Public review):
Summary:
The study introduces new tools for measuring intracellular Ca2+ concentration gradients around retinal rod bipolar cell (rbc) synaptic ribbons. This is done by comparing the Ca2+ profiles measured with mobile Ca2+ indicator dyes versus ribbon-tethered (immobile) Ca2+ indicator dyes. The Ca2+ imaging results provide a straightforward demonstration of Ca2+ gradients around the ribbon and validate their experimental strategy. This experimental work is complemented by a coherent, open-source, computational model that successfully describes changes in Ca2+ domains as a function of Ca2+ buffering. In addition, the authors try to demonstrate that there is heterogeneity among synaptic ribbons within an individual rbc terminal.
Strengths:
The study introduces a new set of tools for estimating Ca2+ …
Reviewer #2 (Public review):
Summary:
The study introduces new tools for measuring intracellular Ca2+ concentration gradients around retinal rod bipolar cell (rbc) synaptic ribbons. This is done by comparing the Ca2+ profiles measured with mobile Ca2+ indicator dyes versus ribbon-tethered (immobile) Ca2+ indicator dyes. The Ca2+ imaging results provide a straightforward demonstration of Ca2+ gradients around the ribbon and validate their experimental strategy. This experimental work is complemented by a coherent, open-source, computational model that successfully describes changes in Ca2+ domains as a function of Ca2+ buffering. In addition, the authors try to demonstrate that there is heterogeneity among synaptic ribbons within an individual rbc terminal.
Strengths:
The study introduces a new set of tools for estimating Ca2+ concentration gradients at ribbon AZs, and the experimental results are accompanied by an open-source, computational model that nicely describes Ca2+ buffering at the rbc synaptic ribbon. In addition, the dissociated retinal preparation remains a valuable approach for studying ribbon synapses. Lastly, excellent EM.
Comments on revisions:
Several concerns were raised about the kinetic analyses, and the authors have carefully acknowledged the critiques. The ideal outcome would have been a more complete kinetic readout and analyses (in particular a better readout of risetime would have improved the results). In the absence of a suitable readout of the risetime, the authors scaled back their claims and improved on the description of the falling phase of the signals. The authors have given a reasonable response under the circumstances.
In addition, the authors provided more context to their results.
I have no further concerns.
-
Reviewer #3 (Public review):
Summary:
In this study, the authors have developed a new Ca indicator conjugated to the peptide, which likely recognizes synaptic ribbons and have measured microdomain Ca near synaptic ribbons at retinal bipolar cells. This interesting approach allows one to measure Ca close to transmitter release sites, which may be relevant for synaptic vesicle fusion and replenishment. Though microdomain Ca at the active zone of ribbon synapses has been measured by Hudspeth and Moser, the new study uses the peptide recognizing synaptic ribbons, potentially measuring the Ca concentration relatively proximal to the release sites.
Strengths:
The study is, in principle, technically well done, and the peptide approach is technically interesting, which allows one to image Ca near the particular protein complexes. The approach …
Reviewer #3 (Public review):
Summary:
In this study, the authors have developed a new Ca indicator conjugated to the peptide, which likely recognizes synaptic ribbons and have measured microdomain Ca near synaptic ribbons at retinal bipolar cells. This interesting approach allows one to measure Ca close to transmitter release sites, which may be relevant for synaptic vesicle fusion and replenishment. Though microdomain Ca at the active zone of ribbon synapses has been measured by Hudspeth and Moser, the new study uses the peptide recognizing synaptic ribbons, potentially measuring the Ca concentration relatively proximal to the release sites.
Strengths:
The study is, in principle, technically well done, and the peptide approach is technically interesting, which allows one to image Ca near the particular protein complexes. The approach is potentially applicable to other types of imaging.
Weaknesses:
Peptides may not be entirely specific, and genetic approach tagging particular active zone proteins with fluorescent Ca indicator proteins may well be more specific. The readers should be aware of this, when interpreting the results.
-
Author response:
The following is the authors’ response to the previous reviews
Reviewer #1 (Public review):
This paper describes technically-impressive measurements of calcium signals near synaptic ribbons in goldfish bipolar cells. The data presented provides high spatial and temporal resolution information about calcium concentrations along the ribbon at various distances from the site of entry at the plasma membrane. This is important information. Important gaps in the data presented mean that the evidence for the main conclusions is currently inadequate.
Strengths
The technical aspects of the measurements are impressive. The authors use calcium indicators bound to the ribbon and high speed line scans to resolve changes with a spatial resolution of ~250 nm and temporal resolution of less than 10 ms. These spatial and temporal …
Author response:
The following is the authors’ response to the previous reviews
Reviewer #1 (Public review):
This paper describes technically-impressive measurements of calcium signals near synaptic ribbons in goldfish bipolar cells. The data presented provides high spatial and temporal resolution information about calcium concentrations along the ribbon at various distances from the site of entry at the plasma membrane. This is important information. Important gaps in the data presented mean that the evidence for the main conclusions is currently inadequate.
Strengths
The technical aspects of the measurements are impressive. The authors use calcium indicators bound to the ribbon and high speed line scans to resolve changes with a spatial resolution of ~250 nm and temporal resolution of less than 10 ms. These spatial and temporal scales are much closer to those relevant for vesicle release than previous measurements.
The use of calcium indicators with very different affinities and of different intracellular calcium buffers helps provide confirmation of key results.
Thank you very much for this positive evaluation of our work.
Weaknesses
Multiple key points of the paper lack a statistical test or summary data from populations of cells. For example, the text states that the proximal and distal calcium kinetics in Figure 2A differ. This is not clear from the inset to Figure 2A - where the traces look like scaled versions of each other. Values for time to half-maximal peak fluorescence are given for one example cell but no statistics or summary are provided. Figure 8 shows examples from one cell with no summary data. This issue comes up in other places as well.
Thank you for this fair and valuable feedback. Following also the suggestion by the Editor, we have now removed the rise-time kinetic fitting results from the manuscript and only retain the bi-exponential decay time constant values. Further, we explicitly detail the issues with kinetic fitting, and state that the precise quantitative conclusions should not be drawn from the differences in kinetic parameters (pages 7 and 2728).
We have included the results of paired-t-tests to compare the amplitudes of proximal vs. distal calcium signals shown in Fig. 2A & B, Fig. 3C & D, Fig. 4C & D, Fig. 5A-D, and Fig. 8E&F. Because proximal and distal calcium signals were obtained from the same ribbons within 500-nm distances, as the Reviewer pointed out, “the traces look like scaled versions of each other”. For experiments where we make comparisons across cells or different calcium indicators, as shown in Fig. 3E & F, Fig.5E, and Fig. 8B&C, we have included the results of an unpaired t-test. We have also included the t-test statistics information in the respective figure legends in the revised version.
In Figure 8, we have shown example fluorescence traces from two different cells at the bottom of the A panel, and example traces from different ribbons of RBC a in the D, and the summary data is described in B-C and E-F, with statistics provided in the figure legends.
The rise time measurements in Figure 2 are very different for low and high affinity indicators, but no explanation is given for this difference. Similarly, the measurements of peak calcium concentration in Figure 4 are very different with the two indicators. That might suggest that the high affinity indicator is strongly saturated, which raises concerns about whether that is impacting the kinetic measurements.
Yes, we do believe that the high-affinity indicator is partially saturated, and therefore, the measurement with the low-affinity indicator dye is a more accurate reflection of the measured Ca2+ signal. We now state this more explicitly in the text. Further, we note that the rise time values are no longer listed due to lack of statistical significance for such comparisons, as noted above.
Reviewer #2 (Public review):
Summary:
The study introduces new tools for measuring intracellular Ca2+ concentration gradients around retinal rod bipolar cell (rbc) synaptic ribbons. This is done by comparing the Ca2+ profiles measured with mobile Ca2+ indicator dyes versus ribbon-tethered (immobile) Ca2+ indicator dyes. The Ca2+ imaging results provide a straightforward demonstration of Ca2+ gradients around the ribbon and validate their experimental strategy. This experimental work is complemented by a coherent, open-source, computational model that successfully describes changes in Ca2+ domains as a function of Ca2+ buffering. In addition, the authors try to demonstrate that there is heterogeneity among synaptic ribbons within an individual rbc terminal.
Strengths:
The study introduces a new set of tools for estimating Ca2+ concentration gradients at ribbon AZs, and the experimental results are accompanied by an open-source, computational model that nicely describes Ca2+ buffering at the rbc synaptic ribbon. In addition, the dissociated retinal preparation remains a valuable approach for studying ribbon synapses. Lastly, excellent EM.
Thank you very much for this positive evaluation of our work.
Comments on revisions:
Specific minor comments:
(1) Rewrite the final sentence of the Abstract. It is difficult to understand.
Thank you for pointing that out. We have updated the final sentence of the Abstract.
(2) Add a definition in the Introduction (and revisit in the Discussion) that delineates between micro- and nano-domain. A practical approach would be to round up and round down. If you round up from 0.6 um, then it is microdomain which means ~ 1 um or higher. Likewise, round down from 0.3 um to nanodomain? If you are using confocal, or even STED, the resolution for Ca imaging will be in the 100 to 300 nm range. The point of your study is that your new immobile Ca2-ribbon indicator may actually be operating on a tens of nm scale: nanophysiology. The Results are clearly written in a way that acknowledges this point but maybe make such a "definition" comment in the intro/discussion in order to: 1) demonstrate the power of the new Ca2+ indicator to resolve signals at the base of the ribbon (effectively nano), and 2) (Discussion) to acknowledge that some are achieving nanoscopic resolution (50 to 100nm?) with light microscopy (as you ref'd Neef et al., 2018 Nat Comm).
Thank you for the valuable comments. We have now provided this information in the introduction and discussion.
(3) Suggested reference: Grabner et al. 2022 (Sci Adv, Supp video 13, and Fig S5). Here rod Cav channels are shown to be expressed on both sides the ribbon, at its base, and they are within nanometers from other AZ proteins. This agrees with the conclusions from your imaging work.
Thank you for the valuable suggestion. We have now provided this information in the introduction and discussion.
(4) In the Discussion, add a little more context to what is known about synaptic transmission in the outer and inner retina.. First, state that the postsynaptic receptors (for example: mGluR6-OnBCs vs KARs-OffBCs, vs. AMPAR-HCs), and possibly the synaptic cleft (ground squirrel), are known to have a significant impact on signaling in the outer retina. In the inner retina, there are many more unknowns. For example, when I think of the pioneering Palmer JPhysio study, which you sight, I think of NMDAR vs AMPAR, and uncertainty in what type postsynaptic cell was patched (GC or AC....). Once you have informed the reader that the postsynapse is known to have a significant impact on signaling, then promote your experimental work that addresses presynaptic processes: "...the new tool and results allow us to explore release heterogeneity, ribbon by ribbon in dissociated preps, which we eventually plan to use at ribbon synapses within slices......to better understand how the presynapse shapes signaling......".
Thank you for the valuable comments. We have now provided this information in the introduction and discussion.
Reviewer #3 (Public review):
Summary:
In this study, the authors have developed a new Ca indicator conjugated to the peptide, which likely recognizes synaptic ribbons and have measured microdomain Ca near synaptic ribbons at retinal bipolar cells. This interesting approach allows one to measure Ca close to transmitter release sites, which may be relevant for synaptic vesicle fusion and replenishment. Though microdomain Ca at the active zone of ribbon synapses has been measured by Hudspeth and Moser, the new study uses the peptide recognizing synaptic ribbons, potentially measuring the Ca concentration relatively proximal to the release sites.
Strengths:
The study is, in principle, technically well done, and the peptide approach is technically interesting, which allows one to image Ca near the particular protein complexes. The approach is potentially applicable to other types of imaging.
Thank you very much for this appreciation.
Weaknesses:
Peptides may not be entirely specific, and genetic approach tagging particular active zone proteins with fluorescent Ca indicator proteins may well be more specific. Although the authors are aware of this and the peptide approach is generally used for ribbon synapses, the authors should be aware of this, when interpreting the results.
We acknowledge the reviewer’s point and believe the peptides and genetic approaches to measure local calcium signals have their merits, each with separate advantages and disadvantages.
Reviewer #1 (Recommendations for the authors):
The revisions helped with some concerns about the original paper, but some issues were not adequately addressed. I have left two primary concerns in my public review. To summarize those:
The difference in kinetics of proximal and distal locations is emphasized and quantified in the paper, but the quantification consists of a fit to the average responses. This does not give an idea of whether the difference observed is significant or not. Without an estimate of the error across measurements the difference in kinetic quoted is not interpretable.
Thank you for this feedback. Since the kinetics information is a minor part of the manuscript, we have followed the Editor’s advice to significantly tone down the comparison of kinetic fit parameters (completely removing the rise-time comparisons), in order to put more focus on the better-documented conclusions. We also note that we did establish statistical significance of the differences in fluorescence signal amplitudes.
Somewhat relatedly, the difference in amplitude and kinetics of the calcium signals measured with low and high affinity indicators is quite concerning. The authors added one sentence stating that the high affinity indicator might be saturated. This is not adequate. Should we distrust the measurements using the high affinity indicator? The differences between the results using the low and high affinity indicators is in some cases large - e.g. larger than the differences cited as a key result between distal and proximal locations. This issue needs to be dealt with directly in the paper.
Thank you for this feedback. Yes, the measurements from high-affinity indicators cannot report the Ca2+ as accurately as low-affinity indicators. However, the value of HA indicators is in their ability to detect lowamplitude signals that lower-affinity indicators may miss due to lower signal-to-noise resolution. We added a sentence on page 12 to further stress this point.
Related to the point about statistics, it is not clear how to related the horizontal lines in Figure 8 to the actual measurements. It is critical for the evaluation of the conclusions from that figure to understand what is plotted and what the error bars are on the plotted data.
We apologize for the earlier ambiguity in Fig. 8. In this figure, we first compare proximal (panel B) and distal (panel C) calcium signals across several RBCs, labeled RBC-a through RBC-d. Each RBC contains multiple ribbons, and for each cell, we present the average calcium signals from multiple ribbons using box plots in panels B and C. In these box plots, the horizontal lines represent the average calcium signal for each cell, while the size of the error bars reflects the variability in proximal and distal calcium signals among the ribbons within that RBC.
For example, RBC-a had five identifiable ribbons. In panels D–F, we use RBC-a to illustrate the variability in calcium signals across individual ribbons. Specifically, we distinguished proximal and distal calcium signals from five ribbons (ribbons 1–5) within RBC-a. When feasible, we acquired multiple x–t line scans at a single ribbon, shown now as individual data points, to assess variability in calcium signals recorded from the same ribbon.
The box plots in panels E and F display the average calcium signal (horizontal lines) for each ribbon, based on multiple recordings. These plots demonstrate considerable variability between ribbons of RBC-a. Importantly, the lack of or minimal error bars for repeated measurements at the same ribbon indicates that the proximal and distal calcium signals are consistent within a ribbon. These findings emphasize that the observed variability among ribbons and among cells reflects true biological heterogeneity in local calcium domains, rather than experimental noise.
-
-
eLife Assessment
The study introduces new tools for measuring the intracellular calcium concentration close to transmitter release sites, which may be relevant for synaptic vesicle fusion and replenishment. This approach yields important new information about the spatial and temporal profile of calcium concentrations near the site of entry at the plasma membrane. This experimental work is complemented by a coherent, open-source, computational model that successfully describes changes in calcium domains. Some of the conclusions are strongly supported by the data, but a few gaps in the data presented mean that the evidence for other conclusions is incomplete.
-
Reviewer #1 (Public review):
This paper describes technically-impressive measurements of calcium signals near synaptic ribbons in goldfish bipolar cells. The data presented provides high spatial and temporal resolution information about calcium concentrations along the ribbon at various distances from the site of entry at the plasma membrane. This is important information. Important gaps in the data presented mean that the evidence for the main conclusions is currently inadequate.
Strengths
• The technical aspects of the measurements are impressive. The authors use calcium indicators bound to the ribbon and high speed line scans to resolve changes with a spatial resolution of ~250 nm and temporal resolution of less than 10 ms. These spatial and temporal scales are much closer to those relevant for vesicle release than previous …
Reviewer #1 (Public review):
This paper describes technically-impressive measurements of calcium signals near synaptic ribbons in goldfish bipolar cells. The data presented provides high spatial and temporal resolution information about calcium concentrations along the ribbon at various distances from the site of entry at the plasma membrane. This is important information. Important gaps in the data presented mean that the evidence for the main conclusions is currently inadequate.
Strengths
• The technical aspects of the measurements are impressive. The authors use calcium indicators bound to the ribbon and high speed line scans to resolve changes with a spatial resolution of ~250 nm and temporal resolution of less than 10 ms. These spatial and temporal scales are much closer to those relevant for vesicle release than previous measurements.
• The use of calcium indicators with very different affinities and of different intracellular calcium buffers helps provide confirmation of key results.
Weaknesses
• Multiple key points of the paper lack a statistical test or summary data from populations of cells. For example, the text states that the proximal and distal calcium kinetics in Figure 2A differ. This is not clear from the inset to Figure 2A - where the traces look like scaled versions of each other. Values for time to half-maximal peak fluorescence are given for one example cell but no statistics or summary are provided. Figure 8 shows examples from one cell with no summary data. This issue comes up in other places as well.
• The rise time measurements in Figure 2 are very different for low and high affinity indicators, but no explanation is given for this difference. Similarly, the measurements of peak calcium concentration in Figure 4 are very different with the two indicators. That might suggest that the high affinity indicator is strongly saturated, which raises concerns about whether that is impacting the kinetic measurements.
-
Reviewer #2 (Public review):
Summary:
The study introduces new tools for measuring intracellular Ca2+ concentration gradients around retinal rod bipolar cell (rbc) synaptic ribbons. This is done by comparing the Ca2+ profiles measured with mobile Ca2+ indicator dyes versus ribbon-tethered (immobile) Ca2+ indicator dyes. The Ca2+ imaging results provide a straightforward demonstration of Ca2+ gradients around the ribbon and validate their experimental strategy. This experimental work is complemented by a coherent, open-source, computational model that successfully describes changes in Ca2+ domains as a function of Ca2+ buffering. In addition, the authors try to demonstrate that there is heterogeneity among synaptic ribbons within an individual rbc terminal.
Strengths:
The study introduces a new set of tools for estimating Ca2+ …
Reviewer #2 (Public review):
Summary:
The study introduces new tools for measuring intracellular Ca2+ concentration gradients around retinal rod bipolar cell (rbc) synaptic ribbons. This is done by comparing the Ca2+ profiles measured with mobile Ca2+ indicator dyes versus ribbon-tethered (immobile) Ca2+ indicator dyes. The Ca2+ imaging results provide a straightforward demonstration of Ca2+ gradients around the ribbon and validate their experimental strategy. This experimental work is complemented by a coherent, open-source, computational model that successfully describes changes in Ca2+ domains as a function of Ca2+ buffering. In addition, the authors try to demonstrate that there is heterogeneity among synaptic ribbons within an individual rbc terminal.
Strengths:
The study introduces a new set of tools for estimating Ca2+ concentration gradients at ribbon AZs, and the experimental results are accompanied by an open-source, computational model that nicely describes Ca2+ buffering at the rbc synaptic ribbon. In addition, the dissociated retinal preparation remains a valuable approach for studying ribbon synapses. Lastly, excellent EM.
Comments on revisions:
Specific minor comments:
(1) Rewrite the final sentence of the Abstract. It is difficult to understand.
(2) Add a definition in the Introduction (and revisit in the Discussion) that delineates between micro- and nano-domain. A practical approach would be to round up and round down. If you round up from 0.6 um, then it is microdomain which means ~ 1 um or higher. Likewise, round down from 0.3 um to nanodomain? If you are using confocal, or even STED, the resolution for Ca imaging will be in the 100 to 300 nm range. The point of your study is that your new immobile Ca2-ribbon indicator may actually be operating on a tens of nm scale: nanophysiology. The Results are clearly written in a way that acknowledges this point but maybe make such a "definition" comment in the intro/discussion in order to: 1) demonstrate the power of the new Ca2+ indicator to resolve signals at the base of the ribbon (effectively nano), and 2) (Discussion) to acknowledge that some are achieving nanoscopic resolution (50 to 100nm?) with light microscopy (as you ref'd Neef et al., 2018 Nat Comm).
(3) Suggested reference: Grabner et al. 2022 (Sci Adv, Supp video 13, and Fig S5). Here rod Cav channels are shown to be expressed on both sides the ribbon, at its base, and they are within nanometers from other AZ proteins. This agrees with the conclusions from your imaging work.
(4) In the Discussion, add a little more context to what is known about synaptic transmission in the outer and inner retina.. First, state that the postsynaptic receptors (for example: mGluR6-OnBCs vs KARs-Off-BCs, vs. AMPAR-HCs), and possibly the synaptic cleft (ground squirrel), are known to have a significant impact on signaling in the outer retina. In the inner retina, there are many more unknowns. For example, when I think of the pioneering Palmer JPhysio study, which you sight, I think of NMDAR vs AMPAR, and uncertainty in what type postsynaptic cell was patched (GC or AC....). Once you have informed the reader that the postsynapse is known to have a significant impact on signaling, then promote your experimental work that addresses presynaptic processes: "...the new tool and results allow us to explore release heterogeneity, ribbon by ribbon in dissociated preps, which we eventually plan to use at ribbon synapses within slices......to better understand how the presynapse shapes signaling......".
-
Reviewer #3 (Public review):
Summary:
In this study, the authors have developed a new Ca indicator conjugated to the peptide, which likely recognizes synaptic ribbons and have measured microdomain Ca near synaptic ribbons at retinal bipolar cells. This interesting approach allows one to measure Ca close to transmitter release sites, which may be relevant for synaptic vesicle fusion and replenishment. Though microdomain Ca at the active zone of ribbon synapses has been measured by Hudspeth and Moser, the new study uses the peptide recognizing synaptic ribbons, potentially measuring the Ca concentration relatively proximal to the release sites.
Strengths:
The study is, in principle, technically well done, and the peptide approach is technically interesting, which allows one to image Ca near the particular protein complexes. The approach …
Reviewer #3 (Public review):
Summary:
In this study, the authors have developed a new Ca indicator conjugated to the peptide, which likely recognizes synaptic ribbons and have measured microdomain Ca near synaptic ribbons at retinal bipolar cells. This interesting approach allows one to measure Ca close to transmitter release sites, which may be relevant for synaptic vesicle fusion and replenishment. Though microdomain Ca at the active zone of ribbon synapses has been measured by Hudspeth and Moser, the new study uses the peptide recognizing synaptic ribbons, potentially measuring the Ca concentration relatively proximal to the release sites.
Strengths:
The study is, in principle, technically well done, and the peptide approach is technically interesting, which allows one to image Ca near the particular protein complexes. The approach is potentially applicable to other types of imaging.
Weaknesses:
Peptides may not be entirely specific, and genetic approach tagging particular active zone proteins with fluorescent Ca indicator proteins may well be more specific. Although the authors are aware of this and the peptide approach is generally used for ribbon synapses, the authors should be aware of this, when interpreting the results.
-
Author response:
The following is the authors’ response to the original reviews
Reviewer #1 (Public review):
This paper describes technically-impressive measurements of calcium signals near synaptic ribbons in goldfish bipolar cells. The data presented provides high spatial and temporal resolution information about calcium concentrations along the ribbon at various distances from the site of entry at the plasma membrane. This is important information. Important gaps in the data presented mean that the evidence for the main conclusions is currently inadequate.
Thank you very much for this positive evaluation of our work. We would like to respectfully point out to the Reviewer that our current study was conducted using zebrafish as a model and not goldfish. We have revised the paper to eliminate any gaps in the data presentation.
Streng…
Author response:
The following is the authors’ response to the original reviews
Reviewer #1 (Public review):
This paper describes technically-impressive measurements of calcium signals near synaptic ribbons in goldfish bipolar cells. The data presented provides high spatial and temporal resolution information about calcium concentrations along the ribbon at various distances from the site of entry at the plasma membrane. This is important information. Important gaps in the data presented mean that the evidence for the main conclusions is currently inadequate.
Thank you very much for this positive evaluation of our work. We would like to respectfully point out to the Reviewer that our current study was conducted using zebrafish as a model and not goldfish. We have revised the paper to eliminate any gaps in the data presentation.
Strengths
(1) The technical aspects of the measurements are impressive. The authors use calcium indicators bound to the ribbon and high-speed line scans to resolve changes with a spatial resolution of ~250 nm and a temporal resolution of less than 10 ms. These spatial and temporal scales are much closer to those relevant for vesicle release than previous measurements.
(2) The use of calcium indicators with very different affinities and different intracellular calcium buffers helps provide confirmation of key results.
Thank you very much for this positive evaluation of our work.
Weaknesses
(1) Multiple key points of the paper lack statistical tests or summary data from populations of cells. For example, the text states that the proximal and distal calcium kinetics in Figure 2A differ. This is not clear from the inset to Figure 2A - where the traces look like scaled versions of each other. Values for time to half-maximal peak fluorescence are given for one example cell but no statistics or summary are provided. Figure 8 shows examples from one cell with no summary data. This issue comes up in other places as well.
Thank you for this feedback. We have addressed this in our revised manuscript where possible. We now include the results of paired-t-tests to compare the amplitudes of proximal vs. distal calcium signals shown in Fig. 2A & C, Fig. 3C & D, Fig. 4 C & D, Fig. 5A-D, and Fig. 8E&F. Because proximal and distal calcium signals were obtained from the same ribbons within 500-nm distances, as the Reviewer pointed out, “the traces look like scaled versions of each other”. For experiments where we make comparisons across cells or different calcium indicators, as shown in Fig.3 E&F, Fig.5E, and Fig. 8B&C, we now include the results of an unpaired t-test. We have now included the t-test statistics information in the respective figure legends in the revised version.
Regarding the Reviewer’s concern that “values for time to half-maximal peak fluorescence are given for one example cell, but no statistics or summary are provided,” we estimated the fluorescence rise times by only fitting the average traces to compare the overall qualitative behavior of the corresponding calcium indicator fluorescence. We did attempt to analyze the uncertainty for the rise-time estimates, but the simultaneous fitting of the rise- and decay-behavior of time traces is notoriously sensitive to noise, and therefore, a much higher signal-to-noise ratio would be required to provide reliable uncertainty estimation for the corresponding rise-time and decay-time characteristics. This is now explicitly explained in the corresponding Methods subsection.
In Figure 8, we now show example fluorescence traces from one cell at the bottom of the A and D panels, and the summary data is described in B-C and E-F, with statistics provided in the figure legends.
(2) Figure 5 is confusing. The figure caption describes red, green, and blue traces, but the figure itself has only two traces in each panel and none are red, green, or blue. It's not possible currently to evaluate this figure.
Thank you for pointing out this oversight. The figure shows the proximal and distal calcium signals, not the cytoplasmic ones. The figure caption was adjusted to correctly reflect what is shown in the figure.
(3) The rise time measurements in Figure 2 are very different for low and high-affinity indicators, but no explanation is given for this difference. Similarly, the measurements of peak calcium concentration in Figure 4 are very different from the two indicators. That might suggest that the high-affinity indicator is strongly saturated, which raises concerns about whether that is impacting the kinetic measurements.
We agree with the Reviewer and had mentioned in the text that we do believe that the high-affinity version of the dye is at least partially saturated. This will be especially a problem for strong depolarizations and signals near the membrane. We slightly changed the corresponding description of results on page 6 to acknowledge this point: “However, it should be noted that Cal520HA will be at least partially saturated at the Ca2+ levels expected in Ca2+ microdomains relevant for vesicle exocytosis, affecting both the amplitude and the kinetics of the fluorescence signal”.
Recommendations:
(1) It would be good to describe the location of calcium channels relative to the ribbon in the introduction.
We have provided this information in the discussion (please see p. 19: “The faster, smaller, and more spatially confined Ca2+ signals that are insensitive to the application of high concentrations of exogenous Ca2+ buffers, referred to here as ribbon proximal Ca2+ signals, could be due to Ca2+ influx through Cav channel clusters beneath the synaptic ribbon”). We have now provided this information in the last paragraph of the introduction as well.
(2) The introduction is quite technical and would benefit from a more complete description of the findings of the paper (e.g. expanding the last sentence to a full paragraph).
We have updated the last paragraph of the introduction as per the reviewer’s advice.
(3) It is not clear that the capacitance measurements in Figure 1 are needed (I did not see them used anywhere else in the paper).
We have removed the capacitance measurements from the figure.
(4) Please add legends in the figures themselves defining different line colors and weights so that a reader does not need to search for them in the figure caption.
We agree that such figure improvements facilitate reading. We have added legends in the figures themselves, where appropriate.
(5) The insets with the expanded traces in many cases are too small - e.g. Figure 1F.
We have enlarged the insets in applicable figures as much as possible to facilitate visualization. These changes can be seen in Figures 1, 2, 3, 4, 5, and 8, as well as Supplementary Figure 3.
(6) Page 5, statistics for amplitude of calcium changes. Is p < 0.001 really correct here? The SEMs indicate an overlap of the two distributions of mean amplitudes - and later data for which you give p = 0.001 has much less overlap.
Since the two data sets in question come from paired recordings, with a high Pearson correlation coefficient of 0.93, the p-values are in fact, correct despite this significant overlap. We conducted paired-t-tests to compare proximal vs. distal calcium signals obtained from a single calcium indicator shown in Fig. 2A & C, Fig. 3C & D, Fig.4 C & D, Fig.5A-D, and Fig. 8E&F. For experiments where we make comparisons across cells or across different calcium indicators, as shown in Fig.3 E&F, Fig.5E, and Fig. 8B&C, we performed an unpaired t-test. In response to the Reviewer’s comment, we now provide details on t-statistics in the respective figure legends in the revised version.
(7) The text on page 6 describing Figure 3 appears to repeat several technical aspects of the measurements that have already been described in Figure 1. I would reduce that overlap as it is confusing for a reader.
Since Fig.1 describes calcium measurements with free calcium indicator, whereas Fig.3 describes bound calcium indicator, we would prefer to keep the information for the sake of completeness, despite some small amount of repetition.
(8) Figure 4A needs to be described in more detail.
We have provided the vesicle pool details in the Supplementary Fig. 1.
(9) The text in Figure 7 is too small.
We have redone Fig. 7 and Supplemental Fig. 4 to ensure that the tick labels and other text are sufficiently large.
(10) Are the units (nM) in Figure 8 correct?
Thank you for pointing that out. The units were supposed to be µM and have been corrected in the figure.
Reviewer #2 (Public review):
Summary:
The study introduces new tools for measuring intracellular Ca2+ concentration gradients around retinal rod bipolar cell (rbc) synaptic ribbons. This is done by comparing the Ca2+ profiles measured with mobile Ca2+ indicator dyes versus ribbon-tethered (immobile) Ca2+ indicator dyes. The Ca2+ imaging results provide a straightforward demonstration of Ca2+ gradients around the ribbon and validate their experimental strategy. This experimental work is complemented by a coherent, open-source, computational model that successfully describes changes in Ca2+ domains as a function of Ca2+ buffering. In addition, the authors try to demonstrate that there is heterogeneity among synaptic ribbons within an individual rbc terminal.
Strengths:
The study introduces a new set of tools for estimating Ca2+ concentration gradients at ribbon AZs, and the experimental results are accompanied by an open-source, computational model that nicely describes Ca2+ buffering at the rbc synaptic ribbon. In addition, the dissociated retinal preparation remains a valuable approach for studying ribbon synapses. Lastly, excellent EM.
Thank you very much for this appreciation of our work.
Weaknesses:
Heterogeneity in the spatiotemporal dynamics of Ca2+ influx was not convincingly related to ribbon size, nor was the functional relevance of Ca2+ dynamics to rod bipolars demonstrated (e.g., exocytosis to different postsynaptic targets). In addition, the study would benefit from the inclusion of the Ca2+ currents that were recorded in parallel with the Ca2+ imaging.
Thank you for this critique. We agree that our data do not establish the relationship between ribbon size and Ca2+ signal. By analogy to the hair cell literature, we believe that it is a reasonable hypothesis, but more studies will be necessary to definitively determine whether the signal relates to ribbon size or synaptic signaling. This will be addressed in future experiments.
We have included the calcium current recorded in parallel with calcium imaging in Fig.1, when we show a single example. We now do the same for individual examples shown in Fig. 8 A and D, bottom. The calcium imaging data shown in Figs. 2-5 and Supp. Fig. 3 is the average trace, thus we have provided the averages of the peak calcium current and statistics. Since in Figure 8D-F some ribbons only have one reading, we have not conducted statistical analysis in this case.
Recommendations:
The major conclusion of the work is that within bipolar cells, heterogeneity exists between Ca2+ microdomains formed at synaptic ribbons, which is supported by the results; however, what causes this is not clear. Most of the comments below are suggestions that hopefully help the authors strengthen the association of Ca2+ domain heterogeneity with features of ribbon AZs or at least offer additional options for the authors to communicate their work.
(1) In the current study, anatomical segregation of SRs by size does not appear to exist across the ZF rod bipolar terminal, nor has this been reported for mouse rod bipolars. In the absence of this, the current study lacks the fortuitous attributes, and thus reasoning, utilized in the hair cell (HC) studies (those cited in the current MS). Namely, the HC studies utilized the following anatomical features to compare EM, IF, and physio results: a) identified differences in ribbon synapses along a tonotopic gradient (basal to apical cochlea), b) compared ribbons on different sides of an inner HC (pillar vs. modiolar), or c) examined age-dependent changes in HC ribbons.
Thank you for this comment. We agree that we do not show any interesting systematic relationships between ribbon size and cell position or other large-scale morphological features. We added text on page 19 to stress this (“However, in comparing our findings with studies of ribbon size heterogeneity in hair cell…”). However, to our knowledge, diversity in ribbon size has never been reported in bipolar cells.
(2) In the absence of intrinsic topographical segregation in ribbon size within rod bipolars, then a) the imaging data attained from dissoc cells needs to be internally as sound as possible, and b) the parameters used to define ribbon dimensions in light (LM) and electron microscopy should be as communicative/interchangeable as possible.
Thank you for this comment. Our confocal images show a moderate correlation between ribbon size measured as fluorescence of ribeye binding peptide vs. calcium hot spots. Similarly, SBF-SEM images demonstrate that the ribbon active zone length vs width show a moderate correlation. We have summarized these findings in Figure 11. Thus, as the Reviewer pointed out, our confocal and SBF-SEM findings support each other.
(3) It is not entirely clear how the authors distinguish rod bipolars (a subset of On-bipolars) from all other ON-bipolars? The two different preparations: dissoc or intact retina, present distinct challenges. In the example presented in Supplementary Figure 2B, the PKCalpha stained bipolar has an axon that is approx. 25 um long, but the expected length should be approx. 50um based on ZF retinal anatomy and recent study on rbc1/2 (Hellevik et al BioRxiv 2023). One could argue rather that the enzymatic treatment or mechanical shear forces caused the axon to shrink. If that is the line of reasoning, then present a low mag field of view with an assortment of dissoc bipolars stained for PKCalpha, zoom in, and describe cell morphologies and their assignment as PKCa + or -. Then you can summarize how axon terminal size, axon length, and PKC staining are or aren't correlated. Based on the results, one might have to perform IF on each dissoc cell that was assayed under LM (Ca2+ imaging) and ephys to verify it's a rod bipolar. In the case of the EM, the authors refer to the terminals analyzed as rbcs because they have larger terminals and less branching than the cbs. Since these are really nice EM images, data-rich, with better resolution than I have ever seen for retinal SBF-EM, do due diligence by tracing the terminals of neighboring bcs (ignoring details within terminals just outline terminals) and make a visual presentation that illustrates that those you selected as rbs have larger terminals than cbs (this can also give of sense of the density distribution of terminal types). Is there a published ephysio on the ZF rbcs which has been correlated with morphology? The Hellevik et al BioRxiv 2023 study shows light responses but not necessary rbcs distinguished from other On-bcs.
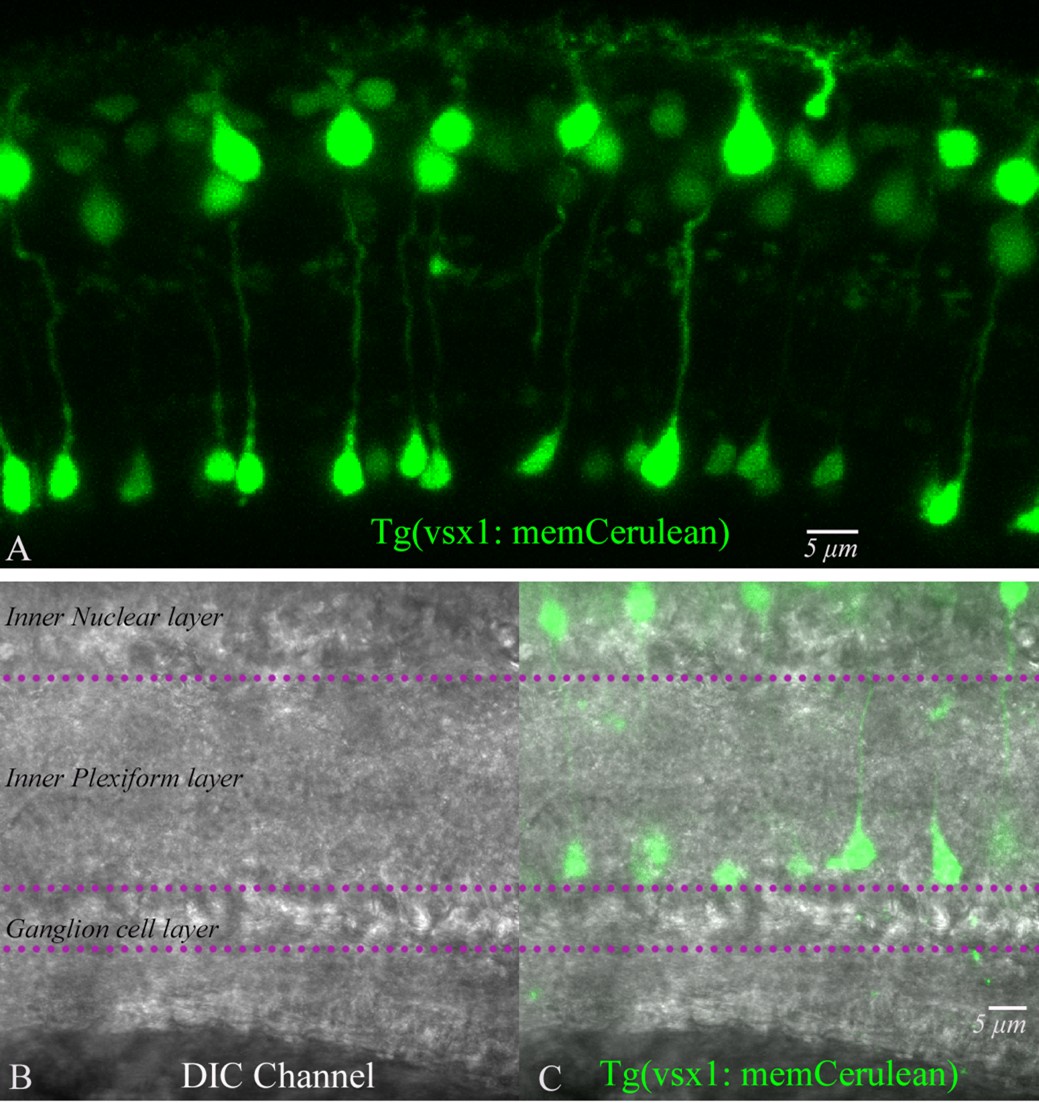
We have quantified the number of rod bipolar cells obtained from our isolation procedure using two approaches: 1. To fix the isolated bipolar cells and perform immunofluorescence with PKC alpha. 2. To isolate bipolar cells from Tg(vsx1: memCerulean)q19 transgenic zebrafish, labeling rod bipolar cell type 1 (RBC1) that we recently obtained from Dr. Yoshimatsu (Hellevik et al., 2024). Of note, the circuitry of RBC1 has been shown to be similar to the mammalian rod bipolar cell pathway (Hellevik et al., 2024). Below, we list our findings:
The average terminal size of fixed bipolar cells labeled with PKC alpha was 5.9 ± 0.2 mm, whereas the freshly isolated living bipolar cells used for our physiology experiments had an average terminal size of 6.3 ± 0.2 mm, and the rod bipolar cells from the Tg(vsx1: memCerulean)q19 line had an average terminal size of 6.9 ± 0.2 mm. We also measured terminal size for fixed bipolar cells, unlabeled with PKC alpha: 3.3 ± 0.2 mm, and unlabeled cells from Tg(vsx1: memCerulean)q19 cells: 4.0± 0.2 mm.
In addition, we also pay attention to the soma shape and dendrites, as the primary dendrite of the RBC is thick and short. Connaughton and Nelson have done a thorough analysis of morphological classification. But no measurements were given. https://onlinelibrary.wiley.com/doi/10.1002/cne.20261. Since the axon length is not retained during the isolation procedure, we do not use it as an identification marker for rod bipolar cells in our experiments.
We re-imaged vsx1 with the DIC channel to compare the terminal sizes of fluorescently labeled RBC1 terminals with those of other BPCs in the DIC channel. Below are the images that can give a sense of the density distribution of terminal types and measurements.
Author response image 1.
Tracing all neighboring terminals in SBF-SEM is laborious and beyond the scope of this manuscript, but we will do full reconstructions in a future publication.
(4) How to strengthen the description of heterogeneity within the dissoc measurements? There are two places in the LM data where heterogeneity may be relevant. The first point here is that Ribbon size (TAMRA- Ribeye binding peptide) and active zone size (Cal520HA/LA-RBP) measurements depend on labelling the ribbon/Ribeye; thus, Ribbon size and AZ size should be correlated on this basis alone. I would expect Pearson's r value to show a stronger association (r > 0.7) than what is reported in Figure 11B/C (r: 0.52 or 0.32). I would interpret a moderate to weak correlation (r < 0.5 to 0.3) as an indication that ribbons are heterogeneous (variability in Ca influx per unit ribbon size). Now to the second point, in Figure 8 and Supplementary Figure 5 there is time-signal amplitude heterogeneity. >>> My curiosity is whether signal amplitude is heterogeneous in space (ribbon size, my speculation) and in time (complex, but compare ribeye bound and free Ca2+ indicator)? It seems like the data in Figure 8 and 11 should cross over and possibly offer the authors more to say.
We appreciate the Reviewer’s insightful observation and added a sentence at the very end of the Results section reflecting the Reviewer’s argument (“we note that a large correlation between the inferred ribbon size and active zone size…”)
The Reviewer’s second point about the connection between heterogeneity of signal amplitude in space and in time is an interesting one as well and could be grounds for an additional investigation in the future.
(5) As the authors know, a very powerful tool for exploring Ca microdomain dynamics is to exploit the Voltage dependence of Cavs (as exemplified in the numerous HC studies that are cited). An I-V protocol would provide a valuable means to illustrate different rates of saturating the LA and HA Ca indicators. More generally, the Ca currents and associated patch clamp parameters (Gm, leak...) can tell us much about the health of the cell and provide an added metric to assess normal variability between cells. A few places in the MS currents are mentioned yet this data is missing (Figure S5 , last line: Amplitude variability between two cells with similar Ca currents.).
Thank you for the valuable suggestion. We will include I-V protocol across several ribbons in future experiments. We have included the calcium currents for all the calcium transient traces. We have also included the statistics to compare those currents across conditions.
Technical comments
(6) Since the Ribeye-Ca2+ indicator covers the entire ribbon, it will contribute to a signal gradient. The proximal signal is assumed to be closest to the base of the ribbon where presumably the Cav channels are located, and the distal signal will originate from the top (apex) of the ribbon some 200 nm from the base of the ribbon. Have you tried to measure "ribbon lengths and widths" with the HA and LA Ca indicators? My guess would be that the LA will show a gradient, and give you a better indication of the base of the ribbon; whereas the HA signal will have dimensions similar to the TAMRA-peptide.
Due to the point spread function limitation in the light microscopy, we obtained all ribbon measurements from the SBF-SEM images only.
As a surrogate for size in the light microscopy, we used ribbon fluorescence, which we expect should scale with the number of ribeye molecules in the ribbon (Figure 11B)
(7) Normalize proximal and distal LM data to highlight kinetic differences (Fig 2-5, 8), and when describing temporal heterogeneity please use a better description that includes time, such as time-to-pk, and decay1, decay 2....
In the current manuscript, we only focus on the amplitude as it provides the information about the number of calcium channels. We used the rise time measurements to compare the time to reach the peak amplitude at the proximal vs. distal locations, demonstrating that proximal calcium signals reach the peak faster since the calcium channels are located beneath the ribbon.
We tried to perform fittings to the individual traces. Since they are too noisy to pick out true kinetic differences between ribbons, we would need to average several traces from each ribbon. We plan to apply our high-resolution approach established in this paper to a longer stimulus and perform the fittings as per the Reviewer’s advice for a future paper.
We now describe on pages 6-7 the two decay components for data in Figs. 2 and 3.
(8) Why not measure ribbon length in EM as done in confocal and then compare lengths from LM and EM. In Figure S8, you have made a nice presentation of AZ Area from EM. Make similar plots for EM ribbon length (and width?), and compare the distributions to Figure 11 LM data. Maybe use other statistical descriptions like Coeff of Var or look for different populations by using multi-distribution fits. If the differences in length or area (EM data) can be segregated into short and long distances, then a similar feature might arise from the LM data. If no such morphological segregation exists, then the heterogeneity in Ca microdomains may arise from variable Cav channel density or gating, Ca buffer, etc.
Due to the point spread function limitation in light microscopy, the size of the ribbon dimensions in light microscopy cannot be reliably measured. As a surrogate, we used total fluorescence of the ribbon, which should correlate with the number of ribeye molecules in the ribbon. To obtain ribbon dimensions, we used measurements from the SBF-SEM images only. We summarized the distribution of ribbon width and length in Figures 11C and 11D. The distribution of the active zone size is summarized in Supplementary Figure 8. Pearson’s correlation coefficients are positive, but a weak correlation, suggesting multiple mechanisms likely to contribute to heterogeneity in the local calcium signals as the Reviewer pointed out.
(9) Again, the quality of the EM data is great, and sufficient to make the assignment of SVs to different pools, as you have done in Fig S1. My only complaint is that the Ultrafast pool as indicated in the schematic of S1A seems to have a misassignment with respect to the green SV that is 15 nm from the PM. In the original Mennerick and Matthews 1996 study, the UF pool emptied in ~1msec. The morphological correlate for the UF has been assumed to be SVs touching the plasma membrane. 15 nm away is about 14 nm too far to be in the UF.
Thank you for pointing that out. We have updated the vesicles labeling in Supplementary Figure 1 and Main Figure 4.
Reviewer #3 (Public review):
Summary:
In this study, the authors have developed a new Ca indicator conjugated to the peptide, which likely recognizes synaptic ribbons, and have measured microdomain Ca near synaptic ribbons at retinal bipolar cells. This interesting approach allows one to measure Ca close to transmitter release sites, which may be relevant for synaptic vesicle fusion and replenishment. Though microdomain Ca at the active zone of ribbon synapses has been measured by Hudspeth and Moser, the new study uses the peptide recognizing synaptic ribbons, potentially measuring the Ca concentration relatively proximal to the release sites.
Thank you very much for this positive evaluation of our work.
Strengths:
The study is in principle technically well done, and the peptide approach is technically interesting, which allows one to image Ca near the particular protein complexes. The approach is potentially applicable to other types of imaging.
Thank you very much for this appreciation.
Weaknesses:
Peptides may not be entirely specific, and the genetic approach tagging particular active zone proteins with fluorescent Ca indicator proteins may well be more specific. I also feel that "Nano-physiology" is overselling, because the measured Ca is most likely the local average surrounding synaptic ribbons. With this approach, nobody knows about the real release site Ca or the Ca relevant for synaptic vesicle replenishment. It is rather "microdomain physiology" which measures the local Ca near synaptic ribbons, relatively large structures responsible for fusion, replenishment, and recycling of synaptic vesicles.
The peptide approach has been used fairly extensively in the ribbon synapse field and the evidence that it efficiently labels the ribbon is well established, however, we do acknowledge that the peptide is in equilibrium with a cytoplasmic pool. Thus, some of the signal arises from this cytoplasmic pool. The alternative of a genetically encoded Ca-indicator concatenated to a ribbon protein would not have this problem, but would be more limited in flexibility in changing calcium indicators. We believe both approaches have their merits, each with separate advantages and disadvantages.
As for the nano vs. micro argument, we certainly do not want to suggest that we are measuring the same nano-domains, on the spatial scale of 10s of nanometers, that drive neurotransmitter release, but we do believe we are in the sub-micrometer -- 100s of nm -- range. We chose the term based on the usage by other authors to describe similar measurements (Neef et al., 2018; https://doi.org/10.1038/s41467-017-02612-y), but we see the reviewer’s point.
Recommendations:
I have no recommendation for additional experiments. However, the statement of "nanophysiology" is too much, and the authors should tone done the ms recognizing some caveats.
As we mention above, we chose the term based on the usage by other authors to describe similar measurements, and we do believe that we achieve resolution of a few hundred nanometers, and therefore would prefer to keep the current title of the manuscript. For example, Figure 5E shows that, with ribeye-bound low-affinity calcium indicator, the proximal calcium signals were preserved in the presence of BAPTA, rising and decaying abruptly, as expected for a nanodomain Ca2+ elevation. Thus, we believe that this measurement in particular describes a nanodomain-scale signal. However, we acknowledge that we are not currently able to resolve the spatial distribution of Ca2+ signals with a spatial resolution of 10s of nanometers.
-
eLife Assessment
The study introduces new tools for measuring the intracellular calcium concentration close to transmitter release sites, which may be relevant for synaptic vesicle fusion and replenishment. This approach yields important new information about the spatial and temporal profile of calcium concentrations near the site of entry at the plasma membrane. This experimental work is complemented by a coherent, open-source, computational model that successfully describes changes in calcium domains. Key gaps in the data presented mean that the evidence for the main conclusions is currently incomplete.
-
Reviewer #1 (Public review):
This paper describes technically-impressive measurements of calcium signals near synaptic ribbons in goldfish bipolar cells. The data presented provides high spatial and temporal resolution information about calcium concentrations along the ribbon at various distances from the site of entry at the plasma membrane. This is important information. Important gaps in the data presented mean that the evidence for the main conclusions is currently inadequate.
Strengths
(1) The technical aspects of the measurements are impressive. The authors use calcium indicators bound to the ribbon and high-speed line scans to resolve changes with a spatial resolution of ~250 nm and a temporal resolution of less than 10 ms. These spatial and temporal scales are much closer to those relevant for vesicle release than previous …
Reviewer #1 (Public review):
This paper describes technically-impressive measurements of calcium signals near synaptic ribbons in goldfish bipolar cells. The data presented provides high spatial and temporal resolution information about calcium concentrations along the ribbon at various distances from the site of entry at the plasma membrane. This is important information. Important gaps in the data presented mean that the evidence for the main conclusions is currently inadequate.
Strengths
(1) The technical aspects of the measurements are impressive. The authors use calcium indicators bound to the ribbon and high-speed line scans to resolve changes with a spatial resolution of ~250 nm and a temporal resolution of less than 10 ms. These spatial and temporal scales are much closer to those relevant for vesicle release than previous measurements.
(2) The use of calcium indicators with very different affinities and different intracellular calcium buffers helps provide confirmation of key results.
Weaknesses
(1) Multiple key points of the paper lack statistical tests or summary data from populations of cells. For example, the text states that the proximal and distal calcium kinetics in Figure 2A differ. This is not clear from the inset to Figure 2A - where the traces look like scaled versions of each other. Values for time to half-maximal peak fluorescence are given for one example cell but no statistics or summary are provided. Figure 8 shows examples from one cell with no summary data. This issue comes up in other places as well.
(2) Figure 5 is confusing. The figure caption describes red, green, and blue traces, but the figure itself has only two traces in each panel and none are red, green, or blue. It's not possible currently to evaluate this figure.
(3) The rise time measurements in Figure 2 are very different for low and high-affinity indicators, but no explanation is given for this difference. Similarly, the measurements of peak calcium concentration in Figure 4 are very different from the two indicators. That might suggest that the high-affinity indicator is strongly saturated, which raises concerns about whether that is impacting the kinetic measurements.
-
Reviewer #2 (Public review):
Summary:
The study introduces new tools for measuring intracellular Ca2+ concentration gradients around retinal rod bipolar cell (rbc) synaptic ribbons. This is done by comparing the Ca2+ profiles measured with mobile Ca2+ indicator dyes versus ribbon-tethered (immobile) Ca2+ indicator dyes. The Ca2+ imaging results provide a straightforward demonstration of Ca2+ gradients around the ribbon and validate their experimental strategy. This experimental work is complemented by a coherent, open-source, computational model that successfully describes changes in Ca2+ domains as a function of Ca2+ buffering. In addition, the authors try to demonstrate that there is heterogeneity among synaptic ribbons within an individual rbc terminal.
Strengths:
The study introduces a new set of tools for estimating Ca2+ …
Reviewer #2 (Public review):
Summary:
The study introduces new tools for measuring intracellular Ca2+ concentration gradients around retinal rod bipolar cell (rbc) synaptic ribbons. This is done by comparing the Ca2+ profiles measured with mobile Ca2+ indicator dyes versus ribbon-tethered (immobile) Ca2+ indicator dyes. The Ca2+ imaging results provide a straightforward demonstration of Ca2+ gradients around the ribbon and validate their experimental strategy. This experimental work is complemented by a coherent, open-source, computational model that successfully describes changes in Ca2+ domains as a function of Ca2+ buffering. In addition, the authors try to demonstrate that there is heterogeneity among synaptic ribbons within an individual rbc terminal.
Strengths:
The study introduces a new set of tools for estimating Ca2+ concentration gradients at ribbon AZs, and the experimental results are accompanied by an open-source, computational model that nicely describes Ca2+ buffering at the rbc synaptic ribbon. In addition, the dissociated retinal preparation remains a valuable approach for studying ribbon synapses. Lastly, excellent EM.
Weaknesses:
Heterogeneity in the spatiotemporal dynamics of Ca2+ influx was not convincingly related to ribbon size, nor was the functional relevance of Ca2+ dynamics to rod bipolars demonstrated (e.g., exocytosis to different postsynaptic targets). In addition, the study would benefit from the inclusion of the Ca2+ currents that were recorded in parallel with the Ca2+ imaging.
-
Reviewer #3 (Public review):
Summary:
In this study, the authors have developed a new Ca indicator conjugated to the peptide, which likely recognizes synaptic ribbons, and have measured microdomain Ca near synaptic ribbons at retinal bipolar cells. This interesting approach allows one to measure Ca close to transmitter release sites, which may be relevant for synaptic vesicle fusion and replenishment. Though microdomain Ca at the active zone of ribbon synapses has been measured by Hudspeth and Moser, the new study uses the peptide recognizing synaptic ribbons, potentially measuring the Ca concentration relatively proximal to the release sites.
Strengths:
The study is in principle technically well done, and the peptide approach is technically interesting, which allows one to image Ca near the particular protein complexes. The approach is …
Reviewer #3 (Public review):
Summary:
In this study, the authors have developed a new Ca indicator conjugated to the peptide, which likely recognizes synaptic ribbons, and have measured microdomain Ca near synaptic ribbons at retinal bipolar cells. This interesting approach allows one to measure Ca close to transmitter release sites, which may be relevant for synaptic vesicle fusion and replenishment. Though microdomain Ca at the active zone of ribbon synapses has been measured by Hudspeth and Moser, the new study uses the peptide recognizing synaptic ribbons, potentially measuring the Ca concentration relatively proximal to the release sites.
Strengths:
The study is in principle technically well done, and the peptide approach is technically interesting, which allows one to image Ca near the particular protein complexes. The approach is potentially applicable to other types of imaging.
Weaknesses:
Peptides may not be entirely specific, and the genetic approach tagging particular active zone proteins with fluorescent Ca indicator proteins may well be more specific. I also feel that "Nano-physiology" is overselling, because the measured Ca is most likely the local average surrounding synaptic ribbons. With this approach, nobody knows about the real release site Ca or the Ca relevant for synaptic vesicle replenishment. It is rather "microdomain physiology" which measures the local Ca near synaptic ribbons, relatively large structures responsible for fusion, replenishment, and recycling of synaptic vesicles.
-
Author response:
Public Reviews:
Reviewer #1 (Public review):
This paper describes technically-impressive measurements of calcium signals near synaptic ribbons in goldfish bipolar cells. The data presented provides high spatial and temporal resolution information about calcium concentrations along the ribbon at various distances from the site of entry at the plasma membrane. This is important information. Important gaps in the data presented mean that the evidence for the main conclusions is currently inadequate.
Strengths
(1) The technical aspects of the measurements are impressive. The authors use calcium indicators bound to the ribbon and high-speed line scans to resolve changes with a spatial resolution of ~250 nm and a temporal resolution of less than 10 ms. These spatial and temporal scales are much closer to those relevant for …
Author response:
Public Reviews:
Reviewer #1 (Public review):
This paper describes technically-impressive measurements of calcium signals near synaptic ribbons in goldfish bipolar cells. The data presented provides high spatial and temporal resolution information about calcium concentrations along the ribbon at various distances from the site of entry at the plasma membrane. This is important information. Important gaps in the data presented mean that the evidence for the main conclusions is currently inadequate.
Strengths
(1) The technical aspects of the measurements are impressive. The authors use calcium indicators bound to the ribbon and high-speed line scans to resolve changes with a spatial resolution of ~250 nm and a temporal resolution of less than 10 ms. These spatial and temporal scales are much closer to those relevant for vesicle release than previous measurements.
(2) The use of calcium indicators with very different affinities and different intracellular calcium buffers helps provide confirmation of key results.
Thank you very much for this positive evaluation of our work.
Weaknesses
(1) Multiple key points of the paper lack statistical tests or summary data from populations of cells. For example, the text states that the proximal and distal calcium kinetics in Figure 2A differ. This is not clear from the inset to Figure 2A - where the traces look like scaled versions of each other. Values for time to half-maximal peak fluorescence are given for one example cell but no statistics or summary are provided. Figure 8 shows examples from one cell with no summary data. This issue comes up in other places as well.
Thank you for this feedback. We will address this in our revised manuscript.
(2) Figure 5 is confusing. The figure caption describes red, green, and blue traces, but the figure itself has only two traces in each panel and none are red, green, or blue. It's not possible currently to evaluate this figure.
Thank you for pointing out this oversight. The figure indeed only shows the proximal and distal calcium signals, but not the cytoplasmic ones. The figure will be corrected in our revised manuscript.
(3) The rise time measurements in Figure 2 are very different for low and high-affinity indicators, but no explanation is given for this difference. Similarly, the measurements of peak calcium concentration in Figure 4 are very different from the two indicators. That might suggest that the high-affinity indicator is strongly saturated, which raises concerns about whether that is impacting the kinetic measurements.
As we had mentioned in the text, we do believe that the high-affinity version is partially saturated. This will be a problem for strong depolarizations and signals near the membrane. The higher affinity indicators are more useful for reporting calcium levels on the ribbon after the depolarization when the signal from the low affinity indicators is small. We will address this in the discussion of the revision.
Reviewer #2 (Public review):
Summary:
The study introduces new tools for measuring intracellular Ca2+ concentration gradients around retinal rod bipolar cell (rbc) synaptic ribbons. This is done by comparing the Ca2+ profiles measured with mobile Ca2+ indicator dyes versus ribbon-tethered (immobile) Ca2+ indicator dyes. The Ca2+ imaging results provide a straightforward demonstration of Ca2+ gradients around the ribbon and validate their experimental strategy. This experimental work is complemented by a coherent, open-source, computational model that successfully describes changes in Ca2+ domains as a function of Ca2+ buffering. In addition, the authors try to demonstrate that there is heterogeneity among synaptic ribbons within an individual rbc terminal.
Strengths:
The study introduces a new set of tools for estimating Ca2+ concentration gradients at ribbon AZs, and the experimental results are accompanied by an open-source, computational model that nicely describes Ca2+ buffering at the rbc synaptic ribbon. In addition, the dissociated retinal preparation remains a valuable approach for studying ribbon synapses. Lastly, excellent EM.
Thank you very much for this appreciation.
Weaknesses:
Heterogeneity in the spatiotemporal dynamics of Ca2+ influx was not convincingly related to ribbon size, nor was the functional relevance of Ca2+ dynamics to rod bipolars demonstrated (e.g., exocytosis to different postsynaptic targets). In addition, the study would benefit from the inclusion of the Ca2+ currents that were recorded in parallel with the Ca2+ imaging.
Thank you for this critique. We agree that the relationship between size and Ca2+ signal is not established by our recordings. By analogy to the hair cell literature, we believe that it is a reasonable hypothesis, but more studies will be necessary to definitively determine whether the signal relates to the ribbon size or synaptic signaling. This will be addressed in future experiments.
We will include the Ca2+ currents in the revision.
Reviewer #3 (Public review):
Summary:
In this study, the authors have developed a new Ca indicator conjugated to the peptide, which likely recognizes synaptic ribbons, and have measured microdomain Ca near synaptic ribbons at retinal bipolar cells. This interesting approach allows one to measure Ca close to transmitter release sites, which may be relevant for synaptic vesicle fusion and replenishment. Though microdomain Ca at the active zone of ribbon synapses has been measured by Hudspeth and Moser, the new study uses the peptide recognizing synaptic ribbons, potentially measuring the Ca concentration relatively proximal to the release sites.
Strengths:
The study is in principle technically well done, and the peptide approach is technically interesting, which allows one to image Ca near the particular protein complexes. The approach is potentially applicable to other types of imaging.
Thank you very much for this appreciation.
Weaknesses:
Peptides may not be entirely specific, and the genetic approach tagging particular active zone proteins with fluorescent Ca indicator proteins may well be more specific. I also feel that "Nano-physiology" is overselling, because the measured Ca is most likely the local average surrounding synaptic ribbons. With this approach, nobody knows about the real release site Ca or the Ca relevant for synaptic vesicle replenishment. It is rather "microdomain physiology" which measures the local Ca near synaptic ribbons, relatively large structures responsible for fusion, replenishment, and recycling of synaptic vesicles.
The peptide approach has been used fairly extensively in the ribbon synapse field and the evidence that it efficiently labels the ribbon is well established, however, we do acknowledge that the peptide is in equilibrium with a cytoplasmic pool. Thus, some of the signal arises from this cytoplasmic pool. The alternative of a genetically encoded Ca-indicator concatenated to a ribbon protein would not have this problem, but would be more limited in flexibility in changing calcium indicators. We believe both approaches have their merits, each with separate advantages and disadvantages.
As for the nano vs. micro argument, we certainly do not want to suggest that we are measuring the same nano-domains, in the 10s of nanometers, that drive neurotransmitter release, but we do believe we are in the sub-micrometer--100s of nm—range. We chose the term based on the usage by other authors to describe similar measurements (Neef et al., 2018; https://doi.org/10.1038/s41467-017-02612-y), but we see the reviewer’s point. To avoid confusion, we will change the title in the revision.
-
-
