Avian-specific Salmonella transition to endemicity is accompanied by localized resistome and mobilome interaction
Curation statements for this article:-
Curated by eLife

eLife Assessment
This important study analyzes a large dataset of Salmonella gallinarum whole-genome sequences and provides findings regarding the population structure of this avian-specific pathogen. The convincing results indicate regional adaptation of the mobilome-driven resistome and a role in the evolutionary trajectory of this pathogen that will interest microbiologists and researchers working on genomics, evolution, and antimicrobial resistance.
This article has been Reviewed by the following groups
Discuss this preprint
Start a discussion What are Sciety discussions?Listed in
- Evaluated articles (eLife)
Abstract
Bacterial regional demonstration after global dissemination is an essential pathway for selecting distinct finesses. However, the evolution of the resistome during the transition to endemicity remains unaddressed. Using the most comprehensive whole-genome sequencing dataset of Salmonella enterica serovar Gallinarum ( S . Gallinarum) collected from 15 countries, including 45 newly recovered samples from two related local regions, we established the relationship among avian-specific pathogen genetic profiles and localization patterns. Initially, we revealed the international transmission and evolutionary history of S . Gallinarum to recent endemicity through phylogenetic analysis conducted using a spatiotemporal Bayesian framework. Our findings indicate that the independent acquisition of the resistome via the mobilome, primarily through plasmids and transposons, shapes a unique antimicrobial resistance profile among different lineages. Notably, the mobilome-resistome combination among distinct lineages exhibits a geographical-specific manner, further supporting a localized endemic mobilome-driven process. Collectively, this study elucidates resistome adaptation in the endemic transition of an avian-specific pathogen, likely driven by the localized farming style, and provides valuable insights for targeted interventions.
Article activity feed
-

-
-

eLife Assessment
This important study analyzes a large dataset of Salmonella gallinarum whole-genome sequences and provides findings regarding the population structure of this avian-specific pathogen. The convincing results indicate regional adaptation of the mobilome-driven resistome and a role in the evolutionary trajectory of this pathogen that will interest microbiologists and researchers working on genomics, evolution, and antimicrobial resistance.
-
Reviewer #1 (Public review):
Summary:
The investigators in this study analyzed the dataset assembly from 540 Salmonella isolates, and those from 45 recent isolates from Zhejiang University of China. The analysis and comparison of the resistome and mobilome of these isolates identified a significantly higher rate of cross-region dissemination compared to localized propagation. This study highlights the key role of the resistome in driving the transition and evolutionary history of S. Gallinarum.
Strengths:
The isolates included in this study were from 16 countries in the past century (1920 to 2023). While the study uses S. Gallinarun as the prototype, the conclusion from this work will likely apply to other Salmonella serotypes and other pathogens.
-
Reviewer #2 (Public review):
Summary:
The authors sequence 45 new samples of S. Gallinarum, a commensal Salmonella found in chickens, which can sometimes cause disease. They combine these sequences with around 500 from public databases, determine the population structure of the pathogen, and coarse relationships of lineages with geography. The authors further investigate known anti-microbial genes found in these genomes, how they associate with each other, whether they have been horizontally transferred, and date the emergence of clades.
Strengths:
- It doesn't seem that much is known about this serovar, so publicly available new sequences from a high burden region are a valuable addition to the literature.
- Combining these sequences with publicly available sequences is a good way to better contextualise any findings.
- The genomic …Reviewer #2 (Public review):
Summary:
The authors sequence 45 new samples of S. Gallinarum, a commensal Salmonella found in chickens, which can sometimes cause disease. They combine these sequences with around 500 from public databases, determine the population structure of the pathogen, and coarse relationships of lineages with geography. The authors further investigate known anti-microbial genes found in these genomes, how they associate with each other, whether they have been horizontally transferred, and date the emergence of clades.
Strengths:
- It doesn't seem that much is known about this serovar, so publicly available new sequences from a high burden region are a valuable addition to the literature.
- Combining these sequences with publicly available sequences is a good way to better contextualise any findings.
- The genomic analyses have been greatly improved since the first version of the manuscript, and appropriately analyse the population and date emergence of clades.
- The SNP thresholds are contextualised in terms of evolutionary time.
- The importance and context of the findings are fairly well described. -
Author response:
The following is the authors’ response to the previous reviews.
Public Reviews:
Reviewer #1 (Public review):
Summary:
The investigators in this study analyzed the dataset assembly from 540 Salmonella isolates, and those from 45 recent isolates from Zhejiang University of China. The analysis and comparison of the resistome and mobilome of these isolates identified a significantly higher rate of cross-region dissemination compared to localized propagation. This study highlights the key role of the resistome in driving the transition and evolutionary history of S. Gallinarum.
Strengths:
The isolates included in this study were from 16 countries in the past century (1920 to 2023). While the study uses S. Gallinarun as the prototype, the conclusion from this work will likely apply to other Salmonella serotypes and other …
Author response:
The following is the authors’ response to the previous reviews.
Public Reviews:
Reviewer #1 (Public review):
Summary:
The investigators in this study analyzed the dataset assembly from 540 Salmonella isolates, and those from 45 recent isolates from Zhejiang University of China. The analysis and comparison of the resistome and mobilome of these isolates identified a significantly higher rate of cross-region dissemination compared to localized propagation. This study highlights the key role of the resistome in driving the transition and evolutionary history of S. Gallinarum.
Strengths:
The isolates included in this study were from 16 countries in the past century (1920 to 2023). While the study uses S. Gallinarun as the prototype, the conclusion from this work will likely apply to other Salmonella serotypes and other pathogens.
Thank you very much for your positive feedback. We recognize, as you noted, that emphasizing Salmonella enterica Serovar Gallinarum in the title may lead readers to perceive our methods and conclusions as overly restrictive. In light of your evaluation of our work, we have revised the title to: “Avian-specific Salmonella transition to endemicity is accompanied by localized resistome and mobilome interaction” We believe this final version not only reflects the applicability of our conclusions, as you appreciated, but also addresses your previous suggestion to highlight the resistome and mobilome.
Revisions in the manuscript Lines: 1-3
Weaknesses:
While the isolates came from 16 countries, most strains in this study were originally from China.
We believe that this issue was discussed in detail in our previous response. Although potential bias exists, we have minimized its impact by constructing the largest global S. Gallinarum genome dataset to date. In addition, we have further emphasized these limitations in the manuscript.
Comments on revisions:
This reviewer is happy with the detailed responses from the authors regarding revising this manuscript. I do not have further comments.
We greatly appreciate your positive feedback and are pleased that our responses have addressed your concerns.
Reviewer #2 (Public review):
Summary:
The authors sequence 45 new samples of S. Gallinarum, a commensal Salmonella found in chickens, which can sometimes cause disease. They combine these sequences with around 500 from public databases, determine the population structure of the pathogen, and coarse relationships of lineages with geography. The authors further investigate known anti-microbial genes found in these genomes, how they associate with each other, whether they have been horizontally transferred, and date the emergence of clades.
Strengths:
- It doesn't seem that much is known about this serovar, so publicly available new sequences from a high burden region are a valuable addition to the literature.
- Combining these sequences with publicly available sequences is a good way to better contextualise any findings.
- The genomic analyses have been greatly improved since the first version of the manuscript, and appropriately analyse the population and date emergence of clades.
- The SNP thresholds are contextualised in terms of evolutionary time.
- The importance and context of the findings are fairly well described.
Thank you so much for your thorough review and constructive comments on the manuscript.
Weaknesses:
- There are still a few issues with the genomic analyses, although they no longer undermine the main conclusions:
We are grateful for the valuable time and effort you have dedicated to improving our manuscript. In this revision, we have provided a point-by-point response to each of your concerns. Moreover, with the addition of new supplementary materials and modifications to the figures, we have re-examined and adjusted the numbering of figures and supplementary materials in the text to ensure they appear correctly in the manuscript.
(1) Although the SNP distance is now considered in terms of time, the 5 SNP distance presented still represents ~7yrs evolution, so it is unlikely to be a transmission event, as described. It would be better to use a much lower threshold or describe the interpretation of these clusters more clearly. Bringing in epidemiological evidence or external references on the likely time interval between transmissions would be helpful.
We sincerely thank you for highlighting this issue. We appreciate your concern regarding the use of a 5-SNP threshold to define a transmission event, especially given the approximate 7-year evolutionary timeframe. Considering our updated estimate for the evolutionary rate of S. Gallinarum (approximately 0.74 SNPs per year, with a 95% HPD range of 0.42 to 1.06), we have revised the manuscript to use a 2-SNP threshold (approximately representing less than two years of evolution) to better control the temporal span of transmission events. In addition, we have updated the manuscript to reflect this new threshold and demonstrated that the use of a more stringent SNP threshold does not affect the overall conclusions of the study.
Specifically, we adopted the newly established 2-SNP threshold to update Figure 3a and corresponding Supplementary Figure 8. The heatmap on the far right of New Figure 3a illustrates the SNP distances among 45 newly isolated S. Gallinarum strains from two locations in Zhejiang Province (Taishun and Yueqing). New Supplementary Figure 8 simulates potential transmission events between the bvSP strains isolated from Zhejiang Province (n=95) and those from other regions of China with available provincial information (n=435). These analyses collectively demonstrate the localized transmission patterns of bvSP within China.
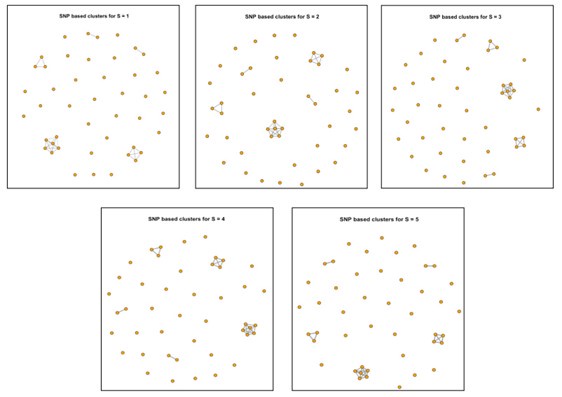
For New Figure 3a, we found that even with the 2-SNP threshold, the number of potential transmission events among the 45 newly isolated S. Gallinarum strains from the two Zhejiang locations (Taishun and Yueqing) remains unchanged. In fact, we observed that the results from SNP tracing using an SNP threshold of less than 5 are consistent (see Author response image 1).
Author response image 1.
Clustering results of 45 newly isolated S. Gallinarum strains using different SNP thresholds of 1, 2, 3, 4, and 5 SNPs. The five subplots represent the clustering results under each threshold. Each point corresponds to an individual strain, and lines connect strains with potential transmission relationships.
For New Supplementary Figure 8, we employed the 2-SNP threshold and found that the number of transmission events between the bvSP strains isolated from Zhejiang Province (n=95) and those from other Chinese provinces (n=435) decreased from 91 to 53. The names of the strains involved in these potential transmission events are listed in Supplementary Table 5.
Revisions in the manuscript
Lines: 352-357
Figures: Figure 3; Supplementary Figure 8
Table: Supplementary Table 5
(2) The HGT definition has not fundamentally been changed and therefore still has some issues, mainly that vertical evolution is still not systematically controlled for.
We sincerely thank you for highlighting this issue. We hope the following explanation will help clarify and improve our manuscript, as well as address your concerns.
In bacteria, mobile genetic elements (MGEs) such as plasmids, transposons, integrons, and prophages, as mentioned in our manuscript, are segments of DNA that encode enzymes and proteins responsible for mediating the movement of genetic material between bacterial genomes (commonly referred to as “jumping genes”). These MGEs contribute to the mechanisms of horizontal gene transfer (HGT) in Salmonella, including transduction (via prophages), conjugation (via plasmids), and transposition (via integrons and transposons) (Nat Rev Microbiol. 2005 Sep;3(9):722-32). These “jumping genes” can enable Salmonella to acquire additional antimicrobial resistance genes (ARGs), which may not only originate from other Salmonella strains but also from distantly related species.
To further address your concern regarding the systematic control of vertical evolution, we employed the HGTphyloDetect pipeline developed by Le Yuan et al. (Brief Bioinform. 2023 Mar 19;24(2):bbad035) to control for vertical evolution in the ARG sequences mentioned in our manuscript. We chose HGTphyloDetect because, as noted, "jumping genes" often occur among evolutionarily distant species, rendering the use of Gubbins potentially unsuitable for these distant HGT events.
Using the HGTphyloDetect pipeline, we extracted base sequences for the eight ARGs shown in Figure 6b with an HGT frequency greater than zero (blaTEM-1B, sul1, dfrA17, aadA5, sul2, aph(3’’)-Ib, tet(A), aph(6)-Id). For blaTEM-1B, sul1, dfrA17, aadA5, and sul2, the HGT frequency reached 100% across different isolates, indicating that these ARG sequences have a unique sequence type. In contrast, due to the ResFinder settings requiring both similarity and coverage to meet a minimum value of 90%, the base sequences for aph(3’’)-Ib, tet(A), and aph(6)-Id are not unique. Consequently, we applied the HGTphyloDetect pipeline individually to each sequence type of ARGs to verify their association with HGT events. Specifically, among 436 bvSP isolates collected in China, we identified two sequence types of aph(3’’)-Ib, four sequence types of tet(A), and three sequence types of aph(6)-Id.
Subsequently, to identify potential ARGs horizontally acquired from evolutionarily distant organisms, we queried the translated amino acid sequences of each ARG against the National Center for Biotechnology Information (NCBI) non-redundant protein database. We then evaluated whether these sequences were products of HGT by calculating Alien Index (AI) scores and out_perc values.
The calculation of AI score is as follows:

In this study, bbhG and bbhO represent the E-values of the best blast hit in ingroup and outgroup lineages, respectively. The outgroup lineage is defined as all species outside of the kingdom, while the ingroup lineage encompasses species within the kingdom but outside of the subphylum. An AI score ≥ 45 is considered a strong indicator that the gene in question is likely derived from an HGT event.
Regarding the calculation method for out_perc:

Finally, according to the definition provided by the HGTphyloDetect pipeline, ARGs with AI score ≥ 45 and out_perc ≥ 90% are presumed to be potential candidates for HGT from evolutionarily distant species. We have compiled the calculation results for the aforementioned genes in New Supplementary Table 9. The results indicate that all ARGs presented in Figure 6b, which exhibited a HGT frequency greater than zero, were acquired horizontally by S. Gallinarum. Based on these findings, we have revised the manuscript accordingly.
Revisions in the manuscript
Lines: 302-307; 616-650; 955-957
Table: Supplementary Table 9
Using a 5kb window is not sufficient, as LD may extend across the entire genome.
We agree with your point that linkage disequilibrium (LD) could influence the transmission of genes within chromosomal regions. LD can lead to the non-random cooccurrence of alleles at different loci within a population. Considering that horizontal gene transfer (HGT) events involving more distantly related ARGs may be accompanied by vertical propagation on chromosomes, and to simultaneously assess the impact of LD, we conducted two evaluations.
It is important to note that the following assessments are based on the assumption that plasmid replicons detected by PlasmidsFinder are part of self-replicating, extrachromosomal DNA.
(1) In the revised pipeline used to calculate ARG HGT frequencies, we categorized a total of 621 ARGs carried by 436 bvSP isolates collected in China and found that 415 of these ARGs were located on MGEs. We further investigated the distribution of these 415 ARGs across different MGEs, taking into account the complex nesting relationships among them. We observed that 90% of the ARGs (372/415) were located on plasmid contigs. It is important to clarify that this finding does not contradict our statement in the manuscript regarding plasmids and transposons as the primary reservoirs for resistome geo-temporal dissemination. This is because transposons, integrons, and prophages carrying ARGs can also be found on plasmids. Additionally, only 25 bvSG isolates from China contained ARGs, which were likely acquired via transposons or integrons located on the chromosome.
(2) In our manuscript, we searched for ARGs within a 5kb upstream and downstream region (a total of 10kb) of transposons and integrons (The BLASTn parameters used in the Bacant pipeline to identify transposons and integrons were set to a coverage threshold of 60%, rather than 100%). However, in light of the potential impact of LD on vertical transmission, we expanded our search to include a 10kb upstream and downstream range (a total of 20kb) for these 25 isolates. The decision to expand the search range to 10kb upstream and downstream range is based on the following two considerations: 1) Based on literature, we determined the overall lengths of the integrons and transposons carried by the 25 isolates (Tn801, Tn6205, Tn1721, In498, In1440, In473, and In282), and found that the maximum length of these elements is ~13.5 kb. Using a 10kb upstream and downstream threshold effectively covers these integrons/transposons. 2) The limitation posed by genomic fragmentation due to next-generation sequencing, which restrict the search range. We present the results of this expanded search for colocalization of ARGs with transposons and integrons at: Figshare: https://doi.org/10.6084/m9.figshare.28129130.v1
We found that these results were consistent with those obtained using the previous search range.
Taken together, these results suggest that although linkage disequilibrium may influence genetic processes within chromosomal regions—particularly for the few chromosomeassociated antibiotic resistance genes linked to integrons and transposons—the overall impact in our study is likely minimal. This conclusion is supported by the observation that 90% of the ARGs in our dataset are located on plasmids, and even an expanded search range does not alter this outcome. Additionally, by incorporating Alien Index scores and calculating out_perc, we can further confirm the occurrence of horizontal gene transfer events.
However, it is undeniable that other studies using our current pipeline may be affected. As a temporary remedial measure, we have included a note in the "README" file as below (https://github.com/tjiaa/Cal_HGT_Frequency):
“Note: Considering that ARGs located on the chromosome and carried by mobile genetic elements—such as integrons and transposons—may introduce potential computational errors, we recommend evaluating the number of ARGs associated with these elements on the chromosome during your analysis. If a majority of ARGs in your dataset fall into this category, we suggest using additional methods to evaluate the potential impact of linkage disequilibrium. Additionally, by modifying the “MGE_start” and “MGE_end” parameters in the “eLife_MGE_ARG_Co_location.ipynb” script, you can assess the distance between different ARGs and integrons or transposons on the chromosome. This approach will further aid in evaluating the impact of linkage disequilibrium on the genetic process.”
We believe this approach will assist researchers in further assessing the potential impact of vertical evolution and help other users determine whether additional methods are necessary to account for such effects.
As the authors have now run gubbins correctly, they could use the results from this existing analysis to find recent HGT.
We sincerely thank you for your valuable suggestion. Utilizing additional methods to predict potential horizontal gene transfer (HGT) events could indeed enhance the robustness of the results. However, "jumping genes" often occur among evolutionarily distant species, rendering the use of Gubbins potentially unsuitable for these distant HGT events.
Furthermore, the primary focus of our study is to identify HGT of antimicrobial resistance genes (ARGs) in the Salmonella genome driven by mobile genetic elements. Therefore, we employed the HGTphyloDetect pipeline developed by Le Yuan et al. (Brief Bioinform. 2023 Mar 19;24(2):bbad035) to control for vertical evolution in the ARG sequences. The specific computational methods and conclusions have been detailed above.
To definite mobilisation, perhaps a standard pipeline such (e.g. https://github.com/EBIMetagenomics/mobilome-annotation-pipeline) would be more convincing.
Thank you for your valuable suggestion. We agree that defining mobilization using a standardized pipeline can add rigor and clarity to our analysis. The pipeline you referenced (https://github.com/EBI-Metagenomics/mobilome-annotation-pipeline) is an excellent resource and provides a robust approach to the identification and annotation of mobile genetic elements.
We have examined and run this pipeline, which uses “IntegronFinder” and “ICEfinder” to detect integrons, “geNomad” to identify plasmids, and “geNomad” and “VIRify” to detect prophages. Our initial checks revealed that the numbers of integrons, plasmids, and prophages identified using this pipeline were consistent with those detected in our study. However, due to the significantly different output formats, the results from this pipeline could not be integrated with the pipeline we used for calculating HGT frequency.
We will incorporate the standardized pipeline you suggested in future studies to further improve the reliability of our findings.
(3) The invasiveness index is better described, but the authors still did not provide convincing evidence that the small difference is actually biologically meaningful (there was no statistical difference between the two strains provided in response Figure 6). What do other Salmonella papers using this approach find, and can their links be brought in? If there is still no good evidence, a better description of this difference would help make the conclusions better supported.
We sincerely appreciate your thoughtful feedback. The initial introduction of the invasiveness index in our manuscript aimed to quantitatively assess the differences in invasiveness between two geographically distinct strains of S. Gallinarum (isolated from Taishun and Yueqing) by comparing the degradation of 196 top predicted genes associated with invasiveness in their genomes. We found a highly significant statistical difference (P < 0.0001) in the invasiveness index between them.
Several studies have also employed the invasiveness index to predict biological relevance in Salmonella strains, and we believe these examples provide further context for our approach:
(1) Caisey V. Pulford et al, Nat Microbiol, 2021, used the same method to calculate the invasiveness index for Salmonella Typhimurium and employed it to characterize the invasiveness of different lineage strains. They found that Salmonella in Lineage-3 exhibited the highest invasiveness index, suggesting an adaptation from an intestinal to a systemic lifestyle. The authors noted, "Although the invasiveness index cannot yet be experimentally validated, Salmonella isolates with different invasiveness indices produce distinct clinical symptoms in a human population (BMC Med. 2020 Jul 17; 18(1):212)". They emphasized the necessity of developing more robust methods to measure Salmonella invasiveness.
(2) Sandra Van Puyvelde et al, Nat Commun, 2019, reported that Salmonella Typhimurium sequence type 313 (ST313) lineage II.1 exhibited a higher invasiveness index compared to lineage II, suggesting that the two lineages might have distinct adaptations to an invasive lifestyle. Further experiments demonstrated significant differences between these lineages in terms of biofilm formation (A red dry and rough (RDAR) assay) and metabolic capacity for carbon compounds.
(3) Wim L. Cuypers et al, Nat Commun, 2023, calculated the invasiveness index for 284 global Salmonella Concord strains across different lineages and found that Lineage-4 potentially exhibited the highest invasiveness.
Given these evidences, we acknowledge that no significant difference in mortality was observed between the L2b and L3b S. Gallinarum strains in 16-day-old SPF chicken embryos. Existing literature suggests that strains with higher invasiveness indices may still exhibit differences in biofilm formation and metabolic capacities, reflecting their adaptation to different host environments. As such, we maintain that the invasiveness index remains a valuable metric for evaluating the genomic differences between S. Gallinarum strains from Taishun and Yueqing. We plan to further investigate these differences through phenotypic experiments in our next research.
In the revised manuscript, we have added the following discussion along with additional references:
Lines 358-365: “Moreover, the invasiveness index of bvSP from Taishun and Yueqing suggests that different lineages of S. Gallinarum recovered from distinct regions may exhibit biological differences. Previous studies have shown that strains with higher invasiveness indexes tend to be more virulent in hosts (30, 31), potentially causing neurological or arthritic symptoms in S. Gallinarum infections. Furthermore, strains with varying invasiveness indexes have been confirmed to differ in their biofilm formation abilities and metabolic capacities for carbon compounds (32).”
Revisions in the manuscript:
Lines: 358-365, 806-827.
In summary, the analysis is broadly well described and feels appropriate. Some of the conclusions are still not fully supported, although the main points and context of the paper now appear sound.
Thank you so much for your positive evaluation of our work. We hope that the revised manuscript meets your expectations and offers a more accurate interpretation of our findings.
Recommendations for the authors:
Reviewer #2 (Recommendations for the authors):
This is a great improvement over the first version and I thank the authors for a thorough response, as well as changing their conclusions in response to their improvements.
Other small remaining issues:
Figure 3: Heatmap of SNPs is hard to read in grayscale. It also just represents the between clade distances already shown by the tree. It would be more useful to present intraclade distances only to see the SNP resolution _within_ each lineage. Using a better colour scheme would also help.
Thank you for your insightful comments and suggestions regarding Figure 3. We agree that the grayscale heatmap may present challenges in terms of visual clarity. To address this, we have updated the heatmap with a more distinct color gradient, ensuring better contrast and easier interpretation (New Figure 3).
Regarding your second suggestion: "It would be more useful to present intraclade distances only to see the SNP resolution within each lineage," we believe it is already addressed in the current version of New Figure 3. Specifically, the heatmap on the right side of New Figure 3 illustrates the SNP distances between S. Gallinarum isolates from Taishun and Yueqing, with the goal of demonstrating that genomic variation within isolates from a single region is generally smaller compared to those from different regions. In this figure, 45 newly isolated S. Gallinarum strains are categorized into two lineages: L2b and L3b. The heatmap on the right side of Figure 3 displays the SNP distances between all pairwise combinations of these 45 strains, where the intraclade distances are represented by the red regions (highlighting the pairwise distances within each lineage, specifically L3b and L2b, which are indicated by two triangles). The between-clade distances are shown by the blue regions.
We also believe in further exploring the intraclade distances across the entire dataset of 580 S. Gallinarum strains, as it could provide additional insights. However, this analysis would extend beyond the scope of the current section.
Revisions in the manuscript Line: 998
Figure: Figure 3
Please remove Figure 6c, it does not add anything to the paper and raises questions about performing this regression.
Thank you for pointing out this issue. We have removed Figure 6c and the corresponding description in the "Results" section from the manuscript (New Figure 6).
Revisions in the manuscript Lines: 316, 319, 1035-1041.
Figure: Figure 6
Again, thank you all for your time and efforts in reviewing our work. We believe the improved manuscript meets the high standards of the journal.
-
-
-
eLife Assessment
This study uses a large dataset from both recent isolates and genomes in databases to provide an important analysis of the population structure of the pathogen Salmonella gallinarum. The authors present convincing results regarding the regional adaptation and the evolutionary trajectory of the resistome and mobilome, even though some issues regarding the genomic analysis could be improved. This work will interest microbiologists and researchers working on genomics, evolution, and antimicrobial resistance.
-
Reviewer #1 (Public review):
Summary:
The investigators in this study analyzed the dataset assembly from 540 Salmonella isolates, and those from 45 recent isolates from Zhejiang University of China. The analysis and comparison of the resistome and mobilome of these isolates identified a significantly higher rate of cross-region dissemination compared to localized propagation. This study highlights the key role of the resistome in driving the transition and evolutionary history of S. Gallinarum.
Strengths:
The isolates included in this study were from 16 countries in the past century (1920 to 2023). While the study uses S. Gallinarun as the prototype, the conclusion from this work will likely apply to other Salmonella serotypes and other pathogens.
Weaknesses:
While the isolates came from 16 countries, most strains in this study were …
Reviewer #1 (Public review):
Summary:
The investigators in this study analyzed the dataset assembly from 540 Salmonella isolates, and those from 45 recent isolates from Zhejiang University of China. The analysis and comparison of the resistome and mobilome of these isolates identified a significantly higher rate of cross-region dissemination compared to localized propagation. This study highlights the key role of the resistome in driving the transition and evolutionary history of S. Gallinarum.
Strengths:
The isolates included in this study were from 16 countries in the past century (1920 to 2023). While the study uses S. Gallinarun as the prototype, the conclusion from this work will likely apply to other Salmonella serotypes and other pathogens.
Weaknesses:
While the isolates came from 16 countries, most strains in this study were originally from China.
Comments on revisions:
This reviewer is happy with the detailed responses from the authors regarding revising this manuscript. I do not have further comments.
-
Reviewer #2 (Public review):
Summary:
The authors sequence 45 new samples of S. Gallinarum, a commensal Salmonella found in chickens, which can sometimes cause disease. They combine these sequences with around 500 from public databases, determine the population structure of the pathogen, and coarse relationships of lineages with geography. The authors further investigate known anti-microbial genes found in these genomes, how they associate with each other, whether they have been horizontally transferred, and date the emergence of clades.
Strengths:
- It doesn't seem that much is known about this serovar, so publicly available new sequences from a high burden region are a valuable addition to the literature.
- Combining these sequences with publicly available sequences is a good way to better contextualise any findings.
- The genomic …Reviewer #2 (Public review):
Summary:
The authors sequence 45 new samples of S. Gallinarum, a commensal Salmonella found in chickens, which can sometimes cause disease. They combine these sequences with around 500 from public databases, determine the population structure of the pathogen, and coarse relationships of lineages with geography. The authors further investigate known anti-microbial genes found in these genomes, how they associate with each other, whether they have been horizontally transferred, and date the emergence of clades.
Strengths:
- It doesn't seem that much is known about this serovar, so publicly available new sequences from a high burden region are a valuable addition to the literature.
- Combining these sequences with publicly available sequences is a good way to better contextualise any findings.
- The genomic analyses have been greatly improved since the first version of the manuscript, and appropriately analyse the population and date emergence of clades.
- The SNP thresholds are contextualised in terms of evolutionary time.
- The importance and context of the findings are fairly well described.Weaknesses:
- There are still a few issues with the genomic analyses, although they no longer undermine the main conclusions:
(1) Although the SNP distance is now considered in terms of time, the 5 SNP distance presented still represents ~7yrs evolution, so it is unlikely to be a transmission event, as described. It would be better to use a much lower threshold or describe the interpretation of these clusters more clearly. Bringing in epidemiological evidence or external references on the likely time interval between transmissions would be helpful.
(2) The HGT definition has not fundamentally been changed and therefore still has some issues, mainly that vertical evolution is still not systematically controlled for. Using a 5kb window is not sufficient, as LD may extend across the entire genome. As the authors have now run gubbins correctly, they could use the results from this existing analysis to find recent HGT. To definite mobilisation, perhaps a standard pipeline such (e.g. https://github.com/EBI-Metagenomics/mobilome-annotation-pipeline) would be more convincing.
(3) The invasiveness index is better described, but the authors still did not provide convincing evidence that the small difference is actually biologically meaningful (there was no statistical difference between the two strains provided in response Figure 6). What do other Salmonella papers using this approach find, and can their links be brought in? If there is still no good evidence, a better description of this difference would help make the conclusions better supported.
In summary, the analysis is broadly well described and feels appropriate. Some of the conclusions are still not fully supported, although the main points and context of the paper now appear sound.
-
Author response:
The following is the authors’ response to the original reviews.
Public Reviews:
Reviewer #1 (Public review):
Summary:
The investigators in this study analyzed the dataset assembly from 540 Salmonella isolates, and those from 45 recent isolates from Zhejiang University of China. The analysis and comparison of the resistome and mobilome of these isolates identified a significantly higher rate of cross-region dissemination compared to localized propagation. This study highlights the key role of the resistome in driving the transition and evolutionary
Thank you for summarizing our work. According to your comments, we carefully considered and responded to them and made corresponding revisions to the text. Additionally, to fully contextualize the background knowledge and clarify the major points in this study, we add some …
Author response:
The following is the authors’ response to the original reviews.
Public Reviews:
Reviewer #1 (Public review):
Summary:
The investigators in this study analyzed the dataset assembly from 540 Salmonella isolates, and those from 45 recent isolates from Zhejiang University of China. The analysis and comparison of the resistome and mobilome of these isolates identified a significantly higher rate of cross-region dissemination compared to localized propagation. This study highlights the key role of the resistome in driving the transition and evolutionary
Thank you for summarizing our work. According to your comments, we carefully considered and responded to them and made corresponding revisions to the text. Additionally, to fully contextualize the background knowledge and clarify the major points in this study, we add some references.
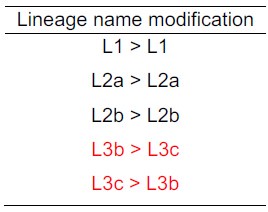
Upon further review of our initial manuscript, we realized that the original submission did not strictly follow the lineage order proposed by Zhou et al. (Natl Sci Rev. 2023 Sep 2;10(10):nwad228). To avoid confusion and keep the uniform knowledge in the typing system, we have adjusted the lineage nomenclature along the revised manuscript to reflect the corrected order as follows:
Author response table 1.
To ensure consistency with previous studies, we have revised the nomenclature for the different lineages of bvSP.
Strengths:
The isolates included in this study were from 16 countries in the past century (1920 to 2023). While the study uses S. Gallinarun as the prototype, the conclusion from this work will likely apply to other Salmonella serotypes and other pathogens.
Thanks for the constructive comments and the positive reception of the manuscript.
Weaknesses:
While the isolates came from 16 countries, most strains in this study were originally from China.
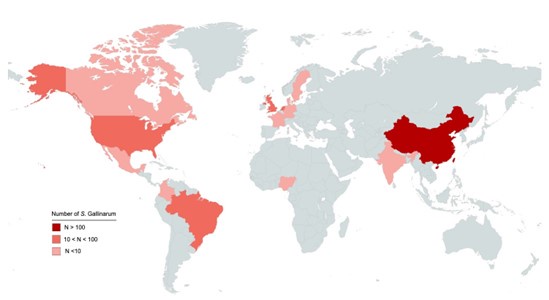
We appreciate the reviewer's observation regarding the sampling distribution of isolates in this study. We acknowledge that while the isolates were collected from 15 different countries, with a significant proportion originated from China (Author response image 1). This focus is due to several reasons:
Author response image 1.
Geographic distribution of 580 S. Gallinarum. Different colors indicate the countries of origin for the 580 S. Gallinarum strains in the dataset. Darker shades represent higher numbers of strains.
(1) As once a globally prevalent pathogen across the 20th century, S. Gallinarum was listed by the World Organization for Animal Health (WOAH) due to its economic importance. After 30 years of implementation of the National Poultry Improvement Plan in the US, it was almost eradicated in high-income countries, and interestingly, it became an endemic pathogen with sporadic outbreaks in most low- or middle-income countries like China and Brazil. Given the vast expanse of China's land area and the country's economic factors, implementing the same measures remains challenging.
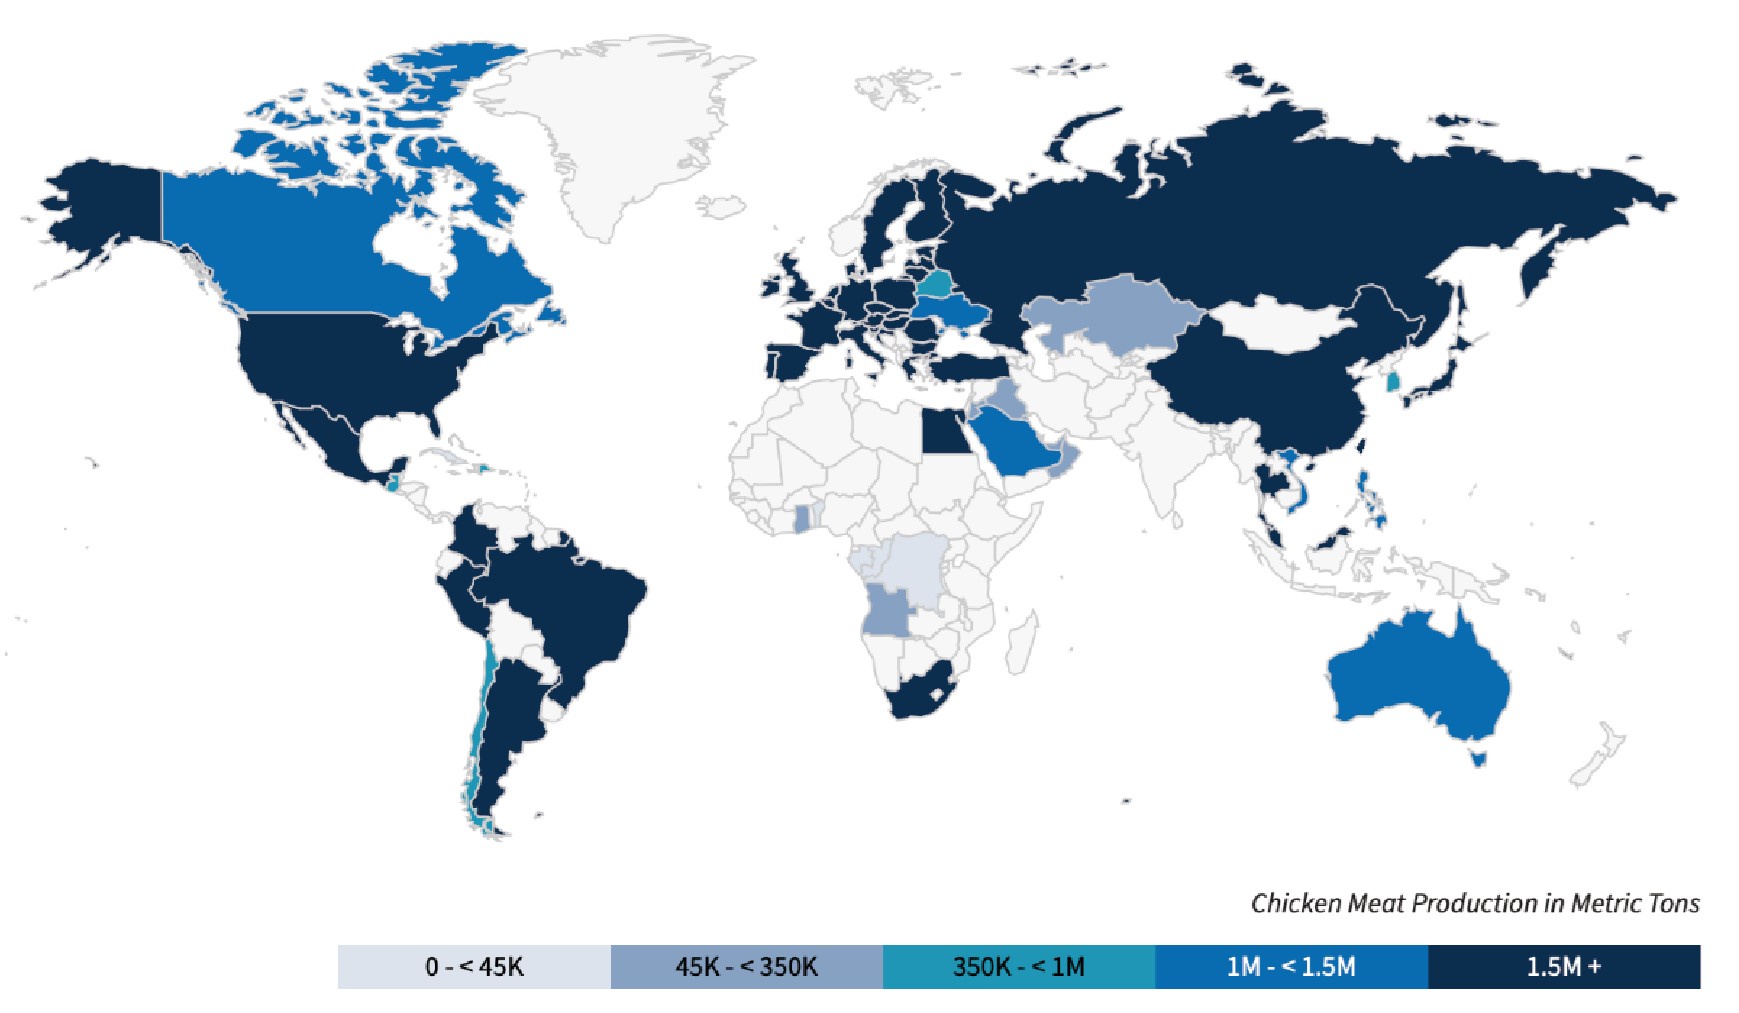
(2) S. Gallinarum is an avian-specific pathogen, particularly affecting chickens, and its distribution is closely linked to chicken meat production in different countries. There are more frequent reports of fowl typhoid in some high chicken-producing developing countries. Data from the United States Department of Agriculture (USDA) on annual chicken meat production for 2023/2024 show that the global distribution of S. Gallinarum aligns closely with the overall chicken meat production of these countries (https://fas.usda.gov/data/production/commodity/0115000).
Author response image 2.
The United States Department of Agriculture (USDA) data on annual chicken meat production for 2023/2024 across different countries globally.
(3) Our primary objective was to investigate the localized resistome adaptation of S. Gallinarum in regions. Being a region with significant disease burden, China has reported numerous outbreaks (Sci Data. 2022 Aug 13;9(1):495; Sci Data. 2024 Feb 27;11(1):244) and a high AMR prevalence of this serovar (Natl Sci Rev. 2023 Sep 2;10(10):nwad228; mSystems. 2023 Dec 21;8(6):e0088323), making it an excellent example for understanding localized resistance mechanisms.
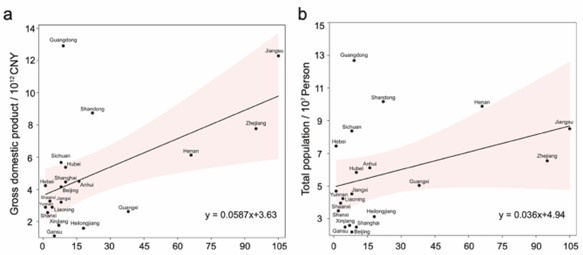
(4) As China is the primary country of origin for the strains in this study, it is necessary to ensure that the strains from China are consistent with the local geographic characteristics of the country. Therefore, we conducted a correlation analysis between the number of strains from different provinces in China and the total GDP/population size of those provinces (Author response image 3). The results show that most points fall within the 95% confidence interval of the regression line. Although some points exhibit relative unbalance in the number of S. Gallinarum strains, most data points for these regions have a small sample size (n < 15). Overall, we found that the prevalence of S. Gallinarum in different regions of China is consistent with the overall nationwide trend.
Author response image 3.
Correlation analysis between the number of S. Gallinarum collected from different provinces in China and the total GDP/population size. The figure depicts a series of points representing individual provinces. The x-axis indicates the number of S. Gallinarum included in the dataset, while the y-axis displays the values for total GDP and total population size, respectively.
Nevertheless, a search of nearly a decade of literature on PubMed and a summary of the S. Gallinarum genome available on public databases indicate that the dataset used is the most complete. Furthermore, focusing on a specific region within China allowed us to conduct a detailed and thorough analysis. However, we highly agree that expanding the study to include more isolates from other countries would enhance the generalizability of our findings, and we are actively collecting additional S. Gallinarum genome data. In the revised manuscript, we have further emphasized the limitations as follow:
Lines 427-429: “However, the current study has some limitations. Firstly, despite assembling the most comprehensive WGS database for S. Gallinarum from public and laboratory sources, there are still biases in the examined collection. The majority (438/580) of S. Gallinarum samples were collected from China, possibly since the WGS is a technology that only became widely available in the 21st century. This makes it impractical to sequence it on a large scale in the 20th century, when S. Gallinarum caused a global pandemic. So, we suspect that human intervention in the development of this epidemic is the main driving force behind the fact that most of the strains in the data set originated in China. In our future work, we aim to actively gather more data to minimize potential biases within our dataset, thereby improving the robustness and generalizability of our findings.”
Reviewer #2 (Public review):
Summary:
The authors sequence 45 new samples of S. Gallinarum, a commensal Salmonella found in chickens, which can sometimes cause disease. They combine these sequences with around 500 from public databases, determine the population structure of the pathogen, and coarse relationships of lineages with geography. The authors further investigate known anti-microbial genes found in these genomes, how they associate with each other, whether they have been horizontally transferred, and date the emergence of clades.
Thank you for your constructive suggestions, which are valuable and highly beneficial for improving our paper. According to your comments, we carefully considered and responded to them and made corresponding revisions to the text. Furthermore, to fully contextualize the background knowledge and clarify the major points in this study, we add some references to support our findings and policy implications.
Upon further review of our initial manuscript, we realized that the original submission did not strictly follow the lineage order proposed by Zhou et al. (Natl Sci Rev. 2023 Sep 2;10(10):nwad228). To avoid confusion in the typing system, we have adjusted the lineage nomenclature in the revised manuscript to reflect the corrected order (see Author response table 1).
Strengths:
(1) It doesn't seem that much is known about this serovar, so publicly available new sequences from a high-burden region are a valuable addition to the literature.
(2) Combining these sequences with publicly available sequences is a good way to better contextualise any findings.
Thank you so much for your thorough review and constructive comments on the manuscript.
Weaknesses:
There are many issues with the genomic analysis that undermine the conclusions, the major ones I identified being:
(1) Recombination removal using gubbins was not presented fully anywhere. In this diversity of species, it is usually impossible to remove recombination in this way. A phylogeny with genetic scale and the gubbins results is needed. Critically, results on timing the emergence (fig2) depend on this, and cannot be trusted given the data presented.
We sincerely thank you for pointing out this issue. In the original manuscript, we aimed to present different lineages of S. Gallinarum within a single phylogenetic tree constructed using BEAST. However, in the revised manuscript, we have addressed this issue by applying the approach recommended by Gubbins to remove recombination events for each lineage defined by FastBAPs. Additionally, to better illustrate the removal of recombination regions in the genome, we have included a figure generated by Gubbins (New Supplementary Figure 12).
Our results indicate that recombination events are relatively infrequent in Lineage 1, followed by Lineage 3, but occur more frequently in Lineage 2. In the revised manuscript, we have included additional descriptions in the Methods section to clarify this analysis. We hope these modifications adequately address the reviewer’s concerns and enhance the trustworthiness of our findings.
(2) The use of BEAST was also only briefly presented, but is the basis of a major conclusion of the paper. Plot S3 (root-to-tip regression) is unconvincing as a basis of this data fitting a molecular clock model. We would need more information on this analysis, including convergence and credible intervals.
Thank you very much for raising this issue. We decided to reconduct separate BEAST analyses for each lineage, accurately presenting the evolutionary scale based on the abovementioned improvements. The implementation of individual lineage for BEAST analysis was conducted based on the following steps:
(1) Using R51 as the reference, a reference-mapped multiple core-genome SNP sequence alignment was created, and recombination regions were detected and removed as described above.
(2) TreeTime was used to assess the temporal structure by performing a regression analysis of the root-to-tip branch distances within the maximum likelihood tree, considering the sampling date as a variable (New Supplementary Figures 6). However, the root-to-tip regression analysis presented in New Supplementary Figures 6 was not intended as a basis for selecting the best molecular clock model; its purpose was to clean the dataset with appropriate measurements.
(3) To determine the optimal model for running BEAST, we tested a total of six combinations in the initial phase of our study. These combinations included the strict clock, relaxed lognormal clock, and three population models (Bayesian SkyGrid, Bayesian Skyline, and Constant Size). Before conducting the complete BEAST analysis, we evaluated each combination using a Markov Chain Monte Carlo (MCMC) analysis with a total chain length of 100 million and sampling every 10,000 iterations. We then summarized the results using NSLogAnalyser and determined the optimal model based on the marginal likelihood value for each combination. The results indicated that the model incorporating the Bayesian Skyline and the relaxed lognormal clock yielded the highest marginal likelihood value in our sample. Then, we proceeded to perform a timecalibrated Bayesian phylogenetic inference analysis for each lineage. The following settings were configured: the "GTR" substitution model, “4 gamma categories”, the "Relaxed Clock Log Normal" model, the "Coalescent Bayesian Skyline" tree prior, and an MCMC chain length of 100 million, with sampling every 10,000 iterations.
(4) Convergence was assessed using Tracer, with all parameter effective sampling sizes (ESS) exceeding 200. Maximum clade credibility trees were generated using TreeAnnotator. Finally, key divergence time points (with 95% credible intervals) were estimated, and the tree was visualized using FigTree.
For the key lineages, L2b and L3b (carrying the resistome, posing antimicrobial resistance (AMR) risks, and exhibiting intercontinental transmission events), we have redrawn Figure 2 based on the updated BEAST analysis results (New Figure 2). For L1, L2a, and L3c, we have added supplementary figures to provide a more detailed visualization of their respective BEAST analysis outcomes (New Supplementary Figures 3-5). The revised BEAST analysis indicates that the origin of L3b in China can be traced back to as early as 1683 (95% CI: 1608 to 1839). In contrast, the earliest possible origin of L2b in China dates back to 1880 (95% CI: 1838 to 1902). This indicates that the previous manuscript's assumption that L2b is an older lineage compared to L3b may be inaccurate.
Furthermore, In the revised manuscript, we specifically estimated the time points for the first intercontinental transmission events for the two major lineages, L2b and L3b. Our results indicate that L2b, likely underwent two major intercontinental transmission events. The first occurred around 1893 (95% CI: 1870 to 1918), with transmission from China to South America. The second major transmission event occurred in 1923 (95% CI: 1907 to 1940), involving the spread from South America to Europe. In contrast, the transmission pattern of L3b appears relatively more straightforward. Our findings show that L3b, an S. Gallinarum lineage originating in China, only underwent one intercontinental transmission event from China to Europe, likely occurring around 1790 (95% CI: 1661 to 1890) (New Supplementary Figure 7). Based on the more critical BEAST analysis for each lineage, we have revised the corresponding conclusions in the manuscript. We believe that the updated BEAST analysis, performed using a more accurate recombination removal approach, significantly enhances the rigor and credibility of our findings.
(3) Using a distance of 100 SNPs for a transmission is completely arbitrary. This would at least need to be justified in terms of the evolutionary rate and serial interval.
Using single nucleotide polymorphism (SNP) distance to trace pathogen transmission is a common approach (J Infect Dis. 2015 Apr 1;211(7):1154-63) and in our previous studies (hLife 2024; 2(5):246-256. mLife 2024; 3(1):156-160.). When the SNP distance within a cluster falls below a set threshold, the strains in that cluster are considered to have a potential direct transmission link. It is generally accepted that the lower the threshold, the more stringent the screening process becomes. However, there is little agreement in the literature regarding what such a threshold should be, and the appropriate SNP cut-off for inferring transmission likely depends critically on the context (Mol Biol Evol. 2019 Mar 1;36(3):587-603).
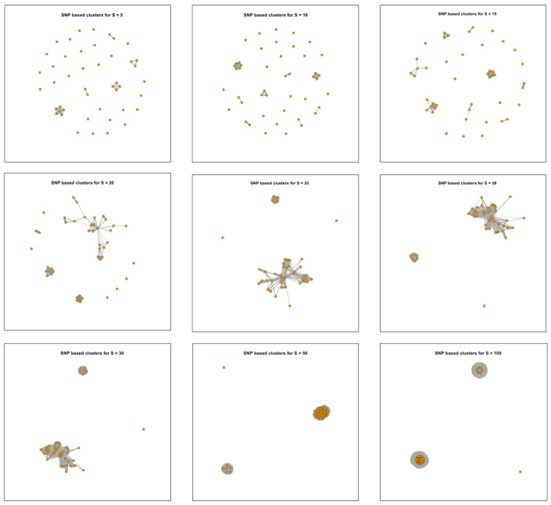
In this study, we compared various thresholds (SNPs = 5, 10, 20, 25, 30, 35, 40, 50, 100) to ensure clustering in an appropriate manner. First, we summarized the tracing results under each threshold (Author response image 4), which demonstrated that, regardless of the threshold used, all strains associated with transmission events originated from the same location (New Figure 3a).
Author response image 4.
Clustering results of 45 newly isolated S. Gallinarum strains using different SNP thresholds of 5, 10, 15, 20, 25, 28, 30, 50, and 100 SNPs. The nine subplots represent the clustering results under each threshold. Each point corresponds to an individual strain, and lines connect strains with potential transmission relationships.
In response to your comments regarding the evolutionary rate, we estimated the overall evolutionary rate of the S. Gallinarum using BEAST. We applied the methodology described by Arthur W. Pightling et al. (Front Microbiol. 2022 Jun 16; 13:797997). The numbers of SNPs per year were determined by multiplying the evolutionary rates estimated with BEAST by the number of core SNP sites identified in the alignments. We hypothesize that a slower evolutionary rate in bacteria typically requires a lower SNP threshold when tracing transmission events using SNP distance analysis. Pightling et al.'s previous research found an average evolutionary rate of 1.97 SNPs per year (95% HPD, 0.48 to 4.61) across 22 different Salmonella serotypes. Our updated BEAST estimation for the evolutionary rate of S. Gallinarum suggests it is approximately 0.74 SNPs per year (95% HPD, 0.42 to 1.06). Based on these findings, and our previous experience with similar studies (mBio. 2023 Oct 31;14(5):e0133323.), we set a threshold of 5 SNPs in the revised manuscript.
Then, we adopted the newly established SNP distance threshold (n=5) to update Figure 3a and New Supplementary Figure 8. The heatmap on the far right of New Figure 3a illustrates the SNP distances among 45 newly isolated S. Gallinarum strains from two locations in Zhejiang Province (Taishun and Yueqing). New Supplementary Figure 8 simulates potential transmission events between the bvSP strains isolated from Zhejiang Province (n=95) and those from China with available provincial information (n=435). These analyses collectively demonstrate the localized transmission pattern of bvSP within China. Our analysis using the newly established SNP threshold indicates that the 45 strains isolated from Taishun and Yueqing exhibit a highly localized transmission pattern, with pairs of strains exhibiting potential transmission events below the set threshold occurring exclusively within a single location. Subsequently, we conducted the SNP distance-based tracing analysis for the 95 strains from Zhejiang Province and those from China with available provincial information (n=435) (New Supplementary Figure 8, New Supplementary Table S8). Under the SNP distance threshold (n=5), we identified a total of 91 potential transmission events, all of which occurred exclusively within Zhejiang Province. No inter-provincial transmission events were detected. Based on these findings, we revised the methods and conclusions in the manuscript accordingly. We believe that the updated version well addresses your concerns.
Nevertheless, the final revised and updated results do not change the conclusions presented in our original manuscript. Instead, applying a more stringent SNP distance threshold allows us to provide solid evidence supporting the localized transmission pattern of S. Gallinarum in China.
(4) The HGT definition is non-standard, and phylogeny (vertical inheritance) is not controlled for.
The cited method:
'In this study, potentially recently transferred ARGs were defined as those with perfect identity (more than 99% nucleotide identity and 100% coverage) in distinct plasmids in distinct host bacteria using BLASTn (E-value {less than or equal to}10−5)'
This clearly does not apply here, as the application of distinct hosts and plasmids cannot be used. Subsequent analysis using this method is likely invalid, and some of it (e.g. Figure 6c) is statistically very poor.
Thank you for raising this important question. In our study, Horizontal Gene Transfer (HGT) is defined as the transfer of genetic information between different organisms, a process that facilitates the spread of antibiotic resistance genes (ARGs) among bacteria. This definition of HGT is consistent with that used in previous studies (Evol Med Public Health. 2015; 2015(1):193–194; ISME J. 2024 Jan 8;18(1):wrad032). In Salmonella, the transfer of antimicrobial resistance genes via HGT is not solely dependent on plasmids; other mobile genetic elements (MGEs), such as transposons, integrons, and prophages, also play significant roles. This has also been documented in our previous work (mSystems. 2023 Dec 21;8(6):e0088323). Given the involvement of various MGEs in the horizontal transfer of ARGs, we propose that the criteria for evaluating horizontal transfer via plasmids can also be applied to ARGs mediated by other MGEs.
In this study, we adopted stricter criteria than those used by Xiaolong Wang et al. Specifically, we defined two ARGs as identical only if they exhibited 100% nucleotide identity and 100% coverage. To address concerns regarding the potential influence of vertical inheritance in our analysis, we have made the following improvements. In the revised manuscript, we provide a more detailed table that includes the co-localization analysis of each ARG with mobile genetic elements (New Supplementary Table 9). For prophages and plasmids, we required that ARGs be located directly within these elements. In contrast, for transposons and integrons, we considered ARGs to be associated if they were located within a 5 kb region upstream or downstream of these elements (Nucleic Acids Res. 2022 Jul 5;50(W1):W768-W773).
In the revised manuscript, we first categorized a total of 621 ARGs carried by 436 bvSP isolates collected in China according to the aforementioned criteria and found that 415 ARGs were located on MGEs. After excluding the ARGs not associated with MGEs, we recalculated the overall HGT frequency of 10 types of ARGs in China, the horizontal ARGs transfer frequency in three key regions, and the horizontal ARGs transfer frequency within a single region (New Supplementary Table 7). Based on the results, we updated relevant sections of the manuscript and remade Figure 6. The updated manuscript describes the results of this section as follows:
“Horizontal transfer of resistome occurs widely in localized bvSP
Horizontal transfer of the resistome facilitates the acquisition of AMR among bacteria, which may record the distinct acquisition event in the bacterial genome. To compare these events in a geographic manner, we further investigated the HGT frequency of each ARG carried by bvSP isolated from China and explored the HGT frequency of resistome between three defined regions. Potentially horizontally transferred ARGs were defined as those with perfect identity (100% identity and 100% coverage) and were located on MGEs across different strains (Fig. 6a). We first categorized a total of 621 ARGs carried by 436 bvSP isolates collected in China and found that 415 ARGs were located on MGEs. After excluding the ARGs not associated with MGEs, our findings reveal that horizontal gene transfer of ARGs is widespread among Chinese bvSP isolates, with an overall transfer rate of 92%. Specifically, 50% of the ARGs exhibited an HGT frequency of 100%, indicating that these ARGs might underwent extensive frequent horizontal transfer events (Fig. 6b). It is noteworthy that certain resistance genes, such as tet(A), aph(3'')-Ib, and aph(6)-Id, appear to be less susceptible to horizontal transfer.
However, different regions generally exhibited a considerable difference in resistome HGT frequency. Overall, bvSP from the southern areas in China showed the highest HGT frequency (HGT frequency=95%). The HGT frequencies for bvSP within the eastern and northern regions of China are lower, at 92% and 91%, respectively (Fig. 6c). For specifical ARG type, we found tet(A) is more prone to horizontal transfer in the southern region, and this proportion was considerably lower in the eastern region. Interestingly, certain ARGs such as aph(6)-Id, undergo horizontal transfer only within the eastern and northern regions of China (Fig. 6d). Notably, as a localized transmission pathogen, resistome carried by bvSP exhibited a dynamic potential among inter-regional and local demographic transmission, especially from northern region to southern region (HGT frequency=93%) (Fig. 6e, Supplementary Table 7).”
We also modified the current version of the pipeline used to calculat the HGT frequency of resistance genes. In the revised pipeline, users are required to provide a file specifying the locations of mobilome on the genome before formally calculating the HGT frequency of the target ARGs. The specific code and data used in the calculation have been uploaded to https://github.com/tjiaa/Cal_HGT_Frequency.
However, we also acknowledge that the current in silico method has some limitations. This approach heavily relies heavily on prior information in existing resistome/mobilome databases. Additionally, the characteristics of second-generation sequencing data make it challenging to locate gene positions precisely. Using complete genome assemblies might be a crucial approach to address this issue effectively. In the revised manuscript, we have also provided a more detailed explanation of the implications of the current pipeline.
Regarding your second concern, "some of it (e.g., Figure 6c) is statistically very poor," the horizontal ARG transfer frequency calculation for each region was based on the proportion of horizontal transfer events of ARGs in that region to the total possible transfer events. As a result, we are unable to calculate the statistical significance between the two regions. Our aim with this approach is to provide a rough estimate of the extent of horizontal ARG transfer within the S. Gallinarum population in each region. In future studies, we will refine our conclusions by developing a broader range of evaluation methods to ensure more comprehensive assessment and validation.
(5) Associations between lineages, resistome, mobilome, etc do not control for the effect of genetic background/phylogeny. So e.g. the claim 'the resistome also demonstrated a lineage-preferential distribution' is not well-supported.
Thank you for your comments. We acknowledge that the associations between lineages and the mobilome/resistome may be influenced by the genetic background or phylogeny of the strains. For instance, our conclusion regarding the lineage-preferential distribution of the resistome was primarily based on New Figure 4a, where L3 is clearly shown to carry the most ARGs. Furthermore, we observed that L3b tends to harbor _bla_TEM-1B, sul2, and tet(A) more frequently than other lineages. However, we recognize that this evidence is insufficient to support a definitive conclusion of “demonstrated a lineage-preferential distribution”. Therefore, we have re-examined the current manuscript and described these findings as a potential association between the mobilome/resistome and lineages.
(6) The invasiveness index is not well described, and the difference in means is not biologically convincing as although it appears significant, it is very small.
Thank you for pointing this out. For the invasiveness index mentioned in the manuscript, we used the method described in previous studies. (PLoS Genet. 2018 May 8;14(5), Nat Microbiol. 2021 Mar;6(3):327-338). Specifically, Salmonella’s ability to cause intestinal or extraintestinal infections in hosts is related to the degree of genome degradation. We evaluated the potential for extraintestinal infection by 45 newly isolated S. Gallinarum strains (L2b and L3b) using a model that quantitatively assesses genome degradation. We analyzed samples using the 196 top predictor genes, employing a machine-learning approach that utilizes a random forest classifier and delta-bitscore functional variant-calling. This method evaluated the invasiveness of S. Gallinarum towards the host, and the distribution of invasiveness index values for each region was statistically tested using unpaired t-test. The code used for calculating the invasiveness index is available at https://github.com/Gardner-BinfLab/invasive_salmonella. In the revised manuscript, we added a more detailed description of the invasiveness index calculation in the Methods section as follows:
Lines 592-603: “Specifically, Salmonella’s ability to cause intestinal or extraintestinal infections in hosts is related to the degree of genome degradation. We evaluated the potential for extraintestinal infection by 45 newly isolated S. Gallinarum strains (L2b and L3b) using a model that quantitatively assesses genome degradation. We analyzed each sample using the 196 top predictor genes for measuring the invasiveness of S. Gallinarum, employing a machine-learning approach that utilizes a random forest classifier and deltabitscore functional variant-calling. This method evaluated the invasiveness of S. Gallinarum towards the host, and the distribution of invasiveness index values for each region was statistically tested using unpaired t-test. The code used for calculating the invasiveness index is available at: https://github.com/Gardner-BinfLab/invasive_salmonella.”
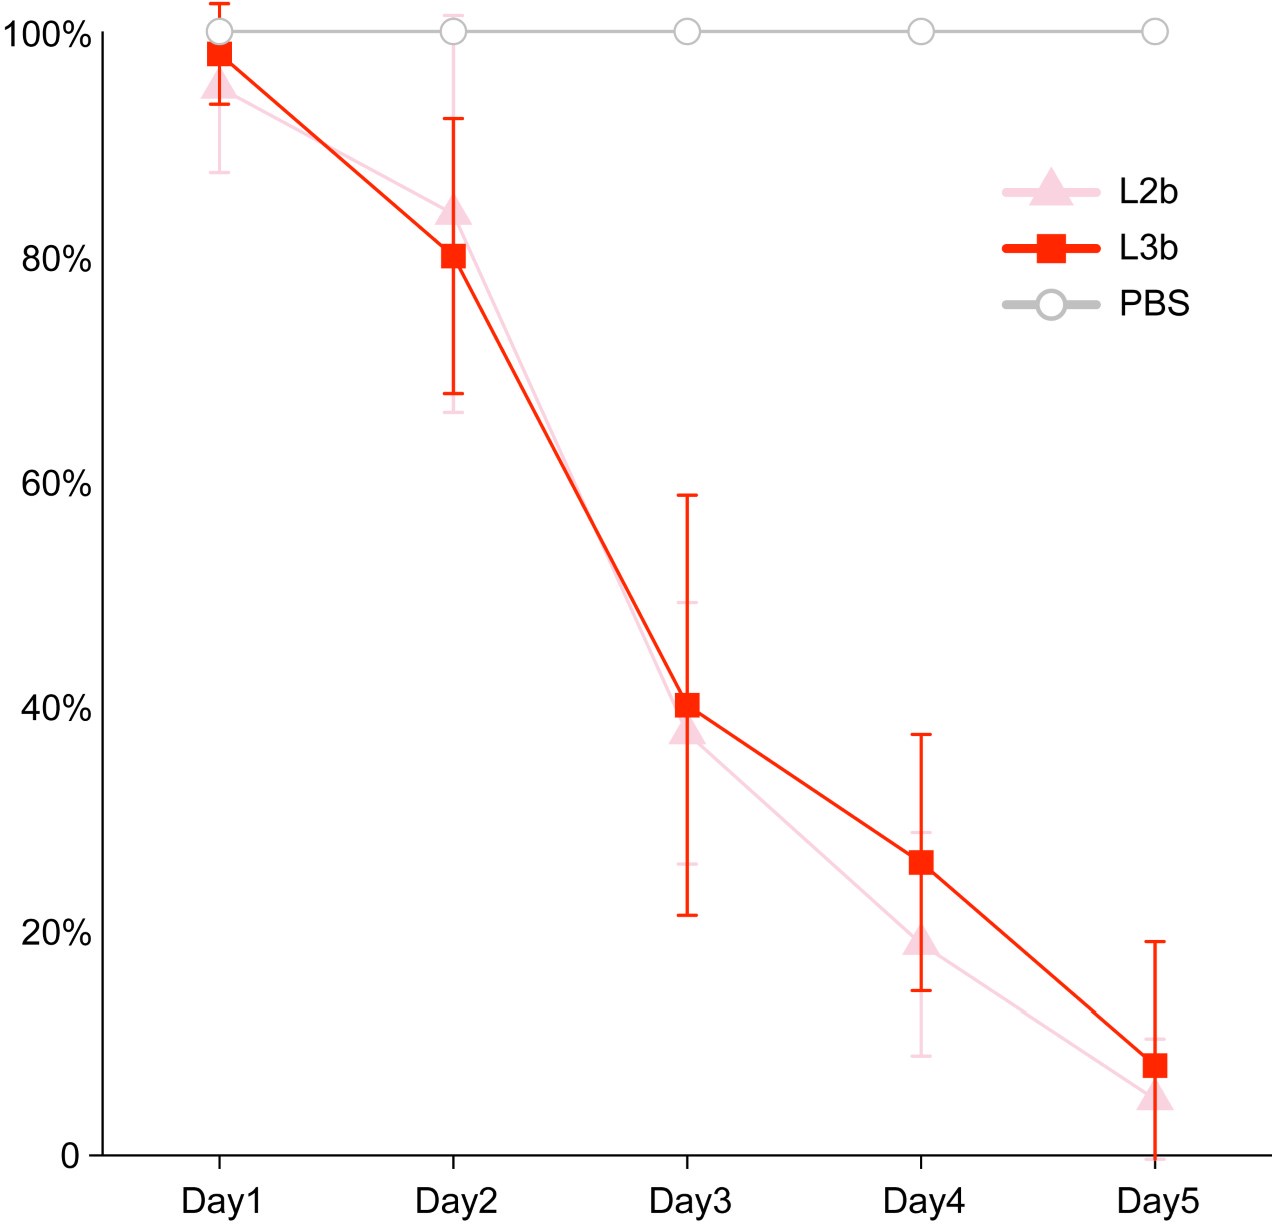
Regarding the second question, 'the difference in means is not biologically convincing as although it appears significant, it is very small,' we believe that this difference is biologically meaningful. In our previous work, we infected chicken embryos with different lineages of S. Gallinarum (Natl Sci Rev. 2023 Sep 2;10(10):nwad228). The virulence of thirteen strains of Salmonella Gallinarum, comprising five from lineage L2b and eight from lineage L3b, was evaluated in 16-day-old SPF chicken embryos through inoculation into the allantoic cavity. Controls included embryos that inoculated with phosphate-buffered saline (PBS). The embryos were incubated in a thermostatic incubator maintained at 37.5°C with a relative humidity ranging from 50% to 60%. Prior to inoculation, the viability of the embryos was assessed by examining the integrity of their venous system and their movements; any dead embryos were excluded from the study. Overnight cultures resuspended in PBS at a concentration of 1000 CFU per 100 μL were administered to the embryos. Mortality was recorded daily for a period of five days, concluding upon the hatching of the chicks.
It is generally accepted that strains with higher invasive capabilities are more likely to cause chicken embryo mortality. Our experimental results showed that the L2b, which exhibits higher invasiveness, with a slightly higher to cause chicken embryo death (Author response image 5).
Author response image 5.
The survival curves of chicken embryos infected with bvSP isolates from S. Gallinarum L2b and S. Gallinarum L3b. Inoculation with Phosphate Buffer Saline (PBS) were considered controls.
(7) 'In more detail, both the resistome and mobilome exhibited a steady decline until the 1980s, followed by a consistent increase from the 1980s to the 2010s. However, after the 2010s, a subsequent decrease was identified.'
Where is the data/plot to support this? Is it a significant change? Is this due to sampling or phylogenetics?
Thank you for highlighting these critical points. The description in this statement is based on New Supplementary Figure 11. On the right side of New Supplementary Figure 11, we presented the average number of Antimicrobial Resistance Genes (ARGs) and Mobile Genetic Elements (MGEs) carried by S. Gallinarum isolates from different years, and we described the overall trend across these years. However, we realized that this statement might overinterpret the data. Given that this sentence does not impact our emphasis on the overall increasing trends observed in the resistome and mobilome, as well as their potential association, we decided to remove it in the revised manuscript.
The revised paragraph would read as follows:
Lines 261-268: “Variations in regional antimicrobial use may result in uneven pressure for selecting AMR. The mobilome is considered the primary reservoir for spreading resistome, and a consistent trend between the resistome and the mobilome has been observed across different lineages, from L1-L3c. We observed an overall gradual rise in the resistome quantity carried by bvSP across various lineages, correlating with the total mobilome content (S11 Fig). Furthermore, we investigated the interplay between particular mobile elements and resistome types in bvSP.”
(8) It is not clear what the burden of disease this pathogen causes in the population, or how significant it is to agricultural policy. The article claims to 'provide valuable insights for targeted policy interventions.', but no such interventions are described.
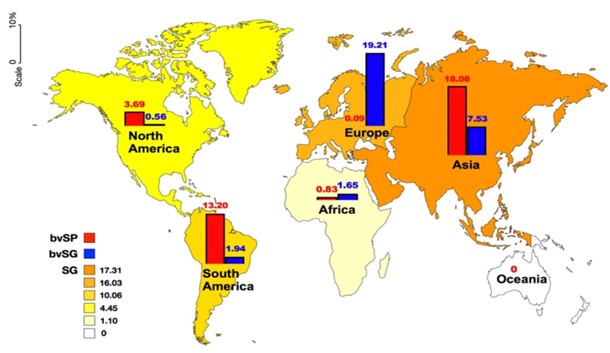
Thank you for your constructive suggestions. Salmonella Gallinarum is an avian-specific pathogen that induces fowl typhoid, a severe systemic disease characterized by high mortality rates in chickens, thereby posing a significant threat to the poultry industry, particularly in developing countries (Rev Sci Tech. 2000 Aug;19(2):40524). In our previous research, we conducted a comprehensive meta-analysis of 201 publications encompassing over 900 million samples to investigate the global impact of S. Gallinarum (Sci Data. 2022 Aug 13;9(1):495). Our findings estimated that the global prevalence of S. Gallinarum is 8.54% (with a 95% confidence interval of 8.43% to 8.65%), with notable regional variations in incidence rates.
Our previously analysis focused on the prevalence of S. Gallinarum (including biovars SP and SG) across six continents. The results revealed that all continents, except Oceania, exhibited positive prevalences of S. Gallinarum. Asia had the highest prevalence at 17.31%, closely followed by Europe at 16.03%. In Asia, the prevalence of biovar SP was higher than that of biovar SG, whereas in Europe, biovar SG was observed to be approximately two hundred times more prevalent than biovar SP. In South America, the prevalence of S. Gallinarum was higher than that of biovar SP, at 10.06% and 13.20% respectively. Conversely, the prevalence of S. Gallinarum was relatively lower in North America (4.45%) compared to Africa (1.10%) (Author response image 6).
Given the significant economic losses caused by S. Gallinarum to the poultry industry and the potential risk of escalating antimicrobial resistance, more targeted policy interventions are urgently needed. Further elaboration on this implication is provided in the revised “Discussion” section as follows:
Lines 401-416: “In summary, the findings of this study highlight that S. Gallinarum remains a significant concern in developing countries, particularly in China. Compared to other regions, S. Gallinarum in China poses a notably higher risk of AMR, necessitating the development of additional therapies, i.e. vaccine, probiotics, bacteriophage therapy in response to the government's policy aimed at reducing antimicrobial use ( J Infect Dev Ctries. 2014 Feb 13;8(2):129-36). Furthermore, given the dynamic nature of S. Gallinarum risks across different regions, it is crucial to prioritize continuous monitoring in key areas, particularly in China's southern regions where the extensive poultry farming is located. Lastly, from a One-Health perspective, controlling AMR in S. Gallinarum should not solely focus on local farming environments, with improved overall welfare on poultry and farming style. The breeding pyramid of industrialized poultry production should be targeted on the top, with enhanced and accurate detection techniques (mSphere. 2024 Jul 30;9(7):e0036224). More importantly, comprehensive efforts should be made to reduce antimicrobial usage overall and mitigate potential AMR transmission from environmental sources or other hosts (Vaccines (Basel). 2024 Sep 18;12(9):1067; Vaccines (Basel). 2023 Apr 18;11(4):865; Front Immunol. 2022 Aug 11:13:973224).”
Author response image 6.
A comparison of the global prevalence of S. gallinarum across continents.
(9) The abstract mentions stepwise evolution as a main aim, but no results refer to this.
Thank you for raising this issue. In the revised manuscript, we have changed “stepwise evolution” to simply “evolution” to ensure a more accurate and precise description.
(10) The authors attribute changes in population dynamics to normalisation in China-EU relations and hen fever. However, even if the date is correct, this is not a strongly supported causal claim, as many other reasons are also possible (for example other industrial processes which may have changed during this period).
Thank you for raising this critical issue. In the revised manuscript, we conducted a more stringent BEAST analysis for each lineage, as described earlier. This led to some changes in the inferred evolutionary timelines. Consequently, we have removed the corresponding statement from the “Results” section. Instead, we now only provide a discussion of historical events, supported by literature, that could have facilitated the intercontinental spread of L2b and L3b in the “Discussion” section. We believe these revisions have made the manuscript more rigorous and precise.
Lines 332-342: _“_The biovar types of S. Gallinarum have been well-defined as bvSP, bvSG, and bvSD historically ( J Vet Med B Infect Dis Vet Public Health. 2005 Jun;52(5):2148). Among these, bvSP can be further subdivided into five lineages (L1, L2a, L2b, L3b, and L3c) using hierarchical Bayesian analysis. Different sublineages exhibited preferential geographic distribution, with L2b and L3b of bvSP being predominant global lineage types with a high risk of AMR. The historical geographical transmission was verified using a spatiotemporal Bayesian framework. The result shows that L3b was initially spread from China to Europe in the 18th-19th century, which may be associated with the European hen fever event in the mid-19th century (Burnham GP. 1855. The history of the hen fever: a humorous record). L2b, on the other hand, appears to have spread to Europe via South America, potentially contributing to the prevalence of bvSP in the United States.”
(11) No acknowledgment of potential undersampling outside of China is made, for example, 'Notably, all bvSP isolates from Asia were exclusively found in China, which can be manually divided into three distinct regions (southern, eastern, and northern).'.
Perhaps we just haven't looked in other places?
We appreciate the reviewer's observation regarding the sampling distribution of isolates in this study. We acknowledge that while the isolates were collected from 15 different countries with, a significant proportion originated from China (Author response image 1). This focus is due to several reasons:
(1) As once a globally prevalent pathogen across the 20th century, S. Gallinarum was listed by the World Organization for Animal Health (WOAH) due to its economic importance. After 30 years of implementation the National Poultry Improvement Plan in the US, it was almost eradicated in high-income countries, and interestingly, it became an endemic pathogen with sporadic outbreaks in most low- or middle-income countries like China and Brazil. Given the vast expanse of China's land area and the country's economic factors, implementing the same measures remains a challenging endeavour.
(2) S. Gallinarum is an avian-specific pathogen, particularly affecting chickens, and its distribution is closely linked to chicken meat production in different countries. In some high chicken-producing developing countries, such as China and Brazil, there are more frequent reports of fowl typhoid. Data from the United States Department of Agriculture (USDA) on annual chicken meat production for 2023/2024 show that the global distribution of S. Gallinarum aligns closely with the overall chicken meat production of these countries (https://fas.usda.gov/data/production/commodity/0115000).
(3) Our primary objective was to investigate the localized resistome adaptation of S. Gallinarum in regions. Being a region with significant disease burden, China has reported numerous outbreaks (Sci Data. 2022 Aug 13;9(1):495; Sci Data. 2024 Feb 27;11(1):244) and a high AMR prevalence of this serovar (Natl Sci Rev. 2023 Sep 2;10(10):nwad228; mSystems. 2023 Dec 21;8(6):e0088323), making it an excellent example for understanding localized resistance mechanisms.
Nevertheless, a search of nearly a decade of literature on PubMed and a summary of the S. Gallinarum genome available on public databases indicate that the dataset used is the most complete. Furthermore, focusing on a specific region within China allowed us to conduct a detailed and thorough analysis. However, we highly agree that expanding the study to include more isolates from other countries would enhance the generalizability of our findings, and we are actively collecting additional S. Gallinarum genome data. In the revised manuscript, we modified this sentence to indicate that this phenomenon is only observed in the current dataset, thereby avoiding an overly absolute statement:
Lines 131-135: “For the bvSP strains from Asia included in our dataset, we found that all originated from China. To further investigate the distribution of bvSP across different regions in China, we categorized them into three distinct regions: southern, eastern, and northern (Supplementary Table 3)”.
(12) Many of the conclusions are highly speculative and not supported by the data.
Thank you for your comment. We have carefully revised the manuscript to address your concerns. We hope that the changes made in the revised version meet your expectations and provide a clearer and more accurate interpretation of our findings.
(13) The figures are not always the best presentation of the data:
a. Stacked bar plots in Figure 1 are hard to interpret, the total numbers need to be shown.
Panel C conveys little information.
b. Figure 4B: stacked bars are hard to read and do not show totals.
c. Figure 5 has no obvious interpretation or significance.
Thank you for your comments. We have revised the figures to improve the clarity and presentation of the data.
In summary, the quality of analysis is poor and likely flawed (although there is not always enough information on methods present to confidently assess this or provide recommendations for how it might be improved). So, the stated conclusions are not supported.
Thank you for your valuable feedback. We have carefully revised the manuscript to address your concerns. We hope that the updated figures and tables, and new data in the revised version meet your expectations and provide more appropriate interpretation of our findings.
Recommendations for the authors:
Reviewer #1 (Recommendations for the authors):
This reviewer enjoyed reading this well-written manuscript. The authors are encouraged to address the following comments and revise the manuscript accordingly.
(1) Title: The authors use avian-restrict Salmonella to refer to Salmonella Gallinarum. Please consider using Salmonella Gallinarum in the title. Also, your analysis relates to resistome and mobilome. Would it make sense to add mobilome in the manuscript?
Thank you for your guidance. In the revised manuscript, we have changed the title to “Avian-specific Salmonella enterica Serovar Gallinarum transition to endemicity is accompanied by localized resistome and mobilome interaction”. We believe that this revised title more accurately reflects the content of our study.
(2) Abstract: This study uses 45 isolates from your labs. However, you failed to include these 45 isolates in the Abstract. Also, please clarify the sources of these isolates (from dead chickens, or dead chicken embryos? You wrote in two different ways in this manuscript). Also, I am not entirely convinced how the results from these 45 isolates will support the overall conclusion of this work.
Thank you for your thorough review and constructive comments on the manuscript. In the revised version, we have added a description of 45 newly isolated S. Gallinarum strains in the Abstract to provide readers with a clearer understanding of the dataset used in this study.
Lines 36-41: “Using the most comprehensive whole-genome sequencing dataset of Salmonella enterica serovar Gallinarum (S. Gallinarum) collected from 16 countries, including 45 newly recovered samples from two related local regions, we established the relationship among avian-specific pathogen genetic profiles and localization patterns.”
Furthermore, the newly isolated S. Gallinarum strains were obtained from dead chicken embryos. We think your second concern may arise from the following description in the manuscript: “All 734 samples of dead chicken embryos were collected from Taishun and Yueqing in Zhejiang Province, China. After the thorough autopsy, the liver, intestines, and spleen were extracted and added separately into 2 mL centrifuge tubes containing 1 mL PBS. The organs were then homogenized by grinding.” In fact, all the collected dead chicken embryos were aged 19 to 20 days. At this developmental stage, collecting the liver, intestines, and spleen for isolation and cultivation of S. Gallinarum is possible. To avoid any confusion, we have included a more detailed description of the dead chicken embryos in the revised manuscript as follows:
Lines 447-451: “All 734 samples of dead chicken embryos aged 19 to 20 days were collected from Taishun and Yueqing in Zhejiang Province, China. After a thorough autopsy, the liver, intestines, and spleen were extracted and added separately into 2 mL centrifuge tubes containing 1 mL PBS. The organs were then homogenized by grinding.”
Regarding your concern about the statement, “I am not entirely convinced how the results from these 45 isolates will support the overall conclusion of this work,” we would like to clarify the significance of these new isolates. Our research first identified distinct characteristics in the 45 newly isolated S. Gallinarum strains from Taishun and Yueqing, Zhejiang Province. Specifically, we found that most of the strains from Yueqing belonged to sequence type ST92, whereas the majority from Taishun were ST3717. Additionally, there were significant differences between these geographically close strains in terms of SNP distance and predicted invasion capabilities. These findings suggest that S. Gallinarum may exhibit localized transmission patterns, which forms the basis of the scientific question and hypothesis we originally aimed to address. Furthermore, in our previous work, we collected 325 S. Gallinarum strains. By incorporating the newly isolated 45 strains, we aim to provide a more comprehensive view of the population diversity, transmission pattern and potential risk of S. Gallinarum. We will continue to endeavour to understand the global genomic and population diversity in this field.
Finally, we revised the sentences that could potentially raise concerns for readers:
Lines 175-177: “To investigate the dissemination pattern of bvSP in China, we obtained forty-five newly isolated bvSP from 734 samples (6.1% overall isolation rate) collected from diseased chickens at two farms in Yueqing and Taishun, Zhejiang Province.” > “To investigate the dissemination pattern of bvSP, we obtained forty-five newly isolated bvSP from 734 samples (6.1% overall isolation rate) collected from diseased chickens at two farms in Yueqing and Taishun, Zhejiang Province.”
(3) The manuscript uses nomenclature and classification into different sublineages. Did the authors establish the approaches for defining these sublineages in this group or did you follow the accepted standards?
Thank you very much for raising this important issue. The biovar types of Salmonella Gallinarum have historically been well-defined as S. Gallinarum biovar
Pullorum (bvSP), S. Gallinarum biovar Gallinarum (bvSG), and S. Gallinarum biovar Duisburg (bvSD) (J Vet Med B Infect Dis Vet Public Health. 2005 Jun;52(5):214-8). However, there seems to be no widespread consensus on the population nomenclature for the key biovar bvSP. In a previous study, Zhou et al. classified bvSP into six lineages:
L1, L2a, L2b, L3a, L3b, and L3c (Natl Sci Rev. 2023 Sep 2;10(10):nwad228). However, our more comprehensive analysis of S. Gallinarum using a larger dataset and hierarchical Bayesian clustering revealed that L3a, previously considered a distinct lineage, is actually a sublineage of L3c. Upon further review of our initial manuscript, we realized that the original submission did not strictly follow the lineage order proposed by Zhou et al. To avoid confusion in the typing system, we have adjusted the lineage nomenclature in the revised manuscript to reflect the corrected order (see Author response table 1).
(4) This reviewer is convinced with the analysis approaches and conclusion of this work.
In the meantime, the authors are encouraged to discuss the application of the conclusion of this study: a) can the data be somehow used in the prediction model? b) would the conclusion from S. Gallinarum have generalized application values for other pathogens.
Thank you for your constructive comments on the manuscript.
a) can the data be somehow used in the prediction model?
We believe that genomic data can be effectively used for constructing prediction models; however, the success of such models largely depends on the specific traits being predicted. In this study, we utilized a random forest prediction model based on 196 top genes (PLoS Genet. 2018 May 8;14(5)) to predict the invasiveness of 45 newly isolated strains. In relation to the antimicrobial resistance (AMR) issue discussed in this paper, we also conducted relevant analyses. For instance, we explored the use of image-based models to predict whether a genome is resistant to specific antibiotics (Comput Struct Biotechnol J. 2023 Dec 29:23:559-565). We are confident that the incorporation of newly generated data will facilitate the development of future predictive models, and we plan to pursue further research in this area.
b) would the conclusion from S. Gallinarum have generalized application values for other pathogens.
This might be explained from two perspectives. First, the key role of the mobilome in facilitating the spread of the resistome, as emphasized in this study, has also been confirmed in research on other pathogens (mBio. 2024 Oct 16;15(10):e0242824). Thus, we believe that the pipeline we developed to assess the horizontal transfer frequency of different resistance genes across regions applies to various pathogens. On the other hand, due to distinct evolutionary histories, different pathogens exhibit varying levels of adaptation to their environments. In this study, we found that S. Gallinarum tends to spread highly localized; however, this conclusion may not necessarily hold for other pathogens.
Reviewer #2 (Recommendations for the authors):
The authors would need to:
(1) Address my concerns about genomic analyses listed in the public review.
Thank you for your valuable feedback. We have carefully reviewed your concerns and made the necessary revisions to address the points raised about genomic analyses in the public review. We sincerely hope that these modifications meet your expectations and provide more robust analysis. We appreciate your thoughtful input and remain open to further suggestions to improve the manuscript.
(2) Add more detail on the genomic methods and their outputs, as suggested above.
We have added further details to clarify the methodologies and outputs as mentioned above. Specifically, we expanded the description of the data processing, and the bioinformatic tools used for analysis. To ensure clarity, we also included an expanded discussion of the key outputs, highlighting their implications. We hope these revisions meet your expectations.
(3) Critically rewrite their introduction to make it clear what problem they are trying to address.
Thank you for your guidance. In the revised manuscript, we have made the necessary modifications to the Introduction section to more clearly articulate the problem we aim to address.
(4) Critically rewrite their conclusions so they are supported by the data they present, and make it clear when claims are more speculative.
Thank you for your guidance. In the revised manuscript, we have made the recommended modifications to the relevant sections of the conclusion as outlined above.
More minor issues I identified:
(1) Typo in the title 'avian-restrict'.
Done.
Line 1: “Avian-specific Salmonella enterica Serovar Gallinarum transition to endemicity is accompanied by localized resistome and mobilome interaction.”
(2) 'By utilizing the pipeline we developed' -- a pipeline has not been introduced at this point.
In the revised manuscript, we have removed this section from the 'Abstract'.
Lines 46-48: “Notably, the mobilome-resistome combination among distinct lineages exhibits a geographical-specific manner, further supporting a localized endemic mobilome-driven process.”
(3) 'has more than 90% serovars' -- doesn't make sense.
Revised.
Lines 82-83: “Salmonella, a pathogen with distinct geographical characteristics, has more than 90% of its serovars frequently categorized as geo-serotypes.”
(4) 'horrific mortality rates that remain a disproportionate burden'.
Revised.
Lines 83-87: “Among the thousands of geo-serotypes, Salmonella enterica Serovar Gallinarum (S. Gallinarum) is an avian-specific pathogen that causes severe mortality, with particularly detrimental effects on the poultry industry in low- and middle-income countries.”
(5) What is the rate, what is a comparison, how is it disproportionate?
Thank you for your valuable feedback. It is challenging to accurately estimate the specific prevalence of S. Gallinarum, particularly due to the lack of comprehensive data in many countries. Numerous cases likely go unreported. However, S. Gallinarum is more commonly detected in low- and middle-income countries. Here, we provide three evidence supporting this observation. First, in our previous research, we conducted a comprehensive meta-analysis of 201 studies, involving over 900 million samples, to evaluate the global impact of S. Gallinarum (Sci Data. 2022 Aug 13;9(1):495). The estimated prevalence in 17 countries showed that Bangladesh had the highest rate (25.75%) of S. Gallinarum infections. However, for biovar Pullorum (bvSP), Argentina (20.69%) and China (18.18%) reported the highest prevalence rates. Second, previous studies have also reported that S. Gallinarum predominantly occurs in low- and middleincome countries (Vet Microbiol. 2019 Jan:228:165-172; BMC Microbiol. 2024 Oct 18;24(1):414). Finally, S. Gallinarum was once a globally prevalent pathogen in the 20th century. Following the implementation of eradication programs in most high-income countries, it was listed by the World Organization for Animal Health and subsequently became an endemic pathogen with sporadic outbreaks. However, similar eradication efforts are challenging to implement in low- and middle-income countries, leading to a disproportionately higher incidence of S. Gallinarum in these regions.
In the revised manuscript, we have rephrased this sentence to enhance its accuracy:
Lines 83-87: “Among the thousands of geo-serotypes, Salmonella enterica serovar Gallinarum (S. Gallinarum) is an avian-specific pathogen that causes severe mortality, with particularly detrimental effects on the poultry industry in low- and middle-income countries.”
(6) 'we collected the most comprehensive set of 580 S. Gallinarum isolates', -> 'we collected the most comprehensive set S. Gallinarum isolates, consisting of 580 genomes'.
Revised.
Lines 97-100: “To fill the gaps in understanding the evolution of S. Gallinarum under regional-associated AMR pressures and its adaptation to endemicity, we collected the most comprehensive set S. Gallinarum isolates, consisting of 580 genomes, spanning the period from 1920 to 2023.”
(7) Sequence reads are not available, and use a non-standard database. The eLife policy states: 'Sequence reads and assembly must be included for reference genomes, while novel short sequences, including epitopes, functional domains, genetic markers and haplotypes should be deposited, together with surrounding sequences, into Genbank, DNA Data Bank of Japan (DDBJ), or EMBL Nucleotide Sequence Database (ENA). DNA and RNA sequencing data should be deposited in NCBI Trace Archive or NCBI Sequence Read Archive (SRA).' So the sequences assemblies and reads should ideally be mirrored appropriately.
Thank you for your valuable suggestion regarding submitting the genome data for the newly isolated 45 S. Gallinarum strains. The genome data have been deposited in the NCBI Sequence Read Archive (SRA) under two BioProjects. The “SRA Accession number” for each strain have been added to New Supplementary Table 1. We believe this will ensure that the data are more readily accessible to a broader audience of researchers for download and analysis. We have revised the corresponding paragraph in the manuscript as follows:
Lines 606-608: “For the newly isolated 45 strains of Salmonella Gallinarum, genome data have been deposited in NCBI Sequence Read Archive (SRA) database. The “SRA Accession” for each strain are listed in Supplementary Table 1.”
(8) You should state at the start of the results which data is public, and how much is newly sequenced.
Revised.
Lines 109-112: “To understand the global geographic distribution and genetic relationships of S. Gallinarum, we assembled the most comprehensive S. Gallinarum WGS dataset (n=580), comprising 535 publicly available genomes and 45 newly sequenced genomes.”
-
eLife Assessment
This important study uses a large dataset from both recent isolates and genomes in databases to provide an analysis of the population structure of the pathogen Salmonella gallinarum. The results regarding regional adaptation and the evolutionary trajectory of the resistome and mobilome remain incomplete, requiring additional details to fully support their claims and assess the value of these insights for future policy interventions regarding this and other pathogens. This work will interest microbiologists and researchers working on genomics, evolution, and antimicrobial resistance.
-
Reviewer #1 (Public review):
Summary:
The investigators in this study analyzed the dataset assembly from 540 Salmonella isolates, and those from 45 recent isolates from Zhejiang University of China. The analysis and comparison of the resistome and mobilome of these isolates identified a significantly higher rate of cross-region dissemination compared to localized propagation. This study highlights the key role of the resistome in driving the transition and evolutionary history of S. Gallinarum.
Strengths:
The isolates included in this study were from 16 countries in the past century (1920 to 2023). While the study uses S. Gallinarun as the prototype, the conclusion from this work will likely apply to other Salmonella serotypes and other pathogens.
Weaknesses:
While the isolates came from 16 countries, most strains in this study were …
Reviewer #1 (Public review):
Summary:
The investigators in this study analyzed the dataset assembly from 540 Salmonella isolates, and those from 45 recent isolates from Zhejiang University of China. The analysis and comparison of the resistome and mobilome of these isolates identified a significantly higher rate of cross-region dissemination compared to localized propagation. This study highlights the key role of the resistome in driving the transition and evolutionary history of S. Gallinarum.
Strengths:
The isolates included in this study were from 16 countries in the past century (1920 to 2023). While the study uses S. Gallinarun as the prototype, the conclusion from this work will likely apply to other Salmonella serotypes and other pathogens.
Weaknesses:
While the isolates came from 16 countries, most strains in this study were originally from China.
-
Reviewer #2 (Public review):
Summary:
The authors sequence 45 new samples of S. Gallinarum, a commensal Salmonella found in chickens, which can sometimes cause disease. They combine these sequences with around 500 from public databases, determine the population structure of the pathogen, and coarse relationships of lineages with geography. The authors further investigate known anti-microbial genes found in these genomes, how they associate with each other, whether they have been horizontally transferred, and date the emergence of clades.
Strengths:
(1) It doesn't seem that much is known about this serovar, so publicly available new sequences from a high-burden region are a valuable addition to the literature.
(2) Combining these sequences with publicly available sequences is a good way to better contextualise any findings.
Weaknesses:
Th…
Reviewer #2 (Public review):
Summary:
The authors sequence 45 new samples of S. Gallinarum, a commensal Salmonella found in chickens, which can sometimes cause disease. They combine these sequences with around 500 from public databases, determine the population structure of the pathogen, and coarse relationships of lineages with geography. The authors further investigate known anti-microbial genes found in these genomes, how they associate with each other, whether they have been horizontally transferred, and date the emergence of clades.
Strengths:
(1) It doesn't seem that much is known about this serovar, so publicly available new sequences from a high-burden region are a valuable addition to the literature.
(2) Combining these sequences with publicly available sequences is a good way to better contextualise any findings.
Weaknesses:
There are many issues with the genomic analysis that undermine the conclusions, the major ones I identified being:
(1) Recombination removal using gubbins was not presented fully anywhere. In this diversity of species, it is usually impossible to remove recombination in this way. A phylogeny with genetic scale and the gubbins results is needed. Critically, results on timing the emergence (fig2) depend on this, and cannot be trusted given the data presented.
(2) The use of BEAST was also only briefly presented, but is the basis of a major conclusion of the paper. Plot S3 (root-to-tip regression) is unconvincing as a basis of this data fitting a molecular clock model. We would need more information on this analysis, including convergence and credible intervals.
(3) Using a distance of 100 SNPs for a transmission is completely arbitrary. This would at least need to be justified in terms of the evolutionary rate and serial interval.
(4) The HGT definition is non-standard, and phylogeny (vertical inheritance) is not controlled for.
The cited method:
'In this study, potentially recently transferred ARGs were defined as those with perfect identity (more than 99% nucleotide identity and 100% coverage) in distinct plasmids in distinct host bacteria using BLASTn (E-value {less than or equal to}10−5)'
This clearly does not apply here, as the application of distinct hosts and plasmids cannot be used. Subsequent analysis using this method is likely invalid, and some of it (e.g. Figure 6c) is statistically very poor.(5) Associations between lineages, resistome, mobilome, etc do not control for the effect of genetic background/phylogeny. So e.g. the claim 'the resistome also demonstrated a lineage-preferential distribution' is not well-supported.
(6) The invasiveness index is not well described, and the difference in means is not biologically convincing as although it appears significant, it is very small.
(7) 'In more detail, both the resistome and mobilome exhibited a steady decline until the 1980s, followed by a consistent increase from the 1980s to the 2010s. However, after the 2010s, a subsequent decrease was identified.'
Where is the data/plot to support this? Is it a significant change? Is this due to sampling or phylogenetics?(8) It is not clear what the burden of disease this pathogen causes in the population, or how significant it is to agricultural policy. The article claims to 'provide valuable insights for targeted policy interventions.', but no such interventions are described.
(9) The abstract mentions stepwise evolution as a main aim, but no results refer to this.
(10) The authors attribute changes in population dynamics to normalisation in China-EU relations and hen fever. However, even if the date is correct, this is not a strongly supported causal claim, as many other reasons are also possible (for example other industrial processes which may have changed during this period).
(11) No acknowledgment of potential undersampling outside of China is made, for example, 'Notably, all bvSP isolates from Asia were exclusively found in China, which can be manually divided into three distinct regions (southern, eastern, and northern).'. Perhaps we just haven't looked in other places?
(12) Many of the conclusions are highly speculative and not supported by the data.
(13) The figures are not always the best presentation of the data:
a. Stacked bar plots in Figure 1 are hard to interpret, the total numbers need to be shown. Panel C conveys little information.
b. Figure 4B: stacked bars are hard to read and do not show totals.
c. Figure 5 has no obvious interpretation or significance.In summary, the quality of analysis is poor and likely flawed (although there is not always enough information on methods present to confidently assess this or provide recommendations for how it might be improved). So, the stated conclusions are not supported.
-
-
