Modulation of aperiodic EEG activity provides sensitive index of cognitive state changes during working memory task
Curation statements for this article:-
Curated by eLife

eLife Assessment
This valuable work explores the timely idea that aperiodic activity in human electrophysiology recordings is dynamically modulated in response to task events in a manner that may be relevant for behavioral performance. Moreover, the authors present solid evidence that, in some circumstances, these aperiodic changes might be misinterpreted as oscillatory changes.
This article has been Reviewed by the following groups
Discuss this preprint
Start a discussion What are Sciety discussions?Listed in
- Evaluated articles (eLife)
Abstract
To better understand cognitive processes, it is valuable to consider both periodic (oscillatory) and aperiodic electrophysiological brain activity. The aim of this study was to clarify how the periodic and aperiodic electrophysiological components reflect the cognitive processes involved in working memory. Fifty-seven human participants performed an n-back task while their brain activity was recorded using EEG. The analysis of both components of the EEG spectrum during task performance indicates that both periodic and aperiodic activities exhibit distinct task-related spatiotemporal dynamics that are closely related to cognitive demands. The results suggest that a substantial portion of the changes often attributed to theta oscillations in working memory tasks may be influenced by shifts in the spectral slope of aperiodic activity. This finding indicates that the modulation of aperiodic activity, associated with cognitive control processes, could provide a more sensitive index of cognitive state changes than previously recognised. To further confirm our findings, we also used these analysis methods in an item-recognition task, which showed similar patterns of periodic and aperiodic activity. These observations challenge the conventional understanding of low-frequency oscillations in cognitive processing and raise concerns about the routine practice of EEG baseline correction in time-frequency analysis, as it may obscure significant modulations in continuous working memory tasks. Consequently, the inclusion of aperiodic activity as a fundamental component of EEG analysis is likely to be critical for the accurate representation of the neural basis of cognition.
Article activity feed
-

-
-
-

eLife Assessment
This valuable work explores the timely idea that aperiodic activity in human electrophysiology recordings is dynamically modulated in response to task events in a manner that may be relevant for behavioral performance. Moreover, the authors present solid evidence that, in some circumstances, these aperiodic changes might be misinterpreted as oscillatory changes.
-
Reviewer #1 (Public review):
Summary:
Frelih et al. investigated both periodic and aperiodic activity in EEG during working memory tasks. In terms of periodic activity, they found post-stimulus decreases in alpha and beta activity, while in terms of aperiodic activity, they found a bi-phasic post-stimulus steepening of the power spectrum, which was weakly predictive of performance. They conclude that it is crucial to properly distinguish between aperiodic and periodic activity in event-related designs as the former could confound the latter. They also add to the growing body of research highlighting the functional relevance of aperiodic activity in the brain.
Strengths:
This is a well-written, timely paper that could be of interest to the field of cognitive neuroscience, especially to researchers investigating the functional role of …
Reviewer #1 (Public review):
Summary:
Frelih et al. investigated both periodic and aperiodic activity in EEG during working memory tasks. In terms of periodic activity, they found post-stimulus decreases in alpha and beta activity, while in terms of aperiodic activity, they found a bi-phasic post-stimulus steepening of the power spectrum, which was weakly predictive of performance. They conclude that it is crucial to properly distinguish between aperiodic and periodic activity in event-related designs as the former could confound the latter. They also add to the growing body of research highlighting the functional relevance of aperiodic activity in the brain.
Strengths:
This is a well-written, timely paper that could be of interest to the field of cognitive neuroscience, especially to researchers investigating the functional role of aperiodic activity. The authors describe a well-designed study that looked at both the oscillatory and non-oscillatory aspects of brain activity during a working memory task. The analytic approach is appropriate, as a state-of-the-art toolbox is used to separate these two types of activity. The results support the basic claim of the paper that it is crucial to properly distinguish between aperiodic and periodic activity in event-related designs as the former could confound the latter. They also add to the growing body of research highlighting the functional relevance of aperiodic activity in the brain. Commendably, the authors include replications of their key findings on multiple independent data sets.
Comments on the previous version:
The authors have addressed several of the weaknesses I noted in my original review, specifically, they softened their claims regarding the theta findings, while simultaneously strengthening these findings with additional analyses (using simulations as well as a new measure of rhythmicity, the phase autocorrelation function, pACF). Most of the other suggested control analyses were also implemented. While I believe the fact that the participants in the main sample were not young adults could be made even more explicit, and the potential interaction between age and aperiodic changes could be unpacked a little in the discussion, the age of the sample is definitely addressed upfront.
-
Reviewer #2 (Public review):
Summary:
In this manuscript, Frelih et al, investigate the relationship between aperiodic neural activity, as measured by EEG, and working memory performance, and compares this to the more commonly analyzed periodic, and in particular theta, measures that are often associated with such tasks. To do so, they analyze a primary dataset of 57 participants engaging in an n-back task, as well as a replication dataset, and use spectral parameterization to measure periodic and aperiodic features of the data, across time. In the revision, the authors have clarified some key points, and added a series of additional analyses and controls, including the use of an additional method, that helps to complement the original analyses and further corroborates their claims. In doing so, they find both periodic and aperiodic …
Reviewer #2 (Public review):
Summary:
In this manuscript, Frelih et al, investigate the relationship between aperiodic neural activity, as measured by EEG, and working memory performance, and compares this to the more commonly analyzed periodic, and in particular theta, measures that are often associated with such tasks. To do so, they analyze a primary dataset of 57 participants engaging in an n-back task, as well as a replication dataset, and use spectral parameterization to measure periodic and aperiodic features of the data, across time. In the revision, the authors have clarified some key points, and added a series of additional analyses and controls, including the use of an additional method, that helps to complement the original analyses and further corroborates their claims. In doing so, they find both periodic and aperiodic features that relate to the task dynamics, but importantly, the aperiodic component appears to explain away what otherwise looks like theta activity in a more traditional analysis. This study therefore helps to establish that aperiodic activity is a task-relevant dynamic feature in working memory tasks and may be the underlying change in many other studies that reported 'theta' changes, but did not use methods that could differentiate periodic and aperiodic features.
Strengths:
Key strengths of this paper include that it addresses an important question - that of properly adjudicating which features of EEG recordings relate to working memory tasks - and in doing so provides a compelling answer, with important implications for considering prior work and contributing to understanding the neural underpinnings of working memory. The revision is improved by showing this using an additional analysis method. I do not find any significant faults or error with the design, analysis, and main interpretations as presented by this paper, and as such, find the approach taken to be a valid and well-enacted. The use of multiple variants of the working memory task, as well as a replication dataset significantly strengthens this manuscript, by demonstrating a degree of replicability and generalizability. This manuscript is also an important contribution to motivating best practices for analyzing neuro-electrophysiological data, including in relation to using baselining procedures. I think the updates in the revision have helped to clarify the findings and impact of this study.
Weaknesses:
Overall, I do not find any obvious weaknesses with this manuscript and it's analyses that challenge the key results and conclusions. Updates through the revision have addressed my previous points about adding some additional notes on the methods and conclusions.
-
Reviewer #3 (Public review):
Summary:
Using a specparam (1/f) analysis of task-evoked activity, the authors propose that "substantial changes traditionally attributed to theta oscillations in working memory tasks are, in fact, due to shifts in the spectral slope of aperiodic activity." This is a very bold and ambitious statement, and the field of event-related EEG would benefit from more critical assessments of the role of aperiodic changes during task events. Unfortunately, the data shown here does not support the main conclusion advanced by the authors.
Strengths:
The field of event-related EEG would benefit from more critical assessments of the role of aperiodic changes during task events. The authors perform a number of additional control analyses, including different types of baseline correction, ERP subtraction, as well as …
Reviewer #3 (Public review):
Summary:
Using a specparam (1/f) analysis of task-evoked activity, the authors propose that "substantial changes traditionally attributed to theta oscillations in working memory tasks are, in fact, due to shifts in the spectral slope of aperiodic activity." This is a very bold and ambitious statement, and the field of event-related EEG would benefit from more critical assessments of the role of aperiodic changes during task events. Unfortunately, the data shown here does not support the main conclusion advanced by the authors.
Strengths:
The field of event-related EEG would benefit from more critical assessments of the role of aperiodic changes during task events. The authors perform a number of additional control analyses, including different types of baseline correction, ERP subtraction, as well as replication of the experiment with two additional datasets.
Comments on previous revisions:
The authors have completed a substantial revision based on the comments from all of the reviewers. Overall, the major claims of the initial report have been profoundly tempered.
[Editors' note: We determined that this revised version appropriately tempers some of the prior claims and addresses the concerns raised by the reviewers through two rounds of review.]
-
Author response:
The following is the authors’ response to the previous reviews
Reviewer 1:
We thank Reviewer 1 for the discussion on the possible causes of ERPs and their relevance for the interpretation of changes in aperiodic activity. We have changed the relevant paragraph to read as follows: For example, ERPs may reflect changes in periodic activity, such as phase resets (Makeig et al., 2002), or baseline shifts (Nikulin et al., 2007). ERPs may also capture aperiodic activity, either in the form of evoked transients triggered by an event (Shah et al., 2004) or induced changes in the ongoing background signal. This has important implications: evoked transients can alter the broadband spectrum without implying shifts in ongoing background activity, whereas induced aperiodic changes may signal different neural mechanisms, such as …
Author response:
The following is the authors’ response to the previous reviews
Reviewer 1:
We thank Reviewer 1 for the discussion on the possible causes of ERPs and their relevance for the interpretation of changes in aperiodic activity. We have changed the relevant paragraph to read as follows: For example, ERPs may reflect changes in periodic activity, such as phase resets (Makeig et al., 2002), or baseline shifts (Nikulin et al., 2007). ERPs may also capture aperiodic activity, either in the form of evoked transients triggered by an event (Shah et al., 2004) or induced changes in the ongoing background signal. This has important implications: evoked transients can alter the broadband spectrum without implying shifts in ongoing background activity, whereas induced aperiodic changes may signal different neural mechanisms, such as shifts in the excitation-inhibition balance (Gao et al., 2017).
Reviewer 1 argued that a time point-by-time point comparison between ERPs and aperiodic parameters may not be the most appropriate approach, since aperiodic time series have lower temporal resolution than ERPs. Reviewer suggested comparing their topographies instead. We had already done this in the first version of the paper (see Fig. S7: https://elifesciences.org/reviewedpreprints/101071v1#s10). However, in the second version, we opted to use linear mixed models for each channel-time point in order to maintain consistency with the other analyses in the paper (e.g. the comparison between FOOOF parameters and baseline-corrected power).
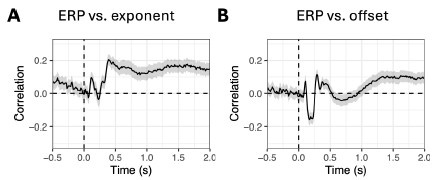
Nevertheless, we repeated the topographic correlations as in the first version, and the results are shown below. Correlations were computed for each time point, subject and condition, and then averaged across these dimensions for visualisation. The pattern differs from that of the linear mixedmodel results (see Fig. S14), with notable correlations appearing after ~0.5 s for the exponent and after ~1.0 s for the offset. Still, the correlations remain low, suggesting that aperiodic parameters and ERPs encode different information (at least in this dataset).
Author response image 1.
Additionally, to control for the effect of smearing we have performed the same linear mixed model analysis as in Fig. S14 on low-pass filtered ERPs (with cut-off 10 Hz), and the results were largely similar as in Fig. S14.
Reviewer 1 discussed two possible explanations for the observed correlations between baselinecorrected power and FOOOF parameters (Figure 4): “The correlation between the exponent and lowfrequency activity could be of either direction: low frequency power changes could reflect 1/f shifts, or exponent estimates might be biased by undetected delta/theta activity. I think that one other piece of evidence /…/ to intuitively highlight why the latter is more likely is the /…/ decrease at high ("transbeta") frequencies, which suggests a rotational shift /../.” We agree with the interpretation that lowfrequency power changes in our data primarily reflect 1/f shifts. However, we are uncertain about the reviewer’s statement that the “latter” explanation (i.e., bias in exponent estimates due to delta/theta activity) is more likely. Given the context, we believe the reviewer may have intended to say the “former” explanation is more likely.
We agree with the reviewers' observation that rhythmicity, as estimated using the pACF, can be independent of power (Myrov et al., 2024, Fig. 1). However, it seems that in real (non-simulated) datasets, the pACF and power spectral density (PSD) are often moderately correlated (e.g. Myrov et al., 2024, Fig. 5).
Reviewer 1 asked whether we had examined aperiodic changes in the data before and after subtracting the response-locked ERPs. We did not carry out this extra analysis as, as the reviewer suggests, it would have been excessive – the current version of the paper already contains more than 60 figures. As mentioned in the manuscript, we acknowledge the possibility that response-locked ERPs contribute to the second aperiodic component. However, due to the weak correlation between reaction times and aperiodic activity, the presence of both components throughout the entire epoch (in at least the first and third datasets) and the distinct differences between the ERPs and the aperiodic activity in the different conditions (see Fig. 8 vs. Fig. S13), we cannot conclusively determine whether the second aperiodic component is directly related to motor responses. Finally, we agree with the reviewer that the distribution of the response-locked ERP more closely resembles the frontocentral (earlier) aperiodic component than the later post-response component. We have amended the relevant paragraph in the Discussion to include these observations. ”While it is possible that response-related ERPs contributed to the second aperiodic component, several observations suggest otherwise: both aperiodic components were present throughout the entire epoch, differences between conditions diverged between ERPs and aperiodic activity (compare Figure 8 and Figure S16), and the associations with reaction times were weak. Moreover, the distribution of the response-locked ERP qualitatively resembled the earlier frontocentral aperiodic component more than the later post-response component. Taken together, these findings suggest that ERPs and aperiodic activity capture distinct aspects of neural processing, rather than reflecting the same underlying phenomenon.”
We agree with Reviewer 1 that our introduction of aperiodic activity was abrupt, and that the term 'aperiodic exponent' required definition. We have now defined it as the spectral steepness in log–log space (i.e. the slope), and have added a brief explanatory sentence to the introduction.
Reviewer 1 noted that the phrase 'task-related changes in overall power' could be misinterpreted as referring to total (broadband) power, and recommended that we specify a frequency range. We agree, so we have replaced 'overall power' with 'spectral power within a defined frequency range'.
We agree with Reviewer 1 that the way we worded things in the Discussion section regarding alpha activity and inhibitory processes was awkward and could easily be misread. We have rephrased the sentences and added a brief explanation to avoid implying a direct link between alpha attenuation and neural inhibition.
Furthermore, based on the reviewer’s suggestion, we added a brief comment in the Discussion section (Theoretical and methodological implications) on theoretical perspectives regarding the interaction between age and aperiodic activity.
Reviewer 1 suggested including condition as a fixed effect in order to examine whether the relationship between FOOOF parameters and baseline-corrected power is modulated by condition. Specifically, the reviewer proposed changing our model from
baseline_corrected_power ~ 1 + fooof_parameter + (1|modality) + (1|nback) + (1|stimulus) + (1|subject)
to
baseline_corrected_power ~ 1 + fooof_parameter + modality*nback *stimulus + (1|subject)
While we appreciate this suggestion, we believe that including design variables as fixed effects would confound the interpretation of (marginal) R² as a measure of the association between FOOOF parameters and baseline-corrected power. Our primary question in this analysis was about the fundamental relationship between these measures, not how experimental conditions moderate this relationship.
To address the reviewer's concern regarding condition-specific effects, we conducted separate analyses for each condition using a simpler model:
baseline_corrected_power ~ 1 + fooof_parameter + (1|subject)
The results (now included in the Supplement, Fig. S4–S6) show generally smaller effect sizes compared to our original random-effects model, with notable differences between conditions. The 2-back conditions, particularly the non-target trials, exhibited the weakest associations. Despite these differences, the overall patterns remained consistent with our original findings: exponent and offset exhibited positive associations at low frequencies (delta, theta) and negative associations at higher frequencies (beta, low gamma), while periodic activity correlated substantially with baselinecorrected power in the alpha, beta, and gamma ranges.
However, this condition-specific approach has important limitations. With only 47 subjects per condition, the statistical power is insufficient for stable correlation estimates (Schönbrodt & Perugini, 2013; https://doi.org/10.1016/j.jrp.2013.05.009). This likely explains why the effects are smaller and less stable effects than in our original model, which uses the full dataset's power while appropriately accounting for condition-related variance through random effects. Since these additional analyses do not alter our primary conclusions, we have included them in the Supplement for completeness and made a minor change in the Discussion section.
Reviewer 1 asked what channels are lines on Figure 9 based on. As stated in the Methods section, “We fitted models in a mass univariate manner, that is for each channel, frequency (where applicable), and time point separately. /…/ For the purposes of visualisation, p-values were averaged across channels (for heatmaps or lines) or across time (for topographies).” Therefore, the lines and heatmaps apply to all channels.
Reviewer 2:
We would like to thank reviewer 2 for their detailed explanation of the expected behaviour of the specparam algorithm. We have added the following explanation to the Methods section:
Importantly, as noted by the reviewer, this behaviour reflects an explicit design choice of the algorithm: to avoid overfitting ambiguous peaks at the edges of the spectrum, FOOOF excludes peaks that are too close to the boundaries. This exclusion is controlled by the _bw_std_edge parameter, which defines the distance that a peak must be from the edge in order to be retained (in units of standard deviation; set to 1.0 by default). Therefore, although the algorithm is functioning as intended, users should be careful when interpreting aperiodic parameters in datasets where lowfrequency oscillatory activity might be expected.
In line with the reviewer’s suggestion we have added a version of specparam to the paper.
We thank reviewer 2 for pointing out two studies that used a time-resolved approach to spectral parameterisation. We have updated the text accordingly:
Although a similar approach has been used to track temporal dynamics in sleep and resting state (e.g., Wilson et al., 2022; Ameen et al., 2024), as well as in task-based contexts (e.g., Barrie et al., 1996; Preston et al., 2025), its specific application to working memory paradigms remains underexplored.
Reviewer 3:
Reviewer 3 notes that the revised manuscript feels less intriguing than the original version. While we understand this concern, we believe this difference arises from a misalignment in expectations regarding the scope and purpose of our study. We think the reviewer is interpreting our work as focusing on whether theta activity is elicited in a paradigm that reliably produces theta oscillations. In contrast, our study is framed around a working memory task in which, based on prior literature, we expected to observe theta activity but instead found an absence of theta spectral peaks in almost all participants. Note that the absence of theta is already noteworthy in itself, given that theta oscillations are believed to play a crucial role in working memory.
Importantly, Van Engen et al. (2024) have recently reported similar findings:
”While we did not observe load-dependent aperiodic changes over the frontal midline, we did reveal the possibility that previous frontal midline theta results that do not correct for aperiodic activity likely do not reflect theta oscillations. /…/ While our results do not invalidate previous research into extracranial theta oscillations in relation to WM, they challenge popular and widely held beliefs regarding the mechanistic role for theta oscillations to group or segregate channels of information”.
From this perspective, we maintain that the following statements are still justified:
“substantial portion of the changes often attributed to theta oscillations in working memory tasks may be influenced by shifts in the spectral slope of aperiodic activity”
"Note that although no prominent oscillatory peak in the theta range was observed at the group level, and some of this activity could potentially fall within the delta range, similar lowfrequency patterns have often been referred to as 'theta' in previous work, even in the absence of a clear spectral peak"
These formulations are intended to emphasize existing interpretations of changes in low-frequency power as theta oscillations in related research.
Next, Reviewer 3 pointed out that “spectral reflection (peak?) in spectral power plot does not imply that an event is repeating (i..e. oscillatory).” We agree with the reviewer that not every spectral peak implies a true oscillation. To address this, we complemented the power analyses with a measure of rhythmicity (phase autocorrelation function, pACF) after the first round of reviews, and the pACF results were largely similar to those for periodic activity. These results suggest that, in our case, periodic activity is indeed largely oscillatory.
However, we do agree with the reviewer that the term “oscillatory” is not interchangeable with “periodic”. To address this, we reviewed the paper for all appearances of “oscillations”, “oscillatory” and related terms, and replaced them with “power”, “spectral” or “periodic activity” where appropriate (all changes are marked in red in the latest version of the manuscript).
Examples of corrections:
Changes in aperiodic activity appear as low-frequency oscillations in baseline-corrected time-frequency plots à low-frequency power
“The periodic component includes only the parameterised oscillatory peak” à spectral peak
“FOOOF decomposition may miss low-frequency oscillations near the edges of the spectrum” à low-frequency peaks
We disagree with the reviewer’s assertion that the subtitle “Aperiodic parameters are largely independent of oscillatory activity” is misleading for a methods oriented paper. Namely, the full subtitle is “Rhythmicity analysis reveals aperiodic parameters are largely independent of oscillatory activity”. Since rhythmicity is a phase-based measure that requires repeating dynamics and is therefore indicative of oscillations, we believe this phrasing is technically accurate.
Finally, we would like to emphasise our contribution once again. Our analyses of rhythmicity, spectrally parameterised power, and baseline-corrected power offer different perspectives on the data. Each of these analyses may lead to different interpretations, but performing all of them on the same data provides a more comprehensive insight into what is actually going on in the data.
Our findings demonstrate that conclusions drawn from a single analytical approach may be incomplete or misleading. For example, as we discuss in the paper, many studies examine thetagamma coupling in scalp EEG during n-back tasks without first establishing whether theta activity genuinely oscillates (e.g. Rajji et al., 2016). The absence of true theta oscillations would undermine the validity of such analyses. Our multifaceted approach provides researchers with a systematic framework for validating oscillatory assumptions before proceeding with more complex analyses.
-
eLife Assessment
This valuable work explores the timely idea that aperiodic activity in human electrophysiology recordings is dynamically modulated in response to task events in a manner that may be relevant for behavioral performance. Moreover, the authors present solid evidence that, in some circumstances, these aperiodic changes might be misinterpreted as oscillatory changes. While many aspects of the manuscript were intriguing, there was a sense that some of the interpretations were overstated - for instance the claim that aperiodic activity distorts interpretations of theta specifically, versus having a more nuanced impact on the time-frequency representation. Softening some of the language may further improve the manuscript.
-
Reviewer #1 (Public review):
Summary:
Frelih et al. investigated both periodic and aperiodic activity in EEG during working memory tasks. In terms of periodic activity, they found post-stimulus decreases in alpha and beta activity, while in terms of aperiodic activity, they found a bi-phasic post-stimulus steepening of the power spectrum, which was weakly predictive of performance. They conclude that it is crucial to properly distinguish between aperiodic and periodic activity in event-related designs as the former could confound the latter. They also add to the growing body of research highlighting the functional relevance of aperiodic activity in the brain.
Strengths:
This is a well-written, timely paper that could be of interest to the field of cognitive neuroscience, especially to researchers investigating the functional role of …
Reviewer #1 (Public review):
Summary:
Frelih et al. investigated both periodic and aperiodic activity in EEG during working memory tasks. In terms of periodic activity, they found post-stimulus decreases in alpha and beta activity, while in terms of aperiodic activity, they found a bi-phasic post-stimulus steepening of the power spectrum, which was weakly predictive of performance. They conclude that it is crucial to properly distinguish between aperiodic and periodic activity in event-related designs as the former could confound the latter. They also add to the growing body of research highlighting the functional relevance of aperiodic activity in the brain.
Strengths:
This is a well-written, timely paper that could be of interest to the field of cognitive neuroscience, especially to researchers investigating the functional role of aperiodic activity. The authors describe a well-designed study that looked at both the oscillatory and non-oscillatory aspects of brain activity during a working memory task. The analytic approach is appropriate, as a state-of-the-art toolbox is used to separate these two types of activity. The results support the basic claim of the paper that it is crucial to properly distinguish between aperiodic and periodic activity in event-related designs as the former could confound the latter. They also add to the growing body of research highlighting the functional relevance of aperiodic activity in the brain. Commendably, the authors include replications of their key findings on multiple independent data sets.
Weaknesses:
The authors also claim that their results speak to the interplay between oscillatory and non-oscillatory activity, and crucially, that task-related changes in the theta frequency band - often attributed to neural oscillations in the field - are in fact only a by-product of non-oscillatory changes. I believe these claims are too bold and are not supported by compelling evidence in the paper. Some control analyses - e.g., contrasting the scalp topographies of purportedly theta and non-oscillatory effects - could help strengthen the latter argument, but it may be safest to simply soften these two claims.
In terms of the methodology used, I suggest the authors make it clearer to readers that the primary results were obtained on a sample of middle-aged-to-older-adults, some with subjective cognitive complaints, and note that while stimulus-locked event-related potentials (ERPs) were removed from the data prior to analyses, response-locked ERPs were not. This could potentially confound aperiodic findings. Contrasting the scalp topographies of response-related ERPs and the identified aperiodic components, especially the later one, could bring some clarity here too.
I have also found certain parts of the introduction to be somewhat confusing.
Comments on the latest version:
The authors have addressed several of the weaknesses I noted in my original review, specifically, they softened their claims regarding the theta findings, while simultaneously strengthening these findings with additional analyses (using simulations as well as a new measure of rhythmicity, the phase autocorrelation function, pACF). Most of the other suggested control analyses were also implemented. While I believe the fact that the participants in the main sample were not young adults could be made even more explicit, and the potential interaction between age and aperiodic changes could be unpacked a little in the discussion, the age of the sample is definitely addressed upfront.
-
Reviewer #2 (Public review):
Summary:
In this manuscript, Frelih et al, investigate the relationship between aperiodic neural activity, as measured by EEG, and working memory performance, and compares this to the more commonly analyzed periodic, and in particular theta, measures that are often associated with such tasks. To do so, they analyze a primary dataset of 57 participants engaging in an n-back task, as well as a replication dataset, and use spectral parameterization to measure periodic and aperiodic features of the data, across time. In the revision, the authors have clarified some key points, and added a series of additional analyses and controls, including the use of an additional method, that helps to complement the original analyses and further corroborates their claims. In doing so, they find both periodic and aperiodic …
Reviewer #2 (Public review):
Summary:
In this manuscript, Frelih et al, investigate the relationship between aperiodic neural activity, as measured by EEG, and working memory performance, and compares this to the more commonly analyzed periodic, and in particular theta, measures that are often associated with such tasks. To do so, they analyze a primary dataset of 57 participants engaging in an n-back task, as well as a replication dataset, and use spectral parameterization to measure periodic and aperiodic features of the data, across time. In the revision, the authors have clarified some key points, and added a series of additional analyses and controls, including the use of an additional method, that helps to complement the original analyses and further corroborates their claims. In doing so, they find both periodic and aperiodic features that relate to the task dynamics, but importantly, the aperiodic component appears to explain away what otherwise looks like theta activity in a more traditional analysis. This study therefore helps to establish that aperiodic activity is a task-relevant dynamic feature in working memory tasks and may be the underlying change in many other studies that reported 'theta' changes, but did not use methods that could differentiate periodic and aperiodic features.
Strengths:
Key strengths of this paper include that it addresses an important question - that of properly adjudicating which features of EEG recordings relate to working memory tasks - and in doing so provides a compelling answer, with important implications for considering prior work and contributing to understanding the neural underpinnings of working memory. The revision is improved by showing this using an additional analysis method. I do not find any significant faults or error with the design, analysis, and main interpretations as presented by this paper, and as such, find the approach taken to be a valid and well-enacted. The use of multiple variants of the working memory task, as well as a replication dataset significantly strengthens this manuscript, by demonstrating a degree of replicability and generalizability. This manuscript is also an important contribution to motivating best practices for analyzing neuro-electrophysiological data, including in relation to using baselining procedures. I think the updates in the revision have helped to clarify the findings and impact of this study.
Weaknesses:
Overall, I do not find any obvious weaknesses with this manuscript and it's analyses that challenge the key results and conclusions. Updates through the revision have addressed my previous points about adding some additional notes on the methods and conclusions.
-
Reviewer #3 (Public review):
Summary:
Using a specparam (1/f) analysis of task-evoked activity, the authors propose that "substantial changes traditionally attributed to theta oscillations in working memory tasks are, in fact, due to shifts in the spectral slope of aperiodic activity." This is a very bold and ambitious statement, and the field of event-related EEG would benefit from more critical assessments of the role of aperiodic changes during task events. Unfortunately, the data shown here does not support the main conclusion advanced by the authors.
Strengths:
The field of event-related EEG would benefit from more critical assessments of the role of aperiodic changes during task events. The authors perform a number of additional control analyses, including different types of baseline correction, ERP subtraction, as well as …
Reviewer #3 (Public review):
Summary:
Using a specparam (1/f) analysis of task-evoked activity, the authors propose that "substantial changes traditionally attributed to theta oscillations in working memory tasks are, in fact, due to shifts in the spectral slope of aperiodic activity." This is a very bold and ambitious statement, and the field of event-related EEG would benefit from more critical assessments of the role of aperiodic changes during task events. Unfortunately, the data shown here does not support the main conclusion advanced by the authors.
Strengths:
The field of event-related EEG would benefit from more critical assessments of the role of aperiodic changes during task events. The authors perform a number of additional control analyses, including different types of baseline correction, ERP subtraction, as well as replication of the experiment with two additional datasets.
Weaknesses:
The authors did not first show that their first task successfully evoked theta power, nor that specparam is capable of quantifying the background around a short theta burst, nor that theta effects are different between baseline corrected vs. spectral parameterized quantification.
Comments on revisions:
The authors have completed a substantial revision based on the comments from all of the reviewers. Overall, the major claims of the initial report have been profoundly tempered, but more of the conclusions are supported by the data.
-
Author Response:
The following is the authors’ response to the original reviews.
Reviewer #1 (Public review):
Expressed concern that FOOOF may not be sensitive to peaks located at the edges of the spectrum and suggested using rhythmicity as an alternative measure of oscillatory activity.
To address this concern, we first conducted a simulation in which we generated power spectra with a single periodic component while varying its parameters. The results confirmed that FOOOF may indeed have reduced sensitivity to low-frequency periodic components. In such cases, periodic activity can be conflated with aperiodic activity, leading to inflated estimates of the aperiodic component. These simulation results are presented in detail at the end of the Supplement.
To further investigate whether the low-frequency activity in our datasets may be …
Author Response:
The following is the authors’ response to the original reviews.
Reviewer #1 (Public review):
Expressed concern that FOOOF may not be sensitive to peaks located at the edges of the spectrum and suggested using rhythmicity as an alternative measure of oscillatory activity.
To address this concern, we first conducted a simulation in which we generated power spectra with a single periodic component while varying its parameters. The results confirmed that FOOOF may indeed have reduced sensitivity to low-frequency periodic components. In such cases, periodic activity can be conflated with aperiodic activity, leading to inflated estimates of the aperiodic component. These simulation results are presented in detail at the end of the Supplement.
To further investigate whether the low-frequency activity in our datasets may be oscillatory, we employed the phase-autocorrelation function (pACF), a measure of rhythmicity developed by Myrov et al. (2024). We compared pACF and FOOOF-derived parameters using linear mixed models at each channel–frequency– time point (see Methods for details). Our analyses showed that pACF activity closely resembles periodic activity across all three datasets, and is dissimilar to aperiodic parameters (see Figures 5, S4, S5, S21, S22, S34, S35). This supports the interpretation that, in our data, aperiodic activity is not conflated with periodic activity.
I was concerned that “there were no dedicated analyses in the paper to show that the aperiodic changes account for the theta changes.”
To address this concern, we used linear mixed models to estimate the association between FOOOF parameters and baseline-corrected time-frequency activity. These models were fitted at each channel-frequency-time point. Our results indicate that aperiodic activity is correlated with low-frequency (theta) baseline-corrected activity, while periodic activity is correlated primarily with activity in the alpha/beta range, but not with theta (see Figures 4, S3, S20, S33). Additionally, the exponent parameter exhibited a negative correlation in the gamma frequency range.
These findings support the reviewer's hypothesis: “I would also like to note that if the theta effect is only the aperiodic shift in disguise, we should see a concomitant increase in delta activity too – maybe even a decrease at high frequencies.” Overall, the results are consistent with our interpretation that low-frequency baseline-corrected activity reflects changes in aperiodic, rather than periodic, activity.
“On page 7 it is noted that baseline correction might subtract a significant amount of ongoing periodic activity. I would replace the word "subtract" with "remove" as not all baseline correction procedures are subtractive. Furthermore, while this sentence makes it sound like a problem, this is, to my mind, a feature, not a bug - baseline correction is meant to take away whatever is ongoing, be it oscillatory or not, and emphasise changes compared to that, in response to some event.”
We thank the reviewer for this helpful clarification. We have revised the sentence accordingly to read: “Our results show that classical baseline correction can remove continuous oscillatory activity that is present both during baseline and after stimulus onset, because it treats all baseline signals as 'background' to be removed without distinguishing between transient and continuous oscillations. While this is consistent with the intended purpose of baseline correction---to highlight changes relative to ongoing activity---it may also lead to unintended consequences, such as misinterpreting aperiodic activity as an increase in poststimulus theta oscillations.”
In addition, we have made several broader revisions throughout the manuscript to improve clarity and accuracy in response to the reviewer’s feedback:
(1) We have softened our interpretation of changes in the theta range. We no longer claim that these effects are solely due to aperiodic activity; rather, we now state that our findings suggest a potential contribution of aperiodic activity to signals typically interpreted as theta oscillations.
(2) We have revised our language to avoid suggesting a direct “interplay” between periodic and aperiodic components. Instead, we emphasize the concurrent presence of both components, using more precise and cautious formulations.
(3) We have clarified our discussion of baseline normalization approaches, explicitly noting that our findings hold regardless of whether a subtractive or divisive baseline correction was applied.
(4) Finally, we have restructured the introduction to improve readability and address points of potential confusion. Specifically, we have clarified the definition and role of 1/f activity, refined the discussion linking baseline correction to aperiodic activity, and improved transitions between key concepts.
Reviewer suggested that “it might be good to show that the findings were not driven by the cognitive-complaint subgroup (although the internal replications suggest they were not).”
We agree that it is important to demonstrate that our findings are not driven solely by the cognitive-complaint subgroup. While we did not include additional figures in the manuscript due to their limited relevance to the primary research question, we have attached figures that explicitly show the comparison between the clinical and control groups here in the response to reviewers. These figures include non-significant effects.
Author response image 1.
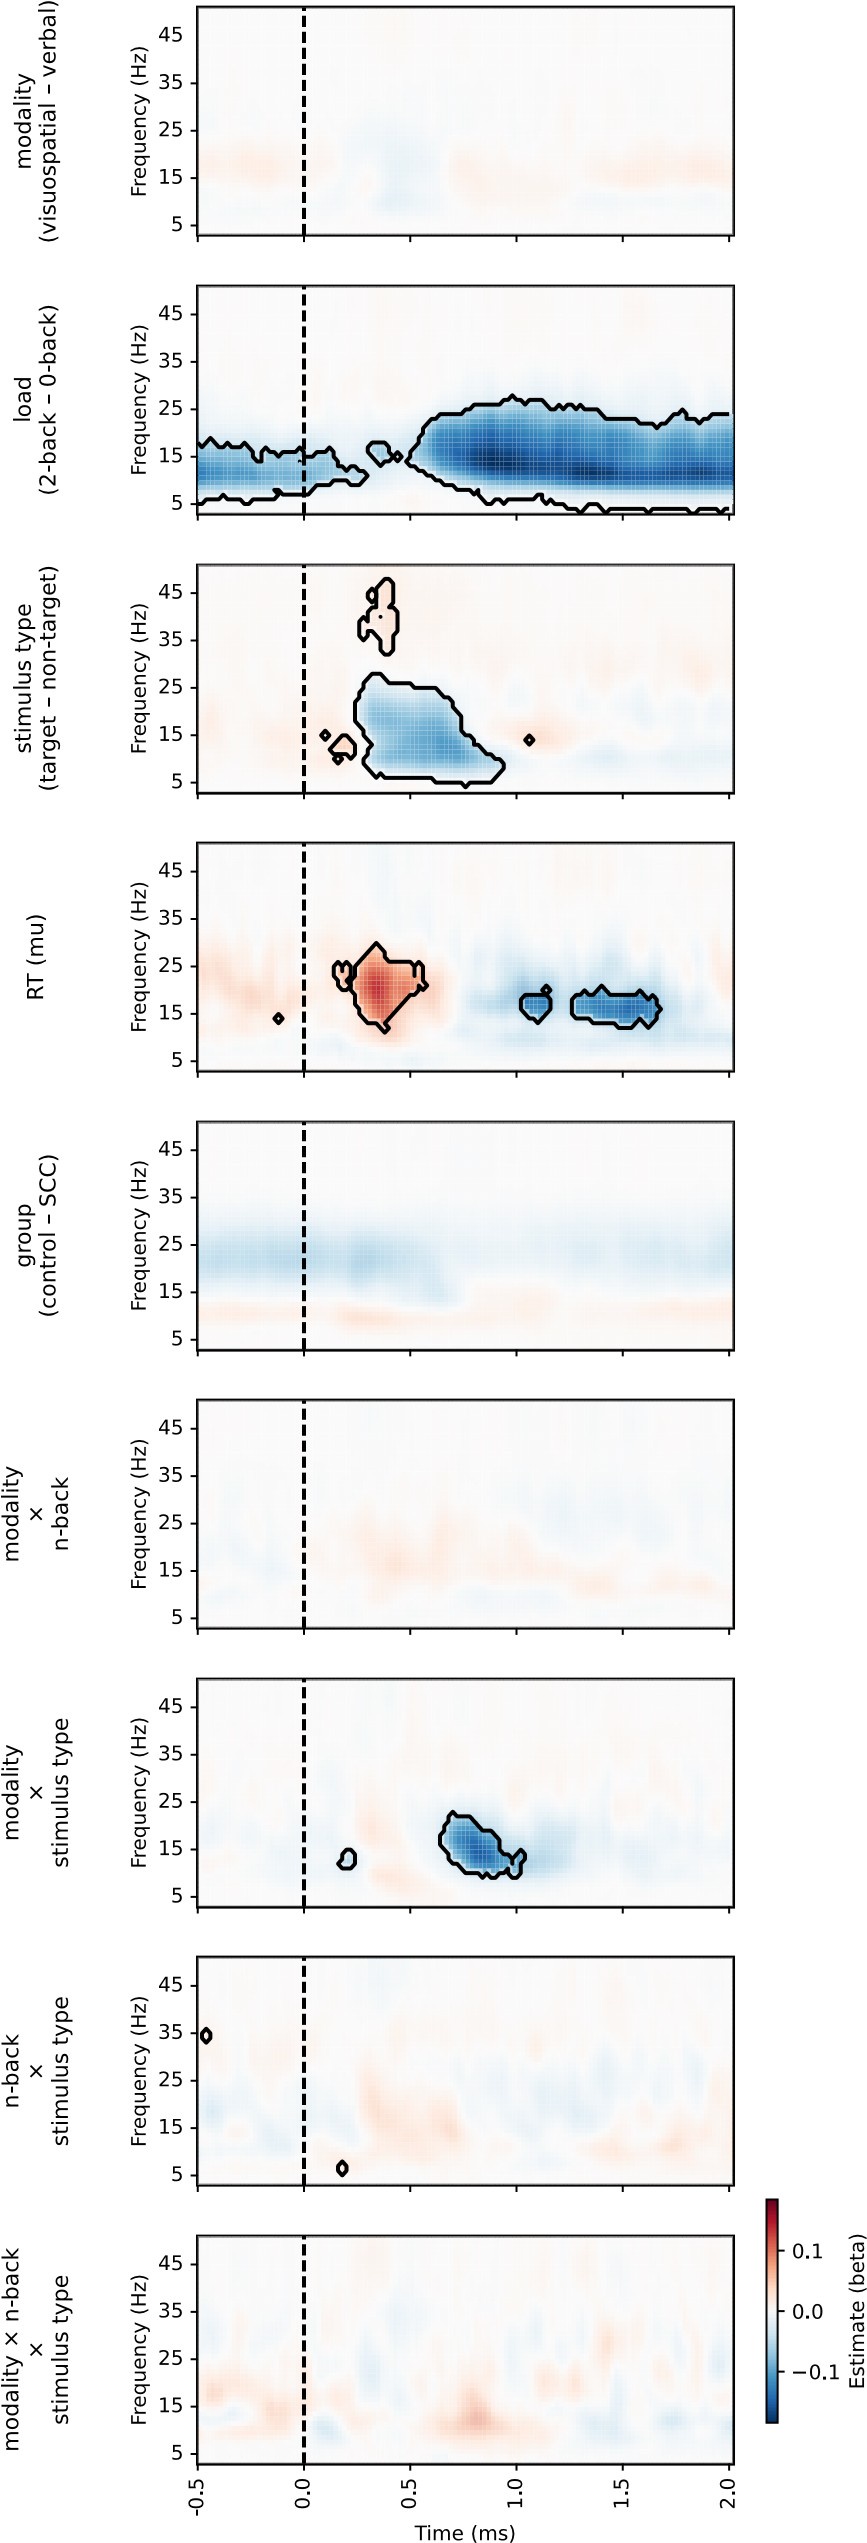
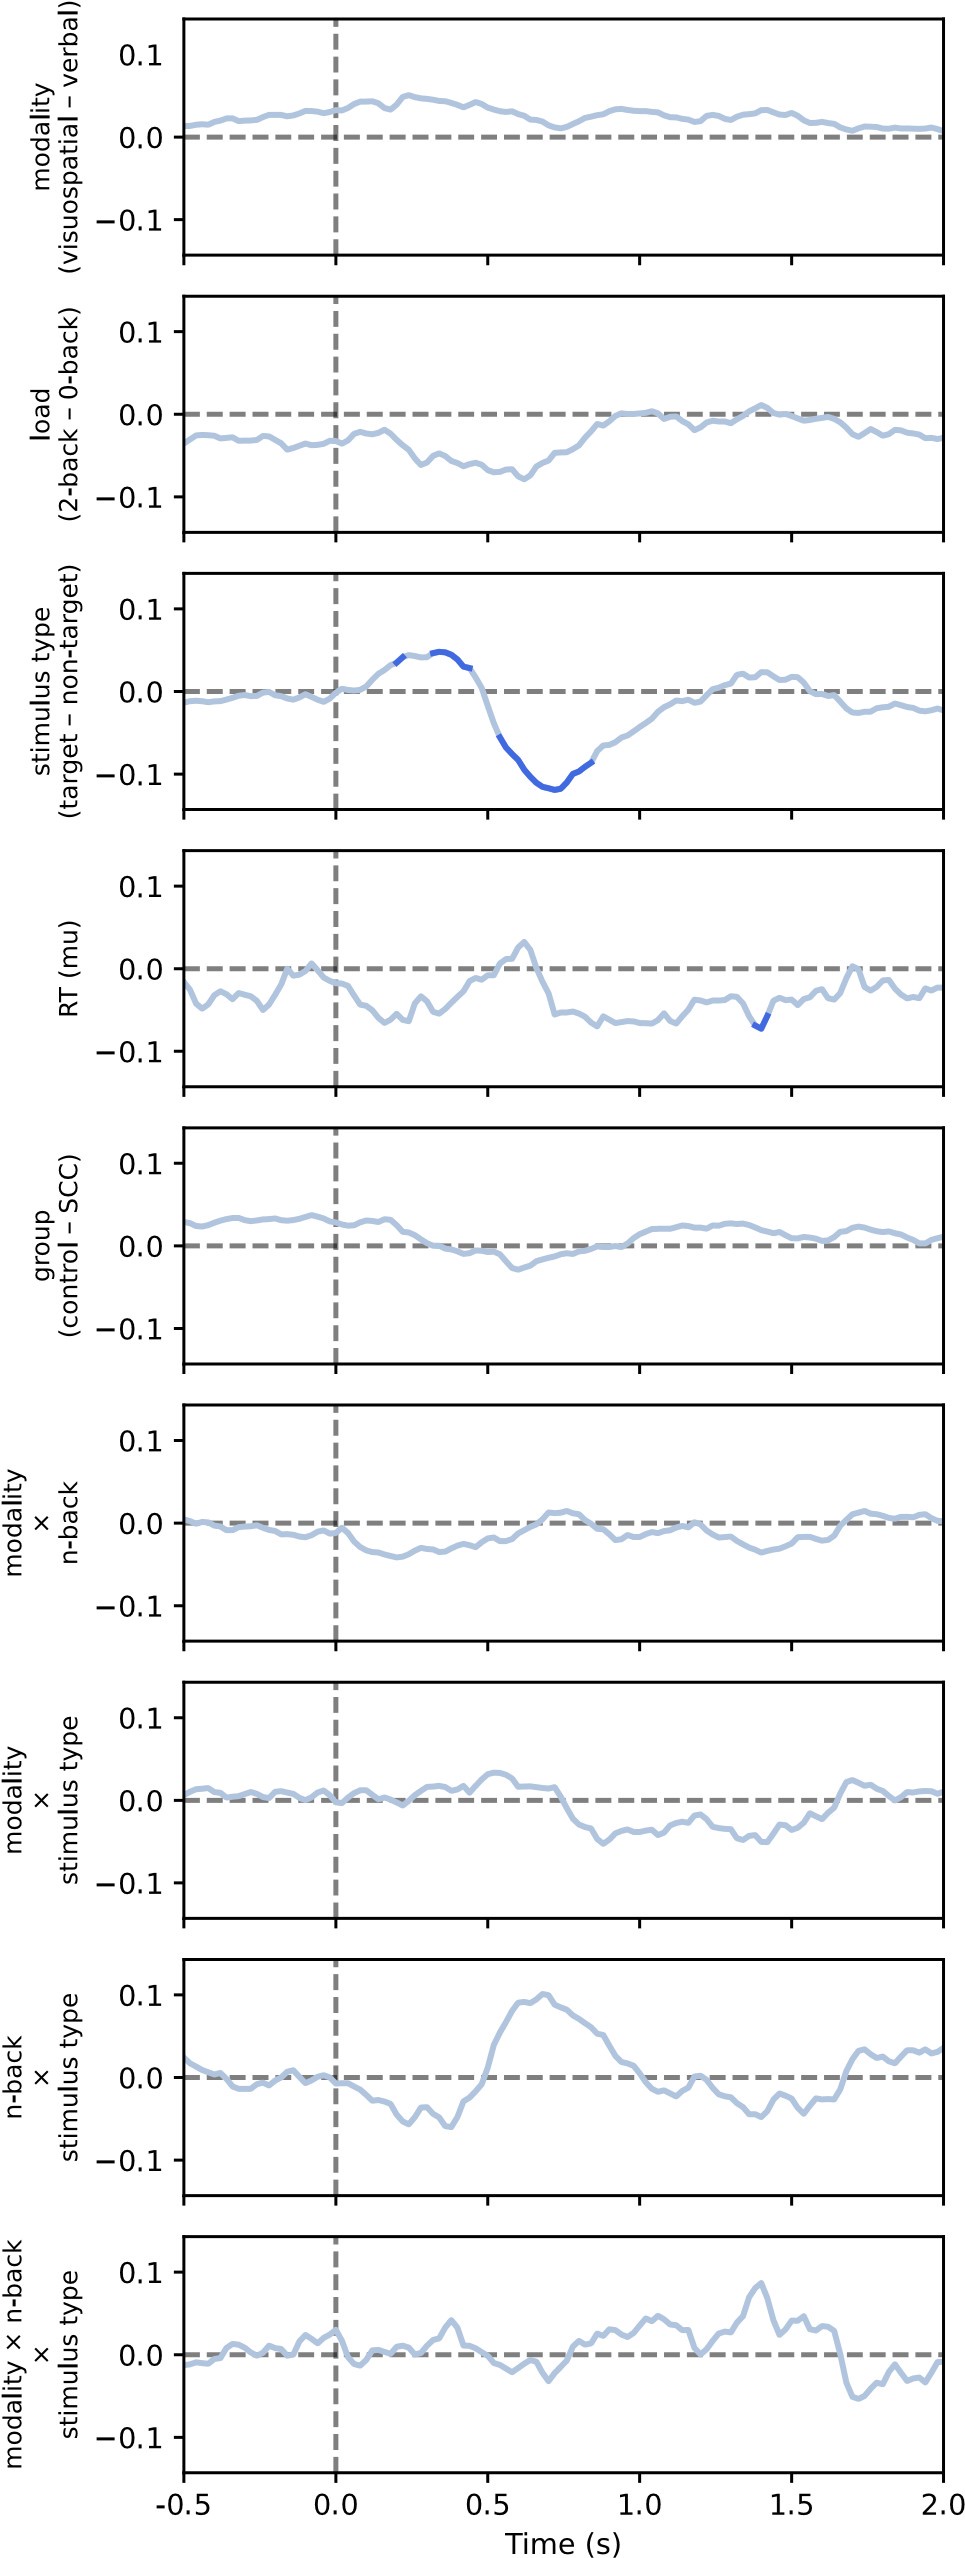
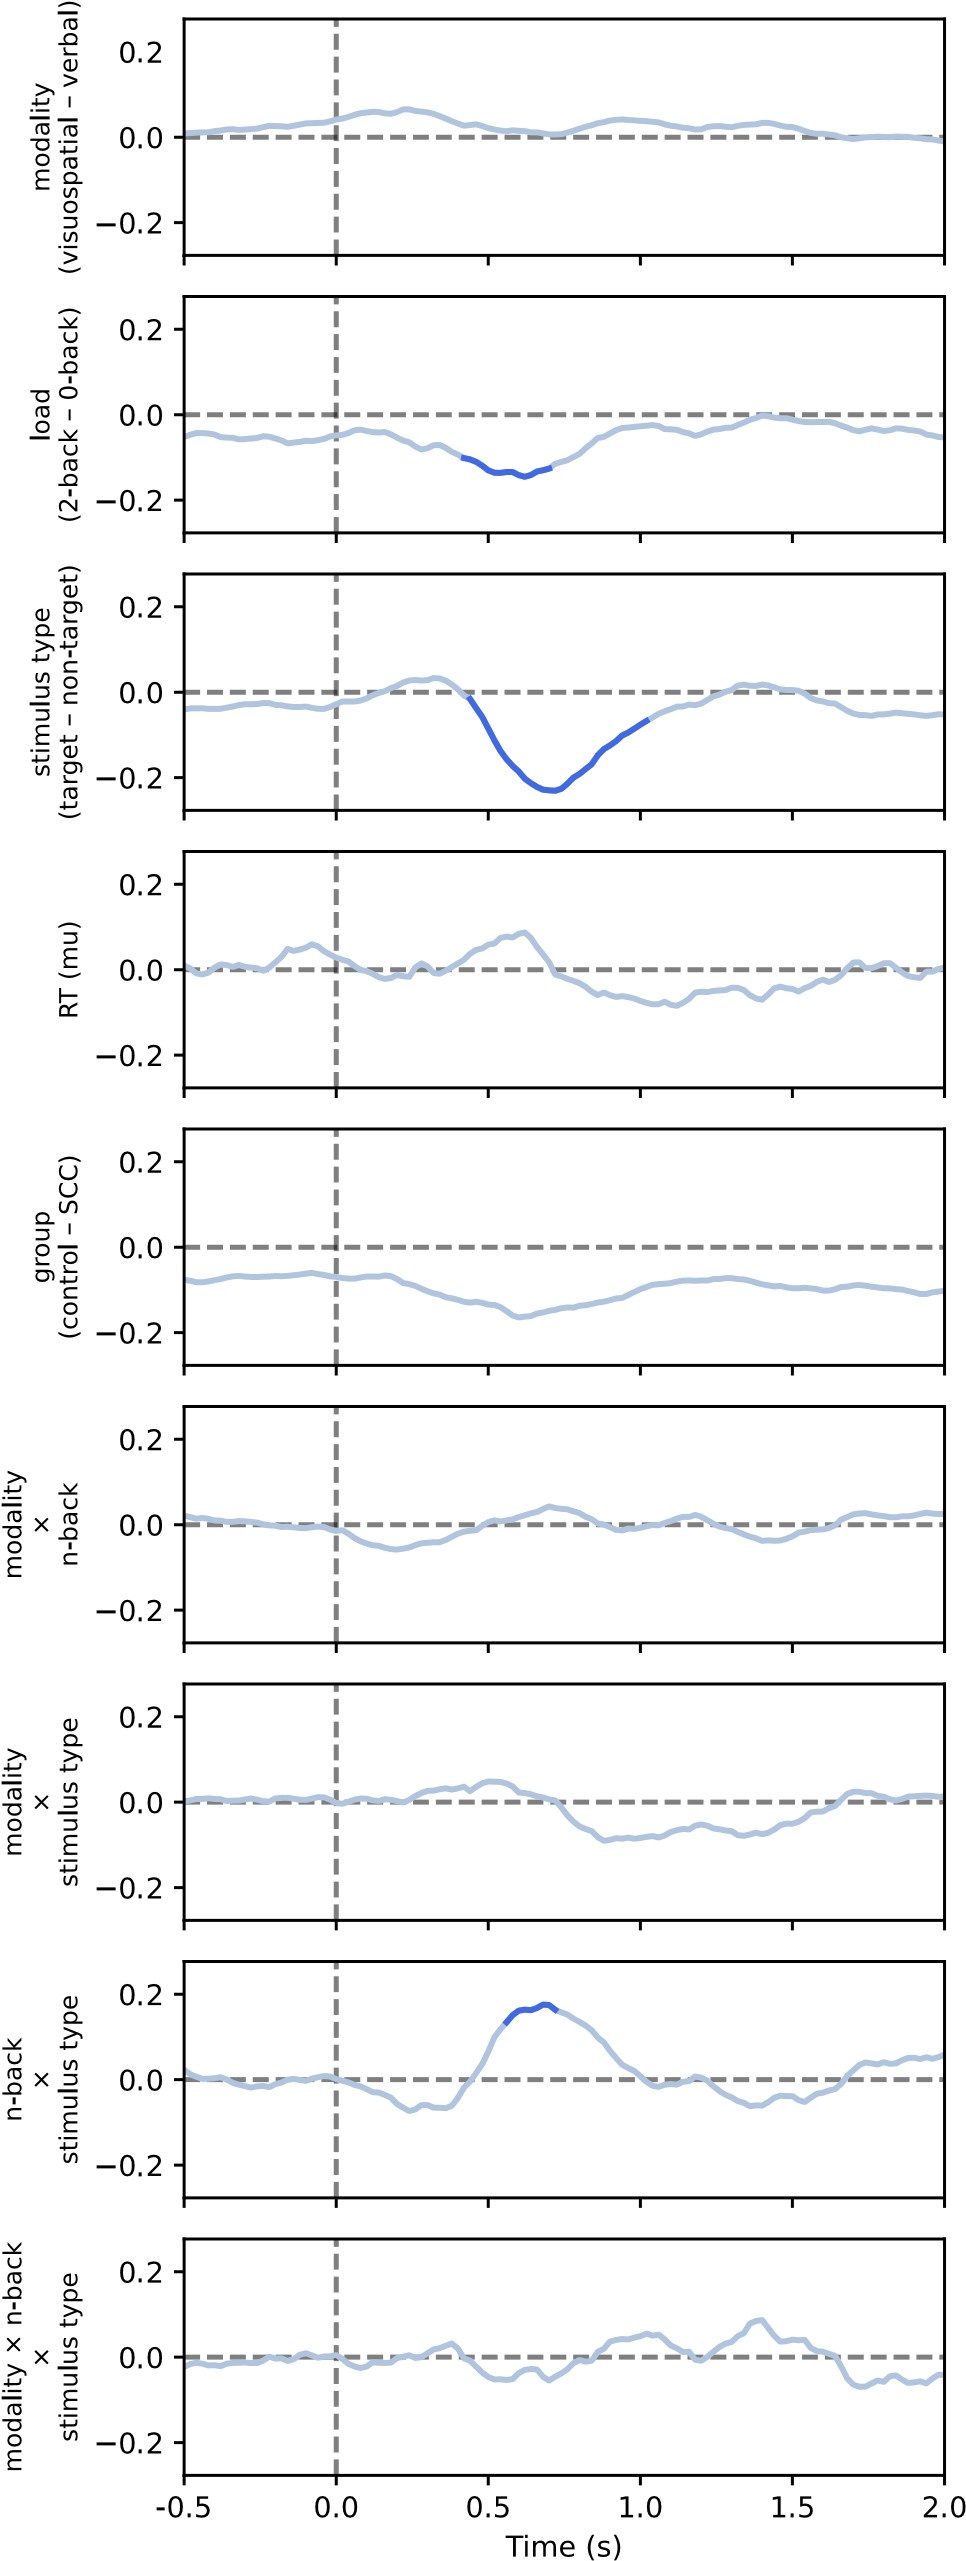
Results of the linear mixed model analysis of periodic activity for comparison between conditions, including non-significant effect (see also Figure 7 in the paper)
Author response image 2.
Results of the linear mixed model analysis of aperiodic exponent for comparison between conditions, including nonsignificant effects (see also Figure 9 in the paper)
Author response image 3.
Results of the linear mixed model analysis of aperiodic offset for comparison between conditions, including non-significant effects (see also Figure S11 in the paper)
“Were lure trials discarded completely, or were they included in the non-target group?”
Thank you for the question. As described in the Methods section (EEG data preprocessing), lure trials were discarded entirely from further analysis and were not included in the non-target group.
“Also, just as a side note, while this time-resolved approach is definitely new, it is not novel to this paper, at least two other groups have tried similar approaches, e.g., Wilson, da Silva Castanheira, & Baillet, 2022; Ameen, Jacobs, et al., 2024.”
Thank you for drawing our attention to these relevant studies. We have now cited both Wilson et al. (2022) and Ameen et al. (2024) in our manuscript. While these papers did indeed use time-resolved approaches, to our knowledge our study is the first to use such an approach within a task-based paradigm.
noted that it was unclear how the periodic component was reconstructed: “I understand that a Gaussian was recreated based on these parameters, but were frequencies between and around the Gaussians just zeroed out? Or rather, given a value of 1, so that it would be 0 after taking its log10.”
The periodic component was reconstructed by summing the Gaussians derived from the FOOOF model parameters. Since the Gaussians asymptotically approach, but never reach, zero, there were no explicit zeros between them. We have included this explanation in the manuscript.
“If my understanding is correct, the periodic and aperiodic analyses were not run on the singletrial level, but on trial-averaged TF representations. Is that correct? In that case, there was only a single observation per participant for each within-subject cell at each TF point. This means that model (4) on p. 15 just simplifies to a repeated-measures ANOVA, does it not? As hinted at later in this section, the model was run at each time point for aperiodic analyses, and at each TF point for periodic analyses, resulting in a series of p-values or a map of p-values, respectively, is that correct?”
We thank the reviewer for this careful reading and helpful interpretation. The reviewer is correct that analyses were conducted on trial-averaged time-frequency representations. Model presented in equation 7 (as referred to in the current version of the manuscript) is indeed conceptually similar to a repeated-measures ANOVA in that it tests within-subject effects across conditions. However, due to some missing data (i.e., excluded conditions within subjects), we employed linear mixed-effects models (LMER), which can handle unbalanced data without resorting to listwise deletion. This provides more flexibility and preserves statistical power.
The reviewer is also correct that the models were run at each channel-time point for the aperiodic analyses, and at each channel-time-frequency point for the periodic analyses, resulting in a series or map of p-values, respectively.
suggested marking the mean response time and contrasting scalp topographies of response-related ERPs with those of aperiodic components.
We thank the reviewer for this helpful suggestion. In response, we have now marked the mean response time and associated confidence intervals on the relevant figures (Figures 8 and S8). Additionally, we have included a new figure (Figure S13) presenting both stimulus- and response-locked ERP scalp topographies for comparison with aperiodic activity.
In the previous version of the manuscript, we assessed the relationship between ERPs and aperiodic parameters by computing correlations between their topographies at each time point. However, to maintain consistency with our other analyses and to provide a more fine-grained view, we revised this approach and now compute correlations at each channel–time point. This updated analysis is presented in Figure S14. The results confirm that the correlation between ERPs and aperiodic activity remains low, and we discuss these findings in the manuscript.
Regardless of the low correlation, we have added the following statement to the manuscript to clarify our conceptual stance: “While contrasting response-related ERPs with aperiodic components can help address potential confounds, we believe that ERPs are not inherently separate from aperiodic or periodic activity. Instead, ERPs may reflect underlying changes in aperiodic and periodic activity. Therefore, different approaches to studying EEG activity should be seen as providing complementary rather than competing perspectives.”
“On page 3, it is noted that distinct theta peaks were only observed in 2 participants. Was this through visual inspection?”
Yes, this observation was based on visual inspection of the individual power spectra. We have included this explanation in the text.
suggested improving the plots by reducing the number of conditions (e.g., averaging across conditions), increasing the size of the colorbars, and using different color scales for different frequency bands, given their differing value ranges. Additionally, the reviewer noted that the theta and alpha results appeared surprising and lacked their expected topographical patterns, possibly due to the color scale.
We appreciate these thoughtful suggestions and have implemented all of them to improve the clarity and interpretability of the figures. Specifically, we reduced the number of conditions by averaging across them where appropriate, enlarged the colorbars for better readability, and applied separate color scales for different frequency bands to account for variability in dynamic range.
In the process, we also identified and corrected an error in the code that had affected the topographies of periodic activity in the previous version of the manuscript. With this correction, the resulting topographical patterns are now more consistent with canonical findings and are easier to interpret. For example, activity in the beta range now shows a clear central distribution (see Figure 6B and Figure S5B), and frontal activity in the theta range is more apparent.
This correction also directly addresses the reviewer’s concern that the “theta and alpha results (where visible) look surprising – the characteristic mid-frontal and posterior topographies, respectively, are not really present.” These unexpected patterns were primarily due to the aforementioned error.
“Relatedly, why is the mu parameter used here for correlations? Why not simply the RT mean/median, or one of the other ex-Gaussian parameters? Was this an a priori decision?”
We appreciate the reviewer's thoughtful question. While mean and median RTs are indeed commonly used as summary measures, we chose the mu parameter because it provides a more principled estimate of central tendency that explicitly accounts for the positive skew typically observed in RT distributions. Although we did not directly compare mu, mean and median in this dataset, our experience with similar datasets suggests that differences between them are typically small. We chose not to include other ex-Gaussian parameters (e.g., sigma, tau) to avoid unnecessary model complexity and potential overfitting, especially since our primary interest was not in modelling the full distribution of response variability. This decision was made a priori, although we note that the study was not pre-registered. We have now added a clarification in the manuscript to reflect this rationale.
“Relatedly, were (some) analyses of the study preregistered?”
The analyses were not preregistered. Our initial aim was to investigate differences in phaseamplitude coupling (PAC) between the clinical and control groups. However, we did not observe clear PAC in either group—an outcome consistent with recent concerns about the validity of PAC measures in scalp EEG data (see: https://doi.org/10.3390/a16120540). This unexpected finding prompted us to shift our focus toward examining the presence of theta activity and assessing its periodicity.
The reviewer suggested examining whether there might be differences between trials preceded by a target versus trials preceded by a non-target, potentially reflecting a CNV-like mechanism.
We appreciate the reviewer’s insightful suggestion. The idea of investigating differences between trials preceded by a target versus a non-target, possibly reflecting a CNV-like mechanism, is indeed compelling. However, this question falls outside the scope of the current study and was not addressed in our analyses. We agree that this represents an interesting direction for future research.
Reviewer #2 (Public review):
“For the spectral parameterization, it is recommended to report goodness-of-fit measures, to demonstrate that the models are well fit and the resulting parameters can be interpreted.”
We thank the reviewer for this suggestion. We have added reports of goodness-of-fit measures in the supplementary material (Fig. S9, S25, S41). However, we would like to note that our simulation results suggest that high goodness-of-fit values are not always indicative of accurate parameter estimation. For example, in our simulations, the R² values remained high even when the periodic component was not detectable or when it was conflated with the aperiodic component (e.g., compare Fig. S48 with Fig. S47). We now mention this limitation in the revised manuscript to clarify the interpretation of the goodness-of-fit metrics.
“Relatedly, it is typically recommended to set a maximum number of peaks for spectral parameterization (based on the expected number in the analyzed frequency range). Without doing so, the algorithm can potentially overfit an excessive number of peaks. What is the average number of peaks fit in the parameterized spectra? Does anything change significantly in setting a maximum number of peaks? This is worth evaluating and reporting.”
We report the average number of peaks, which was 1.9—2 (Figure S10). The results were virtually identical when setting number of peaks to 3.
“In the main text, I think the analyses of 'periodic power' (e.g. section ‘Periodic activity...’ and Figures 4 & 5 could be a little clearer / more explicit on the measure being analyzed. ‘Periodic’ power could in theory refer to the total power across different frequency bands, the parameterized peaks in the spectral models, the aperiodic-removed power across frequencies, etc. Based on the methods, I believe it is either the aperiodic power or an estimate of the total power in the periodic-only model fit. The methods should be clearer on this point, and the results should specify the measure being used.”
We thank the reviewer for highlighting this point. In our analyses, “periodic power” (or “periodic activity”) refers specifically to the periodic-only model fit. We have added clarifications under Figure 3 and in the Methods section to make this explicit in the revised manuscript.
“The aperiodic component was further separated into the slope (exponent) and offset components". These two parameters describe the aperiodic component but are not a further decomposition per se - could be rephrased.”
We thank the reviewer for alerting us to this potential misunderstanding. We have now rephrased the sentence to read: “The aperiodic component was characterised by the aperiodic slope (the negative counterpart of the exponent parameter) and the offset, which together describe the underlying broadband spectral shape.”
“In the figures (e.g. Figure 5), the channel positions do not appear to be aligned with the head layout (for example - there are channels that extend out in front of the eyes).”
Corrected.
“Page 2: aperiodic activity 'can be described by a linear slope when plotted in semi-logarithmic space'. This is incorrect. A 1/f distributed power spectrum has a linear slope in log-log space, not semi-log.”
Corrected.
Page 7: "Our results clearly indicate that the classical baseline correction can subtract a significant amount of continuous periodic activity". I am unclear on what this means - it could be rephrased.
We thank the reviewer to pointing out that the statement is not clear. We have now rephrased is to read: “Our results show that classical baseline correction can remove continuous oscillatory activity that is present both during baseline and after stimulus onset, because it treats all baseline signals as 'background' to be removed without distinguishing between transient and continuous oscillations.”
”Page 14: 'the FOOOF algorithm estimates the frequency spectrum in a semi-log space'. This is not quite correct - the algorithm parameterizes the spectrum in semi-log but does not itself estimate the spectrum.”
Again, we thank the reviewer for alerting us to imprecise description. We have now changed the sentence to: “The FOOOF algorithm parameterises the frequency spectrum in a semi-logarithmic space”.
We have made refinements to improve clarity, consistency, and flow of the main text. First, we streamlined the introduction by removing redundancies and ensuring a more concise presentation of key concepts. We also clarified our use of terminology, consistently referring to the ‘aperiodic slope’ throughout the manuscript, except where methodological descriptions necessitate the term ‘exponent.’ Additionally, we revised the final section of the introduction to better integrate the discussion of generalisability, ensuring that the inclusion of additional datasets feels more seamlessly connected to the study’s main objectives rather than appearing as an addendum. Finally, we carefully reviewed the entire manuscript to enhance coherence, particularly ensuring that discussions of periodic and aperiodic activity remain precise and do not imply an assumed interplay between the two components. We believe these revisions align with the reviewer’s suggestions and improve the overall readability and logical structure of the manuscript.
Reviewer #3 (Public review):
Raised concerns regarding the task's effectiveness in evoking theta power and the ability of our spectral parameterization method (specparam) to adequately quantify background activity around theta bursts.
We thank Reviewer #3 for their constructive feedback. To address the concerns regarding the task’s effectiveness in evoking theta power and the adequacy of our spectral parameterization method, we have added additional visualizations using a log-y axis ****(Figures S1, S19, S32). These figures demonstrate that, in baseline-corrected data, low-frequency activity during working memory tasks appears as both theta and delta activity. Additionally, we have marked the borders between frequency ranges with dotted lines to facilitate clearer visual differentiation between these bands. We believe these additions help clarify the results and address the reviewer’s concerns.
The reviewer noted that “aperiodic activity seems specifically ~1–2 Hz.”
In our data baseline-corrected low-frequency post-stimulus increase in EEG activity spans from approximately 3 to 7 Hz, with no prominent peak observed in the canonical theta band (4–7 Hz). While we did not analyze frequencies below 3 Hz, we agree with the reviewer that some of this activity could potentially fall within the delta range.
Nonetheless, we would like to emphasize that similar patterns of activity have often been interpreted as theta in the literature, even in the absence of a distinct spectral peak (see: https://doi.org/10.1016/j.neulet.2012.03.076; https://doi.org/10.1016/j.brainres.2006.12.076; https://doi.org/10.1111/psyp.12500; https://doi.org/10.1038/s42003-023-05448-z — particularly, see the interpretation of State 1 as a “theta prefrontal state”).
To accommodate both interpretations, we have opted to use the more neutral term “low-frequency activity” where appropriate. However, we also clarify that such activity is frequently referred to as “theta” in prior studies, even in the absence of a clear oscillatory peak.
“Figure 4 [now Figure 6]: there is no representation of periodic theta.”
Yes, this is one of the main findings of our study - periodic theta is absent in the vast majority of participants. A similar finding was found in a recent preprint on a working memory task (https://doi.org/10.1101/2024.12.16.628786), which further supports our results.
“Figure 5 [now Figure 7]: there is some theta here, but it isn't clear that this is different from baseline corrected status-quo activity.”
This figure shows comparisons of periodic activity between conditions. Although there are differences between conditions in the theta band, this does not indicate the presence of theta oscillations. Instead, the differences between the conditions in the theta band are most likely due to alpha components extending into the theta band (see Figure S6). This is further supported by the large overlap of significant channels between theta and alpha in Figure 7.
“Figure 8: On the item-recognition task, there appears to be a short-lived burst in the high delta / low theta band, for about 500 ms. This is a short phenomenon, and there is no evidence that specparam techniques can resolve such time-limited activity.”
We thank the reviewer for their comment. As we noted in our preliminary response, specparam, in the form we used, does not incorporate temporal information; it can be applied to any power spectral density (PSD), regardless of how the PSD is derived. Therefore, the ability of specparam to resolve temporal activity depends on the time-frequency decomposition method used. In particular, the performance of specparam is limited by the underlying time-frequency decomposition method and the data available for it. In fact, Wilson et al. (2022, https://doi.org/10.7554/eLife.77348), who have developed an approach for timeresolved estimation of aperiodic parameters, actually compare two approaches that differ only in their underlying time-frequency estimation method, while the specparam algorithm is the same in both cases. For the time-frequency decomposition we used superlets (https://doi.org/10.1038/s41467-020-20539-9), which have been shown to resolve short bursts of activity more effectively than other methods. To our knowledge, superlets provide the highest resolution in both time and frequency compared to wavelets or STFT.
To improve the stability of the estimates, we performed spectral parameterisation on trial-averaged power rather than on individual trials (unlike the approach in Wilson et al., 2022). In contrast, Gyurkovics et al. (2022) who also investigated task-related changes in aperiodic activity, estimated power spectra at the single-trial level, but stabilised their estimates by averaging over 1-second time windows; however, this approach reduced their temporal resolution. We have now clarified this point in the manuscript.
“The authors note in the introduction that ‘We hypothesised that the aperiodic slope would be modulated by the processing demands of the n-back task, and that this modulation would vary according to differences in load and stimulus type.’. This type of parametric variation would be a compelling test of the hypothesis, but these analyses only included alpha and beta power (Main text & Figure 4)”
We appreciate the reviewer's comment, but would like to clarify that the comparison between conditions was performed separately for both periodic power and aperiodic parameters. The periodic power analyses included all frequencies from 3 to 50 Hz (or 35 Hz in the case of the second dataset). All factors were included in the linear model (see LMM formula in equation 7 - subsection Methods / Comparisons between experimental conditions), but the figures only include fixed effects that were statistically significant. For example, Figure 7 shows the periodic activity and Figure 9 shows the exponent, with further details provided in other supplementary figures.
“Figure 5 does show some plots with some theta activity, but it is unclear how this representation of periodic activity has anything to do with the major hypothesis that aperiodic slope accounts for taskevoked theta.” /…/ In particular, specparam is a multi-step model fitting procedure and it isn't impressively reliable even in ideal conditions (PMID: 38100367, 36094163, 39017780). To achieve the aim stated in the title, abstract, and discussion, the authors would have to first demonstrate the robustness of this technique applied to these data.
We acknowledge these concerns and have taken several steps to clarify the relationship between the aperiodic slope and low-frequency activity, and to assess the robustness of the specparam (FOOOF) approach in our data.
First, we directly compared baseline-corrected activity with periodic and aperiodic components in all three data sets. These analyses showed that low-frequency increases in baseline-corrected signals consistently tracked aperiodic parameters - in particular the aperiodic exponent - rather than periodic theta activity (see Figs 4, S3, S20, S33). Periodic components, on the other hand, were primarily associated with baseline corrected activity in the alpha and beta bands. The aperiodic exponent also showed negative correlations with high beta/gamma baseline-corrected activity, which is exactly what would be expected in the case of a shift in the aperiodic slope (rather than delta/theta oscillations). See also examples at https://doi.org/10.1038/s41593-020-00744-x (Figures 1c-iv) or https://doi.org/10.1111/ejn.15361 (Figures 3c,d).
Next, because reviewer #1 was concerned that FOOOF might be insensitive to peaks at the edges of the spectrum, we ran a simulation that confirmed this concern. We then applied an alternative phase-based measure of oscillatory activity: the phase-autocorrelation function (pACF; Myrov et al., 2024). This method does not rely on spectral fitting and is sensitive to phase rather than amplitude. Across all datasets, pACF results were in close agreement with periodic estimates from FOOOF and were not correlated with aperiodic parameter estimates (Figs 5, S4, S5, S21, S22, S34, S35).
Taken together, these complementary analyses suggest that the apparent low-frequency (delta, theta) activity observed in the baseline-corrected data is better explained by changes in the aperiodic slope than by true low-frequency oscillations. While we acknowledge the limitations of any single method, the convergence between the techniques increases our confidence in this interpretation.
“How did the authors derive time-varying changes in aperiodic slope and exponent in Figure 6 [now Figure 8]?”
We thank the reviewer for this question. As explained in the Methods section, we first performed a time-frequency decomposition, averaged across trials, and then applied a spectral decomposition to each time point.
“While these methodological details may seem trivial and surmountable, even if successfully addressed the findings would have to be very strong in order to support the rather profound conclusions that the authors made from these analyses, which I consider unsupported at this time:
(a) ‘In particular, the similarities observed in the modulation of theta-like activity attributed to aperiodic shifts provide a crucial validation of our conclusions regarding the nature of theta activity and the aperiodic component.’
(b) ‘where traditional baseline subtraction can obscure significant neural dynamics by misrepresenting aperiodic activity as theta band oscillatory activity’
(d) ‘our findings suggest that theta dynamics, as measured with scalp EEG, are predominantly a result of aperiodic shifts.’
(e) ‘a considerable proportion of the theta activity commonly observed in scalp EEG may actually be due to shifts in the aperiodic slope’.
(f) ‘It is therefore essential to independently verify whether the observed theta activity is genuinely oscillatory or primarily aperiodic’
[this would be great, but first we need to know that specparam is capable of reliably doing this].”
We believe that our claims are now supported by the aforementioned analyses, namely associations between baseline-corrected time-frequency activity and FOOOF parameters and associations between FOOOF parameters and PACF.
The reviewer found it unclear what low-frequency phase has to do with 1/f spectral changes: ‘Finally, our findings challenge the established methodologies and interpretations of EEG-measured crossfrequency coupling, particularly phase-amplitude coupling’
We thank the reviewer for their comment. To address this concern, we have added further clarification in the Discussion section. Our results are particularly relevant for phase-amplitude coupling (PAC) based on theta, such as theta-gamma coupling. PAC relies on the assumption that there are distinct oscillations at both frequencies. However, if no clear oscillations are present at these frequencies— specifically, if theta oscillations are absent—then the computation of PAC becomes problematic.
-
-
Author Response:
We would like thank reviewers for your comprehensive and insightful reviews of our manuscript. We highly value your constructive comments and suggestions and are preparing revisions that will enhance both the clarity and robustness of our study. Below is an outline of the changes we will implement in response to the points you raised.
All three reviewers expressed concerns regarding the robustness of our conclusions about the relationship between task-related theta activity and aperiodic changes. We will revise the manuscript to present these conclusions more cautiously, stating that the findings indicate a potential contribution of aperiodic activity to what is traditionally interpreted as theta activity. While our results emphasize the importance of distinguishing between periodic and aperiodic components, further …
Author Response:
We would like thank reviewers for your comprehensive and insightful reviews of our manuscript. We highly value your constructive comments and suggestions and are preparing revisions that will enhance both the clarity and robustness of our study. Below is an outline of the changes we will implement in response to the points you raised.
All three reviewers expressed concerns regarding the robustness of our conclusions about the relationship between task-related theta activity and aperiodic changes. We will revise the manuscript to present these conclusions more cautiously, stating that the findings indicate a potential contribution of aperiodic activity to what is traditionally interpreted as theta activity. While our results emphasize the importance of distinguishing between periodic and aperiodic components, further research is necessary to fully understand this relationship. We will conduct additional control analyses, including a comparison of the scalp topographies of theta and aperiodic components, to better understand the relationship between aperiodic and periodic (theta) activity.
In response to Reviewer #1's request for greater transparency in our reporting of methodological details, we will provide key clarifications. We will add a clear statement noting that the primary results are based on data from middle-aged to older adults, some of whom had subjective cognitive complaints (SCC). However, it is important to note that no differences were observed between the SCC group and the control group regarding periodic or aperiodic changes in power. Additionally, the main findings were replicated in a sample of middle-aged adults.
To address potential confounding factors, we will include an analysis contrasting response-related ERPs with the identified aperiodic components. However, we do not entirely agree with the assertion that this will necessarily clarify the results. ERPs are not inherently distinct from aperiodic (or periodic) activity; they may reflect changes in aperiodic (or periodic) power. In our view, examining aperiodic and periodic power, ERPs, or time-frequency decomposition with baseline correction provides different perspectives on the same data. Nonetheless, the combined analyses and their results are intended to guide future researchers toward the most suitable approach for interpreting this data.
Reviewer #3 raised concerns regarding the task's effectiveness in evoking theta power and the ability of spectral parameterization method (specparam) to adequately quantify background activity around theta bursts. To address these concerns, we will include additional visualizations demonstrating that the task reliably elicited theta (and delta) activity. Regarding the reviewer's concerns about specparam and theta bursts, it is important to clarify that specparam, in the form we used, does not incorporate time information; rather, it can be applied to any power spectral density (PSD), independent of how the PSD is derived. Specparam’s performance depends on the methods used to estimate frequency content. For time-frequency decomposition, we employed superlets (https://doi.org/10.1038/s41467-020-20539-9), which have been shown to resolve short bursts of activity more effectively than other methods. To our knowledge, superlets provide the highest resolution in terms of both time and frequency. Moreover, to improve stability, we performed spectral parameterization on trial-averaged power (in contrast to the approach in https://doi.org/10.7554/eLife.77348). Nonetheless, we will conduct a simulation to test whether specparam can reliably resolve low-frequency peaks over the 1/f activity.
Reviewer #2 suggested that the manuscript would benefit from a more detailed account of the effects. In response, we will include more detailed quantifications of the analyzed effects, such as model error and R² values.
We believe that the planned revisions will strengthen the manuscript and address the primary concerns raised by the reviewers. We sincerely appreciate your thoughtful feedback and look forward to submitting an improved version of the manuscript soon.
Once again, thank you for your time and expertise in reviewing our work.
Sincerely,
Andraž Matkovič & Tisa Frelih
-
eLife Assessment
This valuable work explores the timely idea that aperiodic activity in human electrophysiology recordings shows changes in response to task events, which may be relevant for performance, and that these changes could be misinterpreted as oscillatory changes. While it is a timely and interesting topic in principle, in the present form, the analytic approach is incomplete. Further, the data offer inadequate support for the conclusions related to theta without demonstrations that the task evokes theta power. Impressions were split, but there was consensus that the Discussion should be tempered and that revisions would improve the manuscript.
-
Reviewer #1 (Public review):
Summary:
Frelih et al. investigated both periodic and aperiodic activity in EEG during working memory tasks. In terms of periodic activity, they found post-stimulus decreases in alpha and beta activity, while in terms of aperiodic activity, they found a bi-phasic post-stimulus steepening of the power spectrum, which was weakly predictive of performance. They conclude that it is crucial to properly distinguish between aperiodic and periodic activity in event-related designs as the former could confound the latter. They also add to the growing body of research highlighting the functional relevance of aperiodic activity in the brain.
Strengths:
This is a well-written, timely paper that could be of interest to the field of cognitive neuroscience, especially to researchers investigating the functional role of …
Reviewer #1 (Public review):
Summary:
Frelih et al. investigated both periodic and aperiodic activity in EEG during working memory tasks. In terms of periodic activity, they found post-stimulus decreases in alpha and beta activity, while in terms of aperiodic activity, they found a bi-phasic post-stimulus steepening of the power spectrum, which was weakly predictive of performance. They conclude that it is crucial to properly distinguish between aperiodic and periodic activity in event-related designs as the former could confound the latter. They also add to the growing body of research highlighting the functional relevance of aperiodic activity in the brain.
Strengths:
This is a well-written, timely paper that could be of interest to the field of cognitive neuroscience, especially to researchers investigating the functional role of aperiodic activity. The authors describe a well-designed study that looked at both the oscillatory and non-oscillatory aspects of brain activity during a working memory task. The analytic approach is appropriate, as a state-of-the-art toolbox is used to separate these two types of activity. The results support the basic claim of the paper that it is crucial to properly distinguish between aperiodic and periodic activity in event-related designs as the former could confound the latter. They also add to the growing body of research highlighting the functional relevance of aperiodic activity in the brain. Commendably, the authors include replications of their key findings on multiple independent data sets.
Weaknesses:
The authors also claim that their results speak to the interplay between oscillatory and non-oscillatory activity, and crucially, that task-related changes in the theta frequency band - often attributed to neural oscillations in the field - are in fact only a by-product of non-oscillatory changes. I believe these claims are too bold and are not supported by compelling evidence in the paper. Some control analyses - e.g., contrasting the scalp topographies of purported theta and non-oscillatory effects - could help strengthen the latter argument, but it may be safest to simply soften these two claims.
In terms of the methodology used, I suggest the authors make it clearer to readers that the primary results were obtained on a sample of middle-aged-to-older-adults, some with subjective cognitive complaints, and note that while stimulus-locked event-related potentials (ERPs) were removed from the data prior to analyses, response-locked ERPs were not. This could potentially confound aperiodic findings. Contrasting the scalp topographies of response-related ERPs and the identified aperiodic components, especially the latter one, could bring some clarity here too.
I also found certain parts of the introduction to be somewhat confusing.
-
Reviewer #2 (Public review):
Summary:
In this manuscript, Frelih et al investigate the relationship between aperiodic neural activity, as measured by EEG, and working memory performance, and compare this to the more commonly analyzed periodic, and in particular theta, measures that are often associated with such tasks. To do so, they analyze a primary dataset of 57 participants engaging in an n-back task, as well as a replication dataset, and use spectral parameterization to measure periodic and aperiodic features of the data, across time. In doing so, they find both periodic and aperiodic features that relate to the task dynamics, but importantly the aperiodic component appears to explain away what otherwise looks like theta activity in a more traditional analysis. This study, therefore, helps to establish that aperiodic activity is a …
Reviewer #2 (Public review):
Summary:
In this manuscript, Frelih et al investigate the relationship between aperiodic neural activity, as measured by EEG, and working memory performance, and compare this to the more commonly analyzed periodic, and in particular theta, measures that are often associated with such tasks. To do so, they analyze a primary dataset of 57 participants engaging in an n-back task, as well as a replication dataset, and use spectral parameterization to measure periodic and aperiodic features of the data, across time. In doing so, they find both periodic and aperiodic features that relate to the task dynamics, but importantly the aperiodic component appears to explain away what otherwise looks like theta activity in a more traditional analysis. This study, therefore, helps to establish that aperiodic activity is a task-relevant dynamic feature in working memory tasks, and may be the underlying change in many other studies that reported 'theta' changes but did not use methods that could differentiate periodic and aperiodic features.
Strengths:
Key strengths of this paper include that it addresses an important question - that of properly adjudicating which features of EEG recordings relate to working memory tasks - and in doing so provides a compelling answer, with important implications for considering prior work and contributing to understanding the neural underpinnings of working memory. I do not find any significant faults or errors with the design, analysis, and main interpretations as presented by this paper, and as such, find the approach taken to be valid and well-enacted. The use of multiple variants of the working memory task, as well as a replication dataset significantly strengthens this manuscript, by demonstrating a degree of replicability and generalizability. This manuscript is also an important contribution to motivating best practices for analyzing neuro-electrophysiological data, including in relation to using baselining procedures.
Weaknesses:
Overall, I do not find any obvious weaknesses in this manuscript and its analyses that challenge the key results and conclusions. There are some minor reporting notes, on the methods and conclusions that I believe could be improved (details in the suggestions for authors). One aspect that could be improved is that while the figures demonstrate the main findings convincingly, the results as written could have more detailed quantifications of the analyzed effects (including, for example, more on the model results, effect sizes, and quantifications of the different features), in order to more fully report the dynamics of the analyzed features and to provide the reader with more information on the findings.
-
Reviewer #3 (Public review):
Summary:
Using a specparam (1/f) analysis of task-evoked activity, the authors propose that "substantial changes traditionally attributed to theta oscillations in working memory tasks are, in fact, due to shifts in the spectral slope of aperiodic activity." This is a very bold and ambitious statement, and the field of event-related EEG would benefit from more critical assessments of the role of aperiodic changes during task events. Unfortunately, the data shown here does not support the main conclusion advanced by the authors.
Strengths:
The field of event-related EEG would benefit from more critical assessments of the role of aperiodic changes during task events. The authors perform a number of additional control analyses, including different types of baseline correction, ERP subtraction, as well as …
Reviewer #3 (Public review):
Summary:
Using a specparam (1/f) analysis of task-evoked activity, the authors propose that "substantial changes traditionally attributed to theta oscillations in working memory tasks are, in fact, due to shifts in the spectral slope of aperiodic activity." This is a very bold and ambitious statement, and the field of event-related EEG would benefit from more critical assessments of the role of aperiodic changes during task events. Unfortunately, the data shown here does not support the main conclusion advanced by the authors.
Strengths:
The field of event-related EEG would benefit from more critical assessments of the role of aperiodic changes during task events. The authors perform a number of additional control analyses, including different types of baseline correction, ERP subtraction, as well as replication of the experiment with two additional datasets.
Weaknesses:
The authors did not first show that their first task successfully evoked theta power, nor that specparam is capable of quantifying the background around a short theta burst, nor that theta effects are different between baseline corrected vs. spectral parameterized quantifications.
-
-
