Motor biases reflect a misalignment between visual and proprioceptive reference frames
Curation statements for this article:-
Curated by eLife

eLife Assessment
This important study uses an original method to address the longstanding question of why reaching movements are often biased. The combination of a wide range of experimental conditions and computational modeling is a strength. Convincing evidence is presented in support of the main claim that most of the biases in 2-D movement planning originate in misalignment between visuo-proprioceptive reference frames.
This article has been Reviewed by the following groups
Discuss this preprint
Start a discussion What are Sciety discussions?Listed in
- Evaluated articles (eLife)
Abstract
Goal-directed movements can fail due to errors in our perceptual and motor systems. While these errors may arise from random noise within these sources, they also reflect systematic motor biases that vary with the location of the target. The origin of these systematic biases remains controversial. Drawing on data from an extensive array of reaching tasks conducted over the past 30 years, we evaluated the merits of various computational models regarding the origin of motor biases. Contrary to previous theories, we show that motor biases produced by human participants do not arise from systematic errors associated with the sensed hand position during motor planning or from the biomechanical constraints imposed during motor execution. Rather, motor biases are primarily caused by a misalignment between eye-centric and body-centric representations of position. This model can account for motor biases across a wide range of contexts, encompassing movements with the right versus left hand, finger versus hand movements, visible and occluded starting positions, as well as before and after sensorimotor adaptation.
Article activity feed
-

-
-

eLife Assessment
This important study uses an original method to address the longstanding question of why reaching movements are often biased. The combination of a wide range of experimental conditions and computational modeling is a strength. Convincing evidence is presented in support of the main claim that most of the biases in 2-D movement planning originate in misalignment between visuo-proprioceptive reference frames.
-
Reviewer #1 (Public review):
Wang et al. studied an old, still unresolved problem: Why are reaching movements often biased? Using data from a set of new experiments and from earlier studies, they identified how the bias in reach direction varies with movement direction and movement extent, and how this depends on factors such as the hand used, the presence of visual feedback, the size and location of the workspace, the visibility of the start position and implicit sensorimotor adaptation. They then examined whether a target bias, a proprioceptive bias, a bias in the transformation from visual to proprioceptive coordinates and/or biomechanical factors could explain the observed patterns of biases. The authors conclude that biases are best explained by a combination of transformation and target biases.
A strength of this study is that it …
Reviewer #1 (Public review):
Wang et al. studied an old, still unresolved problem: Why are reaching movements often biased? Using data from a set of new experiments and from earlier studies, they identified how the bias in reach direction varies with movement direction and movement extent, and how this depends on factors such as the hand used, the presence of visual feedback, the size and location of the workspace, the visibility of the start position and implicit sensorimotor adaptation. They then examined whether a target bias, a proprioceptive bias, a bias in the transformation from visual to proprioceptive coordinates and/or biomechanical factors could explain the observed patterns of biases. The authors conclude that biases are best explained by a combination of transformation and target biases.
A strength of this study is that it used a wide range of experimental conditions with also a high resolution of movement directions and large numbers of participants, which produced a much more complete picture of the factors determining movement biases than previous studies did. The study used an original, powerful and elegant method to distinguish between the various possible origins of motor bias, based on the number of peaks in the motor bias plotted as a function of movement direction. The biomechanical explanation of motor biases could not be tested in this way, but this explanation was excluded in a different way using data on implicit sensorimotor adaptation. This was also an elegant method as it allowed the authors to test biomechanical explanations without the need to commit to a certain biomechanical cost function.
Overall, the authors have done a good job mapping out reaching biases in a wide range of conditions, revealing new patterns in one of the most basic tasks, and the evidence for the proposed origins is convincing. The study will likely have substantial impact on the field, as the approach taken is easily applicable to other experimental conditions. As such, the study can spark future research on the origin of reaching biases.
Comments on revisions:
The authors have addressed my concerns convincingly. The inclusion of the data on movement extent, and the comparison with the data and explanation of Gordon et al. (1994), has strengthened the paper, as it shows that the proposed model can also explain biases in movement extent. I also appreciate the addition of the mathematical analysis, although I suspect that this analysis can be developed further to yield more detailed insights into the conditions under which the 1-, 2- and 4-peaked patterns arise, but that is a more suitable question for follow-up work.
-
Reviewer #2 (Public review):
Summary:
This work examines an important question in the planning and control of reaching movements - where do biases in our reaching movements arise and what might this tell us about the planning process. They compare several different computational models to explain the results from a range of experiments including those within the literature. Overall, they highlight that motor biases are primarily caused errors in the transformation between eye and hand reference frames. One strength of the paper is the large numbers of participants studied across many experiments. However, one weakness is that most of the experiments follow a very similar planar reaching design - with slicing movements through targets rather than stopping within a target. This is partially addressed with Exp 4. This work provides a …
Reviewer #2 (Public review):
Summary:
This work examines an important question in the planning and control of reaching movements - where do biases in our reaching movements arise and what might this tell us about the planning process. They compare several different computational models to explain the results from a range of experiments including those within the literature. Overall, they highlight that motor biases are primarily caused errors in the transformation between eye and hand reference frames. One strength of the paper is the large numbers of participants studied across many experiments. However, one weakness is that most of the experiments follow a very similar planar reaching design - with slicing movements through targets rather than stopping within a target. This is partially addressed with Exp 4. This work provides a valuable insight into the biases that govern reaching movements. While the evidence is solid for planar reaching movements, further support in the manner of 3D reaching movements would help strengthen the findings.
Strengths:
The work uses a large number of participants both with studies in the laboratory which can be controlled well and a huge number of participants via online studies. In addition, they use a large number of reaching directions allowing careful comparison across models. Together these allow a clear comparison between models which is much stronger than would usually be performed.
Comments on revisions:
I thank the authors for all the additions to the manuscript, which has addressed my concerns.
-
Reviewer #3 (Public review):
This study makes excellent use of a uniquely large dataset of reaching movements collected over several decades to evaluate the origins of systematic motor biases. The analyses convincingly demonstrate that these biases are not explained by errors in sensed hand position or by biomechanical constraints, but instead arise from a misalignment between eye-centric and body-centric representations of position. By testing multiple computational models across diverse contexts-including different effectors, visible versus occluded start positions-the authors provide strong evidence for their transformation model. My earlier concerns have been addressed, and I find the work to be a significant and timely contribution that will be of broad interest to researchers studying visuomotor control, perception, and …
Reviewer #3 (Public review):
This study makes excellent use of a uniquely large dataset of reaching movements collected over several decades to evaluate the origins of systematic motor biases. The analyses convincingly demonstrate that these biases are not explained by errors in sensed hand position or by biomechanical constraints, but instead arise from a misalignment between eye-centric and body-centric representations of position. By testing multiple computational models across diverse contexts-including different effectors, visible versus occluded start positions-the authors provide strong evidence for their transformation model. My earlier concerns have been addressed, and I find the work to be a significant and timely contribution that will be of broad interest to researchers studying visuomotor control, perception, and sensorimotor integration.
Comments on revisions:
None
-
Author response:
The following is the authors’ response to the previous reviews
General recommendations (from the Reviewing Editor):
The reviewers agreed that addressing some specific concerns would improve the clarity of the paper and the strength of the conclusions. These points are listed below, and described in more detail in the reviewer-specific 'Recommendations for Authors':
We thanks the editor and reviewers for the encouraging feedback and constructive comments. We provide our point-by-point response below.
(1) The details of the new experiment including number of subjects and a description of the analysis should be provided in the main text.
We now provide a detailed description of the methods (including the number of subjects; N = 30) and analyses for the new experiment. See our response to Reviewer 2 for more details.
(2…
Author response:
The following is the authors’ response to the previous reviews
General recommendations (from the Reviewing Editor):
The reviewers agreed that addressing some specific concerns would improve the clarity of the paper and the strength of the conclusions. These points are listed below, and described in more detail in the reviewer-specific 'Recommendations for Authors':
We thanks the editor and reviewers for the encouraging feedback and constructive comments. We provide our point-by-point response below.
(1) The details of the new experiment including number of subjects and a description of the analysis should be provided in the main text.
We now provide a detailed description of the methods (including the number of subjects; N = 30) and analyses for the new experiment. See our response to Reviewer 2 for more details.
(2) It would be informative to see how the amplitude biases observed, agree with those found by Gordon et al. 1994.
Addressed. Please see our response to Reviewer 1, comment 1.
(3) Each of the models lead to different bias patterns. It would be very helpful to hear the author's interpretation, ideally with a mathematical explanation, of what leads to these distinct patterns.
Addressed. Please see our response to Reviewer 1, comment 2.
Reviewer #1 (Recommendations for the authors):
(1) Most of my points have been addressed convincingly in this revision. The new experiment in which also biases in movement amplitude were determined is a welcome addition to the paper. However, I could not see the results of this study, as the authors did not include Fig. 4 in the manuscript, but repeated Fig. 3. That's unfortunate as I would have like to see the similarity between the biases in direction and amplitude. Moreover, I would have liked to see how the amplitude biases agree with those found by Gordon et al. EBR (1994) 99:112-130, and to which extent Gordon et al.'s explanation can explain the pattern.
We apologize for including the incorrect figure in the previous version of our manuscript. We did make a correction and submitted a corrected version, but it appears that it didn’t make its way to you. The correct Figure 4 is now in the manuscript.
The motor biases in amplitude (extent) observed in Experiment 4 (Author response image 1) are qualitatively similar to the pattern reported by Gordon et al. 1994. While the exact peaks do not match perfectly, both datasets show a two-peaked pattern.
Gordon et al. (1994) attributed the bias in amplitude to direction-dependent variation in movement speed which, in their view, arise from anisotropies in limb inertia. Specifically, moving the upper arm along its quasiorthogonal direction (i.e., rotation about the elbow) requires lower effective inertia than moving parallel to the upper-arm axis. Given the arm posture in both datasets, the upper limb points toward ~135°/315°, with the orthogonal direction corresponding to ~45°/225°. The two-peaked speed profiles in both our data Author response image 1 and Gordon et al. are consistent with this prediction.
Author response image 1.
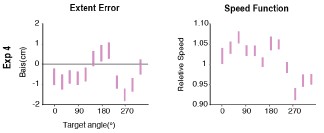
Gordon et al (1994) noted that, while the extent bias function should mirror the speed bias function, the motor planning system might proactively compensate for the speed bias. Indeed, while the extent and speed bias functions are roughly aligned in their study, the two are misaligned in our Experiment 4. For example, the speed function peaks around 45° which corresponds to a valley in the extent bias function. The difference between their data and ours could be due to a difference in the starting point configuration. However, their model predicts alignment of the speed and extent functions independent of starting point configuration. In contrast, the TR+TG model does predict our observed extent bias function and yields predictions about how this should change with different start point configurations. As such, while heterogeneity in movement speed may contribute to extent bias to some degree, we think the transformation bias and visual-target bias likely play a larger role in determining the amplitude bias observed extent bias at movement endpoint.
We have added a discussion section about the bias function reported by Gordon et al. (1994) and their account in the manuscript (lines 482-493). We do not repeat it here, as the content largely overlaps with the response above.
(2) One of the most important new insights from this study is that the three single-source models lead to different bias patterns, with 1, 2 or 4 peaks. However, what I miss in the paper is an intuitive explanation why they do so. Now, the models are described and their predictions are shown, but it remains unclear where these distinct patterns come from. As scientists, we want to understand things, so I would very much appreciate if the authors can provide such an intuitive explanation, for instance using a mathematical proof. That could also identify how general these patterns are, or if there are certain requirements for them to occur (such as a certain shape of the transformation bias).
Note that the closed-form mathematical expression for the motor bias function is not straight forward. As such, the intuition comes primarily from inspection, that is, the model simulations themselves, what we show Figure 1 of the paper. Importantly, the model predictions are insensitive to the parameter values over a reasonable range. Thus, the number of peaks predicted by each model is a core distinguishing feature. We present in the Supplementary Results a formalized mathematical analysis to illustrate how different models produce different numbers of peaks in the movement-bias function.
(3) I think it's a good idea to change the previous "Visual Bias" into a "Target Bias". This raises the question whether the "Prioprioceptive Bias" should not be changed into a "Hand Bias" or "Start Bias"?
While we appreciate the reviewer’s point here, we prefer the term “Proprioceptive Bias” given that this term has been used in the literature and provides a contrast with sources of bias arising from vision. “Hand Bias” and "Start Bias” seem more ambiguous.
L51: I think "would fall short" should be replaced by "would overshoot".
L127: I think "biased toward the vertical axis" should be replaced by "biased away from the vertical axis". Figure 3 still contains the old terminology like T+V. Please replace by the new terminology. L255: Replace "Exp 1a" by "Exp 1b".
L376: Replace 60 by 6.
L831-2: I hope the summed LL was maximized, not minimized.
Thanks for catching the typos. We have corrected all of them.
Reviewer #2 (Recommendations for the authors):
I think that Experiment 4 does not mention how many participants performed the study. (Only in the response to the reviewers I found this)
We have added information regarding the number of participants in the Fig 4 (N=30).
I am very happy that the authors added the biomechanical simulation into the paper. I am not convinced that this addressed my concerns exactly but it is an excellent addition and the authors have now adjusted the text appropriately.
We appreciate the positive response to our additional assessment of biomechanical factors. We welcome any additional information on how we might fully address this issue.
line 826: extend -> extent
Corrected.
Figure 4. I think that the authors have put the wrong figure here. I cannot see any data for extent. I would need to see this figure (or please correct me - but the caption doesn't match the figure and I don't see the results clearly. (I think the review might have the correct figure).
We apologize for this mistake. We now provided the correct Figure 4 in the paper (also included in the first page of the response letter).
I am missing the detailed description on when the direction error and distance error were calculated for exp 4 - and what exactly was used? How did the authors examine the values without correction? What time point was used? Did I miss the analysis section for this?
Participants were instructed to make fast, straight movement without any corrections and were given up to 1 s to complete the movement. Hand position was recorded once the movement speed dropped below 1 cm/s. On 99.8% of trials, movement speed did not increase once this threshold was passed, indicating that the participants adhered to the instructions. On the remaining trials, we detected a secondary corrective movement (increase in speed >5 cm/s). On these trials, we used the position recorded when the movement speed initially dropped below 1 cm/s as the endpoint position. The pattern of results would be the same were we to exclude these trials.
This information has been added to the Methods section (line 661-666).
-
-
-
eLife Assessment
This important study uses an original method to address the longstanding question of why reaching movements are often biased. The combination of a wide range of experimental conditions and computational modeling is a strength. Solid evidence is presented in support of the main claim that most of the biases in 2-D movement planning originate in misalignment between visuo-proprioceptive reference frames.
-
Reviewer #1 (Public review):
Wang et al. studied an old, still unresolved problem: Why are reaching movements often biased? Using data from a set of new experiments and from earlier studies, they identified how the bias in reach direction varies with movement direction and movement extent, and how this depends on factors such as the hand used, the presence of visual feedback, the size and location of the workspace, the visibility of the start position and implicit sensorimotor adaptation. They then examined whether a target bias, a proprioceptive bias, a bias in the transformation from visual to proprioceptive coordinates and/or biomechanical factors could explain the observed patterns of biases. The authors conclude that biases are best explained by a combination of transformation and target biases.
A strength of this study is that it …
Reviewer #1 (Public review):
Wang et al. studied an old, still unresolved problem: Why are reaching movements often biased? Using data from a set of new experiments and from earlier studies, they identified how the bias in reach direction varies with movement direction and movement extent, and how this depends on factors such as the hand used, the presence of visual feedback, the size and location of the workspace, the visibility of the start position and implicit sensorimotor adaptation. They then examined whether a target bias, a proprioceptive bias, a bias in the transformation from visual to proprioceptive coordinates and/or biomechanical factors could explain the observed patterns of biases. The authors conclude that biases are best explained by a combination of transformation and target biases.
A strength of this study is that it used a wide range of experimental conditions with also a high resolution of movement directions and large numbers of participants, which produced a much more complete picture of the factors determining movement biases than previous studies did. The study used an original, powerful and elegant method to distinguish between the various possible origins of motor bias, based on the number of peaks in the motor bias plotted as a function of movement direction. The biomechanical explanation of motor biases could not be tested in this way, but this explanation was excluded in a different way using data on implicit sensorimotor adaptation. This was also an elegant method as it allowed the authors to test biomechanical explanations without the need to commit to a certain biomechanical cost function.
Overall, the authors have done a good job mapping out reaching biases in a wide range of conditions, revealing new patterns in one of the most basic tasks, and the evidence for the proposed origins is convincing. The study will likely have substantial impact on the field, as the approach taken is easily applicable to other experimental conditions. As such, the study can spark future research on the origin of reaching biases.
-
Reviewer #2 (Public review):
Summary:
This work examines an important question in the planning and control of reaching movements - where do biases in our reaching movements arise and what might this tell us about the planning process. They compare several different computational models to explain the results from a range of experiments including those within the literature. Overall, they highlight that motor biases are primarily caused errors in the transformation between eye and hand reference frames. One strength of the paper is the large numbers of participants studied across many experiments. However, one weakness is that most of the experiments follow a very similar planar reaching design - with slicing movements through targets rather than stopping within a target. This is partially addressed with Exp 4. This work provides a …
Reviewer #2 (Public review):
Summary:
This work examines an important question in the planning and control of reaching movements - where do biases in our reaching movements arise and what might this tell us about the planning process. They compare several different computational models to explain the results from a range of experiments including those within the literature. Overall, they highlight that motor biases are primarily caused errors in the transformation between eye and hand reference frames. One strength of the paper is the large numbers of participants studied across many experiments. However, one weakness is that most of the experiments follow a very similar planar reaching design - with slicing movements through targets rather than stopping within a target. This is partially addressed with Exp 4. This work provides a valuable insight into the biases that govern reaching movements. While the evidence is solid for planar reaching movements, further support in the manner of 3D reaching movements would help strengthen the findings.
Strengths:
The work uses a large number of participants both with studies in the laboratory which can be controlled well and a huge number of participants via online studies. In addition, they use a large number of reaching directions allowing careful comparison across models. Together these allow a clear comparison between models which is much stronger than would usually be performed.
-
Reviewer #3 (Public review):
This study makes excellent use of a uniquely large dataset of reaching movements collected over several decades to evaluate the origins of systematic motor biases. The analyses convincingly demonstrate that these biases are not explained by errors in sensed hand position or by biomechanical constraints, but instead arise from a misalignment between eye-centric and body-centric representations of position. By testing multiple computational models across diverse contexts-including different effectors, visible versus occluded start positions-the authors provide strong evidence for their transformation model. My earlier concerns have been addressed, and I find the work to be a significant and timely contribution that will be of broad interest to researchers studying visuomotor control, perception, and …
Reviewer #3 (Public review):
This study makes excellent use of a uniquely large dataset of reaching movements collected over several decades to evaluate the origins of systematic motor biases. The analyses convincingly demonstrate that these biases are not explained by errors in sensed hand position or by biomechanical constraints, but instead arise from a misalignment between eye-centric and body-centric representations of position. By testing multiple computational models across diverse contexts-including different effectors, visible versus occluded start positions-the authors provide strong evidence for their transformation model. My earlier concerns have been addressed, and I find the work to be a significant and timely contribution that will be of broad interest to researchers studying visuomotor control, perception, and sensorimotor integration.
-
Author response:
The following is the authors’ response to the original reviews
Public Reviews:
Reviewer #1 (Public Review):
Wang et al. studied an old, still unresolved problem: Why are reaching movements often biased? Using data from a set of new experiments and from earlier studies, they identified how the bias in reach direction varies with movement direction, and how this depends on factors such as the hand used, the presence of visual feedback, the size and location of the workspace, the visibility of the start position and implicit sensorimotor adaptation. They then examined whether a visual bias, a proprioceptive bias, a bias in the transformation from visual to proprioceptive coordinates and/or biomechanical factors could explain the observed patterns of biases. The authors conclude that biases are best explained by a …
Author response:
The following is the authors’ response to the original reviews
Public Reviews:
Reviewer #1 (Public Review):
Wang et al. studied an old, still unresolved problem: Why are reaching movements often biased? Using data from a set of new experiments and from earlier studies, they identified how the bias in reach direction varies with movement direction, and how this depends on factors such as the hand used, the presence of visual feedback, the size and location of the workspace, the visibility of the start position and implicit sensorimotor adaptation. They then examined whether a visual bias, a proprioceptive bias, a bias in the transformation from visual to proprioceptive coordinates and/or biomechanical factors could explain the observed patterns of biases. The authors conclude that biases are best explained by a combination of transformation and visual biases.
A strength of this study is that it used a wide range of experimental conditions with also a high resolution of movement directions and large numbers of participants, which produced a much more complete picture of the factors determining movement biases than previous studies did. The study used an original, powerful, and elegant method to distinguish between the various possible origins of motor bias, based on the number of peaks in the motor bias plotted as a function of movement direction. The biomechanical explanation of motor biases could not be tested in this way, but this explanation was excluded in a different way using data on implicit sensorimotor adaptation. This was also an elegant method as it allowed the authors to test biomechanical explanations without the need to commit to a certain biomechanical cost function.
We thank the reviewer for their enthusiastic comments.
(1) The main weakness of the study is that it rests on the assumption that the number of peaks in the bias function is indicative of the origin of the bias. Specifically, it is assumed that a proprioceptive bias leads to a single peak, a transformation bias to two peaks, and a visual bias to four peaks, but these assumptions are not well substantiated. Especially the assumption that a transformation bias leads to two peaks is questionable. It is motivated by the fact that biases found when participants matched the position of their unseen hand with a visual target are consistent with this pattern. However, it is unclear why that task would measure only the effect of transformation biases, and not also the effects of visual and proprioceptive biases in the sensed target and hand locations. Moreover, it is not explained why a transformation bias would lead to this specific bias pattern in the first place.
We would like to clarify two things.
Frist, the measurements of the transformation bias are not entirely independent of proprioceptive and visual biases. Specifically, we define transformation bias as the misalignment between the internal representation of a visual target and the corresponding hand position. By this definition, the transformation error entails both visual and proprioceptive biases (see Author response image 1). Transformation biases have been empirically quantified in numerous studies using matching tasks, where participants either aligned their unseen hand to a visual target (Wang et al., 2021) or aligned a visual target to their unseen hand (Wilson et al., 2010). Indeed, those tasks are always considered as measuring proprioceptive biases assuming visual bias is small given the minimal visual uncertainty.
Author response image 1.
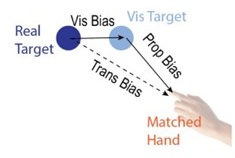
Second, the critical difference between models is in how these biases influence motor planning rather than how those biases are measured. In the Proprioceptive bias model, a movement is planned in visual space. The system perceives the starting hand position in proprioceptive space and transforms this into visual space (Vindras & Viviani, 1998; Vindras et al., 2005). As such, bias only affects the perceived starting position; there is no influence on the perceived target location (no visual bias).
In contrast, the Transformation bias model proposes that while both the starting and target positions are perceived in visual space, movement is planned in proprioceptive space. Consequently, both positions must be transformed from visual space to proprioceptive coordinates before movement planning (i.e., where is my sensed hand and where do I want it to be). Under this framework, biases can emerge from both the start and target positions. This is how the transformation model leads to different predictions compared to the perceptual models, even if the bias is based on the same measurements.
We now highlight the differences between the Transformation bias model and the Proprioceptive bias model explicitly in the Results section (Lines 192-200):
“Note that the Proprioceptive Bias model and the Transformation Bias model tap into the same visuo-proprioceptive error map. The key difference between the two models arises in how this error influences motor planning. For the Proprioceptive Bias model, planning is assumed to occur in visual space. As such, the perceived position of the hand (based on proprioception) is transformed into the visual space. This will introduce a bias in the representation of the start position. In contrast, the Transformation Bias model assumes that the visually-based representations of the start and target positions need to be transformed into proprioceptive space for motor planning. As such, both positions are biased in the transformation process. In addition to differing in terms of their representation of the target, the error introduced at the start position is in opposite directions due to the direction of the transformation (see fig 1g-h).”
In terms of the motor bias function across the workspace, the peaks are quantitatively derived from the model simulations. The number of peaks depends on how we formalize each model. Importantly, this is a stable feature of each model, regardless of how the model is parameterized. Thus, the number of peaks provides a useful criterion to evaluate different models.
Figure 1 g-h illustrates the intuition of how the models generate distinct peak patterns. We edited the figure caption and reference this figure when we introduce the bias function for each model.
(2) Also, the assumption that a visual bias leads to four peaks is not well substantiated as one of the papers on which the assumption was based (Yousif et al., 2023) found a similar pattern in a purely proprioceptive task.
What we referred to in the original submission as “visual bias” is not an eye-centric bias, nor is it restricted to the visual system. Rather, it may reflect a domain-general distortion in the representation of position within polar space. We called it a visual bias as it was associated with the perceived location of the visual target in the current task. To avoid confusion, we have opted to move to a more general term and now refer to this as “target bias.”
We clarify the nature of this bias when introducing the model in the Results section (Lines 164-169):
“Since the task permits free viewing without enforced fixation, we assume that participants shift their gaze to the visual target; as such, an eye-centric bias is unlikely. Nonetheless, prior studies have shown a general spatial distortion that biases perceived target locations toward the diagonal axes(Huttenlocher et al., 2004; Kosovicheva & Whitney, 2017). Interestingly, this bias appears to be domain-general, emerging not only for visual targets but also for proprioceptive ones(Yousif et al., 2023). We incorporated this diagonal-axis spatial distortion into a Target Bias model. This model predicts a four-peaked motor bias pattern (Fig 1f).”
We also added a paragraph in the Discussion to further elaborate on this model (Lines 502-511):
“What might be the source of the visual bias in the perceived location of the target? In the perception literature, a prominent theory has focused on the role of visual working memory account based on the observation that in delayed response tasks, participants exhibit a bias towards the diagonals when recalling the location of visual stimuli(Huttenlocher et al., 2004; Sheehan & Serences, 2023). Underscoring that the effect is not motoric, this bias is manifest regardless of whether the response is made by an eye movement, pointing movement, or keypress(Kosovicheva & Whitney, 2017). However, this bias is unlikely to be dependent on a visual input as similar diagonal bias is observed when the target is specified proprioceptively via the passive displacement of an unseen hand(Yousif et al., 2023). Moreover, as shown in the present study, a diagonal bias is observed even when the target is continuously visible. Thus, we hypothesize that the bias to perceive the target towards the diagonals reflects a more general distortion in spatial representation rather than being a product of visual working memory.”
(3) Another weakness is that the study looked at biases in movement direction only, not at biases in movement extent. The models also predict biases in movement extent, so it is a missed opportunity to take these into account to distinguish between the models.
We thank the reviewer for this suggestion. We have now conducted a new experiment to assess angular and extent biases simultaneously (Figure 4a; Exp. 4; N = 30). Using our KINARM system, participants were instructed to make center-out movements that would terminate (rather than shoot past) at the visual target. No visual feedback was provided throughout the experiment.
The Transformation Bias model predicts a two-peaked error function in both the angular and extent dimensions (Figure 4c). Strikingly, when we fit the data from the new experiment to both dimensions simultaneously, this model captures the results qualitatively and quantitatively (Figure 4e). In terms of model comparison, it outperformed alternative models (Figure 4g) particularly when augmented with a visual bias component. Together, these results provide strong evidence that a mismatch between visual and proprioceptive space is a key source of motor bias.
This experiment is now reported within the revised manuscript (Lines 280-301).
Overall, the authors have done a good job mapping out reaching biases in a wide range of conditions, revealing new patterns in one of the most basic tasks, but unambiguously determining the origin of these biases remains difficult, and the evidence for the proposed origins is incomplete. Nevertheless, the study will likely have a substantial impact on the field, as the approach taken is easily applicable to other experimental conditions. As such, the study can spark future research on the origin of reaching biases.
We thank the reviewer for these summary comments. We believe that the new experiments and analyses do a better job of identifying the origins of motor biases.
Reviewer #2 (Public Review):
Summary:
This work examines an important question in the planning and control of reaching movements - where do biases in our reaching movements arise and what might this tell us about the planning process? They compare several different computational models to explain the results from a range of experiments including those within the literature. Overall, they highlight that motor biases are primarily caused by errors in the transformation between eye and hand reference frames. One strength of the paper is the large number of participants studied across many experiments. However, one weakness is that most of the experiments follow a very similar planar reaching design - with slicing movements through targets rather than stopping within a target. Moreover, there are concerns with the models and the model fitting. This work provides valuable insight into the biases that govern reaching movements, but the current support is incomplete.
Strengths:
The work uses a large number of participants both with studies in the laboratory which can be controlled well and a huge number of participants via online studies. In addition, they use a large number of reaching directions allowing careful comparison across models. Together these allow a clear comparison between models which is much stronger than would usually be performed.
We thank the reviewer for their encouraging comments.
Weaknesses:
Although the topic of the paper is very interesting and potentially important, there are several key issues that currently limit the support for the conclusions. In particular I highlight:
(1) Almost all studies within the paper use the same basic design: slicing movements through a target with the hand moving on a flat planar surface. First, this means that the authors cannot compare the second component of a bias - the error in the direction of a reach which is often much larger than the error in reaching direction.
Reviewer 1 made a similar point, noting that we had missed an opportunity to provide a more thorough assessment of reaching biases. As described above, we conducted a new experiment in which participants made pointing movements, instructed to terminate the movements at the target. These data allow us to analyze errors in both angular and extent dimensions. The transformation bias model successfully predicts angular and extent biases, outperformed the other models at both group and individual levels. We have now included this result as Exp 4 in the manuscript. Please see response to Reviewer 1 Comment 3 for details.
Second, there are several studies that have examined biases in three-dimensional reaching movements showing important differences to two-dimensional reaching movements (e.g. Soechting and Flanders 1989). It is unclear how well the authors' computational models could explain the biases that are present in these much more common-reaching movements.
This is an interesting issue to consider. We expect the mechanisms identified in our 2D work will generalize to 3D.
Soechting and Flanders (1989) quantified 3D biases by measuring errors across multiple 2D planes at varying heights (see Author response image 2 for an example from their paper). When projecting their 3-D bias data to a horizontal 2D space, the direction of the bias across the 2D plane looks relatively consistent across different heights even though the absolute value of the bias varies (Author response image 2). For example, the matched hand position is generally to the leftwards and downward of the target. Therefore, the models we have developed and tested in a specific 2D plane are likely to generalize to other 2D plane of different heights.
Author response image 2.
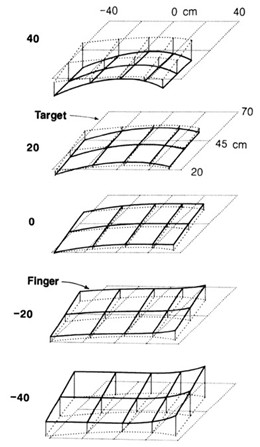
However, we think the biases reported by Soechting and Flanders likely reflect transformation biases rather than motor biases. First, the movements in their study were performed very slowly (3–5 seconds), more similar to our proprioceptive matching tasks and much slower than natural reaching movements (<500ms). Given the slow speed, we suspect that motor planning in Soechting and Flanders was likely done in a stepwise, incremental manner (closed loop to some degree). Second, the bias pattern reported in Soechting and Flanders —when projected into 2D space— closely mirrors the leftward transformation errors observed in previous visuo-proprioceptive matching task (e.g., Wang et al., 2021).
In terms of the current manuscript, we think that our new experiment (Exp 4, where we measure angular and radial error) provides strong evidence that the transformation bias model generalizes to more naturalistic pointing movements. As such, we expect these principles will generalize were we to examine movements in three dimensions, an extension we plan to test in future work.
(2) The model fitting section is under-explained and under-detailed currently. This makes it difficult to accurately assess the current model fitting and its strength to support the conclusions. If my understanding of the methods is correct, then I have several concerns. For example, the manuscript states that the transformation bias model is based on studies mapping out the errors that might arise across the whole workspace in 2D. In contrast, the visual bias model appears to be based on a study that presented targets within a circle (but not tested across the whole workspace). If the visual bias had been measured across the workspace (similar to the transformation bias model), would the model and therefore the conclusions be different?
We have substantially expanded the Methods section to clarify the modeling procedures (detailed below in section “Recommendations for the Authors”). We also provide annotated code to enable others to easily simulate the models.
Here we address three points relevant to the reviewer’s concern about whether the models were tested on equal footing, and in particular, concern that the transformation bias model was more informed by prior literature than the visual bias model.
First, our center-out reaching task used target locations that have been employed in both visual and proprioceptive bias studies, offering reasonable comprehensive coverage of the workspace. For example, for a target to the left of the body’s midline, visual biases tend to be directed diagonally (Kosovicheva & Whitney, 2017), while transformation biases are typically leftward and downward (Wang et al, 2021). In this sense, the models were similarly constrained by prior findings.
Second, while the qualitative shape of each model was guided by prior empirical findings, no previous data were directly used to quantitatively constrain the models. As such, we believe the models were evaluated on equal footing. No model had more information or, best we can tell, an inherent advantage over the others.
Third, reassuringly, the fitted transformation bias closely matches empirically observed bias maps reported in prior studies (Fig 2h). The strong correspondence provides convergent validity and supports the putative causality between transformation biases to motor biases.
(3) There should be other visual bias models theoretically possible that might fit the experimental data better than this one possible model. Such possibilities also exist for the other models.
Our initial hypothesis, grounded in prior literature, was that motor biases arise from a combination of proprioceptive and visual biases. This led us to thoroughly explore a range of visual models. We now describe these alternatives below, noting that in the paper, we chose to focus on models that seemed the most viable candidates. (Please also see our response to Reviewer 3, Point 2, on another possible source of visual bias, the oblique effect.)
Quite a few models have described visual biases in perceiving motion direction or object orientation (e.g., Wei & Stocker, 2015; Patten, Mannion & Clifford, 2017). Orientation perception would be biased towards the Cartesian axis, generating a four-peak function. However, these models failed to account for the motor biases observed in our experiments. This is not surprising given that these models were not designed to capture biases related to a static location.
We also considered a class of eye-centric models where biases for peripheral locations are measured under fixation. A prominent finding here is that the bias is along the radial axis in which participants overshoot targets when they fixate on the start position during the movement (Beurze et al., 2006; Van Pelt & Medendorp, 2008). Again, this is not consistent with the observed motor biases. For example, participants undershoot rightward targets when we measured the distance bias in Exp 4. Importantly, since most our tasks involved free viewing in natural settings with no fixation requirements, we considered it unlikely that biases arising from peripheral viewing play a major role.
We note, though, that in our new experiment (Exp 4), participants observed the visual stimuli from a fixed angle in the KinArm setup (see Figure 4a). This setup has been shown to induce depth-related visual biases (Figure 4b, e.g., Volcic et al., 2013; Hibbard & Bradshaw, 2003). For this reason, we implemented a model incorporating this depth bias as part of our analyses of these data. While this model performed significantly worse than the transformation bias model alone, a mixed model that combined the depth bias and transformation bias provided the best overall fit. We now include this result in the main text (Lines 286-294).
We also note that the “visual bias” we referred to in the original submission is not restricted to the visual system. A similar bias pattern has been observed when the target is presented visually or proprioceptively (Kosovicheva & Whitney, 2017; Yousif, Forrence, & McDougle, 2023). As such, it may reflect a domaingeneral distortion in the representation of position within polar space. Accordingly, in the revision, we now refer to this in a more general way, using the term “target bias.” We justify this nomenclature when introducing the model in the Results section (Lines 164-169). Please also see Reviewer 1 comment 2.
We recognize that future work may uncover a better visual model or provide a more fine-grained account of visual biases (or biases from other sources). With our open-source simulation code, such biases can be readily incorporated—either to test them against existing models or to combine them with our current framework to assess their contribution to motor biases. Given our explorations, we expect our core finding will hold: Namely, that a combination of transformation and target biases offers the most parsimonious account, with the bias associated with the transformation process explaining the majority of the observed motor bias in visually guided movements.
Given the comments from the reviewer, we expanded the discussion session to address the issue of alternative models of visual bias (lines 522-529):
“Other forms of visual bias may influence movement. Depth perception biases could contribute to biases in movement extent(Beurze et al., 2006; Van Pelt & Medendorp, 2008). Visual biases towards the principal axes have been reported when participants are asked to report the direction of moving targets or the orientation of an object(Patten et al., 2017; Wei & Stocker, 2015). However, the predicted patterns of reach biases do not match the observed biases in the current experiments. We also considered a class of eye-centric models in which participants overestimate the radial distance to a target while maintaining central fixation(Beurze et al., 2006; Van Pelt & Medendorp, 2008). At odds with this hypothesis, participants undershot rightward targets when we measured the radial bias in Exp 4. The absence of these other distortions of visual space may be accounted for by the fact that we allowed free viewing during the task.”
(4) Although the authors do mention that the evidence against biomechanical contributions to the bias is fairly weak in the current manuscript, this needs to be further supported. Importantly both proprioceptive models of the bias are purely kinematic and appear to ignore the dynamics completely. One imagines that there is a perceived vector error in Cartesian space whereas the other imagines an error in joint coordinates. These simply result in identical movements which are offset either with a vector or an angle. However, we know that the motor plan is converted into muscle activation patterns which are sent to the muscles, that is, the motor plan is converted into an approximation of joint torques. Joint torques sent to the muscles from a different starting location would not produce an offset in the trajectory as detailed in Figure S1, instead, the movements would curve in complex patterns away from the original plan due to the non-linearity of the musculoskeletal system. In theory, this could also bias some of the other predictions as well. The authors should consider how the biomechanical plant would influence the measured biases.
We thank the reviewer for encouraging us on this topic and to formalize a biomechanical model. In response, we have implemented a state-of-the-art biomechanical framework, MotorNet
(https://elifesciences.org/articles/88591), which simulates a six-muscle, two-skeleton planar arm model using recurrent neural networks (RNNs) to generate control policies (See Figure 6a). This model captures key predictions about movement curvature arising from biomechanical constraints. We view it as a strong candidate for illustrating how motor bias patterns could be shaped by the mechanical properties of the upper limb.
Interestingly, the biomechanical model did not qualitatively or quantitatively reproduce the pattern of motor biases observed in our data. Specifically, we trained 50 independent agents (RNNs) to perform random point-to-point reaching movements across the workspace used in our task. We used a loss function that minimized the distance between the fingertip and the target over the entire trajectory. When tested on a center-out reaching task, the model produced a four-peaked motor bias pattern (Figure 6b), in contrast to the two-peaked function observed empirically. These results suggest that upper limb biomechanical constraints are unlikely to be a primary driver of motor biases in reaching. This holds true even though the reported bias is read out at 60% of the reaching distance, where biomechanical influences on the curvature of movement are maximal. We have added this analysis to the results (lines 367-373).
It may seem counterintuitive that biomechanics plays a limited role in motor planning. This could be due to several factors. First, First, task demands (such as the need to grasp objects) may lead the biomechanical system to be inherently organized to minimize endpoint errors (Hu et al., 2012; Trumbower et al., 2009). Second, through development and experience, the nervous system may have adapted to these biomechanical influences—detecting and compensating for them over time (Chiel et al., 2009).
That said, biomechanical constraints may make a larger contribution in other contexts; for example, when movements involve more extreme angles or span larger distances, or in individuals with certain musculoskeletal impairments (e.g., osteoarthritis) where physical limitations are more likely to come into play. We address this issue in the revised discussion.
“Nonetheless, the current study does not rule out the possibility that biomechanical factors may influence motor biases in other contexts. Biomechanical constraints may have had limited influence in our experiments due to the relatively modest movement amplitudes used and minimal interaction torques involved. Moreover, while we have focused on biases that manifest at the movement endpoint, biomechanical constraints might introduce biases that are manifest in the movement trajectories.(Alexander, 1997; Nishii & Taniai, 2009) Future studies are needed to examine the influence of context on reaching biases.”
Reviewer #3 (Public review):
The authors make use of a large dataset of reaches from several studies run in their lab to try to identify the source of direction-dependent radial reaching errors. While this has been investigated by numerous labs in the past, this is the first study where the sample is large enough to reliably characterize isometries associated with these radial reaches to identify possible sources of errors.
(1) The sample size is impressive, but the authors should Include confidence intervals and ideally, the distribution of responses across individuals along with average performance across targets. It is unclear whether the observed “averaged function” is consistently found across individuals, or if it is mainly driven by a subset of participants exhibiting large deviations for diagonal movements. Providing individual-level data or response distributions would be valuable for assessing the ubiquity of the observed bias patterns and ruling out the possibility that different subgroups are driving the peaks and troughs. It is possible that the Transformation or some other model (see below) could explain the bias function for a substantial portion of participants, while other participants may have different patterns of biases that can be attributable to alternative sources of error.
We thank the reviewer for encouraging a closer examination of the individual-level data. We did include standard error when we reported the motor bias function. Given that the error distribution is relatively Gaussian, we opted to not show confidence intervals since they would not provide additional information.
To examine individual differences, we now report a best-fit model frequency analysis. For Exp 1, we fit each model at the individual level and counted the number of participants that are best predicted by each model. Among the four single source models (Figure 3a), the vast majority of participants are best explained by the transformation bias model (48/56). When incorporating mixture models, the combined transformation + target bias model emerged as the best fit for almost all participants across experiments (50/56). The same pattern holds for Exp 3b, the frequency analysis is more distributed, likely due to the added noise that comes with online studies.
We report this new analysis in the Results. (see Fig 3. Fig S2). Note that we opted to show some representative individual fits, selecting individuals whose data were best predicted by different models (Fig S2). Given that the number of peaks characterizes each model (independent of the specific parameter values), the two-peaked function exhibited for most participants indicates that the Transformation bias model holds at the individual level and not just at the group level.
(2) The different datasets across different experimental settings/target sets consistently show that people show fewer deviations when making cardinal-directed movements compared to movements made along the diagonal when the start position is visible. This reminds me of a phenomenon referred to as the oblique effect: people show greater accuracy for vertical and horizontal stimuli compared to diagonal ones. While the oblique effect has been shown in visual and haptic perceptual tasks (both in the horizontal and vertical planes), there is some evidence that it applies to movement direction. These systematic reach deviations in the current study thus may reflect this epiphenomenon that applies across modalities. That is, estimating the direction of a visual target from a visual start position may be less accurate, and may be more biased toward the horizontal axis, than for targets that are strictly above, below, left, or right of the visual start position. Other movement biases may stem from poorer estimation of diagonal directions and thus reflect more of a perceptual error than a motor one. This would explain why the bias function appears in both the in-lab and on-line studies although the visual targets are very different locations (different planes, different distances) since the oblique effects arise independent of plane, distance, or size of the stimuli. When the start position is not visible like in the Vindras study, it is possible that this oblique effect is less pronounced; masked by other sources of error that dominate when looking at 2D reach endpoint made from two separate start positions, rather than only directional errors from a single start position. Or perhaps the participants in the Vindras study are too variable and too few (only 10) to detect this rather small direction-dependent bias.
The potential link between the oblique effect and the observed motor bias is an intriguing idea, one that we had not considered. However, after giving this some thought, we see several arguments against the idea that the oblique effect accounts for the pattern of motor biases.
First, by the oblique effect, perceptual variability is greater along the diagonal axes compared to the cardinal axes. These differences in perceptual variability have been used to explain biases in visual perception through a Bayesian model under the assumption that the visual system has an expectation that stimuli are more likely to be oriented along the cardinal axes (Wei & Stocker, 2015). Importantly, the model predicts low biases at targets with peak perceptual variability. As such, even though those studies observed that participants showed large variability for stimuli at diagonal orientations, the bias for these stimuli was close to zero. Given we observed a large bias for targets at locations along the diagonal axes, we do not think this visual effect can explain the motor bias function.
Second, the reviewer suggested that the observed motor bias might be largely explained by visual biases (or what we now refer to as target biases). If this hypothesis is correct, we would anticipate observing a similar bias pattern in tasks that use a similar layout for visual stimuli but do not involve movement. However, this prediction is not supported. For example, Kosovicheva & Whitney (2017) used a position reproduction/judgment task with keypress responses (no reaching). The stimuli were presented in a similar workspace as in our task. Their results showed four-peaked bias function while our results showed a two-peaked function.
In summary, we don’t think oblique biases make a significant contribution to our results.
A bias in estimating visual direction or visual movement vector Is a more realistic and relevant source of error than the proposed visual bias model. The Visual Bias model is based on data from a study by Huttenlocher et al where participants “point” to indicate the remembered location of a small target presented on a large circle. The resulting patterns of errors could therefore be due to localizing a remembered visual target, or due to relative or allocentric cues from the clear contour of the display within which the target was presented, or even movements used to indicate the target. This may explain the observed 4-peak bias function or zig-zag pattern of “averaged” errors, although this pattern may not even exist at the individual level, especially given the small sample size. The visual bias source argument does not seem well-supported, as the data used to derive this pattern likely reflects a combination of other sources of errors or factors that may not be applicable to the current study, where the target is continuously visible and relatively large. Also, any visual bias should be explained by a coordinates centre on the eye and should vary as a function of the location of visual targets relative to the eyes. Where the visual targets are located relative to the eyes (or at least the head) is not reported.
Thank you for this question. A few key points to note:
The visual bias model has also been discussed in studies using a similar setup to our study. Kosovicheva & Whitney (2017) observed a four-peaked function in experiments in which participants report a remembered target position on a circle by either making saccades or using key presses to adjust the position of a dot. However, we agree that this bias may be attenuated in our experiment given that the target is continuously visible. Indeed, the model fitting results suggest the peak of this bias is smaller in our task (~3°) compared to previous work (~10°, Kosovicheva & Whitney, 2017; Yousif, Forrence, & McDougle, 2023).
We also agree with the reviewer that this “visual bias” is not an eye-centric bias, nor is it restricted to the visual system. A similar bias pattern is observed even if the target is presented proprioceptively (Yousif, Forrence, & McDougle, 2023). As such, this bias may reflect a domain-general distortion in the representation of position within polar space. Accordingly, in the revision, we now refer to this in a more general way, using the term “target bias”, rather than visual bias. We justify this nomenclature when introducing the model in the Results section (Lines 164-169). Please also see Reviewer 1 comment 2 for details.
Motivated by Reviewer 2, we also examined multiple alternative visual bias models (please refer to our response to Reviewer 2, Point 3.
The Proprioceptive Bias Model is supposed to reflect errors in the perceived start position. However, in the current study, there is only a single, visible start position, which is not the best design for trying to study the contribution. In fact, my paradigms also use a single, visual start position to minimize the contribution of proprioceptive biases, or at least remove one source of systematic biases. The Vindras study aimed to quantify the effect of start position by using two sets of radial targets from two different, unseen start positions on either side of the body midline. When fitting the 2D reach errors at both the group and individual levels (which showed substantial variability across individuals), the start position predicted most of the 2D errors at the individual level – and substantially more than the target direction. While the authors re-plotted the data to only illustrate angular deviations, they only showed averaged data without confidence intervals across participants. Given the huge variability across their 10 individuals and between the two target sets, it would be more appropriate to plot the performance separately for two target sets and show confidential intervals (or individual data). Likewise, even the VT model predictions should differ across the two targets set since the visual-proprioceptive matching errors from the Wang et al study that the model is based on, are larger for targets on the left side of the body.
To be clear, in the Transformation bias model, the vector bias at the start position is also an important source of error. The critical difference between the proprioceptive and transformation models is how bias influences motor planning. In the Proprioceptive bias model, movement is planned in visual space. The system perceives the starting hand position in proprioceptive space and transforms this into visual space (Vindras & Viviani, 1998; Vindras et al., 2005). As such, the bias is only relevant in terms of the perceived start position; it does not influence the perceived target location. In contrast, the transformation bias model proposes that while both the starting and target positions are perceived in visual space, movements are planned in proprioceptive space. Consequently, when the start and target positions are visible, both positions must be transformed from visual space to proprioceptive coordinates before movement planning. Thus, bias will influence both the start and target positions. We also note that to set the transformation bias for the start/target position, we referred to studies in which bias is usually referred to as proprioception error measurement. As such, changing the start position has a similar impact on the Transformation and the Proprioceptive Bias models in principle, and would not provide a stronger test to separate them.
We now highlight the differences between the models in the Results section, making clear that the bias at the start position influences both the Proprioceptive bias and Transformation bias models (Lines 192200).
“Note that the Proprioceptive Bias model and the Transformation Bias model tap into the same visuo-proprioceptive error map. The key difference between the two models arises in how this error influences motor planning. For the Proprioceptive Bias model, planning is assumed to occur in visual space. As such, the perceived position of the hand (based on proprioception) is transformed into visual space. This will introduce a bias in the representation of the start position. In contrast, the Transformation Bias model assumes that the visually-based representations of the start and target positions need to be transformed into proprioceptive space for motor planning. As such, both positions are biased in the transformation process. In addition to differing in terms of their representation of the target, the error introduced at the start position is in opposite directions due to the direction of the transformation (see fig 1g-h).”
In terms of fitting individual data, we have conducted a new experiment, reported as Exp 4 in the revised manuscript (details in our response to Reviewer 1, comment 3). The experiment has a larger sample size (n=30) and importantly, examined error for both movement angle and movement distance. We chose to examine the individual differences in 2-D biases using this sample rather than Vindras’ data as our experiment has greater spatial resolution and more participants. At both the group and individual level, the Transformation bias model is the best single source model, and the Transformation + Target Bias model is the best combined model. These results strongly support the idea that the transformation bias is the main source of the motor bias.
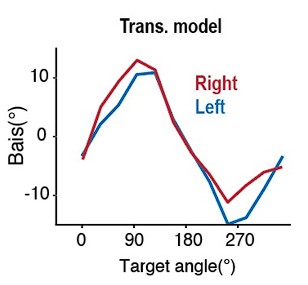
As for the different initial positions in Vindras et al (2005), the two target sets have very similar patterns of motor biases. As such, we opted to average them to decrease noise. Notably, the transformation model also predicts that altering the start location should have limited impact on motor bias patterns: What matters for the model is the relative difference between the transformation biases at the start and target positions rather than the absolute bias.
Author response image 3.
I am also having trouble fully understanding the V-T model and its associated equations, and whether visual-proprioception matching data is a suitable proxy for estimating the visuomotor transformation. I would be interested to first see the individual distributions of errors and a response to my concerns about the Proprioceptive Bias and Visual Bias models.
We apologize for the lack of clarity on this model. To generate the T+V (Now Transformation + Target bias, or TR+TG) model, we assume the system misperceives the target position (Target bias, see Fig S5a) and then transforms the start and misperceived target positions into proprioceptive space (Fig S5b). The system then generates a motor plan in proprioceptive space; this plan will result in the observed motor bias (Fig. S5c). We now include this figure as Fig S5 and hope that it makes the model features salient.
Regarding whether the visuo-proprioceptive matching task is a valid proxy for transformation bias, we refer the reviewer to the comments made by Public Reviewer 1, comment 1. We define the transformation bias as the discrepancy between corresponding positions in visual and proprioceptive space. This can be measured using matching tasks in which participants either aligned their unseen hand to a visual target (Wang et al., 2021) or aligned a visual target to their unseen hand (Wilson et al., 2010).
Nonetheless, when fitting the model to the motor bias data, we did not directly impose the visual-proprioceptive matching data. Instead, we used the shape of the transformation biases as a constraint, while allowing the exact magnitude and direction to be free parameters (e.g., a leftward and downward bias scaled by distance from the right shoulder). Reassuringly, the fitted transformation biases closely matched the magnitudes reported in prior studies (Fig. 2h, 1e), providing strong quantitative support for the hypothesized causal link between transformation and motor biases.
Recommendations for the authors:
Overall, the reviewers agreed this is an interesting study with an original and strong approach. Nonetheless, there were three main weaknesses identified. First, is the focus on bias in reach direction and not reach extent. Second, the models were fit to average data and not individual data. Lastly, and most importantly, the model development and assumptions are not well substantiated. Addressing these points would help improve the eLife assessment.
Reviewer #1 (Recommendations for the authors):
It is mentioned that the main difference between Experiments 1 and 3 is that in Experiment 3, the workspace was smaller and closer to the shoulder. Was the location of the laptop relative to the participant in Experiment 3 known by the authors? If so, variations in this location across participants can be used to test whether the Transformation bias was indeed larger for participants who had the laptop further from the shoulder.
Another difference between Experiments 1 and 3 is that in Experiment 1, the display was oriented horizontally, whereas it was vertical in Experiment 3. To what extent can that have led to the different results in these experiments?
This is an interesting point that we had not considered. Unfortunately, for the online work we do not record the participants’ posture.
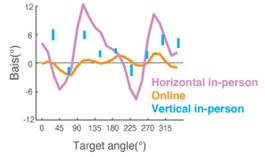
Regarding the influence of display orientation (horizontal vs. vertical), Author response image 4 presents three relevant data points: (1) Vandevoorde and Orban de Xivry (2019), who measured motor biases in-person across nine target positions using a tablet and vertical screen; (2) Our Experiment 1b, conducted online with a vertical setup; (3) Our in-person Experiment 3b, using a horizontal monitor. For consistency, we focus on the baseline conditions with feedback, the only condition reported in Vandevoorde. Motor biases from the two in-person studies were similar despite differing monitor orientations: Both exhibited two-peaked functions with comparable peak locations. We note that the bias attenuation in Vandevoorde may be due to their inclusion of reward-based error signals in addition to cursor feedback. In contrast, compared to the in-person studies, the online study showed reduced bias magnitude with what appears to be a four peaked function. While more data are needed, these results suggest that the difference in the workspace (more restricted in our online study) may be more relevant than monitor orientation.
Author response image 4.
For the joint-based proprioceptive model, the equations used are for an arm moving in a horizontal plane at shoulder height, but the figures suggest the upper arm was more vertical than horizontal. How does that affect the predictions for this model?
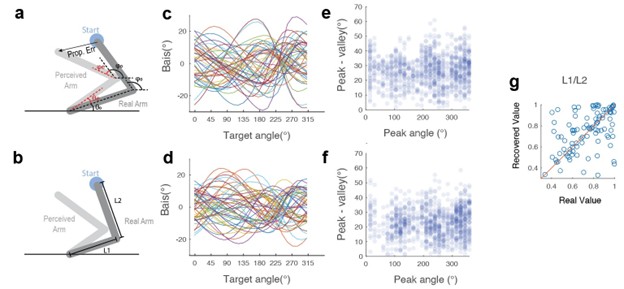
Please also see our response to your public comment 1. When the upper limb (or the lower limb) is not horizontal, it will influence the projection of the upper limb to the 2-D space. Effectively in the joint-based proprioceptive model, this influences the ratio between L1 and L2 (see Author response image 5b below). However, adding a parameter to vary L1/L2 ratio would not change the set of the motor bias function that can be produced by the model. Importantly, it will still generate a one-peak function. We simulated 50 motor bias function across the possible parameter space. As shown by Author response image 5c-d, the peak and the magnitude of the motor bias functions are very similar with and without the L1/L2 term. We characterize the bias function with the peak position and the peak-to-valley distance. Based on those two factors, the distribution of the motor bias function is very similar ( Author response image 5e-f). Moreover, the L1/L2 ratio parameter is not recoverable by model fitting ( Author response image 5c), suggesting that it is redundant with other parameters. As such we only include the basic version of the joint-based proprioceptive model in our model comparisons.
Author response image 5.
It was unclear how the models were fit and how the BIC was computed. It is mentioned that the models were fit to average data across participants, but the BIC values were based on all trials for all participants, which does not seem consistent. And the models are deterministic, so how can a log-likelihood be determined? Since there were inter-individual differences, fitting to average data is not desirable. Take for instance the hypothetical case that some participants have a single peak at 90 deg, and others have a single peak at 270 deg. Averaging their data will then lead to a pattern with two peaks, which would be consistent with an entirely different model.
We thank the reviewer for raising these issues.
Given the reviewers’ comments, we now report fits at both the group and individual level (see response to reviewer 3 public comment 1). The group-level fitting is for illustration purposes. Model comparison is now based on the individual-level analyses which show that the results are best explained by the transformation model when comparing single source models and best explained by the T+V (now TG+TR) model when consider all models. These new results strongly support the transformation model.
Log-likelihoods were computed assuming normally distributed motor noise around the motor biases predicted by each model.
We updated the Methods section as follows (lines 841-853):
“We used the fminsearchbnd function in MATLAB to minimize the sum of loglikelihood (LL) across all trials for each participant. LL were computed assuming normally distributed noise around each participant’s motor biases:
[11] LL = normpdf(x, b, c)
where x is the empirical reaching angle, b is the predicted motor bias by the model, c is motor noise, calculated as the standard deviation of (x − b). For model comparison, we calculated the BIC as follow:
[12] BIC = -2LL+k∗ln(n)
where k is the number of parameters of the models. Smaller BIC values correspond to better fits. We report the sum of ΔBIC by subtracting the BIC value of the TR+TG model from all other models.
For illustrative purposes, we fit each model at the group level, pooling data across all participants to predict the group-averaged bias function.”
What was the delay of the visual feedback in Experiment 1?
The visual delay in our setup was ~30 ms, with the procedure used to estimate this described in detail in Wang et al (2024, Curr. Bio.). We note that in calculating motor biases, we primarily relied on the data from the no-feedback block.
Minor corrections
In several places it is mentioned that movements were performed with proximal and distal effectors, but it's unclear where that refers to because all movements were performed with a hand (distal effector).
By 'proximal and distal effectors,' we were referring to the fact that in the online setup, “reaching movements” are primarily made by finger and/or wrist movements across a trackpad, whereas in the inperson setup, the participants had to use their whole arm to reach about the workspace. To avoid confusion, we now refer to these simply as 'finger' versus 'hand' movements.
In many figures, Bias is misspelled as Bais.
Fixed.
In Figure 3, what is meant by deltaBIC (*1000) etc? Literally, it would mean that the bars show 1,000 times the deltaBIC value, suggesting tiny deltaBIC values, but that's probably not what's meant.
×1000' in the original figure indicates the unit scaling, with ΔBIC values ranging from approximately 1000 to 4000. However, given that we now fit the models at the individual level, we have replaced this figure with a new one (Figure 3e) showing the distribution of individual BIC values.
Reviewer #2 (Recommendations for the authors):
I have concerns that the authors only examine slicing movements through the target and not movements that stop in the target. Biases create two major errors - errors in direction and errors in magnitude and here the authors have only looked at one of these. Previous work has shown that both can be used to understand the planning processes underlying movement. I assume that all models should also make predictions about the magnitude biases which would also help support or rule out specific models.
Please see our response to Reviewer 1 public review 3.
As discussed above, three-dimensional reaching movements also have biases and are not studied in the current manuscript. In such studies, biomechanical factors may play a much larger role.
Please see our response to your public review.
It may be that I am unclear on what exactly is done, as the methods and model fitting barely explain the details, but on my reading on the methods I have several major concerns.
First, it feels that the visual bias model is not as well mapped across space if it only results from one study which is then extrapolated across the workspace. In contrast, the transformation model is actually measured throughout the space to develop the model. I have some concerns about whether this is a fair comparison. There are potentially many other visual bias models that might fit the current experimental results better than the chosen visual bias model.
Please refers to our response to your public review.
It is completely unclear to me why a joint-based proprioceptive model would predict curved planned movements and not straight movements (Figure S1). Changes in the shoulder and elbow joint angles could still be controlled to produce a straight movement. On the other hand, as mentioned above, the actual movement is likely much more complex if the physical starting position is offset from the perceived hand.
Natural movements are often curved, reflecting a drive to minimize energy expenditure or biomechanical constraints (e.g., joint and muscle configuration). This is especially the case when the task emphasizes endpoint precision (Codol et al., 2024) like ours. Trajectory curvature was also observed in a recent simulation study in which a neural network was trained to control a biomechanical model (2-limb, 6muscles) with the cost function specified to minimize trajectory error (reach to a target with as straight a movement as possible). Even under these constraints, the movements showed some curvature. To examined whether the endpoint reaching bias somehow reflects the curvature (or bias during reaching), we included the prediction of this new biomechanical model in the paper to show it does not explain the motor bias we observed.
To be clear, while we implemented several models (Joint-based proprioceptive model and the new biomechanical model) to examine whether motor biases can be explained by movement curvature, our goal in this paper was to identify the source of the endpoint bias. Our modeling results reveal a previously underappreciated source of motor bias—a transformation error that arises between visual and proprioceptive space—plays a dominant role in shaping motor bias patterns across a wide range of experiments, including naturalistic reaching contexts where vision and hand are aligned at the start position. While the movement curvature might be influenced by selectively manipulating factors that introduce a mismatch between the visual starting position and the actual hand position (such as Sober and Sabes, 2003), we think it will be an avenue for future work to investigate this question.
The model fitting section is barely described. It is unclear how the data is fit or almost any other aspects of the process. How do the authors ensure that they have found the minimum? How many times was the process repeated for each model fit? How were starting parameters randomized? The main output of the model fitting is BIC comparisons across all subjects. However, there are many other ways to compare the models which should be considered in parallel. For example, how well do the models fit individual subjects using BIC comparisons? Or how often are specific models chosen for individual participants? While across all subjects one model may fit best, it might be that individual subjects show much more variability in which model fits their data. Many details are missing from the methods section. Further support beyond the mean BIC should be provided.
We fit each model 150 times and for each iteration, the initial value of each parameter was randomly selected from a uniform distribution. The range for each parameter was hand tuned for each model, with an eye on making sure the values covered a reasonable range. Please see our response to your first minor comment below for the range of all parameters and how we decide the iteration number for each model.
Given the reviewers’ comments in the individual difference, we now fit the models at individual level and report a frequency analysis, describing the best fitting model for each participant. In brief, the data for a vast majority of the participants was best explained by the transformation model when comparing single source models and by the T+V (TR+TG) model when consider all models. Please see response to reviewer 3 public comment 1 for the updated result.
We updated the method session, and it reads as follows (lines 841-853):
_“_We used the fminsearchbnd function in MATLAB to minimize the sum of loglikelihood (LL) across all trials for each participant. LL were computed assuming normally distributed noise around each participant’s motor biases:
[11] 𝐿𝐿 = 𝑛𝑜𝑟𝑚𝑝𝑑𝑓(𝑥, 𝑏, 𝑐)
where x is the empirical reaching angle, b is the predicted motor bias by the model, c is motor noise, calculated as the standard deviation of x-b.
For model comparison, we calculated the BIC as follows:
[12] BIC = -2LL+k∗ln(n)
where k is the number of parameters of the models. Smaller BIC values correspond to better fits. We report the sum of ΔBIC by subtracting the BIC value of the TR+TG model from all other models.”
Line 305-307. The authors state that biomechanical issues would not predict qualitative changes in the motor bias function in response to visual manipulation of the start position. However, I question this statement. If the start position is offset visually then any integration of the proprioceptive and visual information to determine the start position would contain a difference from the real hand position. A calculation of the required joint torques from such a position sent through the mechanics of the limb would produce biases. These would occur purely because of the combination of the visual bias and the inherent biomechanical dynamics of the limb.
We thank the reviewer for this comment. We have removed the statement regarding inferences about the biomechanical model based on visual manipulations of the start position. Additionally, we have incorporated a recently proposed biomechanical model into our model comparisons to expand our exploration of sources of bias. Please refer to our response to your public review for details.
Measurements are made while the participants hold a stylus in their hand. How can the authors be certain that the biases are due to the movement and not due to small changes in the hand posture holding the stylus during movements in the workspace. It would be better if the stylus was fixed in the hand without being held.
Below, we have included an image of the device used in Exp 1 for reference. The digital pen was fixed in a vertical orientation. At the start of the experiment, the experimenter ensured that the participant had the proper grip alignment and held the pen at the red-marked region. With these constraints, we see minimal change in posture during the task.
Author response image 6.
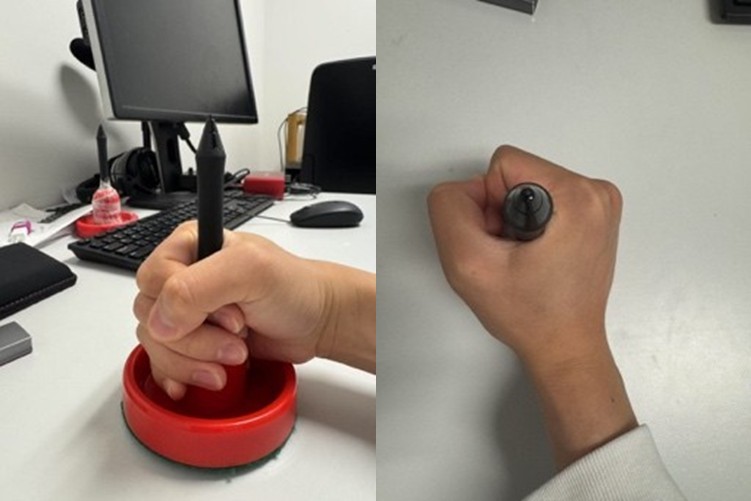
Minor Comments
Best fit model parameters are not presented. Estimates of the accuracy of these measures would also be useful.
In the original submission, we included a Table S1 that presented the best-fit parameters for the TR+TG (Previously T+V) model. Table S1 now shows the parameters for the other models (Exp 1b and 3b, only). We note the parameter values from these non-optimal models are hard to interpret given that core predictions are inconsistent with the data (e.g., number of peaks).
We assume that by "accuracy of these measures," the reviewers are referring to the reliability of the model fits. To assess this, we conducted a parameter recovery analysis in which we simulated a range of model parameters for each model and then attempted to recover them through fitting. Each model was simulated 50 times, with the parameters randomly sampled from distributions used to define the initial fitting parameters. Here, we only present the results for the combined models (TR+TG, PropV+V, and PropJ+V), as the nested models would be even easier to fit.
As shown in Fig. S4, all parameters were recovered with high accuracy, indicating strong reliability in parameter estimation. Additionally, we examined the log-likelihood as a function of fitting iterations (Fig. S4d). Based on this curve, we determined that 150 iterations were sufficient given that the log-likelihood values were asymptotic at this point. Moreover, in most cases, the model fitting can recover the simulated model, with minimal confusion across the three models (Fig. S4e).
What are the (*1000) and (*100) in the Change in BIC y-labels? I assume they indicate that the values should be multiplied by these numbers. If these indicate that the BIC is in the hundreds or thousands it would be better the label the axes clearly, as the interpretation is very different (e.g. a BIC difference of 3 is not significant).
×1000' in the original figure indicates the unit scaling, with ΔBIC values ranging from approximately 1000 to 4000. However, given that we now fit the models at the individual level, we have replaced this figure with a new one showing the distribution of individual BIC values.
Lines 249, 312, and 315, and maybe elsewhere - the degree symbol does not display properly.
Corrected.
Line 326. The authors mention that participants are unaware of their change in hand angle in response to clamped feedback. However, there may be a difference between sensing for perception and sensing for action. If the participants are unaware in terms of reporting but aware in terms of acting would this cause problems with the interpretation?
This is an interesting distinction, one that has been widely discussed in the literature. However, it is not clear how to address this in the present context. We have looked at awareness in different ways in prior work with clamped feedback. In general, even when the hand direction might have deviated by >20d, participants report their perceived hand position after the movement as near the target (Tsay et al, 2020). We also have used post-experiment questionnaires to probe whether they thought their movement direction had changed over the course of the experiment (volitionally or otherwise). Again, participants generally insist they moved straight to the target throughout the experiment. So it seems that they unaware of any change in action or perception.
Reaction time data provide additional support that participants are unaware of any change in behavior. The RT function remains flat after the introduction of the clamp, unlike the increases typically observed when participants engage in explicit strategy use (Tsay et al, 2024).
Figure 1h: The caption suggests this is from the Wang 2021 paper. However, in the text 180-182 it suggests this might be the map from the current results. Can the authors clarify?
Fig 1e is the data from Wang et al, 2021. We formalized an abstract map based on the spatial constrains observed in Fig 1e, and simulated the error at the start and target position based on this abstraction (Fig 1h). We have revised the text to now read (Lines 182-190):
“Motor biases may thus arise from a transformation error between these coordinate systems. Studies in which participants match a visual stimulus to their unseen hand or vice-versa provide one way to estimate this error(Jones et al., 2009; Rincon-Gonzalez et al., 2011; van Beers et al., 1998; Wang et al., 12/2020). Two key features stand out in these data: First, the direction of the visuo-proprioceptive mismatch is similar across the workspace: For right-handers using their dominant limb, the hand is positioned leftward and downward from each target. Second, the magnitude increases with distance from the body (Fig 1d). Using these two empirical constraints, we simulated a visual-proprioceptive error map (Fig. 1h) by applying a leftward and downward error vector whose magnitude scaled with the distance from each location to a reference point.”
Reviewer #3 (Recommendations for the authors):
The central idea behind the research seems quite promising, and I applaud the efforts put forth. However, I'm not fully convinced that the current model formulations are plausible explanations. While the dataset is impressively large, it does not appear to be optimally designed to address the complex questions the authors aim to tackle. Moreover, the datasets used to formulate the 3 different model predictions are SMALL and exhibit substantial variability across individuals, and based on average (and thus "smoothed") data.
We hope to have addressed these concerns with the two major changes to revised manuscript: 1) The new experiment in which we examine biases in both angle and extent and 2) the inclusion in the analyses of fits based on individual data sets.
-
eLife Assessment
This valuable study uses an original approach to address the longstanding question of why reaching movements are often biased. The combination of a wide range of experimental conditions and computational models is a strength. However, the modeling assumptions are not well-substantiated, the modeling analysis is insufficient with its focus on fits to average and not individual subject data, and the results are limited to biases in reach direction and do not consider biases in reach extent. Taken together, the evidence supporting the main claims is incomplete.
-
Reviewer #1 (Public review):
Wang et al. studied an old, still unresolved problem: Why are reaching movements often biased? Using data from a set of new experiments and from earlier studies, they identified how the bias in reach direction varies with movement direction, and how this depends on factors such as the hand used, the presence of visual feedback, the size and location of the workspace, the visibility of the start position and implicit sensorimotor adaptation. They then examined whether a visual bias, a proprioceptive bias, a bias in the transformation from visual to proprioceptive coordinates and/or biomechanical factors could explain the observed patterns of biases. The authors conclude that biases are best explained by a combination of transformation and visual biases.
A strength of this study is that it used a wide range of …
Reviewer #1 (Public review):
Wang et al. studied an old, still unresolved problem: Why are reaching movements often biased? Using data from a set of new experiments and from earlier studies, they identified how the bias in reach direction varies with movement direction, and how this depends on factors such as the hand used, the presence of visual feedback, the size and location of the workspace, the visibility of the start position and implicit sensorimotor adaptation. They then examined whether a visual bias, a proprioceptive bias, a bias in the transformation from visual to proprioceptive coordinates and/or biomechanical factors could explain the observed patterns of biases. The authors conclude that biases are best explained by a combination of transformation and visual biases.
A strength of this study is that it used a wide range of experimental conditions with also a high resolution of movement directions and large numbers of participants, which produced a much more complete picture of the factors determining movement biases than previous studies did. The study used an original, powerful, and elegant method to distinguish between the various possible origins of motor bias, based on the number of peaks in the motor bias plotted as a function of movement direction. The biomechanical explanation of motor biases could not be tested in this way, but this explanation was excluded in a different way using data on implicit sensorimotor adaptation. This was also an elegant method as it allowed the authors to test biomechanical explanations without the need to commit to a certain biomechanical cost function.
The main weakness of the study is that it rests on the assumption that the number of peaks in the bias function is indicative of the origin of the bias. Specifically, it is assumed that a proprioceptive bias leads to a single peak, a transformation bias to two peaks, and a visual bias to four peaks, but these assumptions are not well substantiated. Especially the assumption that a transformation bias leads to two peaks is questionable. It is motivated by the fact that biases found when participants matched the position of their unseen hand with a visual target are consistent with this pattern. However, it is unclear why that task would measure only the effect of transformation biases, and not also the effects of visual and proprioceptive biases in the sensed target and hand locations. Moreover, it is not explained why a transformation bias would lead to this specific bias pattern in the first place. Also, the assumption that a visual bias leads to four peaks is not well substantiated as one of the papers on which the assumption was based (Yousif et al., 2023) found a similar pattern in a purely proprioceptive task. Another weakness is that the study looked at biases in movement direction only, not at biases in movement extent. The models also predict biases in movement extent, so it is a missed opportunity to take these into account to distinguish between the models.
Overall, the authors have done a good job mapping out reaching biases in a wide range of conditions, revealing new patterns in one of the most basic tasks, but unambiguously determining the origin of these biases remains difficult, and the evidence for the proposed origins is incomplete. Nevertheless, the study will likely have a substantial impact on the field, as the approach taken is easily applicable to other experimental conditions. As such, the study can spark future research on the origin of reaching biases.
-
Reviewer #2 (Public review):
Summary:
This work examines an important question in the planning and control of reaching movements - where do biases in our reaching movements arise and what might this tell us about the planning process? They compare several different computational models to explain the results from a range of experiments including those within the literature. Overall, they highlight that motor biases are primarily caused by errors in the transformation between eye and hand reference frames. One strength of the paper is the large number of participants studied across many experiments. However, one weakness is that most of the experiments follow a very similar planar reaching design - with slicing movements through targets rather than stopping within a target. Moreover, there are concerns with the models and the model …
Reviewer #2 (Public review):
Summary:
This work examines an important question in the planning and control of reaching movements - where do biases in our reaching movements arise and what might this tell us about the planning process? They compare several different computational models to explain the results from a range of experiments including those within the literature. Overall, they highlight that motor biases are primarily caused by errors in the transformation between eye and hand reference frames. One strength of the paper is the large number of participants studied across many experiments. However, one weakness is that most of the experiments follow a very similar planar reaching design - with slicing movements through targets rather than stopping within a target. Moreover, there are concerns with the models and the model fitting. This work provides valuable insight into the biases that govern reaching movements, but the current support is incomplete.
Strengths:
The work uses a large number of participants both with studies in the laboratory which can be controlled well and a huge number of participants via online studies. In addition, they use a large number of reaching directions allowing careful comparison across models. Together these allow a clear comparison between models which is much stronger than would usually be performed.
Weaknesses:
Although the topic of the paper is very interesting and potentially important, there are several key issues that currently limit the support for the conclusions. In particular I highlight:
Almost all studies within the paper use the same basic design: slicing movements through a target with the hand moving on a flat planar surface. First, this means that the authors cannot compare the second component of a bias - the error in the direction of a reach which is often much larger than the error in reaching direction. Second, there are several studies that have examined biases in three-dimensional reaching movements showing important differences to two-dimensional reaching movements (e.g. Soechting and Flanders 1989). It is unclear how well the authors' computational models could explain the biases that are present in these much more common-reaching movements.
The model fitting section is under-explained and under-detailed currently. This makes it difficult to accurately assess the current model fitting and its strength to support the conclusions. If my understanding of the methods is correct, then I have several concerns. For example, the manuscript states that the transformation bias model is based on studies mapping out the errors that might arise across the whole workspace in 2D. In contrast, the visual bias model appears to be based on a study that presented targets within a circle (but not tested across the whole workspace). If the visual bias had been measured across the workspace (similar to the transformation bias model), would the model and therefore the conclusions be different? There should be other visual bias models theoretically possible that might fit the experimental data better than this one possible model. Such possibilities also exist for the other models.
Although the authors do mention that the evidence against biomechanical contributions to the bias is fairly weak in the current manuscript, this needs to be further supported. Importantly both proprioceptive models of the bias are purely kinematic and appear to ignore the dynamics completely. One imagines that there is a perceived vector error in Cartesian space whereas the other imagines an error in joint coordinates. These simply result in identical movements which are offset either with a vector or an angle. However, we know that the motor plan is converted into muscle activation patterns which are sent to the muscles, that is, the motor plan is converted into an approximation of joint torques. Joint torques sent to the muscles from a different starting location would not produce an offset in the trajectory as detailed in Figure S1, instead, the movements would curve in complex patterns away from the original plan due to the non-linearity of the musculoskeletal system. In theory, this could also bias some of the other predictions as well. The authors should consider how the biomechanical plant would influence the measured biases.
-
Reviewer #3 (Public review):
The authors make use of a large dataset of reaches from several studies run in their lab to try to identify the source of direction-dependent radial reaching errors. While this has been investigated by numerous labs in the past, this is the first study where the sample is large enough to reliably characterize isometries associated with these radial reaches to identify possible sources of errors.
The sample size is impressive, but the authors should include confidence intervals and ideally, the distribution of responses across individuals along with average performance across targets. It is unclear whether the observed "averaged function" is consistently found across individuals, or if it is mainly driven by a subset of participants exhibiting large deviations for diagonal movements. Providing …
Reviewer #3 (Public review):
The authors make use of a large dataset of reaches from several studies run in their lab to try to identify the source of direction-dependent radial reaching errors. While this has been investigated by numerous labs in the past, this is the first study where the sample is large enough to reliably characterize isometries associated with these radial reaches to identify possible sources of errors.
The sample size is impressive, but the authors should include confidence intervals and ideally, the distribution of responses across individuals along with average performance across targets. It is unclear whether the observed "averaged function" is consistently found across individuals, or if it is mainly driven by a subset of participants exhibiting large deviations for diagonal movements. Providing individual-level data or response distributions would be valuable for assessing the ubiquity of the observed bias patterns and ruling out the possibility that different subgroups are driving the peaks and troughs. It is possible that the Transformation or some other model (see below) could explain the bias function for a substantial portion of participants, while other participants may have different patterns of biases that can be attributable to alternative sources of error.
The different datasets across different experimental settings/target sets consistently show that people show fewer deviations when making cardinal-directed movements compared to movements made along the diagonal when the start position is visible. This reminds me of a phenomenon referred to as the oblique effect: people show greater accuracy for vertical and horizontal stimuli compared to diagonal ones. While the oblique effect has been shown in visual and haptic perceptual tasks (both in the horizontal and vertical planes), there is some evidence that it applies to movement direction. These systematic reach deviations in the current study thus may reflect this epiphenomenon that applies across modalities. That is, estimating the direction of a visual target from a visual start position may be less accurate, and may be more biased toward the horizontal axis, than for targets that are strictly above, below, left, or right of the visual start position. Other movement biases may stem from poorer estimation of diagonal directions and thus reflect more of a perceptual error than a motor one. This would explain why the bias function appears in both the in-lab and on-line studies although the visual targets are very different locations (different planes, different distances) since the oblique effects arise independent of plane, distance, or size of the stimuli.
When the start position is not visible like in the Vindras study, it is possible that this oblique effect is less pronounced; masked by other sources of error that dominate when looking at 2D reach endpoint made from two separate start positions, rather than only directional errors from a single start position. Or perhaps the participants in the Vindras study are too variable and too few (only 10) to detect this rather small direction-dependent bias.
A bias in estimating visual direction or visual movement vector is a more realistic and relevant source of error than the proposed visual bias model. The Visual Bias model is based on data from a study by Huttenlocher et al where participants "point" to indicate the remembered location of a small target presented on a large circle. The resulting patterns of errors could therefore be due to localizing a remembered visual target, or due to relative or allocentric cues from the clear contour of the display within which the target was presented, or even movements used to indicate the target. This may explain the observed 4-peak bias function or zig-zag pattern of "averaged" errors, although this pattern may not even exist at the individual level, especially given the small sample size. The visual bias source argument does not seem well-supported, as the data used to derive this pattern likely reflects a combination of other sources of errors or factors that may not be applicable to the current study, where the target is continuously visible and relatively large. Also, any visual bias should be explained by a coordinates centre on the eye and should vary as a function of the location of visual targets relative to the eyes. Where the visual targets are located relative to the eyes (or at least the head) is not reported.
The Proprioceptive Bias Model is supposed to reflect errors in the perceived start position. However, in the current study, there is only a single, visible start position, which is not the best design for trying to study the contribution. In fact, my paradigms also use a single, visual start position to minimize the contribution of proprioceptive biases, or at least remove one source of systematic biases. The Vindras study aimed to quantify the effect of start position by using two sets of radial targets from two different, unseen start positions on either side of the body midline. When fitting the 2D reach errors at both the group and individual levels (which showed substantial variability across individuals), the start position predicted most of the 2D errors at the individual level - and substantially more than the target direction. While the authors re-plotted the data to only illustrate angular deviations, they only showed averaged data without confidence intervals across participants. Given the huge variability across their 10 individuals and between the two target sets, it would be more appropriate to plot the performance separately for two target sets and show confidential intervals (or individual data). Likewise, even the VT model predictions should differ across the two targets set since the visual-proprioceptive matching errors from the Wang et al study that the model is based on, are larger for targets on the left side of the body.
I am also having trouble fully understanding the V-T model and its associated equations, and whether visual-proprioception matching data is a suitable proxy for estimating the visuomotor transformation. I would be interested to first see the individual distributions of errors and a response to my concerns about the Proprioceptive Bias and Visual Bias models.
-
Author response:
We are pleased that the reviewers found our study thought-provoking and appreciate the care they have taken in providing constructive feedback. Focusing on the main issues raised by the reviewers, we provide here a provisional response to the Public Comments and outline our revision plan.
A) Reviewers 1 and 2 were concerned that our task and analyses were limited by the fact that we only tested the model based on biases in movement direction (angular biases) and did not examine biases in movement extent (radial biases).
While we think the angular biases provide a sufficient test to compare the set of models presented in the paper, we appreciate that there was a missed opportunity to also look at movement extent. Looking at predictions concerning both movement direction and extent would provide a stronger basis for …
Author response:
We are pleased that the reviewers found our study thought-provoking and appreciate the care they have taken in providing constructive feedback. Focusing on the main issues raised by the reviewers, we provide here a provisional response to the Public Comments and outline our revision plan.
A) Reviewers 1 and 2 were concerned that our task and analyses were limited by the fact that we only tested the model based on biases in movement direction (angular biases) and did not examine biases in movement extent (radial biases).
While we think the angular biases provide a sufficient test to compare the set of models presented in the paper, we appreciate that there was a missed opportunity to also look at movement extent. Looking at predictions concerning both movement direction and extent would provide a stronger basis for model comparison. To this end, we will take a two-step approach:
(1) Re-analysis of existing datasets from experiments that involve a pointing task (movements terminate at the target position) rather than a shooting task (movements terminate further than the target distance). We will conduct a model comparison using these data.
(2) If we are unable to obtain a suitable dataset or datasets because we cannot access individual data or there are too few participants, we will conduct a new experiment using a pointing task. We will use these new data to evaluate whether the transformation model can accurately predict biases in both movement direction and extent.
We will incorporate those new results in our revision.
B) Reviewer 3 noted that model fitting was based on group average data. They questioned if this was representative across individuals and how well the model would account for individual patterns of reach biases.
To address this issue, we propose to do the following:
(1) We will first fit the model to individual data in Exp 1 and assess whether a two-peak function, the signature of the transformation model, is characteristic of most the fits. We recognize that the results at the individual level may not support the model. This could occur because the model is not correct. Alternatively, the model could be correct but difficult to evaluate at the individual level for several reasons. First, the data set may be underpowered at the individual level. Second, motor biases can be idiosyncratic (e.g., within subject correlation is greater than between subject correlation), a point we noted in the original submission. Third, as observed in previous studies, transformation biases also show considerable individual variability (Wang et al, 2020); as such, even if the model is correct, a two-peaked function may not hold for all individuals.
(2) If the individual variability is too large to draw meaningful conclusions, we will conduct a new experiment in which we measure motor and proprioceptive biases. Our plan would be to collect a large data set from a limited number of participants. These data should allow us to evaluate the models on an individual basis, including using each participant’s own transformation/proprioceptive bias function to predict their motor biases.
C) The reviewers have comments regarding the assumptions and form of the different models. Reviewer 3 questioned the visual bias model presented in the paper, and Reviewers 2 and 3 suggested additional visual bias/ biomechanical models to consider.
We agree that what we call a visual bias effect is not confined to the visual modality: It is observed when the target is presented visually or proprioceptively, and in manifest in both reaching movements, saccades, and pressing keys to adjust a dot to match with the remembered target (Kosovicheva & Whitney, 2017; Yousif et al. 2023). As such, the bias may reflect a domain-general distortion in the representation of goals within polar space. We refer to this component as a "visual bias" because it is associated with the representation of the visual target in the reaching task.
We do think the version of the visual bias model in the original submission is reasonable given that the bias pattern has been observed in perceptual tasks with stimuli that were very similar to ours (e.g., Kosovicheva & Whitney, 2017). We have explored other perceptual models in evaluating the motor biases observed in Experiment 1. For example, several models discuss how visual biases may depend on the direction of a moving object or the orientation of an object (Wei & Stocker, 2015; Patten, Mannion & Clifford, 2017). However, these models failed to account for the motor biases observed in our experiments, a not surprising outcome since the models were not designed to capture biases in perceived location. There are also models of visual basis associated with viewing angle (e.g., based on retina/head position). Since we allow free viewing, these biases are unlikely to make substantive contributions to the biases observed in our reaching tasks.
Given that some readers are likely to share the reviewers’ concerns on this issue, we will extend our discussion to describe alternative visual models and provide our arguments about why these do not seem relevant/appropriate for our study.
In terms of biomechanical models, we plan to explore at least one alternative model, the MotorNet Model (https://elifesciences.org/articles/88591). This recently published model combines a six-muscle planar arm model with artificial neural networks (ANNs) to generate a control policy. The model has been used to predict movement curvature in various contexts. We will focus on its utility to predict biases in reaching to visual targets.
D) Reviewer 1 had concerns with how we measured the transformation bias. In particular, they asked why the data from Wang et al (2020) are used as an estimate of transformation biases, and not as the joint effects of visual and proprioceptive biases in the sensed target and hand location, respectively.
We define transformation error as the misalignment between the visual target and the hand position. We quantify this transformation bias by referencing studies that used a matching task in which participants match their unseen hand to a visual target, or vice versa. Errors observed in these tasks are commonly attributed to proprioceptive bias, although they could also reflect a contribution from visual bias. We utilized the same data set to simulate both the transformation bias model and the proprioceptive bias model.
Although it may seem that we are simply renaming concepts, the concept of transformation error addresses biases that arise during motor planning. For the proprioceptive bias model, the bias only influences the perceived start position but not the goal since proprioception will influence the perceived position of the target before the movement begins. In contrast, the transformation bias model proposes that movements are planned toward a target whose location is biased due to discrepancies between visual and proprioceptive representations.
The question then arises whether measurements of proprioceptive bias also reflect a transformation bias. We believe that the transformation bias is influenced by proprioceptive feedback, or at the very least, proprioceptive and transformation bias share a common source of error and thus, are highly correlated. We will revise the Introduction and Results sections to more clearly articulate these relationships and assumptions.
E) Reviewer 3 asked whether the oblique effect in visual perception could account for our motor bias.
The potential link between the oblique effect and the observed motor bias is an intriguing idea, one that we had not considered. However, after giving this some thought, we see several arguments against the idea that the oblique effect accounts for the pattern of motor biases.
First, by the oblique effect, variance is greater for diagonal orientations compared to Cartesian orientations. These differences in perceptual variability can explain the bias pattern in visual perception through a Bayesian efficient coding model (Wei & Stocker, 2015). We note that even though participants showed large variability for stimuli at diagonal orientations, the bias for these stimuli was close to zero. As such, we do not think it can explain the motor bias function given the large bias for targets at locations along the diagonal axes.
Second, the reviewer suggested an "oblique effect" within the motor system, proposing that motor variability is greater for diagonal directions due to increased visual bias. If this hypothesis is correct, a visual bias model should account for the motor bias observed, particularly for diagonal targets. In other words, when estimating the visual bias from a reaching task, a similar bias pattern should emerge in tasks that do not involve movement. However, this prediction is not supported in previous studies. For example, in a position judgment task that is similar to our task but without the reaching response, participants exhibited minimal bias along the diagonals (Kosovicheva & Whitney, 2017).
Despite our skepticism, we will keep this idea in mind during the revision, investigating variability in movement across the workspace.
-
-
