Engulfment by brain macrophages in a short-lived vertebrate
Curation statements for this article:-
Curated by eLife

eLife Assessment
This valuable study establishes a novel genetic model for chronic, in vivo visualization of protein engulfment in brain macrophages from the naturally short-lived African turquoise killifish. The solid data presented here show that brain phagocytes exhibit transcriptional features resembling mammalian border associated macrophages and monocyte derived macrophages rather than classical microglia and that their engulfment capacity declines with age, providing a resource for future studies on brain immune cells in teleosts. This research will interest a broad audience across developmental biology, genetics, neuroimmunology, aging research, and evolutionary biology.
[Editors' note: this paper was reviewed by Review Commons.]
This article has been Reviewed by the following groups
Discuss this preprint
Start a discussion What are Sciety discussions?Listed in
- Evaluated articles (eLife)
Abstract
Engulfment by macrophages is critical for waste clearance in the vertebrate brain. Understanding clearance mechanisms may open new therapeutic possibilities to counter brain aging and neurodegenerative diseases. However, few in vivo models exist to study engulfment in the brain and characterize this process during aging and across species. Here we present a genetic model for secretion of a fluorescent protein by neurons in the brain of the African turquoise killifish, the shortest-lived vertebrate that can be bred in captivity. We use this model to identify a population of brain macrophages in the killifish responsible for engulfment of material from the brain extracellular space. Intriguingly, many of these cells bear similarities to mammalian border-associated and monocyte-derived macrophages, rare subsets of macrophages in mouse and human brains noted for their engulfment capabilities. We also find that in our model, killifish brain macrophages decline in engulfment capacity with age. This work highlights how vertebrate brain macrophages, particularly those at brain border regions, can play a critical role in clearance and provides an opportunity to test interventions that can boost engulfment by these macrophages to promote brain resilience in old age and disease.
Article activity feed
-

eLife Assessment
This valuable study establishes a novel genetic model for chronic, in vivo visualization of protein engulfment in brain macrophages from the naturally short-lived African turquoise killifish. The solid data presented here show that brain phagocytes exhibit transcriptional features resembling mammalian border associated macrophages and monocyte derived macrophages rather than classical microglia and that their engulfment capacity declines with age, providing a resource for future studies on brain immune cells in teleosts. This research will interest a broad audience across developmental biology, genetics, neuroimmunology, aging research, and evolutionary biology.
[Editors' note: this paper was reviewed by Review Commons.]
-
Reviewer #1 (Public review):
Summary:
The manuscript by Nagvekar et al. studies engulfing macrophages in the killifish brain upon aging. It first describes the development of a transgenic knock-in killifish line overexpressing a secreted fluorescent protein in neurons. This becomes a tool for isolating myeloid cells that are capable of endocytosis or phagocytosis of the fluorescent protein, which seem to comprise the majority of the myeloid cells within the young adult brain. The paper then demonstrates the similarities of what they call "engulfing macrophages" to brain myeloid cell types of other species and investigates changes to this population upon aging. Overall, the study combines multiple complementary technologies to support their data, that are nicely presented and well described in the legends, while the textual description …
Reviewer #1 (Public review):
Summary:
The manuscript by Nagvekar et al. studies engulfing macrophages in the killifish brain upon aging. It first describes the development of a transgenic knock-in killifish line overexpressing a secreted fluorescent protein in neurons. This becomes a tool for isolating myeloid cells that are capable of endocytosis or phagocytosis of the fluorescent protein, which seem to comprise the majority of the myeloid cells within the young adult brain. The paper then demonstrates the similarities of what they call "engulfing macrophages" to brain myeloid cell types of other species and investigates changes to this population upon aging. Overall, the study combines multiple complementary technologies to support their data, that are nicely presented and well described in the legends, while the textual description remains very concise. The findings are of interest to scientists studying brain aging, and microglia/macrophages.
Major comments:
(1) Although the authors describe and analyze their data from the viewpoint of engulfing macrophages, the paper would benefit from a broader perspective and a comparison to other studies on microglia in different species. Along this line, the title does not really seem to cover the data presented here very well, and the introduction lacks a proper explanation of terminology on microglia/brain macrophages and their known roles, cell types versus cell states and the current state of the art in fish versus other model species in the context of aging.
(2) The result that nearly all myeloid cells in the killifish brain are of the engulfing macrophage type is somewhat surprising. This appears to differ from other studies in for instance zebrafish (e.g. ref 80, that describes the heterogeneity of the myeloid cells in detail). There are two questions we like to raise: (Q1) What is the evidence towards this homogeneity? and (Q2) Could there be a technical bias?
Regarding (Q1): What is the evidence towards this homogeneity? The markers used are overlapping with markers for microglia. It would be helpful to clarify how canonical microglia populations are represented in the dataset. What is the heterogeneity of the oScarletHIGH cells? On several plots (Fig1f, Fig2d, Fig4a) this population of cells seems more heterogeneous than described. Are there different cell states or types? What is the percentage of myeloid cells that is oScarletLOW? To what extent do these cells compare transcriptionally to the oScarletHIGH cells?
a. Fig1f-i depict an enriched oScarletHIGH group alongside oScarletLOW cells. This representation is a bit misleading since it seems to indicate that really all myeloid cells are of the engulfing macrophage type whereas it is the majority, but not all.
b. Line 52: The authors describe that the oScarletHIGH cell group is "enriched for signatures characteristic of macrophage functions". This finding is logical, as the isolation procedure of this population of cells was based on the endocytic and phagocytic properties of the cells. This result appears more consistent with a validation of the isolation strategy than with definitive evidence for myeloid cell identity.Regarding (Q2): Could there be a technical bias? An alternative explanation that may warrant discussion is whether aspects of the experimental pipeline (cell dissociation, FACS, scRNA-seq) could influence myeloid cell states. For instance, it is conceivable that dissociation induces a reactive program that enhances uptake of fluorescent protein, potentially enriching for oScarletHIGH cells. As the authors use a similar experimental setup to prove uptake of dextran and ovalbumin, such a technical artefact may merit consideration. As this would influence the major conclusions of the paper, the authors might want to address this comment with additional experimental controls, such as single-nuclei RNA-seq on control young and aged brains to profile the natural myeloid population when not submitted to a cell dissociation and FACS procedure.
(3) The authors compare the oScarletHIGH cell transcriptomes to mouse and killifish datasets. Both the mouse (Barr et al) and killifish (Nagvekar, this paper) dataset are from enriched immune cells (mouse= CD45+ cells, and the 3 cell types selected from that). Why did the authors not compare to the whole mouse CD45+ dataset? Including zebrafish (Rovira et al, 2025) here would strengthen the evolutionary comparison. I also feel that the additional comparison with young killifish (Ayana et al) might not be that solid since this dataset was initially not enriched and has a significantly lower number of myeloid cells, and thus much less power. The old age time point in that study contained more myeloid cells and might be interesting to include for cell type comparison. There are other, perhaps more unbiased ways of comparing cell types across species, for instance SAMap, developed by co-author Bo Wang. Did the authors consider using this or other methods?
(4) Regarding the comparison with the aged brain:
a. Figure 4: It would be nice to include the same comparisons as for young fish (cfr Fig.1 panels F-I).
The percentage of oScarletHIGH cells in the aged condition is 8% (Fig1-suppl1) compared to 4% at young age. On the other hand, a lower number of cells was isolated at old age compared to young age (Figure4a). Can the authors elaborate on this difference? Later on, it is stated that the engulfing capacity declines with aging, but could this be linked to the lower or potentially biased recovery of cells?b. Figure4a: Transcriptional differences are stated between young and old (line 226), can a relevant selection be shown in e.g. a dot plot or heatmap?
The UMAP clustering does seem to indicate batch effects on panels a and g. Can the authors provide sub clustering and show that young and old/ FACS sorted high and low cover similar cell types/states? The PCA plot (panel f) and marker analysis is not fully convincing, as PC1 and 2 alone do not suffice to explain all the variance in these cells, and the markers are common ones for many microglia/macrophage cell types (and thus likely to be expressed similarly).c. Figure 5: It would be informative to include the corresponding aged condition for panels c and e.
Significance:
General assessment
Strengths: This manuscript introduces a valuable new transgenic tool to isolate and characterize myeloid cells in the brain of the fast-aging killifish (Nothobranchius furzeri), an emerging model organism in aging research. The study combines multiple complementary approaches, including transgenesis, FACS, histology, and single-cell transcriptomics, to investigate brain immune populations and their changes upon aging. The cross-species comparison and aging analyses provide useful datasets and candidate markers for the field of neuroimmunology and comparative brain aging. Overall, the data are clearly presented, the experiments are logically structured, and the manuscript provides a useful resource for future studies on brain immune cells in teleosts.
Limitations/points for improvement: The major limitation of the study concerns a potential technical bias introduced by the experimental pipeline (cell dissociation, FACS isolation, and transcriptomic profiling), which may have influenced the observed predominance and transcriptional state of the oScarletHIGH/engulfing macrophage population. At present, it remains difficult to fully exclude whether the protocol itself contributes to the apparent homogeneity of the myeloid compartment or induces a shared reactive state. Because this issue affects some of the central conclusions, the manuscript would benefit either from additional controls (e.g., dissociation-independent approaches such as single-nuclei RNA-seq) or from a more cautious interpretation and discussion of this possibility in the text.
Advance: The fast-aging killifish is becoming an important vertebrate model for studying aging, yet the brain immune compartment in this species remains relatively underexplored. This manuscript provides both a novel experimental tool and a transcriptomic resource for studying myeloid cells in the killifish brain. To my knowledge, the study is among the first to profile engulfing/endocytic myeloid populations in the context of brain aging in this model organism and to compare these cells across species. The advance is primarily technical and descriptive/resource-generating, while also offering conceptual insight into how brain myeloid populations may change during aging and how they compare evolutionarily across vertebrates. Although the mechanistic interpretation would benefit from additional validation, the study clearly extends current knowledge and provides a framework for future work on neuroimmune aging in fish.
Audience: The manuscript will primarily be of interest to a specialized basic research audience, including researchers in neuroimmunology, brain aging, microglia/macrophage biology, and comparative neuroscience. It will also be relevant to scientists using killifish or other emerging vertebrate models for aging research. Beyond the immediate field, the study may be of broader interest to researchers investigating immune-brain interactions and the evolutionary conservation of myeloid cell states across species. The transgenic line and transcriptomic datasets are likely to serve as a useful resource for future comparative and functional studies.
-
Reviewer #2 (Public review):
Summary:
The work by Nagvekar et. al., reports the development of a new model in the African Killifish to study the engulfment of extracellular proteins. Specifically, they expressed oScarlet with a signaling peptide under the control of a neuronal promoter/gene to induce secretion into the extracellular space. Using this model, they found that the secreted protein was predominantly taken up by brain macrophages. Leveraging this finding, they were able to conduct RNAseq on brain macrophages from young and aged fish, where they reported differences in translation and vacuolar acidification at the transcriptional level among others. Finally, they show that the engulfment capacity of brain macrophages from old killifish is reduced when compared to their young counterparts.
Major comments:
(1) Red fluorescent …
Reviewer #2 (Public review):
Summary:
The work by Nagvekar et. al., reports the development of a new model in the African Killifish to study the engulfment of extracellular proteins. Specifically, they expressed oScarlet with a signaling peptide under the control of a neuronal promoter/gene to induce secretion into the extracellular space. Using this model, they found that the secreted protein was predominantly taken up by brain macrophages. Leveraging this finding, they were able to conduct RNAseq on brain macrophages from young and aged fish, where they reported differences in translation and vacuolar acidification at the transcriptional level among others. Finally, they show that the engulfment capacity of brain macrophages from old killifish is reduced when compared to their young counterparts.
Major comments:
(1) Red fluorescent proteins are notorious for being prone to aggregation. Are oScarlet proteins being internalized by macrophages aggregates or soluble proteins? This distinction is important as the clearance of extracellular molecules could be mediated by most cells, yet aggregates could be removed specifically by macrophages. Can experiments be conducted to distinguish between these two possibilities? We realize this may be challenging. If not feasible, the discussion should be tempered to reflect this possibility.
(2) Brain dissociation tends to generate a lot of debris, especially from sheared neurons. Therefore, the high level of oScarlet inside macrophages could be an artifact of dissociation rather than a reflection of in vivo clearance. Authors should use internalization inhibitors during dissociation (CytoD, Dynasore, and pitstop) to exclude this possibility. Alternatively, if they have a transgenic killifish that expresses another fluorescent reporter in neurons (and preferably at a similar level to that of oScarlet), authors should dissociate brains together and quantify how many oScarlet+ cells are now also positive for that other fluorescent reporter. This could give an idea of how much engulfment is occurring due to the dissociation processes. It is not ideal, as macrophage eating could be happening during dissociation but before cells are in single cell suspension. However, given that RNAseq is needed to identify macrophages, this reviewer would be satisfied by this alternative approach if the aforementioned pitfall is also presented in the discussion.
(3) Related to the above, it appears based on the scRNAseq that dissociation heavily enriched for brain macrophages. Therefore, the claim that clearance is mostly macrophage mediated could be due to an enrichment of this population during dissociation rather than this cell type being responsible for most of the extracellular waste disposal. Authors should quantify the % of total oScarlet that is specifically in macrophages in the brain sections they already have that are stained against oScarlet and CSF1R/ApoEB transcript.
(4) The flow cytometry strategy used does not distinguish between oScarlet protein that has been internalized versus that which is sticking to the surface of macrophages. Authors should stain non-premeabilized and permeabilized cell suspensions with a flow antibody against mCherry/RFP to get a sense of how much oScarlet is inside versus outside of the macrophage. For most antibodies this can be done on the same sample sequentially if the antibodies have a different fluorophore.
(5) It is concerning that dextran and oScarlet are almost perfectly colocalized in the image presented (Figure 3a). It raises the possibility, among others, that dextran is sticking to potential oScarlet aggregates and then being internalized by macrophages. Therefore, it could be an artifact of the transgenic line. Authors should repeat the experiment in wildtype fish and use HCR against CSF1R/ApoEB to address this issue.
Significance:
We believe that this is an important finding as such a model in African Killifish lays the groundwork to study the pathways that mediate the clearance of extracellular molecules by brain macrophages, the impact that this process has on brain homeostasis, and how it changes in aging. In particular, this reviewer is excited about the future potential of this model to uncover the molecular processes behind macropinocytosis, a process that occurs frequently in brain macrophages yet the mechanisms regulating it remain elusive, and how it contributes to overall brain health.
-
Reviewer #3 (Public review):
Summary:
Rahul Nagvekar et al. generated a novel genetic model (SP-oScarlet) to label brain macrophages via their engulfment activity in the naturally short-lived African turquoise killifish. They found that these brain phagocytes exhibit transcriptional features resembling mammalian BAMs/MDMs and provided evidence that their engulfment capacity declines with age. The model and topic are interesting, but some of the central conclusions require more precise calibration to match the strength of the supporting evidence.
Major comments:
The SP-oScarlet model enriches cells based on phagocytic capacity - by design, any phagocytic cell, including microglia, can be labeled. Only 0.5% of oScarletLOW cells were myeloid cells, confirming that this method captures virtually the entire myeloid population. The …
Reviewer #3 (Public review):
Summary:
Rahul Nagvekar et al. generated a novel genetic model (SP-oScarlet) to label brain macrophages via their engulfment activity in the naturally short-lived African turquoise killifish. They found that these brain phagocytes exhibit transcriptional features resembling mammalian BAMs/MDMs and provided evidence that their engulfment capacity declines with age. The model and topic are interesting, but some of the central conclusions require more precise calibration to match the strength of the supporting evidence.
Major comments:
The SP-oScarlet model enriches cells based on phagocytic capacity - by design, any phagocytic cell, including microglia, can be labeled. Only 0.5% of oScarletLOW cells were myeloid cells, confirming that this method captures virtually the entire myeloid population. The transcriptional resemblance to BAMs/MDMs is therefore a post hoc characterization of brain phagocytes broadly, rather than evidence for a selectively labeled subset. The authors show examples of apoeb+ cells near vasculature (Fig. 3b), but do not provide a comprehensive quantification of the full spatial distribution of oScarletHIGH cells. Importantly, neither the SP-oScarlet macrophages nor previously published wild-type killifish brain macrophages could be transcriptionally separated into three subgroups analogous to mammalian microglia, BAMs, and MDMs by PCA. This suggests that fish brain macrophages may not exist as subpopulations that correspond with their mammalian counterparts. The authors should therefore describe these cells as brain myeloid cells that exhibit BAM/MDM-like transcriptional characteristics, rather than implying they are a population equivalent to mammalian BAMs/MDMs.
The age-related decline in oScarlet fluorescence in oScarletHIGH cells in vivo could reflect either reduced phagocytic capacity of macrophages, or reduced oScarlet secretion by neurons, as the authors have discussed (Fig. 5a). The ex vivo assay addresses this by standardizing substrate concentration, which is a strength, but an in vivo functional assessment would provide a more physiologically relevant complement. The authors have already established the methodology for in vivo substrate injection (Fig. 3a, dextran). A similar experiment comparing substrate uptake in young and old fish would circumvent potential artifacts of the ex vivo approach, such as enzymatic dissociation altering surface receptor availability, and would directly test whether engulfment declines in the native brain environment.
Significance:
General assessment: This study presents a novel genetic model (SP-oScarlet) for visualizing chronic engulfment by brain macrophages in a short-lived vertebrate. The finding that killifish brain phagocytes exhibit BAM/MDM-like transcriptional features is interesting. Leveraging the killifish's naturally short lifespan, the authors further provide functional evidence that brain macrophage engulfment capacity declines with age. However, the authors should exercise caution when defining these cells as a distinct population specialized for engulfment of material from the brain extracellular space, since the SP-oScarlet model labels nearly the entire myeloid population in the brain.
Advance: This study establishes a novel genetic model for chronic, in vivo visualization of engulfment in a vertebrate brain. The conceptual insight that killifish brain phagocytes transcriptionally resemble BAMs/MDMs rather than classical microglia is novel and may reflect evolutionary differences in brain clearance strategies.
Audience: This research will interest a broad audience across developmental biology, genetics, neuroimmunology, aging research, and evolutionary biology.
-
Author response:
General Statements
Please find below a revision plan for our manuscript entitled ‘Engulfment by brain macrophages in a short-lived vertebrate’ that was reviewed by Review Commons and that we wish to be considered for publication in eLife.
We were very happy to see that all three Reviewers were interested in our study and we are sincerely grateful to all of them for their constructive suggestions, which we believe can largely be addressed and will improve our manuscript.
We would like to inquire whether you would consider publishing our manuscript at eLife in its current form, along with the reviews. We will then provide an updated version of the manuscript, based on our revision plan below when we are able.
Thank you so much for your consideration.
Description of the planned revisions
Reviewer #1:
Major comments
Author response:
General Statements
Please find below a revision plan for our manuscript entitled ‘Engulfment by brain macrophages in a short-lived vertebrate’ that was reviewed by Review Commons and that we wish to be considered for publication in eLife.
We were very happy to see that all three Reviewers were interested in our study and we are sincerely grateful to all of them for their constructive suggestions, which we believe can largely be addressed and will improve our manuscript.
We would like to inquire whether you would consider publishing our manuscript at eLife in its current form, along with the reviews. We will then provide an updated version of the manuscript, based on our revision plan below when we are able.
Thank you so much for your consideration.
Description of the planned revisions
Reviewer #1:
Major comments
Comment 1: Although the authors describe and analyze their data from the viewpoint of engulfing macrophages, the paper would benefit from a broader perspective and a comparison to other studies on microglia in different species. Along this line, the title does not really seem to cover the data presented here very well, and the introduction lacks a proper explanation of terminology on microglia/brain macrophages and their known roles, cell types versus cell states and the current state of the art in fish versus other model species in the context of aging.
We thank the Reviewer for these suggestions. We will expand the introduction to add more information and references on microglia/brain macrophages across fish and other species. We will also edit the title to more closely reflect the data in the manuscript.
Comment 2: The result that nearly all myeloid cells in the killifish brain are of the engulfing macrophage type is somewhat surprising. This appears to differ from other studies in for instance zebrafish (e.g. ref 80, that describes the heterogeneity of the myeloid cells in detail). There are two questions we like to raise: (Q1) What is the evidence towards this homogeneity? and (Q2) Could there be a technical bias?
We agree with the Reviewer, and we were also surprised to find a fairly homogenous myeloid population even in wildtype (non-transgenic) killifish brains, especially given that all these 3 different populations of myeloid cells (microglia, non-microglial macrophages, and dendritic-like cells), could be found in the adult zebrafish brain by Rovira et al. using single-cell RNA sequencing of cd45+ cells (ref. 80).
We will better describe our evidence towards this homogeneity among killifish brain myeloid cells in the manuscript by adding a paragraph in the text at the end of the section referring to Figure 2. We will also provide additional experiments and analyses (see also below, our detailed responses to Q1 and Q2):
i) In our and Ayana et al.’s single-cell RNA sequencing datasets, we could not find distinct populations of myeloid cells corresponding to microglia, non-microglial macrophages, and dendritic-like cells, even in wildtype (non-transgenic) killifish young adult and old brain, and even when subclustering only the myeloid cells. However, cd45+ cells were not specifically enriched in these experiments.
ii) When using PCA, we also could not separate killifish brain macrophages into microglia, border-associated macrophages, and monocyte-derived macrophages (whereas we could separate mouse brain macrophages into these three groups as a positive control for this approach).
iii) As noted by the Reviewer below, our analysis of the Ayana et al. wildtype dataset was limited to the young adult timepoint from this dataset. In the revised version of our manuscript, we will also include analysis of the old timepoint from this dataset.
iv) As described in our responses to Q1 and Q2 below, we will provide more detailed subclustering that highlights the heterogeneity we do observe among killifish brain myeloid cells. We find this heterogeneity to be subtle and likely corresponding to different cell states rather than functionally distinct cell types. We will also use hybridization chain reaction (HCR) to test whether cd74, a key marker we use to propose a monocyte-derived macrophage-like identity for almost all detected killifish brain macrophages, labels apoeb+ cells in young wildtype brains in situ (as would be predicted based on our single-cell RNA sequencing analysis). We will additionally use HCR to test whether batf3, a key marker used by Rovira et al. to identify dendritic-like cells, labels any cells in the killifish brain (based on our single-cell RNA sequencing analysis, we do not expect to find batf3+ cells in the killifish brain).
We agree that there could be technical confounds that could lead to the observed homogeneity of the myeloid population and lack of canonical microglia and dendritic-like cells even in wildtype killifish in our analysis. These could include our/Ayana et al.’s protocol for brain dissociation, our FACS-sorting step, or the step of loading cells into the 10x Genomics chip for single-cell RNA sequencing – each of these could be a step where canonical microglia and/or dendritic-like cells could be lost. In addition, we did not enrich for cd45+ cells, so it is possible that rare populations of immune cells in the killifish brain may not be represented in our dataset. As described below in our responses to Q1 and Q2, we will perform additional analyses that we hope will help address some of these key points, and we will more extensively discuss all possible technical confounds leading to potential cell type bias in the Discussion section.
In addition to discussing potential technical confounds, we will also better highlight biological possibilities that could explain the differences between our and Rovira et al.’s findings. For example, the observed lack of microglia and dendritic-like cells in killifish brains could reflect a species (killifish vs. zebrafish) difference. Alternatively, even though both studies analyzed young adult timepoints, there could also be differences in biological age between the young adult killifish and zebrafish analyzed, which may be additionally influenced by husbandry conditions (e.g., feeding, pathogen exposure).
Regarding (Q1): What is the evidence towards this homogeneity? The markers used are overlapping with markers for microglia. It would be helpful to clarify how canonical microglia populations are represented in the dataset. What is the heterogeneity of the oScarletHIGH cells? On several plots (Fig1f, Fig2d, Fig4a) this population of cells seems more heterogeneous than described. Are there different cell states or types? What is the percentage of myeloid cells that is oScarletLOW? To what extent do these cells compare transcriptionally to the oScarletHIGH cells?
The Reviewer makes a series of excellent points. To address them:
i) We will more prominently highlight markers not expressed by canonical microglia (e.g., mrc1, cd74) that are expressed by nearly all detectable killifish brain myeloid cells, even in wildtype datasets. We could not find canonical microglia (e.g., tmem119+, sall1+) in any of our killifish datasets. We will highlight these results in the text and will move some of the relevant graphs in the main figure.
ii) We agree that oScarletHIGH cells are somewhat heterogeneous. To better understand the source of this heterogeneity, we will present UMAPs/Seurat FeaturePlots focusing on cell state markers (e.g., cycling [mki67+] and activated [iba1+] cells) as well as specific cell type markers from mammalian/zebrafish literature (canonical microglia, non-microglia macrophages, dendritic-like cells, etc.). We expect this analysis to show distinct cell states, but fairly uniform expression of cell type markers across all oScarletHIGH cells in our datasets.
iii) The percentage of detected myeloid cells that are oScarletLOW is very low (<1%). However, as noted in the next comment from the Reviewer, our sorting protocol de-enriches for oScarletLOW myeloid cells, so the actual percentage of all myeloid cells that is oScarletLOW may be higher. We will include additional panels to illustrate this point.
iv) oScarletLOW myeloid cells are largely transcriptionally similar to oScarletHIGH cells (which are almost all myeloid). The main differentially expressed genes in oScarletLOW vs oScarletHIGH myeloid cells are markers of non-myeloid genes (e.g., elavl3, mpz). These could reflect phagocytosis of non-myeloid cells by oScarletLOW myeloid cells but could also reflect ambient RNA contamination, since oScarletLOW myeloid cells (but not oScarletHIGH cells) were sequenced alongside non-myeloid cells. We will include the differential expression analysis and add commentary in the text to discuss these possibilities.
Fig1f-i depict an enriched oScarletHIGH group alongside oScarletLOW cells. This representation is a bit misleading since it seems to indicate that really all myeloid cells are of the engulfing macrophage type whereas it is the majority, but not all.
We agree with the Reviewer. We will also include different representations that provide more accurate estimates of the proportion of all myeloid cells that are oScarletLOW/not engulfing macrophages.
Line 52: The authors describe that the oScarletHIGH cell group is "enriched for signatures characteristic of macrophage functions". This finding is logical, as the isolation procedure of this population of cells was based on the endocytic and phagocytic properties of the cells. This result appears more consistent with a validation of the isolation strategy than with definitive evidence for myeloid cell identity.
We agree and we will reframe this result as a validation of the isolation strategy.
Regarding (Q2): Could there be a technical bias? An alternative explanation that may warrant discussion is whether aspects of the experimental pipeline (cell dissociation, FACS, scRNA-seq) could influence myeloid cell states. For instance, it is conceivable that dissociation induces a reactive program that enhances uptake of fluorescent protein, potentially enriching for oScarletHIGH cells. As the authors use a similar experimental setup to prove uptake of dextran and ovalbumin, such a technical artefact may merit consideration. As this would influence the major conclusions of the paper, the authors might want to address this comment with additional experimental controls, such as single-nuclei RNA-seq on control young and aged brains to profile the natural myeloid population when not submitted to a cell dissociation and FACS procedure.
We agree with the Reviewer that brain dissociation, FACS, and single-cell RNA sequencing could all represent technical biases that could all influence the representation of different myeloid cell types in our dataset. We will clearly note this potential confound in the Results and the Discussion.
We agree that it would be valuable to test some of these issues experimentally. We will perform non-dissociative HCR (in situ) to test (1) whether in young wildtype brains, apoeb+ cells (macrophages) express cd74 (a key marker for our argument re: MDM-like cell type identity) and (2) whether we can find cells expressing batf3 (a key marker used by Rovira et al. to identify dendritic-like cells, which we cannot detect in the killifish brain in our single-cell RNA sequencing data). We will also acknowledge that these are only individual markers and would not provide as comprehensive a picture of cell type identity as single-nuclei RNA sequencing.
Comment 3: The authors compare the oScarletHIGH cell transcriptomes to mouse and killifish datasets. Both the mouse (Barr et al) and killifish (Nagvekar, this paper) dataset are from enriched immune cells (mouse= CD45+ cells, and the 3 cell types selected from that). Why did the authors not compare to the whole mouse CD45+ dataset? Including zebrafish (Rovira et al, 2025) here would strengthen the evolutionary comparison. I also feel that the additional comparison with young killifish (Ayana et al) might not be that solid since this dataset was initially not enriched and has a significantly lower number of myeloid cells, and thus much less power. The old age time point in that study contained more myeloid cells, and might be interesting to include for cell type comparison. There are other, perhaps more unbiased ways of comparing cell types across species, for instance SAMap, developed by co-author Bo Wang. Did the authors consider using this or other methods?
We thank the Reviewer for these excellent suggestions. We will do the following in our revised manuscript:
i) We will include comparisons to all immune (CD45+) cells from mice (Barr et al.).
ii) We will include comparisons to all immune (cd45+) cells in zebrafish (Rovira et al.).
iii) We will also analyze the old age time point from the Ayana et al. wildtype killifish dataset.
The percentage of oScarletHIGH cells in the aged condition is 8% (Fig1-suppl1) compared to 4% at young age. On the other hand, a lower number of cells was isolated at old age compared to young age (Figure4a). Can the authors elaborate on this difference? Later on, it is stated that the engulfing capacity declines with aging, but could this be linked to the lower or potentially biased recovery of cells?
We appreciate the Reviewer’s point. We will elaborate on the percentage differences in oScarletHIGH cells recovered in the different experiments, and more clearly indicate what they could originate from and whether they could influence the engulfment results:
i) We will indicate more clearly that in each single-cell RNA sequencing experiment, we loaded the entire set of Live oScarletHIGH cells collected from each condition onto the 10x Genomics chip. In the young vs. old comparison, more Live old oScarletHIGH cells were loaded than Live young oScarletHIGH cells (66K vs. 42K, based on the FACS sorter counts, though these numbers are likely overestimates). One possibility is that the lower recovery of successfully sequenced old oScarletHIGH cells might be explained by differences with age in oScarletHIGH cells’ ability to remain intact during loading onto the 10x Genomics chip.
ii) In the ex vivo experiments where we find that engulfment capacity declines with age (current Fig. 5), the proportion of oScarletHIGH cells among all Live cells slightly increased with age. We will include the data illustrating this, and indicate more clearly in the text that the differences in engulfment capacity observed in these experiments are unlikely to be explained solely by lower recovery of oScarletHIGH cells from old brains.
iii) We will more clearly acknowledge in the Discussion the possibility of potentially biased cell recovery with age.
Figure4a: Transcriptional differences are stated between young and old (line 226), can a relevant selection be shown in e.g. a dotplot or heatmap?
This is another great point from the Reviewer. We will show these genes in a dotplot/heatmap in a Supplemental Figure. We will also clearly indicate in the main text that many of the genes most strongly enriched in old oScarletHIGH cells in our young vs. old comparison experiment were not strongly expressed in an independent old oScarletHIGH cells dataset (which was compared to old wildtype cells, without a young counterpart).
The UMAP clustering does seem to indicate batch effects on panels a and g. Can the authors provide subclustering and show that young and old/ FACS sorted high and low cover similar cell types/states? The PCA plot (panel f) and marker analysis is not fully convincing, as PC1 and 2 alone do not suffice to explain all the variance in these cells, and the markers are common ones for many microglia/macrophage cell types (and thus likely to be expressed similarly).
The Reviewer has another excellent suggestion. We will provide subclustering, which indeed shows that young and old oScarletHIGH cells generally represent similar cell types and states. This analysis also shows a subcluster specific to old oScarletHIGH cells, but this subcluster is far less pronounced in a second old oScarletHIGH dataset (see our previous comment), so we will clearly indicate in the main text that this subcluster may not be robust. We will also remove the PCA plot.
Figure 5: It would be informative to include the corresponding aged condition for panels c and e.
We agree and we will include this.
Minor comments
The authors use the oScarlet fish in a heterozygous state. Is the homozygous line not viable? Or what is the reason to use the heterozygous state? Too high expression of OScarlett? Is apoptosis of neurons checked for this line? Compared to wild type?
The homozygous SP-oScarlet line has not been characterized, and we will include this information in the Results. We did not check apoptosis of neurons in the SP-oScarlet line or in wildtype killifish, and we will indicate this in the Methods and Discussion.
Is the secretion of OScarlett completely proven? Maybe the signal is engulfed by the clearance of cell debris from apoptotic neurons?
This is a great point. We have not directly tested the secretion of oScarlet in the SP-oScarlet line, and it remains possible that engulfed oScarlet also comes from apoptotic neurons that are being engulfed by myeloid cells. We will acknowledge this possibility in the Discussion.
We will also more clearly highlight references that adding a signal peptide to proteins (as we did for the SP-oScarlet line) is sufficient to induce their secretion in several contexts in different species (although this does not prove secretion in this particular case).
We also do have another line (built for a separate project) in which oScarlet is expressed cytoplasmically in elavl3+ cells. In this line, in pilot data, we did not observe oScarletHIGH cells by flow cytometry. While these experiments are not of publishable quality, these observations also suggest that the presence of a signal peptide on oScarlet is necessary for the engulfment phenotype.
Line 329. What exact difference between teleosts and mice are you pointing at?
We will edit the text to clarify that we are referring to our inability to find a cell population with a transcriptional profile like that of canonical adult mouse microglia in the adult killifish brain.
Suggestions for Figures
General remark IHC/HCR figures: Please add overview figures to guide the reader to ROI shown.
Fig1.
1.b Please add overview figures to show the overall distribution of the signal in the brain. Are there any hotspots or low-abundant regions?
1.d/1.e Please add numbers of cells on figure panels.
1.d: overview figure is unclear. Telencephalon seems to be missing? Can annotation be added to regions of the structure?
Additional in vivo evidence of the homogeny/heterogeneity of oScarlet protein+/RNA- cells would be informative, e.g. double labeling (HCR) with some of the markers of panel Fig. 2a). This also would exclude location bias. One could expect myeloid cells that are not in close proximity to secreting neurons, for instance in dense neurogenic niches
Fig. 2
2.c Please add number of cells on graph
2.d Please add brain regions to graphs of published datasets like was done for the own dataset.
Subtext: Why is there a different number of cells for Barr in c and d? Please add number of cells of own killifish dataset in legend.
Supplement fig. 2 Please add additional microglia-specific markers such as for instance HEXB, GPR34, SELL1, C1Q.
Fig.3
Please add overview pictures.
Fig.4
4.g grey color not very visible
It would be informative to have the markers of 4.h plot on top of the UMAP to show the distribution/differences, maybe in supplementary information.
We will implement all of these changes. We will add cd74 HCR labeling of oScarletHIGH cells that do not express oScarlet RNA transcripts in situ. The different numbers of cells from the Barr et al. dataset in the current panels 2c and 2d do not reflect differences in brain regions from which macrophages were isolated (in both cases, the same whole-brain dataset was used). Instead, in this dataset, there is a small population of interferon-responsive macrophages that are not microglia, BAMs, or MDMs; these cells were included in the analysis in 2d but not 2c. We will clarify this and update the analysis in current panel 2d to include all immune cells from the Barr et all. dataset, as suggested by the Reviewer above.
Reviewer #2:
Red fluorescent proteins are notorious for being prone to aggregation. Are oScarlet proteins being internalized by macrophages aggregates or soluble proteins? This distinction is important as the clearance of extracellular molecules could be mediated by most cells yet aggregates could be removed specifically by macrophages. Can experiments be conducted to distinguish between these two possibilities? We realize this may be challenging. If not feasible, the discussion should be tempered to reflect this possibility.
The Reviewer makes a great point, and we were also interested in this question. mScarlet and its derivatives (including oScarlet) would generally be expected to remain in the monomeric state to a greater extent than other red fluorescent proteins like mCherry (Bindels et al., Albakri et al.). We will indicate this with references in the Results section.
But this does not preclude the possibility of oScarlet aggregation in SP-oScarlet brains. We did collect soluble and insoluble fractions from SP-oScarlet brains using a gentle lysis method that would be expected to preserve aggregates in the insoluble fraction (Avar et al.). However, we found that the levels of oScarlet in both fractions were below the limit of detection by western blot and by a plate reader-based fluorescence assay, thereby precluding us from directly testing how much oScarlet was aggregated. We will address the possibility of oScarlet aggregation, and its potential impact on engulfing macrophages, in the Results and Discussion sections.
Brain dissociation tends to generate a lot of debris, especially from sheared neurons. Therefore, the high level of oScarlet inside macrophages could be an artifact of dissociation rather than a reflection of in vivo clearance. Authors should use internalization inhibitors during dissociation (CytoD, Dynasore, and pitstop) to exclude this possibility. Alternatively, if they have a transgenic killifish that expresses another fluorescent reporter in neurons (and preferably at a similar level to that of oScarlet), authors should dissociate brains together and quantify how many oScarlet+ cells are now also positive for that other fluorescent reporter. This could give an idea of how much engulfment is occurring due to the dissociation processes. It is not ideal, as macrophage eating could be happening during dissociation but before cells are in single cell suspension. However, given that RNAseq is needed to identify macrophages, this reviewer would be satisfied by this alternative approach if the aforementioned pitfall is also presented in the discussion.
This is another excellent suggestion, and we have already done the following experiments:
i) We have performed bulk RNA sequencing from FACS-sorted oScarletHIGH cells from middle-aged SP-oScarlet brains dissociated with five inhibitors (cytochalasin D, dynasore, Pitstop 2, bafilomycin A, and wortmannin) in addition to transcription/translation inhibitors. Deconvolution analysis of these bulk RNA sequencing data showed that oScarletHIGH cells in the presence of cytochalasin D, dynasore, Pitstop 2, bafilomycin A, and wortmannin are also almost all macrophages. While these data are not at single-cell resolution, they indicate that engulfment by macrophages is unlikely to solely occur during the dissociation process. We will include a revised Supplementary Figure with these experiments.
ii) We have also already performed a pilot co-dissociation experiment (in a different genetic background) as suggested by the Reviewer using a ubb:GFP reporter as the second transgenic and observed very few GFP+ oScarletHIGH cells (see Author response image 1). We will include co-dissociation data in the revised version of the manuscript.
Author response image 1.
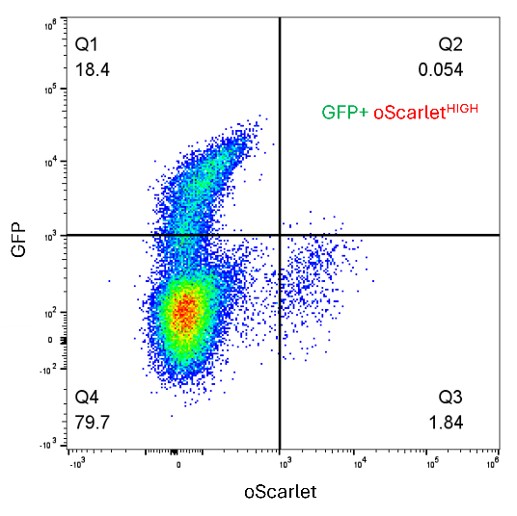
We believe that the results of these experiments are consistent with the notion that oScarletHIGH cells have engulfed oScarlet in vivo, prior to dissociation step. Nevertheless, we will also make note in the Discussion of the pitfall mentioned by the Reviewer.
Related to the above, it appears based on the scRNAseq that dissociation heavily enriched for brain macrophages. Therefore, the claim that clearance is mostly macrophage mediated could be due to an enrichment of this population during dissociation rather than this cell type being responsible for most of the extracellular waste disposal. Authors should quantify the % of total oScarlet that is specifically in macrophages in the brain sections they already have that are stained against oScarlet and CSF1R/ApoEB transcript.
The Reviewer’s point is well taken and we agree that experiments in intact brain sections are important to orthogonally test whether macrophages are responsible for engulfment. As suggested by the Reviewer, we will quantify the percentage of total oScarlet that is in apoeb+ macrophages in the brain sections we already have (current Fig. 3a). We note that it may not accurately reflect the actual in vivo percentage, as we have found that it can be challenging to draw cell boundaries around macrophages due to their irregular shapes.
It is concerning that dextran and oScarlet are almost perfectly colocalized in the image presented (Figure 3a). It raises the possibility, among others, that dextran is sticking to potential oScarlet aggregates and then being internalized by macrophages. Therefore, it could be an artifact of the transgenic line. Authors should repeat the experiment in wildtype fish and use HCR against CSF1R/ApoEB to address this issue.
We agree with the Reviewer. We have already injected dextran into non-transgenic killifish brains and observed dextran engulfment by apoeb+ cells. We will include this experiment in the revised version of the manuscript.
Reviewer #3:
Major comments
The SP-oScarlet model enriches cells based on phagocytic capacity - by design, any phagocytic cell, including microglia, can be labeled. Only 0.5% of oScarletLOW cells were myeloid cells, confirming that this method captures virtually the entire myeloid population. The transcriptional resemblance to BAMs/MDMs is therefore a post hoc characterization of brain phagocytes broadly, rather than evidence for a selectively labeled subset. The authors show examples of apoeb+ cells near vasculature (Fig. 3b), but do not provide a comprehensive quantification of the full spatial distribution of oScarletHIGH cells. Importantly, neither the SP-oScarlet macrophages nor previously published wild-type killifish brain macrophages could be transcriptionally separated into three subgroups analogous to mammalian microglia, BAMs, and MDMs by PCA. This suggests that fish brain macrophages may not exist as subpopulations that correspond with their mammalian counterparts. The authors should therefore describe these cells as brain myeloid cells that exhibit BAM/MDM-like transcriptional characteristics, rather than implying they are a population equivalent to mammalian BAMs/MDMs.
We agree with the Reviewer and will describe killifish brain macrophages as “brain myeloid cells that exhibit BAM/MDM-like transcriptional characteristics.”
As described in our responses to Reviewer 1’s comments, we will also provide/more prominently highlight analysis of killifish brain myeloid cell datasets showing:
i) Markers (e.g., mrc1, cd74) that are shared between mammalian BAM/MDMs and killifish brain myeloid cells.
ii) The heterogeneity we observe among killifish brain myeloid cells, which we believe corresponds to different cell states, but is not likely pronounced enough to correspond to functionally distinct cell types.
iii) The presence of oScarletLOW killifish brain myeloid cells, which are de-enriched by our sorting strategy.
Minor comments
The authors acknowledge that oScarlet is relatively resistant to degradation and could affect the state of cells that engulf it. The independent single-cell experiment comparing old SP-oScarlet and old wild-type macrophages addresses this concern at the transcriptional level. However, it remains possible that chronic accumulation of degradation-resistant protein in lysosomes could itself impair phagocytic capacity. If so, the age-related decline in ex vivo engulfment might be partially attributable to oScarlet burden accumulated over a lifetime, rather than to aging per se. While a direct functional comparison with old wild-type macrophages is experimentally challenging, the authors should at least acknowledge this interpretive caveat in the Discussion.
The Reviewer makes a great point, and we will acknowledge this caveat in the Discussion.
The transcriptional data show only modest changes in engulfment- and lysosome-related pathways with age. The authors should offer one or more specific, testable hypotheses (e.g., which phagocytic receptors or lysosomal components might be affected) to guide future investigation.
We will provide a list of top engulfment-relevant genes that change the most with age, which also show only modest changes. We will better acknowledge that the age-related transcriptional changes in engulfment-relevant genes observed in our single-cell RNA sequencing experiment are modest and are unlikely to directly serve as a resource for testable hypotheses. We will also move our single-cell RNA sequencing data to the Supplementary Figures.
In the text, gene names such as APOEB are capitalized, whereas the convention for fish gene nomenclature is lowercase italics (e.g., apoeb). The authors should ensure gene formatting follows species-appropriate conventions throughout the manuscript.
We thank the Reviewer for this suggestion, and we will change killifish gene names to be lower-case italicized throughout the manuscript.
Description of analyses that authors prefer not to carry out
Reviewer #1:
Regarding (Q2): Could there be a technical bias? An alternative explanation that may warrant discussion is whether aspects of the experimental pipeline (cell dissociation, FACS, scRNA-seq) could influence myeloid cell states. For instance, it is conceivable that dissociation induces a reactive program that enhances uptake of fluorescent protein, potentially enriching for oScarletHIGH cells. As the authors use a similar experimental setup to prove uptake of dextran and ovalbumin, such a technical artefact may merit consideration. As this would influence the major conclusions of the paper, the authors might want to address this comment with additional experimental controls, such as single-nuclei RNA-seq on control young and aged brains to profile the natural myeloid population when not submitted to a cell dissociation and FACS procedure.
We believe that generating our own single-nuclei RNA sequencing dataset would be beyond the scope of this study. However, a preprint by Williams et al. from the Benayoun Lab (https://doi.org/10.64898/2026.04.09.717549) includes single-nuclei RNA sequencing data from wildtype killifish brains and could provide an excellent test of our findings. We will point readers to this preprint in the Discussion.
Comment 3: The authors compare the oScarletHIGH cell transcriptomes to mouse and killifish datasets. Both the mouse (Barr et al) and killifish (Nagvekar, this paper) dataset are from enriched immune cells (mouse= CD45+ cells, and the 3 cell types selected from that). Why did the authors not compare to the whole mouse CD45+ dataset? Including zebrafish (Rovira et al, 2025) here would strengthen the evolutionary comparison. I also feel that the additional comparison with young killifish (Ayana et al) might not be that solid since this dataset was initially not enriched and has a significantly lower number of myeloid cells, and thus much less power. The old age time point in that study contained more myeloid cells, and might be interesting to include for cell type comparison. There are other, perhaps more unbiased ways of comparing cell types across species, for instance SAMap, developed by co-author Bo Wang. Did the authors consider using this or other methods?
We thank the Reviewer for the SAMap suggestion. We did perform SAMap with a mouse reference from the Allen Brain Atlas. Our SAMap analysis identifed distinct microglia-, BAM-, and dendritic-like myeloid populations. However, we were not confident in these SAMap results because the differences between the populations were subtle and we thought they would be unlikely to represent differences between functionally distinct cell types. Of note, the dendritic-like cells we identified by SAMap in the killifish brain did not express canonical markers of dendritic/dendritic-like cells from mammalian and zebrafish literature (e.g., batf3). Additionally, other SAMap studies from the Wang Lab analyzing non-neural cell types in other vertebrates do not separate microglia from non-microglial macrophages (Kalakuntla et al., in preparation).
Comment 4: Regarding the comparison with the aged brain:
Figure 4: It would be nice to include the same comparisons as for young fish (cfr Fig.1 panels F-I).
We agree with the Reviewer. Unfortunately, we did not sequence oScarletLOW cells from old brains, for cost reasons, and this precludes the comparison requested by the Reviewer. We will more clearly indicate that we do not have the oScarletLOW cells from old brain in the Results section.
Reviewer #2:
The flow cytometry strategy used does not distinguish between oScarlet protein that has been internalized versus that which is sticking to the surface of macrophages. Authors should stain non-premeabilized and permeabilized cell suspensions with a flow antibody against mCherry/RFP to get a sense of how much oScarlet is inside versus outside of the macrophage. For most antibodies this can be done on the same sample sequentially if the antibodies have a different fluorophore.
The Reviewer makes an important point, and we will address this caveat in the Methods. We have performed a pilot of the flow cytometry experiment suggested by the Reviewer and, encouragingly, observed a higher proportion of cells labeled by the antibody (the same anti-mCherry antibody we used to label oScarlet in situ) in the permeabilized condition. However, we do not wish to publish these results as even in the permeabilized condition, the antibody labeled <0.2% of cells – meaning it likely did not label most oScarletHIGH cells, making it difficult to draw strong conclusions about internalized vs. surface oScarlet in these cells.
Reviewer #3:
The age-related decline in oScarlet fluorescence in oScarletHIGH cells in vivo could reflect either reduced phagocytic capacity of macrophages, or reduced oScarlet secretion by neurons, as the authors have discussed (Fig. 5a). The ex vivo assay addresses this by standardizing substrate concentration, which is a strength, but an in vivo functional assessment would provide a more physiologically relevant complement. The authors have already established the methodology for in vivo substrate injection (Fig. 3a, dextran). A similar experiment comparing substrate uptake in young and old fish would circumvent potential artifacts of the ex vivo approach, such as enzymatic dissociation altering surface receptor availability, and would directly test whether engulfment declines in the native brain environment.
We agree with the Reviewer and performed a pilot of the suggested experiment, which did not show age-related differences in in vivo engulfment of injected dextran. However, in developing the brain injection procedure, we concluded that this procedure works well for comparisons within a sample, but not for comparisons across samples and conditions (e.g., young vs. old). This is because the injection site is determined by sight (aiming for the most medial point on the telencephalon/optic tectum border, with no standardized way to control injection depth), and not stereotactically with coordinates. With our current procedure, it is challenging to perform reproducible injections across ages due to known age-related differences in fish/brain size and skull thickness.
We are interested in developing stereotactic injection approaches that would be compatible with comparisons across ages and other conditions, but we believe that this is beyond the scope of this manuscript. We will discuss this possibility as a future direction in the manuscript.
-
