Functional architecture of pancreatic islets identifies a population of first responder cells that drive the first-phase calcium response
Curation statements for this article:-
Curated by eLife

Evaluation Summary:
This paper provides interesting insights in the control of insulin secretion. The authors identify a subset of 'first responder' beta-cells (the cells that secrete insulin) that - possibly -influence the activity of other beta-cells. They characterise some of the properties of these cells and demonstrate the existence of a fascinating possible hierarchy within the islet. With the data consolidated by more rigorous statistical analyses, this paper will make a useful addition to the field.
(This preprint has been reviewed by eLife. We include the public reviews from the reviewers here; the authors also receive private feedback with suggested changes to the manuscript. Reviewer #3 agreed to share their name with the authors.)
This article has been Reviewed by the following groups
Discuss this preprint
Start a discussion What are Sciety discussions?Listed in
- Evaluated articles (eLife)
Abstract
Insulin-secreting β-cells are functionally heterogeneous. Whether there exist cells driving the first-phase calcium response in individual islets, has not been examined. We examine “first responder” cells, defined by the earliest [Ca 2+ ] response during first-phase [Ca 2+ ] elevation, distinct from previously identified “hub” and “leader” cells. We used islets isolated from Mip-Cre ER ; Rosa-Stop-Lox-Stop-GCamP6s mice (β-GCamP6s) that show β-cell-specific GCamP6s expression following tamoxifen-induced CreER-mediated recombination. First responder cells showed characteristics of high membrane excitability and lower electrical coupling to their neighbors. The first-phase response time of β-cells in the islet was spatially organized, dependent on the cell’s distance to the first responder cell, and consistent over time up to approximately 24 h. When first responder cells were laser ablated, the first-phase [Ca 2+ ] was slowed down, diminished, and discoordinated compared to random cell ablation. Cells that were next earliest to respond often took over the role of the first responder upon ablation. In summary, we discover and characterize a distinct first responder β-cell state, critical for the islet first-phase response to glucose.
Article activity feed
-
-

Author Response:
Reviewer #1:
Insulin-secreting beta-cells are electrically excitable, and action potential firing in these cells leads to an increase in the cytoplasmic calcium concentration that in turn stimulates insulin release. Beta-cells are electrically coupled to their neighbours and electrical activity and calcium waves are synchronised across the pancreatic islets. How these oscillations are initiated are not known. In this study, the authors identify a subset of 'first responders' beta-cells that are the first to respond to glucose and that initiate a propagating Ca2+ wave across the islet. These cells may be particularly responsive because of their intrinsic electrophysiological properties. Somewhat unexpectedly, the electrical coupling of first responder cells appears weaker than that in the other islet cells but this …
Author Response:
Reviewer #1:
Insulin-secreting beta-cells are electrically excitable, and action potential firing in these cells leads to an increase in the cytoplasmic calcium concentration that in turn stimulates insulin release. Beta-cells are electrically coupled to their neighbours and electrical activity and calcium waves are synchronised across the pancreatic islets. How these oscillations are initiated are not known. In this study, the authors identify a subset of 'first responders' beta-cells that are the first to respond to glucose and that initiate a propagating Ca2+ wave across the islet. These cells may be particularly responsive because of their intrinsic electrophysiological properties. Somewhat unexpectedly, the electrical coupling of first responder cells appears weaker than that in the other islet cells but this paradox is well explained by the authors. Finally, the authors provide evidence of a hierarchy of beta-cells within the islets and that if the first responder cells are destroyed, other islet cells are ready to take over.
The strengths of the paper are the advanced calcium imaging, the photoablation experiments and the longitudinal measurements (up to 48h).
Whilst I find the evidence for the existence of first responders and hierarchy convincing, the link between the first responders in isolated individual islets and first phase insulin secretion seen in vivo (which becomes impaired in type-2 diabetes) seems somewhat overstated. It is is difficult to see how first responders in an islet can synchronise secretion from 1000s (rodents) to millions of islets (man) and it might be wise to down-tone this particular aspect.
We thank the reviewer for highlighting this point. We acknowledge that we did not measure insulin from individual islets post first responder cell ablation, where we observed diminished first phase Ca2+. We do note that studies have linked the first phase Ca2+ response to first phase insulin release [Henquin et al, Diabetes (2006) and Head et al, Diabetes (2012)], albeit with additional amplification signals for higher glucose elevations. Thus a diminished first phase Ca2+ would imply a diminished first phase insulin (although given the amplifying signals the converse would not necessarily be the case).
Nevertheless there are also important caveats to our experiment. Within islets we ablated a single first responder cell. In small islets this ablation diminished Ca2+ in the plane that we imaged. In larger islets this ablation did not, pointing to the presence of multiple first responder cells. Furthermore we only observed the plane of the islet containing the ablated first responder. It is possible elsewhere in the islet that [Ca2+] was not significantly disrupted. Thus even within a small islet it is possible for redundancy, where multiple first responder cells are present and that together drive first phase [Ca2+] across the islet. Loss of a single first responder cell only disrupts Ca2+ locally. That we see a relationship between the timing of the [Ca2+] response and distance from the first responder would support this notion. Results from the islet model also support this notion, where >10% of cells were required to be ablate to significantly disrupt first-phase Ca2+.
While we already discuss the issue of redundancy in large islets and in 3D, we now briefly mention the importance of measuring insulin release.
Reviewer #2:
Kravets et al. further explored the functional heterogeneity in insulin-secreting beta cells in isolated mouse islets. They used slow cytosolic calcium [Ca2+] oscillations with a cycle period of 2 to several minutes in both phases of glucose-dependent beta cell activity that got triggered by a switch from unphysiologically low (2 mM) to unphysiologically high (11 mM) glucose concentration. Based on the presented evidence, they described a distinct population of beta cells responsible for driving the first phase [Ca2+] elevation and characterised it to be different from some other previously described functional subpopulations.
Strengths:
The study uses advanced experimental approaches to address a specific role a subpopulation of beta cells plays during the first phase of an islet response to 11 mM glucose or strong secretagogues like glibenclamide. It finds elements of a broadscale complex network on the events of the slow time scale [Ca2+] oscillations. For this, they appropriately discuss the presence of most connected cells (network hubs) also in slower [Ca2+] oscillations.
Weakness:
The critical weakness of the paper is the evaluation of linear regressions that should support the impact of relative proximity (Fig. 1E), of the response consistency (Fig. 2C), and of increased excitability of the first responder cells (Fig. 3B). None of the datasets provided in the submission satisfies the criterion of normality of the distribution of regression residuals. In addition, the interpretation that the majority of first responder cells retain their early response time could as well be interpreted that the majority does not.
We thank the reviewers for their input, as it really opened multiple opportunities for us to improve our analysis and strengthen our arguments of the existence and consistency of the first responder cells. We present more detailed analysis for these respective figures below and describe how these are included in the manuscript.
As it is described below, we performed additional in-depth analysis and statistical evaluation of the data presented in figures 1E, 2C, and 3B. We now report that two of the datasets (Fig.1 E, Fig.2 C) satisfy the criterion of normality of the distribution of regression residuals. The third dataset (Fig.3 B) does not satisfy this criterion, and we update our interpretation of this data in the text.
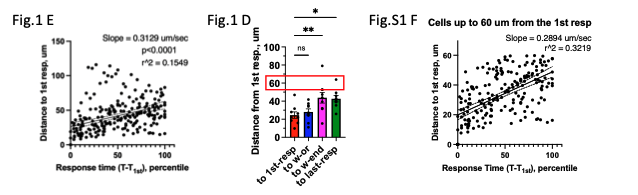
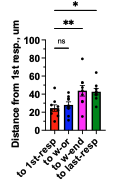
Figure 1E Statistics, Scatter: We now show the slope and p-value indicating deviation of the slope from 0, and r^2 values in Fig.1 E. While the scatter is large (r^2=0.1549 in Fig.1E) for cells located at all distances from the first responder cell, we found that scatter substantially diminishes when we consider cells located closer to the first responder (r^2=0.3219 in Fig.S1 F): the response time for cells at distances up to 60 μm from the first responder cells now is shown in Fig.S1 F. The choice of 60 μm comes from it being the maximum first-to-last responder distance in our data set (see red box in Fig.1D).
Additionally, we noticed that within larger islets there may be multiple domains with their own first responder in the center (now in Fig.S1 E) and below. Linear distance/time dependence is preserved withing each domain.
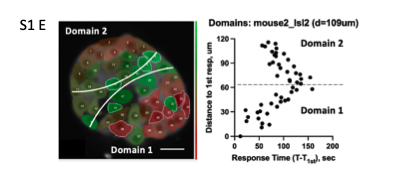
Figure 1E Normality of residuals: We appreciate reviewer’s suggestion and now see that the original “distance vs time” dependence in Fig.1 E did not meet normality of residuals test. When plotted as distance (μm)/response time (percentile), the cumulative distribution still did not meet the Shapiro-Wilk test for normality of residuals (see QQ plot “All distances” below). However, for cells located in the 60 μm proximity of the first responder, the residuals pass the Shapiro- Wilk normality test. The QQ-plots for “up to 60 μm distances” are included in Fig.S1 G.
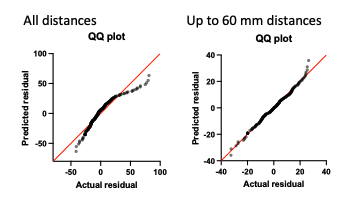
Figure 2C Statistic and Scatter: After consulting a biostatistician (Dr. Laura Pyle), we realized that since the Response time during initial vs repeated glucose elevation was measured in the same islet, these were repeated measurements on the same statistical units (i.e. a longitudinal study). Therefore, it required a mixed model analysis, as opposed to simple linear regression which we used initially. We now have applied linear mixed effects model (LMEM) to LN- transformed (original data + 0.0001). The 0.0001 value was added to avoid issues of LN(0).
We now show LMEM-derived slope and p-value indicating deviation of the slope from 0 in Fig.2 C. Further, we performed sorting of the data presented in Fig.2 C by distance to each of the first responders (now added to Fig.2D). An example of the sorted vs non-sorted time of response in the large islet with multiple first responders is added to the Source Data – Figure 1. We found a substantial improvement of the scatter in the distance- sorted data, compared to the non-sorted, which indicates that consistency of the glucose response of a cell correlates with it’s proximity to the first responder. We also discuss this in the first sub-section of the Discussion.
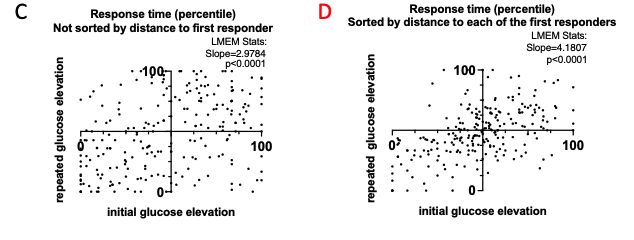
Figure 2C Normality of residuals: The residuals pass Shapiro-Wilk normality test for LMEM of the LN-transformed data. We added very small number (0.0001) to all 0 values in our data set, presented in Fig.2C, D, and Fig.S4 A, to perform natural-log transformation. Details on the LMEM and it’s output are added to the Source data – Statistical analysis file.
Figure 3B Statistic and Scatter: We now show LMEM-derived slope and p-value, indicating deviation of the slope from 0, values in Fig.3 B (below). The LMEM-derived slope has p-value of 0.1925, indicating that the slope is not significantly different from 0. This result changes our original interpretation, and we now edit the associated results and discussion.
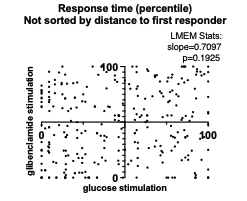
Figure 3B Normality of residuals: This data set does not pass Shapiro-Wilk test.
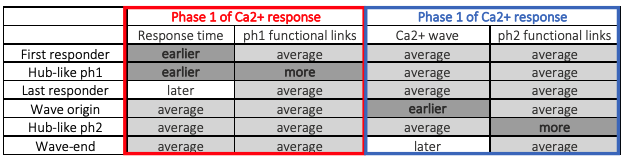
A major issue of the work is also that it is unnecessarily complicated. In the Results section, the authors introduce a number of beta cell subpopulations: first responder cell, last responder cell, wave origin cell, wave end cell, hub-like phase 1, hub-like phase 2, and random cells, which are all defined in exclusively relative terms, regarding the time within which the cells responded, phase lags of their oscillations, or mutual distances within the islet. These cell types also partially overlap.
To address this comment, we added Table 1 to describe the properties of these different populations.
Their choice to use the diameter percentile as a metrics for distances between the cells is not well substantiated since they do not demonstrate in what way would the islet size variability influence the conclusion. All presented islets are of rather a comparable size within the diffusion limits.
We replaced normalized distances in Fig.1 D with absolute distance from first responder in μm.
The functional hierarchy of cells defining the first response should be reflected in the consistency of their relative response time. The authors claim that the spatial organisation is consistent over a time of up to 24 hours. In the first place, it is not clear why would this prolonged consistency be of an advantage in comparison to the absence of such consistency. The linear regression analysis between the initial and repeated relative activation times does suggest a significant correlation, but the distribution of regression residuals of the provided data is again not normal and non-conclusive, despite the low p-value. 50% of the cells defined a first responder in the initial stimulation were part of that subpopulation also during the second stimulation, which is rather random.
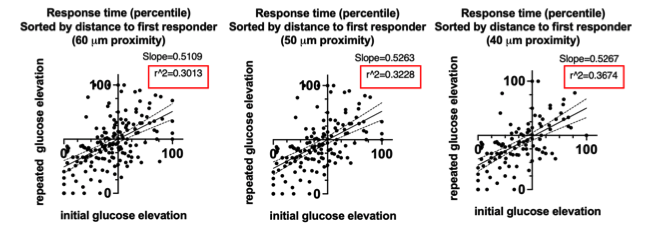
We began to describe our analysis of the response time to initial and repeated glucose stimulation earlier in this reply. Further evidence of the distance-dependence of the consistency of the response time is now presented in Fig.S4 A: a response time consistency for cells at 60 μm, 50μm, and 40 μm proximity to the first responder. The closer a cell is located to the first responder, the higher is the consistency of its response time (the lower the scatter), below.
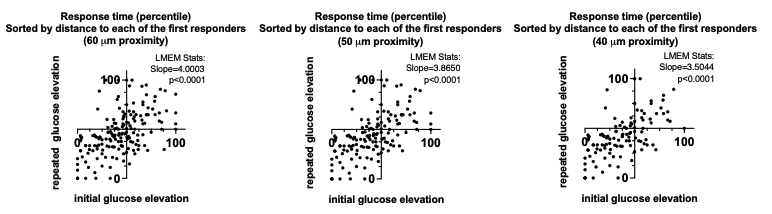
If we analyze this data with a linear regression model, where the r^2 allows us to quantitatively demonstrate decrease of the scatter, we observe r^2 of 0.3013, 0.3228, 0.3674 respectively for cells at 60 μm, 50μm, and 40 μm proximity to the first responder (below). This data is not included in the manuscript because residuals do not pass Shapiro-Wilk Normality test for this model (while they do for the LMEM).
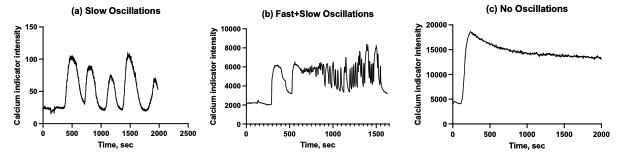
One of the most surprising features of this study is the total lack of fast [Ca2+] oscillations, which are in mouse islets, stimulated with 11 mM glucose typically several seconds long and should be easily detected with the measurement speed used.
Our data used in this manuscript contains Ca2+ dynamics from islets with a) slow oscillations only, b) fast oscillations superimposed on the slow oscillations, c) no obvious oscillations (likely continual spiking). Representative curves are below. Because we focused our study on the slow oscillations, we used dynamics of type (a) in our figures, which formed an impression that no fast oscillations were present. In our analysis of dynamics of type (b) we used Fourier transformation to separate slow oscillations from the fast (described in Methods). Dynamics of type (c) were excluded from the analysis of the oscillatory phase, and instead only used for the first-phase analysis. We indicate this exclusion in the methods.
And lastly, we should also not perpetuate imprecise information about the disease if we know better. The first sentence of the Introduction section, stating that "Diabetes is a disease characterised by high blood glucose, …" is not precise. Diabetes only describes polyuria. Regarding the role of high glucose, a quote from a textbook by K. Frayn, R Evans: Human metabolism - a regulatory perspective, 4rd. 2019 „The changes in glucose metabolism are usually regarded as the "hallmark" of diabetes mellitus, and treatment is always monitored by the level of glucose in the blood. However, it has been said that if it were as easy to measure fatty acids in the blood as it is to measure glucose, we would think of diabetes mellitus mainly as a disorder of fat metabolism."
We acknowledge that Diabetes alone refers to polyurea, and instead state Diabetes Mellitus to be more precise to the disease we refer to. We stated “Diabetes is a disease characterized by high blood glucose, ... “ as this is in line with internationally accepted diagnoses and classification criteria, such as position statements from the American Diabetes Association [‘Diagnosis and Classification of Diabetes Mellitus” AMERICAN DIABETES ASSOCIATION, DIABETES CARE, 36, (2013)]. We certainly acknowledge the glucose-centric approach to characterizing and diagnosing Diabetes Mellitus is largely born of the ease of which glucose can be measured. Thus if blood lipids could be easily measured we may be characterizing diabetes as a disease of hyperlipidemia (depending how lipidemia links with complications of diabetes).
-
Evaluation Summary:
This paper provides interesting insights in the control of insulin secretion. The authors identify a subset of 'first responder' beta-cells (the cells that secrete insulin) that - possibly -influence the activity of other beta-cells. They characterise some of the properties of these cells and demonstrate the existence of a fascinating possible hierarchy within the islet. With the data consolidated by more rigorous statistical analyses, this paper will make a useful addition to the field.
(This preprint has been reviewed by eLife. We include the public reviews from the reviewers here; the authors also receive private feedback with suggested changes to the manuscript. Reviewer #3 agreed to share their name with the authors.)
-
Reviewer #1 (Public Review):
Insulin-secreting beta-cells are electrically excitable, and action potential firing in these cells leads to an increase in the cytoplasmic calcium concentration that in turn stimulates insulin release. Beta-cells are electrically coupled to their neighbours and electrical activity and calcium waves are synchronised across the pancreatic islets. How these oscillations are initiated are not known. In this study, the authors identify a subset of 'first responders' beta-cells that are the first to respond to glucose and that initiate a propagating Ca2+ wave across the islet. These cells may be particularly responsive because of their intrinsic electrophysiological properties. Somewhat unexpectedly, the electrical coupling of first responder cells appears weaker than that in the other islet cells but this …
Reviewer #1 (Public Review):
Insulin-secreting beta-cells are electrically excitable, and action potential firing in these cells leads to an increase in the cytoplasmic calcium concentration that in turn stimulates insulin release. Beta-cells are electrically coupled to their neighbours and electrical activity and calcium waves are synchronised across the pancreatic islets. How these oscillations are initiated are not known. In this study, the authors identify a subset of 'first responders' beta-cells that are the first to respond to glucose and that initiate a propagating Ca2+ wave across the islet. These cells may be particularly responsive because of their intrinsic electrophysiological properties. Somewhat unexpectedly, the electrical coupling of first responder cells appears weaker than that in the other islet cells but this paradox is well explained by the authors. Finally, the authors provide evidence of a hierarchy of beta-cells within the islets and that if the first responder cells are destroyed, other islet cells are ready to take over.
The strengths of the paper are the advanced calcium imaging, the photoablation experiments and the longitudinal measurements (up to 48h).
Whilst I find the evidence for the existence of first responders and hierarchy convincing, the link between the first responders in isolated individual islets and first phase insulin secretion seen in vivo (which becomes impaired in type-2 diabetes) seems somewhat overstated. It is is difficult to see how first responders in an islet can synchronise secretion from 1000s (rodents) to millions of islets (man) and it might be wise to down-tone this particular aspect.
-
Reviewer #2 (Public Review):
Kravets et al. further explored the functional heterogeneity in insulin-secreting beta cells in isolated mouse islets. They used slow cytosolic calcium [Ca2+] oscillations with a cycle period of 2 to several minutes in both phases of glucose-dependent beta cell activity that got triggered by a switch from unphysiologically low (2 mM) to unphysiologically high (11 mM) glucose concentration. Based on the presented evidence, they described a distinct population of beta cells responsible for driving the first phase [Ca2+] elevation and characterised it to be different from some other previously described functional subpopulations.
Strengths:
The study uses advanced experimental approaches to address a specific role a subpopulation of beta cells plays during the first phase of an islet response to 11 mM glucose …
Reviewer #2 (Public Review):
Kravets et al. further explored the functional heterogeneity in insulin-secreting beta cells in isolated mouse islets. They used slow cytosolic calcium [Ca2+] oscillations with a cycle period of 2 to several minutes in both phases of glucose-dependent beta cell activity that got triggered by a switch from unphysiologically low (2 mM) to unphysiologically high (11 mM) glucose concentration. Based on the presented evidence, they described a distinct population of beta cells responsible for driving the first phase [Ca2+] elevation and characterised it to be different from some other previously described functional subpopulations.
Strengths:
The study uses advanced experimental approaches to address a specific role a subpopulation of beta cells plays during the first phase of an islet response to 11 mM glucose or strong secretagogues like glibenclamide. It finds elements of a broadscale complex network on the events of the slow time scale [Ca2+] oscillations. For this, they appropriately discuss the presence of most connected cells (network hubs) also in slower [Ca2+] oscillations.
Weakness:
The critical weakness of the paper is the evaluation of linear regressions that should support the impact of relative proximity (Fig. 1E), of the response consistency (Fig. 2C), and of increased excitability of the first responder cells (Fig. 3B). None of the datasets provided in the submission satisfies the criterion of normality of the distribution of regression residuals. In addition, the interpretation that the majority of first responder cells retain their early response time could as well be interpreted that the majority does not.
A major issue of the work is also that it is unnecessarily complicated. In the Results section, the authors introduce a number of beta cell subpopulations:
first responder cell,
last responder cell,
wave origin cell,
wave end cell,
hub-like phase 1,
hub-like phase 2,
and random cells,
which are all defined in exclusively relative terms, regarding the time within which the cells responded, phase lags of their oscillations, or mutual distances within the islet. These cell types also partially overlap. Their choice to use the diameter percentile as a metrics for distances between the cells is not well substantiated since they do not demonstrate in what way would the islet size variability influence the conclusion. All presented islets are of rather a comparable size within the diffusion limits.The functional hierarchy of cells defining the first response should be reflected in the consistency of their relative response time. The authors claim that the spatial organisation is consistent over a time of up to 24 hours. In the first place, it is not clear why would this prolonged consistency be of an advantage in comparison to the absence of such consistency. The linear regression analysis between the initial and repeated relative activation times does suggest a significant correlation, but the distribution of regression residuals of the provided data is again not normal and non-conclusive, despite the low p-value. 50% of the cells defined a first responder in the initial stimulation were part of that subpopulation also during the second stimulation, which is rather random.
One of the most surprising features of this study is the total lack of fast [Ca2+] oscillations, which are in mouse islets, stimulated with 11 mM glucose typically several seconds long and should be easily detected with the measurement speed used.
And lastly, we should also not perpetuate imprecise information about the disease if we know better. The first sentence of the Introduction section, stating that "Diabetes is a disease characterised by high blood glucose, ..." is not precise. Diabetes only describes polyuria. Regarding the role of high glucose, a quote from a textbook by K. Frayn, R Evans: Human metabolism - a regulatory perspective, 4rd. 2019 „The changes in glucose metabolism are usually regarded as the "hallmark" of diabetes mellitus, and treatment is always monitored by the level of glucose in the blood. However, it has been said that if it were as easy to measure fatty acids in the blood as it is to measure glucose, we would think of diabetes mellitus mainly as a disorder of fat metabolism. "
-
Reviewer #3 (Public Review):
Pancreatic beta cells in each islet of Langerhans act cooperatively to produce a coordinated response to blood glucose, which takes the form of roughly synchronous electrical oscillations that result in coherent pulses of insulin secretion. However, it has become more appreciated recently that the cells are heterogeneous and that there may subgroups of cells within the islet that contribute in different ways or control different aspects of the collective behavior.
This paper addresses a subset of cells, termed first responders, that are the earliest to transition into activity when glucose is stepped up from a sub-stimulatory level. It is shown that the first responders determine the first transient phase of electrical activity, and implicitly secretion, that precedes the start of steady-state oscillations …
Reviewer #3 (Public Review):
Pancreatic beta cells in each islet of Langerhans act cooperatively to produce a coordinated response to blood glucose, which takes the form of roughly synchronous electrical oscillations that result in coherent pulses of insulin secretion. However, it has become more appreciated recently that the cells are heterogeneous and that there may subgroups of cells within the islet that contribute in different ways or control different aspects of the collective behavior.
This paper addresses a subset of cells, termed first responders, that are the earliest to transition into activity when glucose is stepped up from a sub-stimulatory level. It is shown that the first responders determine the first transient phase of electrical activity, and implicitly secretion, that precedes the start of steady-state oscillations of the second phase. The first phase is of interest for the pathogenesis of diabetes because it is (or claimed to be) one of the first indications of the disease. The clinical data on this are actually ambiguous, but nonetheless the first phase is an important aspect of how secretion from islets is organized. This is clear from the existence of a subset of readily releasable insulin vesicles, but the electrical activity correlates that synergize with vesicle availability are less well understood. As such, the paper is an important contribution to both islet biology and potentially diabetology.
The approach is to use a genetically encoded calcium indicator, GCamps, and confocal imaging to identify cells that show the earliest rise in calcium and then to verify that this property remains consistent when the glucose stimulus is repeated about an hour later. Further testing over 48 h shows the first responder slowly fading. This thus appears to be a matter of continuous variation of cell properties within the islet and moreover one that is persistent but decaying over long-enough periods of time, rather than a discrete sub-type of beta cell. This is confirmed by simulations using an islet model in which first responders emerge from random variation of properties. The text is a bit ambiguous about whether we should think of the glass as half full or half empty and could be clarified in this regard.
The properties that matter are the density of KATP channels and gap junctional coupling which are both lower. This is also confirmed by simulations. The intriguing suggestion is made that there may be a reciprocal negative feedback relationship between these quantities that regulates their variation over time. This would be rather different from a persistent genetic difference and would be a good subject for future investigation.
Interestingly and perhaps surprisingly, increased sensitivity to glucose is not a feature of the first responders. In contrast, other putative "leader" or "hub" cells that have been identified for the second phase of electrical activity are proposed to have increased glucose sensitivity. This and other features lead to the conclusion that the two types of leader cells are probably distinct. The much-discussed topic of hub cells provides interesting context and relevance to the paper, but its results stand by themselves and can be judged independent of hubs.
-
