Interpreting wide-band neural activity using convolutional neural networks
Curation statements for this article:-
Curated by eLife

Evaluation Summary:
Frey et al. describe a convolutional neural network capable of extracting behavioral correlates from wide-band LFP recordings or even lower-frequency imaging data. The analysis program described by the authors provides a rapid "first pass" analysis using raw, unprocessed data to generate hypotheses that can be tested later with conventional in-depth analyses. This approach is of real value to the community, particularly as it becomes more commonplace for labs to acquire multi-site in vivo recordings.
(This preprint has been reviewed by eLife. We include the public reviews from the reviewers here; the authors also receive private feedback with suggested changes to the manuscript. The reviewers remained anonymous to the authors.)
This article has been Reviewed by the following groups
Discuss this preprint
Start a discussion What are Sciety discussions?Listed in
- Evaluated articles (eLife)
Abstract
Rapid progress in technologies such as calcium imaging and electrophysiology has seen a dramatic increase in the size and extent of neural recordings. Even so, interpretation of this data requires considerable knowledge about the nature of the representation and often depends on manual operations. Decoding provides a means to infer the information content of such recordings but typically requires highly processed data and prior knowledge of the encoding scheme. Here, we developed a deep-learning framework able to decode sensory and behavioral variables directly from wide-band neural data. The network requires little user input and generalizes across stimuli, behaviors, brain regions, and recording techniques. Once trained, it can be analyzed to determine elements of the neural code that are informative about a given variable. We validated this approach using electrophysiological and calcium-imaging data from rodent auditory cortex and hippocampus as well as human electrocorticography (ECoG) data. We show successful decoding of finger movement, auditory stimuli, and spatial behaviors – including a novel representation of head direction - from raw neural activity.
Article activity feed
-

-

Author Response:
Reviewer #2 (Public Review):
Summary:
Frey et al develop an automated decoding method, based on convolutional neural networks, for wideband neural activity recordings. This allows the entire neural signal (across all frequency bands) to be used as decoding inputs, as opposed to spike sorting or using specific LFP frequency bands. They show improved decoding accuracy relative to standard Bayesian decoder, and then demonstrate how their method can find the frequency bands that are important for decoding a given variable. This can help researchers to determine what aspects of the neural signal relate to given variables.
Impact:
I think this is a tool that has the potential to be widely useful for neuroscientists as part of their data analysis pipelines. The authors have publicly available code on github and Colab …
Author Response:
Reviewer #2 (Public Review):
Summary:
Frey et al develop an automated decoding method, based on convolutional neural networks, for wideband neural activity recordings. This allows the entire neural signal (across all frequency bands) to be used as decoding inputs, as opposed to spike sorting or using specific LFP frequency bands. They show improved decoding accuracy relative to standard Bayesian decoder, and then demonstrate how their method can find the frequency bands that are important for decoding a given variable. This can help researchers to determine what aspects of the neural signal relate to given variables.
Impact:
I think this is a tool that has the potential to be widely useful for neuroscientists as part of their data analysis pipelines. The authors have publicly available code on github and Colab notebooks that make it easy to get started using their method.
Relation to other methods:
This paper takes the following 3 methods used in machine learning and signal processing, and combines them in a very useful way. 1) Frequency-based representations based on spectrograms or wavelet decompositions (e.g. Golshan et al, Journal of Neuroscience Methods, 2020; Vilamala et al, 2017 IEEE international workshop on on machine learning for signal processing). This is used for preprocessing the neural data; 2) Convolutional neural networks (many examples in Livezey and Glaser, Briefings in Bioinformatics, 2020). This is used to predict the decoding output; 3) Permutation feature importance, aka a shuffle analysis (https://scikit-learn.org/stable/modules/permutation_importance.htmlhttps://compstat-lmu.github.io/iml_methods_limitations/pfi.html). This is used to determine which input features are important. I think the authors could slightly improve their discussion/referencing of the connection to the related literature.
Overall, I think this paper is a very useful contribution, but I do have a few concerns, as described below.
We thank the reviewer for the encouraging feedback and the helpful summary of the approaches we used. We are happy to read that they consider the framework to be a very useful contribution to the field of neuroscience. The reviewer raises several important questions regarding the influence measure/feature importance, the data format of the SVM and how the model can be used on EEG/ECoG datasets. Moreover, they suggest clarifying the general overview of the approach and to connect it more to the related literature. These are very helpful and thoughtful comments and we are grateful to be given the opportunity to address them.
Concerns:
- The interpretability of the method is not validated in simulations. To trust that this method uncovers the true frequency bands that matter for decoding a variable, I feel it's important to show the method discovers the truth when it is actually known (unlike in neural data). As a simple suggestion, you could take an actual wavelet decomposition, and create a simple linear mapping from a couple of the frequency bands to an imaginary variable; then, see whether your method determines these frequencies are the important ones. Even if the model does not recover the ground truth frequency bands perfectly (e.g. if it says correlated frequency bands matter, which is often a limitation of permutation feature importance), this would be very valuable for readers to be aware of.
- It's unclear how much data is needed to accurately recover the frequency bands that matter for decoding, which may be an important consideration for someone wanting to use your method. This could be tested in simulations as described above, and by subsampling from your CA1 recordings to see how the relative influence plots change.
We thank the reviewer for this really interesting suggestion to validate our model using simulations. Accordingly, we have now trained our model on simulated behaviours, which we created via linear mapping to frequency bands. As shown in Figure 3 - Supplement 2B, the frequency bands modulated by the simulated behaviour can be clearly distinguished from the unmodulated frequency bands. To make the synthetic data more plausible we chose different multipliers (betas) for each frequency component which explains the difference between the peak at 58Hz (beta = 2) and the peak at 3750Hz (beta = 1).
To generate a more detailed understanding of how the detected influence of a variable changes based on the amount of data available, we conducted an additional analysis. Using the real data, we subsampled the training data from 1 to 35 minutes and fully retrained the model using cross-validation. We then used the original feature importance implementation to calculate influence scores across each cross-validation split. To quantify the similarity between the original influence measure and the downsampled influence we calculated the Pearson correlation between the downsampled influence and the one obtained when using the full training set. As can be seen in Figure 3 - Supplement 2A our model achieves an accurate representation of the true influence with as little as 5 minutes of training data (mean Pearson's r = 0.89 ± 0.06)
Page 8-9: To further assess the robustness of the influence measure we conducted two additional analyses. First, we tested how results depended on the amount of training data - (1 - 35 minutes, see Methods). We found that our model achieves an accurate representation of the true influence with as little as 5 minutes of training data (mean Pearson's r = 0.89 ± 0.06, Figure 3 - Supplement 2A). Secondly, we assessed influence accuracy on a simulated behaviour in which we varied the ground truth frequency information (see Methods). The model trained on the simulated behaviour is able to accurately represent the ground truth information (modulated frequencies 58 Hz & 3750 Hz, Figure 3 - Supplement 2B)
Page 20: To evaluate if the influence measure accurately captures the true information content, we used simulated behaviours in which ground truth information was known. We used the preprocessed wavelet transformed data from one animal and created a simulated behaviour ysb using uniform random noise. Two frequency bands were then modulated by the simulated behaviour using fnew = fold * β * ysb. We used β=2 for 58Hz and β=1 for 3750Hz. We then retrained the model using five-fold cross validation and evaluated the influence measure as previously described. We report the proportion of frequency bands that fall into the correct frequencies (i.e. the frequencies we chose to be modulated, 58 Hz & 3750 Hz).
New supplementary Figure:
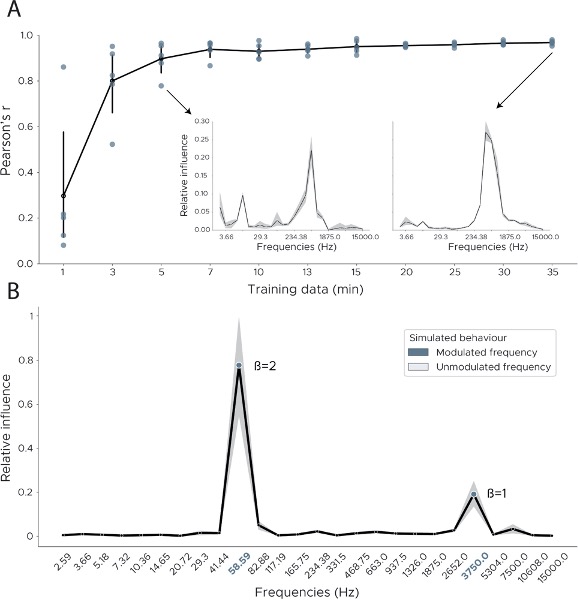
Figure 3 - Supplement 2: Decoding influence for downsampled models and simulations. (A) To measure the robustness of the influence measure we downsampled the training data and retrained the model using cross-validation. We plot the Pearson correlation between the original influence distribution using the full training set and the influence distribution obtained from the downsampled data. Each dot shows one cross-validation split. Inset shows influence plots for two runs, one for 35 minutes of training data, the other in which model training consisted of only 5 minutes of training data. (B) We quantified our influence measure using simulated behaviours. We used the wavelet preprocessed data from one CA1 recording and simulated two behavioural variables which were modulated by two frequencies (58Hz & 3750Hz) using different multipliers (betas 2 & 1). We then trained the model using cross-validation and calculated the influence scores via feature shuffling.
a) It is not clear why your method leads to an increase in decoding accuracy (Fig. 1)? Is this simply because of the preprocessing you are using (using the Wavelet coefficients as inputs), or because of your convolutional neural network. Having a control where you provide the wavelet coefficients as inputs into a feedforward neural network would be useful, and a more meaningful comparison than the SVM. Side note - please provide more information on the SVM you are using for comparison (what is the kernel function, are you using regularization?).
We thank the reviewer for this suggestion and are sorry for the lack of documentation regarding the support vector machine model. The support vector machine was indeed trained on the wavelet transformed data and not on the spike sorted data as we wanted a comparison model which also uses the raw data. The high error of the support vector machine on wavelet transformed data might stem from two problems: (1) The input by design loses all spatial relevant information as the 3-D representation (frequencies x channels x time) needs to be flattened into a 1-D vector in order to train an SVM on it and (2) the SVM therefore needs to deal with a huge number of features. For example, even though the wavelets are downsampled to 30Hz, one sample still consists of (64 timesteps * 128 channels * 26 frequencies) 212992 features, which leads the SVM to be very slow to train and to an overfit on the training set.
This exact problem would also be present in a feedforward neural network that uses the wavelet coefficients as input. Any hidden layer connected to the input, using a reasonable amount of hidden units will result in a multi-million parameter model (e.g. 512 units will result in 109051904 parameters for just the first layer). These models are notoriously hard to train and won’t fit many consumer-grade GPUs, which is why for most spatial signals including images or higher-dimensional signals, convolutional layers are the preferred and often only option to train these models.
We have now included more detailed information about the SVM (including kernel function and regularization parameters) in the methods section of the manuscript.
Page 19:To generate a further baseline measure of performance when decoding using wavelet transformed coefficients, we trained support vector machines to decode position from wavelet transformed CA1 recordings. We used either a linear kernel or a non-linear radial-basis-function (RBF) kernel to train the model, using a regularization factor of C=100. For the non-linear RBF kernel we set gamma to the default 1 / (num_features * var(X)) as implemented in the sklearn framework. The SVM model was trained on the same wavelet coefficients as the convolutional neural network
b) Relatedly, because the reason for the increase in decoding accuracy is not clear, I don't think you can make the claim that "The high accuracy and efficiency of the model suggest that our model utilizes additional information contained in the LFP as well as from sub-threshold spikes and those that were not successfully clustered." (line 122). Based on the shown evidence, it seems to me that all of the benefits vs. the Bayesian decoder could just be due to the nonlinearities of the convolutional neural network.
Thanks for raising this interesting point regarding the linear vs. non-linear information contained in the neural data. Indeed, when training the model with a linear activation function for the convolutions and fully connected layers, model performance drops significantly. To quantify this we ran the model with three different configurations regarding its activation functions. We (1) used nonlinear activation functions only in the convolutional layers (2) or the fully connected layers or (3) only used linear activation functions throughout the whole model. As expected the model with only linear activation functions performed the worst (linear activation functions 61.61cm ± 33.85cm, non-linear convolutional layers 22.99cm ± 18.67cm, non-linear fully connected layers 47.03cm ± 29.61cm, all layers non-linear 18.89cm ± 4.66cm). For comparison the Bayesian decoder achieves a decoding accuracy of 23.25cm ± 2.79cm on this data.
Thus it appears that the reviewer is correct - the advantage of the CNN model comes in part from the non-linearity of the convolutional layers. The corollary of this is that there are likely non-linear elements in the neural data that the CNN but not Bayes decoder can access. However, the CNN does also receive wider-band inputs and thus has the potential to utilize information beyond just detected spikes.
In response to the reviewers point and to the new analysis regarding the LFP models raised by reviewer 1, we have now reworded this sentence in the manuscript.
Page 4: The high accuracy and efficiency of the model for these harder samples suggest that the CNN utilizes additional information from sub-threshold spikes and those that were not successfully clustered, as well as nonlinear information which is not available to the Bayesian decoder.
-
Reviewer #2 (Public Review):
Summary:
Frey et al develop an automated decoding method, based on convolutional neural networks, for wideband neural activity recordings. This allows the entire neural signal (across all frequency bands) to be used as decoding inputs, as opposed to spike sorting or using specific LFP frequency bands. They show improved decoding accuracy relative to standard Bayesian decoder, and then demonstrate how their method can find the frequency bands that are important for decoding a given variable. This can help researchers to determine what aspects of the neural signal relate to given variables.
Impact:
I think this is a tool that has the potential to be widely useful for neuroscientists as part of their data analysis pipelines. The authors have publicly available code on github and Colab notebooks that make it …
Reviewer #2 (Public Review):
Summary:
Frey et al develop an automated decoding method, based on convolutional neural networks, for wideband neural activity recordings. This allows the entire neural signal (across all frequency bands) to be used as decoding inputs, as opposed to spike sorting or using specific LFP frequency bands. They show improved decoding accuracy relative to standard Bayesian decoder, and then demonstrate how their method can find the frequency bands that are important for decoding a given variable. This can help researchers to determine what aspects of the neural signal relate to given variables.
Impact:
I think this is a tool that has the potential to be widely useful for neuroscientists as part of their data analysis pipelines. The authors have publicly available code on github and Colab notebooks that make it easy to get started using their method.
Relation to other methods:
This paper takes the following 3 methods used in machine learning and signal processing, and combines them in a very useful way. 1) Frequency-based representations based on spectrograms or wavelet decompositions (e.g. Golshan et al, Journal of Neuroscience Methods, 2020; Vilamala et al, 2017 IEEE international workshop on on machine learning for signal processing). This is used for preprocessing the neural data; 2) Convolutional neural networks (many examples in Livezey and Glaser, Briefings in Bioinformatics, 2020). This is used to predict the decoding output; 3) Permutation feature importance, aka a shuffle analysis (https://scikit-learn.org/stable/modules/permutation_importance.htmlhttps://compstat-lmu.github.io/iml_methods_limitations/pfi.html). This is used to determine which input features are important. I think the authors could slightly improve their discussion/referencing of the connection to the related literature.
Overall, I think this paper is a very useful contribution, but I do have a few concerns, as described below.
Concerns:
The interpretability of the method is not validated in simulations. To trust that this method uncovers the true frequency bands that matter for decoding a variable, I feel it's important to show the method discovers the truth when it is actually known (unlike in neural data). As a simple suggestion, you could take an actual wavelet decomposition, and create a simple linear mapping from a couple of the frequency bands to an imaginary variable; then, see whether your method determines these frequencies are the important ones. Even if the model does not recover the ground truth frequency bands perfectly (e.g. if it says correlated frequency bands matter, which is often a limitation of permutation feature importance), this would be very valuable for readers to be aware of.
It's unclear how much data is needed to accurately recover the frequency bands that matter for decoding, which may be an important consideration for someone wanting to use your method. This could be tested in simulations as described above, and by subsampling from your CA1 recordings to see how the relative influence plots change.
a) It is not clear why your method leads to an increase in decoding accuracy (Fig. 1)? Is this simply because of the preprocessing you are using (using the Wavelet coefficients as inputs), or because of your convolutional neural network. Having a control where you provide the wavelet coefficients as inputs into a feedforward neural network would be useful, and a more meaningful comparison than the SVM. Side note - please provide more information on the SVM you are using for comparison (what is the kernel function, are you using regularization?).
b) Relatedly, because the reason for the increase in decoding accuracy is not clear, I don't think you can make the claim that "The high accuracy and efficiency of the model suggest that our model utilizes additional information contained in the LFP as well as from sub-threshold spikes and those that were not successfully clustered." (line 122). Based on the shown evidence, it seems to me that all of the benefits vs. the Bayesian decoder could just be due to the nonlinearities of the convolutional neural network.
-
Reviewer #1 (Public Review):
In the current manuscript, Frey et al. describe a convolutional neural network capable of extracting behavioral correlates from wide-band LFP recordings or even lower-frequency imaging data. Other publications (referenced by the authors) have employed similar ideas previously, but to my knowledge, the current implementation is novel. In my opinion, the real value of this method, as the authors state in their final paragraph, is that it represents a rapid, "first-pass" analysis of large-scale electrophysiological recordings to quickly identify relevant neural features which can then become the focus of more in-depth analyses. As such, I think the analysis program described by the authors is of real value to the community, particularly as it becomes more commonplace for labs to acquire multi-site in vivo …
Reviewer #1 (Public Review):
In the current manuscript, Frey et al. describe a convolutional neural network capable of extracting behavioral correlates from wide-band LFP recordings or even lower-frequency imaging data. Other publications (referenced by the authors) have employed similar ideas previously, but to my knowledge, the current implementation is novel. In my opinion, the real value of this method, as the authors state in their final paragraph, is that it represents a rapid, "first-pass" analysis of large-scale electrophysiological recordings to quickly identify relevant neural features which can then become the focus of more in-depth analyses. As such, I think the analysis program described by the authors is of real value to the community, particularly as it becomes more commonplace for labs to acquire multi-site in vivo recordings. However, to maximize its utility to the community, several aspects of the analysis need clarification.
-
Evaluation Summary:
Frey et al. describe a convolutional neural network capable of extracting behavioral correlates from wide-band LFP recordings or even lower-frequency imaging data. The analysis program described by the authors provides a rapid "first pass" analysis using raw, unprocessed data to generate hypotheses that can be tested later with conventional in-depth analyses. This approach is of real value to the community, particularly as it becomes more commonplace for labs to acquire multi-site in vivo recordings.
(This preprint has been reviewed by eLife. We include the public reviews from the reviewers here; the authors also receive private feedback with suggested changes to the manuscript. The reviewers remained anonymous to the authors.)
-
