Blind genomic tree scans identify loci underlying adaptive peaks in Antirrhinum
Curation statements for this article:-
Curated by eLife

eLife Assessment
This valuable study introduces a creative Dxy-tree scan approach for identifying genomic partitions without a priori assignment of populations, with potential applicability to studies of barriers to gene flow, adaptation and speciation. The results in the study case are supported by solid evidence, although the recovery and extension of known flower-colour loci is best viewed as validation of the approach rather than providing new biological insight. The theoretical basis, including estimates of sensitivity and specificity across evolutionary scenarios and robustness to clustering and threshold choices, is, however, only incompletely developed; the broader utility and generality of the method is currently difficult to assess. The work will be of interest to population geneticists and evolutionary biologists.
This article has been Reviewed by the following groups
Listed in
- Evaluated articles (eLife)
Abstract
A key question in evolutionary biology is how barriers to gene flow operate and arise between populations, leading to speciation. Barriers are typically identified by comparing populations distinguished by phenotype, geographical location and/or environment. However, such prior classifications may bias recovery towards features obvious to the human eye, influencing mechanistic interpretations. Here we develop a method blind to prior classifications. We apply it to 18 Antirrhinum populations occupying habitats from coastal to alpine. By scanning the genome for regions with deeply rooted similar trees, we identify a single multi-locus partition, comprising less than 0.5% of the genome. It derives from eight genes, three newly identified here, which interact to generate complementary pollinator guides, likely corresponding to two adaptive peaks in a fitness landscape. Hybrid genotypes fall in a fitness valley, allowing the partition to be maintained through hybrid incompatibility and creating steep clines in allele frequency at a hybrid zone. Another partition derives from a single locus linked to a gene controlling plant height. The locus exhibits a shallow cline in allele frequency across an eco-geographic barrier and may be eco-adaptive. Our results suggest that two ancestral subspecies underwent extensive gene flow except at a few barrier loci, showing how both hybrid incompatibility and eco-adaptation can operate to maintain diversity.
Article activity feed
-

eLife Assessment
This valuable study introduces a creative Dxy-tree scan approach for identifying genomic partitions without a priori assignment of populations, with potential applicability to studies of barriers to gene flow, adaptation and speciation. The results in the study case are supported by solid evidence, although the recovery and extension of known flower-colour loci is best viewed as validation of the approach rather than providing new biological insight. The theoretical basis, including estimates of sensitivity and specificity across evolutionary scenarios and robustness to clustering and threshold choices, is, however, only incompletely developed; the broader utility and generality of the method is currently difficult to assess. The work will be of interest to population geneticists and evolutionary biologists.
-
Reviewer #1 (Public review):
Summary:
The authors describe a novel method that uses genomic data to identify loci underlying barriers to gene flow among populations. The method involves estimating dxy-based trees for individual genomic windows and scanning across windows to identify deep partitions in genetic variation across populations. The authors apply this method to a pool-seq dataset collected from snapdragon populations of different subspecies that differ in flower pigmentation. Eight putative barrier loci are identified in this study, three corresponding to well-characterized flower color genes in Antirrhinum. The authors validate three other barrier loci as new candidate genes for flower color variation using genetic co-segregation analyses. The described method offers a way to identify barrier loci among populations without …
Reviewer #1 (Public review):
Summary:
The authors describe a novel method that uses genomic data to identify loci underlying barriers to gene flow among populations. The method involves estimating dxy-based trees for individual genomic windows and scanning across windows to identify deep partitions in genetic variation across populations. The authors apply this method to a pool-seq dataset collected from snapdragon populations of different subspecies that differ in flower pigmentation. Eight putative barrier loci are identified in this study, three corresponding to well-characterized flower color genes in Antirrhinum. The authors validate three other barrier loci as new candidate genes for flower color variation using genetic co-segregation analyses. The described method offers a way to identify barrier loci among populations without assigning samples into predetermined groups and can also be applied to pool-seq data that is commonly generated to examine how allele frequencies vary over geographic space. The paper would be improved by clarifying whether and how the method, as presented, reproducibly identifies barrier loci corresponding to deep divergence events.
Strengths:
A strength of this paper is the development of a method that can identify early genetic partitions in a set of population samples without a priori assigning them into groups. This approach will therefore be relevant to population geneticists studying species barriers. The method is flexible and can be applied to various kinds of population genomic datasets, including poolseq data.
In a demonstration of the method, this paper identifies three new genetic loci that contribute to differences in floral color patterning between the two snapdragon taxa, which are validated using co-segregation analyses. These new findings are a significant addition to the body of work describing the polygenic basis for flower color differences among snapdragon taxa.
Weaknesses:
The study could be improved with further clarification of whether and how the dxy-tree scanning algorithm reproducibly identifies barrier regions. To identify groups of outlier trees, the authors first bin dxy trees based on the cophenetic correlation coefficient (c) and then identify outliers based on a threshold value of SRB=0.002. Which trees are identified as outliers appears to be sensitive to the starting seed tree (as reported in the main text), as well as the chosen value of c (as demonstrated in Figure S3). Moreover, outlier forests are chosen based on average mean division depth, and yet the mean division depth for a given forest appears to vary substantially across values of c, again demonstrated in Figure S3. The choice of c=0.5 and 0.002 as thresholds for SRB was not explained. It is unclear how readers would make their own decisions about threshold cutoffs should they apply to their own data. The manuscript would be improved if the authors address this important issue of whether and how their approach, as presented, can reproducibly identify sets of trees that represent outliers in genomic variation.
A related issue is that by first binning trees based on similarity, then filtering on mean SRB value, the method potentially returns outlier forests containing individual trees with low SRB values. Should such trees be considered barrier loci? If so, it might be worth revisiting/softening some of the conceptual framing throughout the paper, because trees with lower SRB values would be consistent with gene flow across the partitions (i.e., not barrier loci). Would a more conservative approach be to first summarize SRB length in the set of non-singleton trees, filter individuals based on an empirically derived SRB threshold, and then cluster the set of SRB-outlier trees?
To address these weaknesses, the authors should provide a more nuanced discussion of the nature of the genomic regions returned from their algorithm and suggest/demonstrate approaches to reproducibly return genuine barrier loci.
Finally, we suggest the authors include a brief discussion of how variation in the rate of molecular evolution across loci affects the results, given that the SRB threshold is an absolute (not relative) threshold.
-
Reviewer #2 (Public review):
Richardson et al. propose a new method for identifying loci underlying reproductive barriers based on Dxy-based distance trees. They apply this method to the well-studied model system Antirrhinum majus and identify seven genomic regions associated with flower color loci, five of which are known from previous studies, while three new regions emerge from this study. The authors validate their findings using allele frequencies across a natural hybrid zone and link genetic variation to observed phenotypes using an impressive set of quantitative data from controlled crosses. Six regions exhibit steep allele frequency clines across the narrow hybrid zone (which exhibits no obvious difference in environment or pollinators), supporting the hypothesis that color genes are associated with reproductive barriers. One …
Reviewer #2 (Public review):
Richardson et al. propose a new method for identifying loci underlying reproductive barriers based on Dxy-based distance trees. They apply this method to the well-studied model system Antirrhinum majus and identify seven genomic regions associated with flower color loci, five of which are known from previous studies, while three new regions emerge from this study. The authors validate their findings using allele frequencies across a natural hybrid zone and link genetic variation to observed phenotypes using an impressive set of quantitative data from controlled crosses. Six regions exhibit steep allele frequency clines across the narrow hybrid zone (which exhibits no obvious difference in environment or pollinators), supporting the hypothesis that color genes are associated with reproductive barriers. One additional region is associated with plant height, though its contribution as a barrier locus remains unclear.
The ability to perform genome scans without a priori knowledge of the phenotypic or ecological features that separate natural populations is highly valuable for non-model, less-studied organisms. The use of trees, specifically based on Dxy distances, to sidestep the need for a priori defined population contrasts reflects other recent developments in population genetics where tree topologies - which carry more information than scalar summary statistics - are leveraged for inferring population evolutionary history. The use of the root branch length (SRB) as the outlier metric makes this method tuned to detect old and highly divergent alleles sheltered from gene flow across major tree partitions. Overall, the method's recovery of known flower loci in the well-studied A. majus system lends confidence to the approach. However, some aspects - particularly related to the theory of hybrid incompatibilities and their detection through the Dxy metric, the conceptual framing of the method, and its power under different evolutionary parameters - need to be clarified.
(1) There exists rich literature on the use of Dxy to detect so-called 'speciation genes' in the alternative contexts of primary divergence and secondary contact, with some of the best-known empirical cases consistent with the latter scenario. This secondary contact scenario is also proposed by the authors to underlie the evolution of flower loci here in A. majus. While it is clear that Dxy-tree outliers reflect deeply divergent loci, it is unclear whether these necessarily reflect barrier loci (underlying hybrid incompatibility) or if they may also reflect adaptive loci composed of old haplotypes carried by the parental lineages and maintained by divergent selection. The authors identify flower color genes as barrier loci, whereas the locus associated with plant height is interpreted in the context of adaptation. Moreover, the model presented to explain the flower barrier loci is in essence driven by divergent selection. Overall, little effort is made in the paper to explain conceptually different processes, and the ambiguity of the text makes interpretation difficult and inconclusive. This lack of conceptual elaboration also hinders interpretation of the Dxy-based distance trees in general. For example, it is unclear what the genome-wide Dxy tree (which appears distinct from the consensus phylogeny) is supposed to reflect, what evolutionary mechanisms could generate alternative tree topologies (partitions), how much of this is due to technical noise and skewed sampling versus demographic history and lineage sorting, and how such alternative partitions should be treated. The theoretical basis for distinguishing barrier from (old) adaptive loci, the properties of Dxy relative to other metrics, and the relationship between Dxy trees and these fundamental concepts need to be explained in light of the evolutionary mechanisms that generate the signal captured by this metric.
(2) The paper would benefit from power analyses to assess the method's sensitivity and specificity under a range of evolutionary parameters (e.g. divergence time, migration rate), i.e., how old and how reduced must the local migration rate be (in comparison to the genome-wide distribution) for this method to be able to detect a significant signal? Knowledge of the sensitivity, specificity and limits of this approach is crucial, especially for the method's target application, i.e., less well-studied organisms with poorly characterized phenotypes. The most convincing results presented in the paper fall back to the partition corresponding to loci underlying divergent phenotypes that were already known a priori (i.e., the flower color loci), therefore questioning the primary scope of the new method. Further, the implementation presented currently lacks statistical procedures to discern significant forests from potential false positives. Guidance on model parameters (SRB and cophenetic correlation coefficient c thresholds, which are shown to have large effects on the results) should be proposed beyond heuristics, ideally based on an empirical null and probabilistic framework, and accounting for multiple hypothesis testing, to properly quantify model power.
(3) The approach of using progressive elimination to cluster trees (into forests) may be problematic, because forest clusters are not strictly determined by those with the closest tree distance but rather by the order of seed trees (e.g., if the first seed tree has a 0.7 correlation with tree T1 and the second seed tree has a 0.9 correlation with that same tree T1, then even though tree T1 is closer to the second seed tree, it will be clustered with the first seed tree's forest). Clustering error from seed tree stochasticity is reduced by repeating the tree-scanning 100 times with independent random seeds; however, implementing a convergence metric to formalize this, or implementing an alternative algorithm that avoids progressive elimination of trees, would be a more robust solution.
(4) The authors present two competing hypotheses: (i) that flower color genes act as barrier loci because they are eco-adaptive, and (ii) that the fitness landscape for flower color has two peaks within the same environment. The alternative framing of these two hypotheses is confusing because having multiple peaks in a fitness landscape is not mutually exclusive to being eco-adaptive, as they actually mention in the discussion. It would be less confusing if these were simply presented as one-peak versus two-peak fitness landscape alternatives.
The study's proposed method of blind genomic tree scans is potentially very valuable to biologists working in the fields of speciation and adaptation. Here, in this case study on the model system A. majus, complementary evidence based on allele frequency clines and validation experiments using controlled crosses provides solid support for their results. However, for general application to other species - including non-model and less-studied species - more detailed profiling of the method and clearer conceptual framing is needed.
-
Author response:
Our paper presents both a novel method for identifying barrier loci and a key biological finding derived from it. On reading both reviews, we realise that the key biological finding was not conveyed with sufficient clarity. We will try to make this point more clearly in the Discussion and by revising the Abstract to end with:
The recovery of a single multi-locus partition shows that the previous focus on flower colour barrier loci was not an arbitrary consequence of visual salience to ecological geneticists. Instead, complex traits with a signalling role, like colour patterns, may lend themselves to the formation of multi-peaked fitness landscapes in a common environment because the same signal can be conveyed in multiple ways.
Reviewer #1 (Public review):
We thank the reviewer for their thoughtful comments and …
Author response:
Our paper presents both a novel method for identifying barrier loci and a key biological finding derived from it. On reading both reviews, we realise that the key biological finding was not conveyed with sufficient clarity. We will try to make this point more clearly in the Discussion and by revising the Abstract to end with:
The recovery of a single multi-locus partition shows that the previous focus on flower colour barrier loci was not an arbitrary consequence of visual salience to ecological geneticists. Instead, complex traits with a signalling role, like colour patterns, may lend themselves to the formation of multi-peaked fitness landscapes in a common environment because the same signal can be conveyed in multiple ways.
Reviewer #1 (Public review):
We thank the reviewer for their thoughtful comments and summary of the paper. The reviewer makes several helpful suggestions that will help us improve the manuscript by clarifying the relative importance of overall tree similarity (c) and depth of root division (SRB) for our method.
(1) The choice of c=0.5 and 0.002 as thresholds for SRB was not explained. It is unclear how readers would make their own decisions about threshold cutoffs should they apply to their own data. The manuscript would be improved if the authors address this important issue of whether and how their approach, as presented, can reproducibly identify sets of trees that represent outliers in genomic variation.
Our choices were based on empirical rules of thumb, equivalent to choosing FST peaks because they “stand out”. Using a more stringent c threshold of 0.6 led to partition trees being split over multiple forests (Supp Fig. 3 red circles) and partition islands no longer stood out as clearly (Supp Fig. 4c). Thus, a c threshold of 0.5 seemed most informative for our data, as it was the maximum stringency that returned clear partition islands. The SRB threshold of 0.002 also seemed most informative, as lowering the threshold to 0.0015 recovered a high density of windows as the largest forest was captured (Supp Fig. 5). Whether the threshold choices return genuine barrier loci can be evaluated using statistical arguments and criteria based on other approaches as outlined below in points 2 and 3. We will clarify these points in the Results and Discussion.
(2) A related issue is that by first binning trees based on similarity, then filtering on mean SRB value, the method potentially returns outlier forests containing individual trees with low SRB values. Should such trees be considered barrier loci?
This important point revolves around the question of what causes low SRB values. Plotting SRB for a well-studied locus, ROS (Fig. 8g), shows that island windows giving low SRB tend to be on the flanks of the causative loci, where you might expect barrier strength to be lower because of recombination. It is therefore likely these windows are valid but correspond to weak barriers because they are on the coastal regions, as it were, of islands. For some islands, such as island 2, only trees with low SRB (i.e. less than 0.002) are recovered. The question arises of whether these are genuine weak barriers or background. We believe this island likely harbours a genuine barrier locus for four reasons: (1) it harbours the key yellow pigment biosynthetic gene, AS1, (2) it is linked to a locus affecting yellow flower colour, (3) it exhibits clines across the hybrid zone, (4) like ROS and other well-studied barrier loci, the island exhibits the A partition, which is only one out 18!/(9!x9!) = 48,620 possible partitions for a 9:9 division, making its occurrence by chance unlikely given that there are of the order of 100 trees with a 9:9 division (Fig. 2a). Island 2 therefore most likely harbours a weak barrier locus. Similarly, islands 5 and 7 may be weak barriers, though evidence based on homology to a gene with known function in yellow pigmentation is less compelling. Thus, partition windows with low SRB can arise either because they are on the flanks of a strong barrier or because they derive from a weak barrier. We will clarify this point in the revised version.
(3) If so, it might be worth revisiting/softening some of the conceptual framing throughout the paper, because trees with lower SRB values would be consistent with gene flow across the partitions (i.e., not barrier loci). Would a more conservative approach be to first summarize SRB length in the set of non-singleton trees, filter individuals based on an empirically derived SRB threshold, and then cluster the set of SRB-outlier trees? The paper would be improved by clarifying whether and how the method, as presented, reproducibly identifies barrier loci corresponding to deep divergence events.
To address these weaknesses, the authors should provide a more nuanced discussion of the nature of the genomic regions returned from their algorithm and suggest/demonstrate approaches to reproducibly return genuine barrier loci.
Following the reviewer’s helpful suggestion, we have explored the other option of using SRB as the first filter. We plotted frequency histograms for SRB values for all trees and non-singleton trees:
Author response image 1.
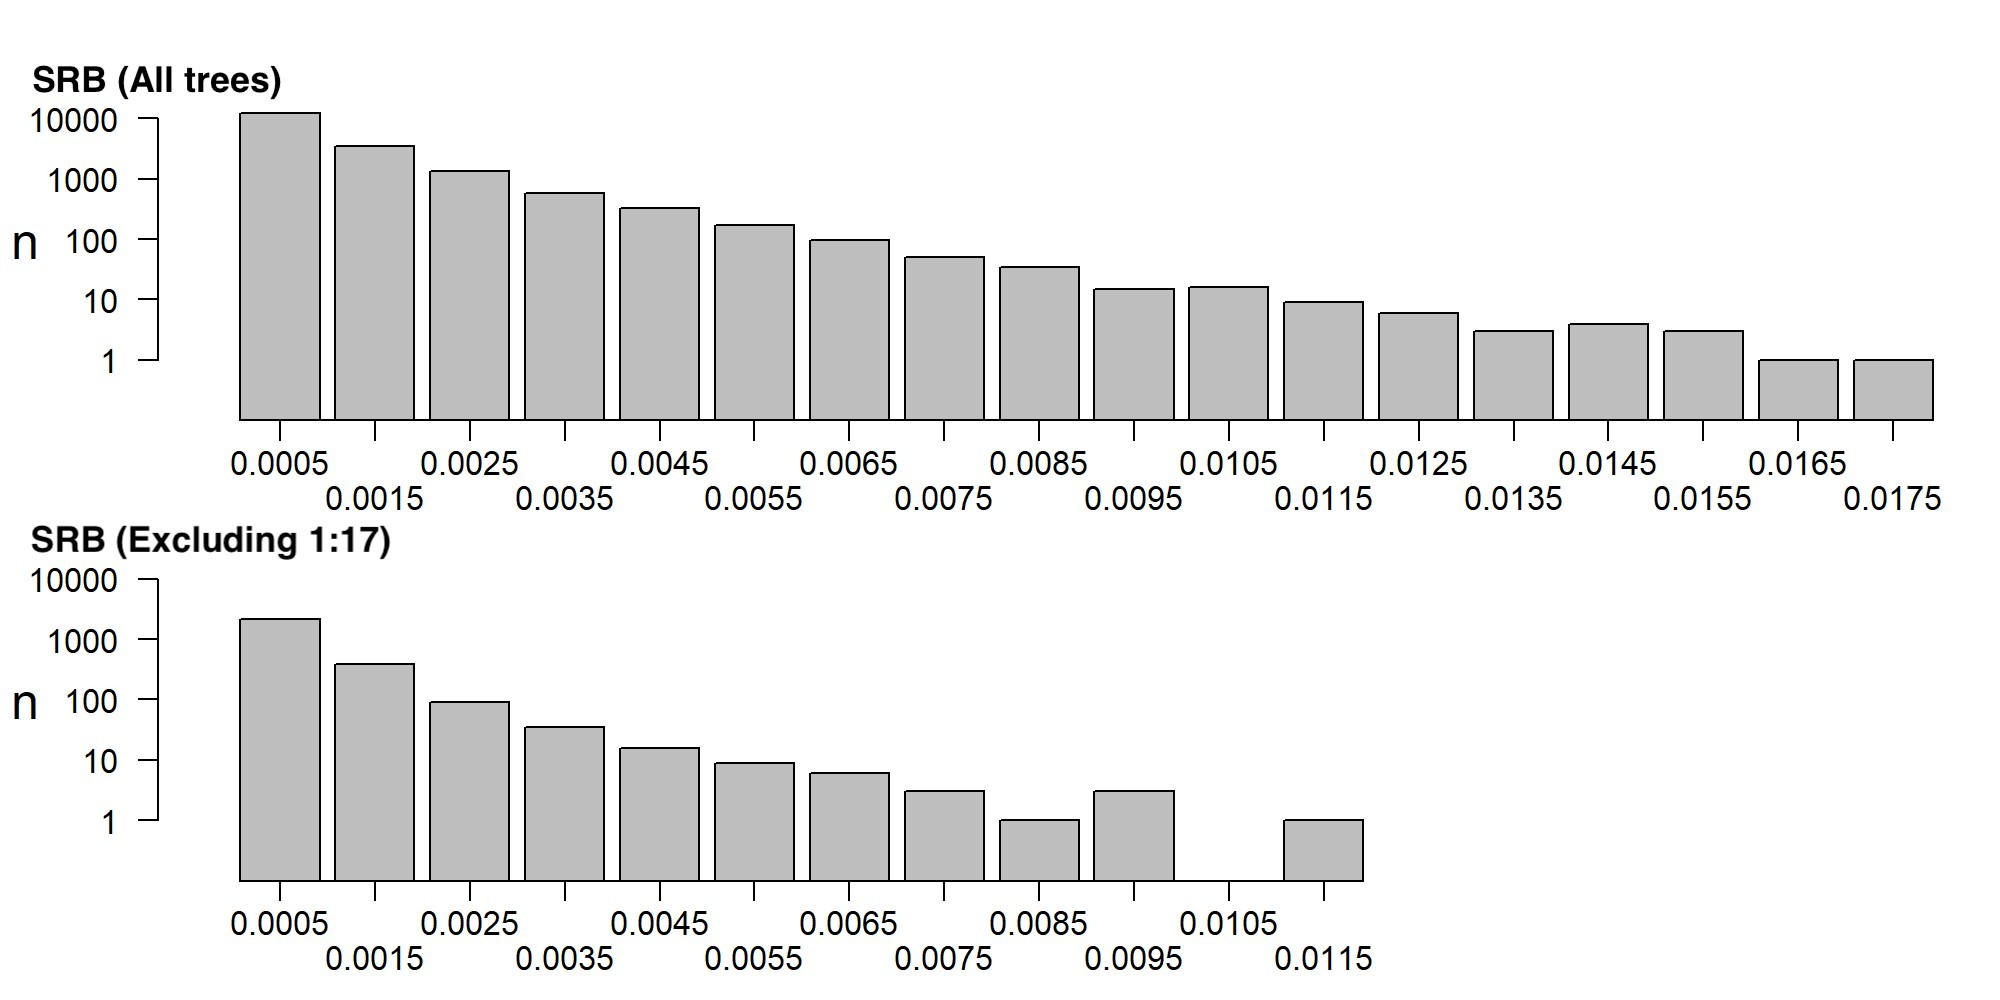
The distribution is a unimodal decline with SRB (note vertical log scale) without a clear threshold. Presumably this distribution reflects fluctuations in gene flow, mutation rate, the effects of limited pool size, window size, and tree construction approximations. SRB values extend to higher values than with our forest analysis (where maximum SRB is 0.0035, Fig. 3b) because high-SRB trees are often grouped into forests with low-SRB trees, giving a low forest mean. 14.4% of all trees and 6.1% of non-singleton trees have SRB >0.002, the threshold used for identification of outlier forests. The SRB distribution helps clarify where the resolving power of our method comes from for different partitions.
Consider the 9:9 division, which has 48,620 possible partitions. The observed flower colour forest mainly comprises about 50 trees, of which 30 give the A partition that divides according to flower colour (Supp Fig. 2). The probability of an A tree occurring by chance within a 9:9 division is 1/48,620 = 2 x 10⁻⁵. Taking the observed number of 100 trees with a 9:9 division, and assuming that an A tree is identified, the probability of a second one occurring by chance among the 100 trees is of order of 10-3, and the probability of a third one occurring is 10-6. The probability of a forest containing 30 A-partition trees, even allowing for window overlaps, is negligible. Together with the high mean SRB for this forest, the evidence that the forest contains barrier loci is strong from blind-tree scanning alone.
The evidence in favour of the partition B forest harbouring barrier loci based on blind-tree scanning alone is much weaker. This forest derives from only two overlapping windows, so the argument based on repeated independent recovery of the same partition cannot be used. The forest is recovered because of its high SRB value (> 0.003) and distinctive tree architecture which prevents it from being grouped with lower-SRB trees. Other criteria, such as clines and linkage to trait loci need to be considered in evaluating its candidacy as a barrier locus.
We thank the reviewer for raising this point as it clarifies the contributions of tree similarity and division depth (SRB) to identifying barriers. We will incorporate the histogram and discuss these points in the revised version.
(4) Finally, we suggest the authors include a brief discussion of how variation in the rate of molecular evolution across loci affects the results, given that the SRB threshold is an absolute (not relative) threshold.
This comment suggests that the reviewer attributes low SRB to low rates of molecular evolution rather than low barrier strength. This is understandable as we did not discuss the possible causes of low SRB. We will remedy this omission in the revised manuscript as outlined in response to points 2 and 3 above.
Reviewer #2 (Public review):
We thank the reviewer for their valuable comments and summary of the paper. The reviewer’s comments have been invaluable in helping us to clarify the biological implications of our findings and relating our method to others. We address issues concerning hybrid incompatibility, Dxy and power in turn below.
(1) Hybrid incompatibility
Unfortunately, the biological implications of our findings did not come across clearly to the reviewer because of a misunderstanding concerning hybrid incompatibility.
The model presented to explain the flower barrier loci is in essence driven by divergent selection. Overall, little effort is made in the paper to explain conceptually different processes, and the ambiguity of the text makes interpretation difficult and inconclusive.
The model we propose is a two-peaked fitness landscape which is fixed rather than needing to change according to environmental conditions (Fig. 10 d and e). Thus, the fitness landscape can be the same either side of a hybrid zone. What differs is flower colour allele frequencies: striatum alleles near fixation on one side of the hybrid zone, underlying one peak, and pseudomajus alleles near fixation on the other side, underlying the other peak. Flow of flower colour alleles between the two sides is reduced because of lower fitness of hybrid genotypes which fall in the fitness valley between the peaks. These hybrids form in the contact zone. Thus, in contrast to the reviewer’s interpretation, we are not proposing that divergent selection through environmental differences underlies the barrier, because the fitness landscape is fixed. It is the fitness valley that creates the barrier rather environmental variation. We will revise the paper to make this point clearer.
The authors present two competing hypotheses: (i) that flower color genes act as barrier loci because they are eco-adaptive, and (ii) that the fitness landscape for flower color has two peaks within the same environment. The alternative framing of these two hypotheses is confusing because having multiple peaks in a fitness landscape is not mutually exclusive to being eco-adaptive, as they actually mention in the discussion.
We wonder if confusion has arisen here because we did not explicitly state that with the hybrid incompatible hypothesis alone, it is not only that the fitness landscape has two peaks in a given environment, but that the fitness landscape need not vary from one environment (or geographical location) to another. By contrast, with a pure eco-adaptive hypothesis the position of a single peak varies with environment (i.e. it tracks the environment), and there is no valley between peaks in the fitness landscape (i.e. no hybrid incompatibility). Based on our findings and those of others, we argue that the eco-adaptive (single peak) hypothesis alone is an unlikely explanation for the data. A hybrid-incompatibility (two peak) hypothesis alone could account for the data. However, so could a mixed model, involving both mechanisms. Thus, in the Discussion we write: “The two-peak hypothesis does not rule out eco-adaptive effects: the relative heights of the two peaks may vary according to environment.” We will clarify these points in the revised version.
It is unclear how the double-peak hypothesis is consistent with the geographic separation of the populations. Following the rationale presented in the manuscript, the two phenotypes should be able to co-occur, but, as far as I understand, this is not realised in nature.
The reviewer interprets our hypothesis as suggesting that because there are two peaks in the fitness landscape, both can be occupied at the same time and same location. This is not what we are suggesting. Instead, we propose one peak is occupied on one side of a hybrid zone, and the other peak occupied on the other side. Given that the loci controlling magenta and yellow flower colour map to 6 different chromosomes, recombination (segregation) would prevent the two morphs from co-occurring in substantial frequencies. This expectation is borne out by the range of phenotypes observed at a hybrid zone. Thus, geographical separation of the two morphs not only consistent with our double-peak hypothesis; it is a requirement, given the number of unliked loci involved. The unlinked nature of the loci is mentioned throughout the text, but we will further clarify the point in the revised version.
Taken together, the reviewer’s comments reveal that we did not convey our hypothesis with sufficient clarity. The resulting misunderstandings have nevertheless been helpful for us to identify potential ambiguities in the paper that will be remedied in the revised version.
(2) Dxy
This lack of conceptual elaboration also hinders interpretation of the Dxy-based distance trees in general. For example, it is unclear what the genome-wide Dxy tree (which appears distinct from the consensus phylogeny) is supposed to reflect, what evolutionary mechanisms could generate alternative tree topologies (partitions), how much of this is due to technical noise and skewed sampling versus demographic history and lineage sorting, and how such alternative partitions should be treated. The theoretical basis for distinguishing barrier from (old) adaptive loci, the properties of Dxy relative to other metrics, and the relationship between Dxy trees and these fundamental concepts need to be explained in light of the evolutionary mechanisms that generate the signal captured by this metric.
We agree that giving more background on the use of Dxy would be helpful. Dxy is not typically used as a primary metric for trees or for identifying barrier loci because it confounds within-population diversity with between-population diversity. As shown in the trees of Fig.2, the lengths of the terminal branches reflect within-population divergence, while the length of root branches reflects between-population divergence. Dxy genome scans also tend to be quite noisy, which is why Fst is preferred: it subtracts within- from between-population diversity. Dxy is typically used as a secondary metric to investigate the basis of Fst peaks. However, Dxy has a major advantage for detecting barrier loci, in that it is not sensitive to sweeps or inbreeding if sampled over a sufficiently large region of the genome. We show that when used for genomic scanning, Dxy trees can identify barrier loci at least as effectively as Fst comparisons, and with the advantage of not having to use prior pairwise assignments of populations. We will give this additional background in the revised version of the paper.
(3) Power of the method
The paper would benefit from power analyses to assess the method's sensitivity and specificity under a range of evolutionary parameters (e.g. divergence time, migration rate), i.e., how old and how reduced must the local migration rate be (in comparison to the genome-wide distribution) for this method to be able to detect a significant signal? Knowledge of the sensitivity, specificity and limits of this approach is crucial, especially for the method's target application, i.e., less well-studied organisms with poorly characterized phenotypes. The most convincing results presented in the paper fall back to the partition corresponding to loci underlying divergent phenotypes that were already known a priori (i.e., the flower color loci), therefore questioning the primary scope of the new method. Further, the implementation presented currently lacks statistical procedures to discern significant forests from potential false positives. Guidance on model parameters (SRB and cophenetic correlation coefficient c thresholds, which are shown to have large effects on the results) should be proposed beyond heuristics, ideally based on an empirical null and probabilistic framework, and accounting for multiple hypothesis testing, to properly quantify model power.
We perform a sensitivity analysis by exploring the effect of different c and SRB thresholds (Supp Figures 3-5). We agree that it would be desirable to perform further sensitivity analysis through simulations of various scenarios. While such analysis is beyond the scope of the paper, following points raised by both reviewers, we will incorporate a more extensive discussion about resolving power along the following lines: See Author response image 1.
Frequency histograms of SRB for all trees and non-singleton trees exhibit a unimodal decline with SRB (note vertical log scale). Presumably this distribution reflects fluctuations in gene flow, mutation rate, the effects of limited pool size, window size, and tree construction approximations. SRB values extend to higher values than with our forest analysis (where maximum SRB is 0.0035, Fig. 3b) because high-SRB trees are often grouped into forests with low-SRB trees, giving a low forest mean. 14.4% of all trees and 6.1% of non-singleton trees have SRB >0.002, the threshold used for identification of outlier forests. The SRB distribution helps clarify where the resolving power of our method comes from for different partitions.
Consider the 9:9 division. The observed flower colour forest mainly comprises about 50 trees, of which 30 give the A partition that divides according to flower colour (Supp Fig. 2). There are 18!/(9!x9!) = 48,620 possible partitions for a 9:9 division, so the probability of an A tree occurring by chance within a 9:9 division is 1/48,620 = 2 x 10⁻⁵. Taking the observed number of 100 trees with a 9:9 division, and assuming that an A tree is identified, the probability of a second one occurring by chance among the 100 trees is of order of 10-3, and the probability of a third one occurring is 10-6. The probability of a forest containing 30 A-partition trees, even allowing for window overlaps, is negligible. Together with the high mean SRB for this forest, the evidence that the forest contains barrier loci is strong from blind-tree scanning alone.
The evidence in favour of the partition B forest harbouring barrier loci based on blind-tree scanning alone is much weaker. This forest derives from only two overlapping windows, so the argument based on repeated independent recovery of the same partition cannot be used. The forest is recovered because of its high SRB value (> 0.003) and distinctive tree architecture which prevents it from being grouped with lower-SRB trees. Other criteria, such as clines and linkage to trait loci need to be considered in evaluating its candidacy as a barrier locus.
-

-
-
Authors published a paper in #BioRxiv, they used Trim Galore in the study. Including #RRIDs will make this less ambiguous. SciScore made a table with this resource, see “Automated Services” module (download as csv, xml or #jats) #RRID #methodsmatter
-
Genetic factors explaining anthocyanin pigmentation differences doi.org/10.1101/2023... Genomic tree scans identify loci underlying adaptive peaks in Antirrhinum doi.org/10.1101/2025... #Genetics #Plants
-
Genomic tree scans identify loci underlying adaptive peaks in Antirrhinum https://www.biorxiv.org/content/10.1101/2025.02.12.637406v1
-
Genomic tree scans identify loci underlying adaptive peaks in Antirrhinum https://www.biorxiv.org/content/10.1101/2025.02.12.637406v1
-