Epigenetic delineation of the earliest cardiac lineage segregation by single-cell multi-omics
Curation statements for this article:-
Curated by eLife

eLife Assessment
This study provides new single-cell multi-omics datasets that may be useful in the study of early cardiac lineages. However, the authors' conclusions regarding the mutual regulation of key regulators for cardiac specification and new cardiac lineage trajectories are inadequately supported by persuasive analysis and do not align with prior published studies. If revised to address the serious caveats adequately, the findings may be of interest to researchers in the field of cardiac development and congenital heart disease.
This article has been Reviewed by the following groups
Discuss this preprint
Start a discussion What are Sciety discussions?Listed in
- Evaluated articles (eLife)
Abstract
Summary
The mammalian heart is formed from multiple mesoderm-derived cell lineages. However, it remains largely unknown when and how the specification of mesoderm towards cardiac lineages is determined. Here, we systematically depict the transcriptional trajectories toward cardiomyocyte in early mouse embryo, and characterize the epigenetic landscapes underlying the early mesodermal lineage specification by single-cell multi-omics analyses. The analyses also reveal distinct core regulatory networks (CRN) in controlling specification of mesodermal lineages. We further demonstrate the essential role HAND1 and FOXF1 in driving the earliest cardiac progenitors specification. These key transcription factors occupy at distinct enhancers, but function synergistically and hierarchically to regulate the expression of cardiac-specific genes. In addition, HAND1 is required for exiting from the nascent mesoderm program, while FOXF1 is essential for driving cardiac differentiation during juxta-cardiac field (JCF) specification. Our findings establish transcriptional and epigenetic determinants specifying the early cardiac lineage, providing insights for the investigation of congenital heart defects.
Article activity feed
-

-
-

eLife Assessment
This study provides new single-cell multi-omics datasets that may be useful in the study of early cardiac lineages. However, the authors' conclusions regarding the mutual regulation of key regulators for cardiac specification and new cardiac lineage trajectories are inadequately supported by persuasive analysis and do not align with prior published studies. If revised to address the serious caveats adequately, the findings may be of interest to researchers in the field of cardiac development and congenital heart disease.
-
Reviewer #1 (Public review):
Summary:
In this study, the authors identified and described the transcriptional trajectories leading to CMs during early mouse development, and characterized the epigenetic landscapes that underlie early mesodermal lineage specification.
The authors identified two transcriptomic trajectories from a mesodermal population to cardiomyocytes, the MJH and PSH trajectories. These trajectories are relevant to the current model for the First Heart Field (FHF) and the Second Heart Field (SHF) differentiation. Then, the authors characterized both gene expression and enhancer activity of the MJH and PSH trajectories, using a multiomics analysis. They highlighted the role of Gata4, Hand1, Foxf1, and Tead4 in the specification of the MJH trajectory. Finally, they performed a focused analysis of the role of Hand1 and …
Reviewer #1 (Public review):
Summary:
In this study, the authors identified and described the transcriptional trajectories leading to CMs during early mouse development, and characterized the epigenetic landscapes that underlie early mesodermal lineage specification.
The authors identified two transcriptomic trajectories from a mesodermal population to cardiomyocytes, the MJH and PSH trajectories. These trajectories are relevant to the current model for the First Heart Field (FHF) and the Second Heart Field (SHF) differentiation. Then, the authors characterized both gene expression and enhancer activity of the MJH and PSH trajectories, using a multiomics analysis. They highlighted the role of Gata4, Hand1, Foxf1, and Tead4 in the specification of the MJH trajectory. Finally, they performed a focused analysis of the role of Hand1 and Foxf1 in the MJH trajectory, showing their mutual regulation and their requirement for cardiac lineage specification.
Strengths:
The authors performed an extensive transcriptional and epigenetic analysis of early cardiac lineage specification and differentiation which will be of interest to investigators in the field of cardiac development and congenital heart disease. The authors considered the impact of the loss of Hand1 and Foxf1 in-vitro and Hand1 in-vivo.
Weaknesses:
The authors used previously published scRNA-seq data to generate two described transcriptomic trajectories.
(1) Details of the re-analysis step should be added, including a careful characterization of the different clusters and maker genes, more details on the WOT analysis, and details on the time stamp distribution along the different pseudotimes. These details would be important to allow readers to gain confidence that the two major trajectories identified are realistic interpretations of the input data.
The authors have also renamed the cardiac trajectories/lineages, departing from the convention applied in hundreds of papers, making the interpretation of their results challenging.
(2) The concept of "reverse reasoning" applied to the Waddington-OT package for directional mass transfer is not adequately explained. While the authors correctly acknowledged Waddington-OT's ability to model cell transitions from ancestors to descendants (using optimal transport theory), the justification for using a "reverse reasoning" approach is missing. Clarifying the rationale behind this strategy would be beneficial.
(3) As the authors used the EEM cell cluster as a starting point to build the MJH trajectory, it's unclear whether this trajectory truly represents the cardiac differentiation trajectory of the FHF progenitors:
- This strategy infers that the FHF progenitors are mixed in the same cluster as the extra-embryonic mesoderm, but no specific characterization of potential different cell populations included in this cluster was performed to confirm this.- The authors identified the EEM cluster as a Juxta-cardiac field, without showing the expression of the principal marker Mab21l2 per cluster and/or on UMAPs.
- As the FHF progenitors arise earlier than the Juxta-cardiac field cells, it must be possible to identify an early FHF progenitor population (Nkx2-5+; Mab21l2-) using the time stamp. It would be more accurate to use this FHF cluster as a starting point than the EEM cluster to infer the FHF cardiac differentiation trajectory.
These concerns call into question the overall veracity of the trajectory analysis, and in fact, the discrepancies with prior published heart field trajectories are noted but the authors fail to validate their new interpretation. Because their trajectories are followed for the remainder of the paper, many of the interpretations and claims in the paper may be misleading. For example, these trajectories are used subsequently for annotation of the multiomic data, but any errors in the initial trajectories could result in errors in multiomic annotation, etc, etc.
(4) As mentioned in the discussion, the authors identified the MJH and PSH trajectories as non-overlapping. But, the authors did not discuss major previously published data showing that both FHF and SHF arise from a common transcriptomic progenitor state in the primitive streak (DOI: 10.1126/science.aao4174; DOI: 10.1007/s11886-022-01681-w). The authors should consider and discuss the specifics of why they obtained two completely separate trajectories from the beginning, how these observations conflict with prior published work, and what efforts they have made at validation.
(5) Figures 1D and E are confusing, as it's unclear why the authors selected only cells at E7.0. Also, panels 1D 'Trajectory' and 'Pseudotime' suggest that the CM trajectory moves from the PSH cells to the MJH. This result is confusing, and the authors should explain this observation.
(6) Regarding the PSH trajectory, it's unclear how the authors can obtain a full cardiac differentiation trajectory from the SHF progenitors as the SHF-derived cardiomyocytes are just starting to invade the heart tube at E8.5 (DOI: 10.7554/eLife.30668).
The above notes some of the discrepancies between the author's trajectory analysis and the historical cardiac development literature. Overall, the discrepancies between the author's trajectory analysis and the historical cardiac development literature are glossed over and not adequately validated.
(7) The authors mention analyzing "activated/inhibited genes" from Peng et al. 2019 but didn't specify when Peng's data was collected. Is it temporally relevant to the current study? How can "later stage" pathway enrichment be interpreted in the context of early-stage gene expression?
(8) Motif enrichment: cluster-specific DAEs were analyzed for motifs, but the authors list specific TFs rather than TF families, which is all that motif enrichment can provide. The authors should either list TF families or state clearly that the specific TFs they list were not validated beyond motifs.
(9) The core regulatory network is purely predictive. The authors again should refrain from language implying that the TFs in the CRN have any validated role.
Regarding the in vivo analysis of Hand1 CKO embryos, Figures 6 and 7:
(10) How can the authors explain the presence of a heart tube in the E9.5 Hand1 CKO embryos (Figure 6B) if, following the authors' model, the FHF/Juxta-cardiac field trajectory is disrupted by Hand1 CKO? A more detailed analysis of the cardiac phenotype of Hand1 CKO embryos would help to assess this question.
(11) The cell proportion differences observed between Ctrl and Hand1 CKO in Figure 6D need to be replicated and an appropriate statistical analysis must be performed to definitely conclude the impact of Hand1 CKO on cell proportions.
(12) The in-vitro cell differentiations are unlikely to recapitulate the complexity of the heart fields in-vivo, but they are analyzed and interpreted as if they do.
(13) The schematic summary of Figure 7F is confusing and should be adjusted based on the following considerations:
(a) the 'Wild-type' side presents 3 main trajectories (SHF, Early HT and JCF), but uses a 2-color code and the authors described only two trajectories everywhere else in the article (aka MJH and PSH). It's unclear how the SHF trajectory (blue line) can contribute to the Early HT, when the Early HT is supposed to be FHF-associated only (DOI: 10.7554/eLife.30668). As mentioned previously in Major comment 3., this model suggests a distinction between FHF and JCF trajectories, which is not investigated in the article.
(b) the color code suggests that the MJH (FHF-related) trajectory will give rise to the right ventricle and outflow tract (green line), which is contrary to current knowledge.Minor comments:
(1) How genes were selected to generate Figure 1F? Is this a list of top differentially expressed genes over each pseudotime and/or between pseudotimes?
(2) Regarding Figure 1G, it's unclear how inhibited signaling can have an increased expression of underlying genes over pseudotimes. Can the authors give more details about this analysis and results?
(3) How do the authors explain the visible Hand1 expression in Hand1 CKO in Figure S7C 'EEM markers'? Is this an expected expression in terms of RNA which is not converted into proteins?
(4) The authors do not address the potential presence of doublets (merged cells) within their newly generated dataset. While they mention using "SCTransform" for normalization and artifact removal, it's unclear if doublet removal was explicitly performed.
Comments on revised version:
Summary:
The authors have not addressed the major philosophical problems with the initial submission. They interpret their data without care to conform to years of prior publications in the field. This causes the authors to draw fanciful conclusions that are highly likely to be inaccurate (at best).
Q1R1: The authors gave more details about the characterization of cell types and the two identified trajectories.
a) It remains unclear how the authors generated this list. Are they manually selected genes based on relevant literature or an unbiased marker gene identification analysis? Either references should be added, or the bioinformatics explanation should be included in the method section.
b) Revised text satisfies the comment.
c) Revised text satisfies the comment.Other comments:
Figure 1F: left annotation needs to be corrected (two "JCF specific").
Q2R1: Revised text satisfies the comment.
Q3R1 (1): Revised text satisfies the comment.
Q3R1 (2): a) The explanation of how the authors built the JCF trajectory makes sense and the renaming from "MJH" to "JCF" is correct and better represents the identification that was made using time points from E7.5 to E8.5. However, the explanation given does not answer our original question. Our original comment asked about the FHF differentiation trajectory. The authors built the "MJH" trajectory as the combined "FHF/JCF" trajectory, however, it is not directly established whether the FHF and JCF progenitor differentiation trajectories are the same. The authors did not directly try to identify the FHF and JCF trajectories separately using appropriate real time windows but only assumed that they were the same. Every link between JCF and FHF trajectories assuming that they are shared without prior identification of the FHF progenitor differentiation trajectory should be removed from the manuscript (e.g. page 4: "namely the JCF trajectory (the Hand1-expressing early extraembryonic mesoderm - JCF and FHF - CM)").
b) Adding the Mab21l2 ICA plot satisfies the comment.
c) The explanation given by the authors regarding the FHF trajectory analysis is missing important details. The authors started the reverse trajectory analysis from E7.75 cardiomyocytes as being the FHF.
- The authors should be mindful with the distinction between FHF progenitors and FHF-derived cardiomyocytes.
- It is unclear whether cells called after the starting point (E7.75 CMs) in the reverse FHF trajectory, were collected prior E7.75. Can the authors add more details, and a real time point distribution along the FHF pseudotime to their analysis? Also, what cells belong to the FHF trajectory after the E7.75 CMs in the reverse direction? These cells should be shown as in Figure 1A and 1B for the JCF and SHF trajectories.
- As the FHF arises first and differentiates into the cardiac crescent prior to or at the same time the JCF and SHF emerge, it is impossible for late progenitors (JCF and SHF) to contribute to the early FHF progenitor pool. Therefore, the observation that "both JCF and SHF lineages contribute to the early FHF progenitor population" can not be correct. It is also not what Dominguez et al showed. This misinterpretation goes against the current literature (e.g. DOI: 10.1038/ncb3024) and will leads to confusion.Q4R1: Revised text and figure satisfy the comment.
Q5R1: The answer satisfies the comment.
Q6R1: a) The authors did not address the question and did not change their language in the manuscript. As SHF-derived cardiomyocytes are missing (because they are generated after E8.5), the part of the SHF trajectory going from SHF progenitors to the E8.5 heart tube must be inaccurate.
b) The authors correctly mentioned, both JCF and SHF will contribute to the four-chamber heart. However, as the dataset used by the authors spans only to E8.5 (which is days before the completion of the four-chamber heart), and all SHF and the vast majority of JCF contributions don't reach the heart until after E8.5, any claims about trajectories from JCF/SHF progenitor pools to cardiomyocytes should be removed because they do not correspond to prior published and accepted work.
Q7R1: Especially because gene expression levels change over time, the authors might have considered genes as specific and restricted to a pathway based on their expression at a given time (e.g. later time), but at another time (e.g. earlier time), the same genes could have another expression pattern and not be pathway-specific anymore.
Q8R1: Revised text satisfies the comment.
Q9R1: Revised text satisfies the comment.
Q10R1: Thank you for analyzing deeper the cardiac phenotype of the Hand1 cKO embryos.
Regarding the presence of a heart tube, while, following the authors' model the FHF/JCF trajectory is disrupted:
- Renaming the "MSH" to "JCF" is more accurate to the data shown by the authors as mainly the EEM is altered after Hand1 cKO.
- The presence of the heart tube suggests that even if the JCF is altered, the FHF can still produce a cardiac crescent and a heart tube (as observed in Hand1-null embryos DOI: 10.1038/ng0398-266). The schematic Figure 7F suggests that only the SHF contribution will allow the formation of the heart tube. This unorthodox idea would need to be assessed by an alternate approach. More likely is that the model simply ignores the FHF contribution (the most important up to E8.5). The schematic is therefore incomplete and inaccurate and should be removed or edited to correspond to the prior literature.Q11R1: It is unclear what "replicates" mean in the authors' answer, as if they have been pooled without replicate-specific barcodes they are no longer replicates and should be considered as a single sample. This should be explicitly written in the method section.
Thank you for your IF staining/quantification. If DAPI was used, it should be written in the figure caption.Q12R1: Revised text satisfies the comment.
Q13R1: The answer given by the authors did not satisfy the comment because of the following:
- The authors investigated two differentiation trajectories (JCF and SHF) in the article but Figure 7F presents three trajectories (JCF, SHF, and Early HT). The "Early HT" is neither mentioned, nor discussed in the manuscript.
- Figure 7F suggests that the "Early HT" trajectory corresponds to a combination of the SHF and JCF trajectories but does not mention the early FHF trajectory. This is going against the current literature. This relates to the comments of Q10R1.
- As the authors rightly point out, the SHF will be contributing to the heart tube, but through a cell invasion of the already differentiated heart tube (10.1016/j.devcel.2023.01.010). Our prior comments did not question the implication of the SHF to the looping and ballooning process but mentioned that the heart tube arises before the invasion from SHF and is FHF-derived. Figure 7F in the context of Hand1-null suggest that the heart tube will form from the SHF lineage, which is confusing as the SHF is known to contribute by invasion of the (already-formed) FHF-derived heart tube. The FHF lineage is missing from the authors' model.
- In the revised manuscript, the FHF trajectory analysis is still unclear and suggests that the JCF and SHF progenitors contribute to the FHF progenitor which is going against current literature. This relates to the comments of Q3R1 (2).Overall, the schematic Figure 7F is very confusing as it does not follow already published data without being fully validated and therefore is inaccurate and misleading.
Minor comments:
The answers satisfy the minor comments.
-
Reviewer #2 (Public review):
Summary of goals:
The aims of the study were to identify new lineage trajectories for the cardiac lineages of the heart, and to use computational and cell and animal studies to identify and validate new gene regulatory mechanisms involved in these trajectories.
Strengths:
Overall: the study addresses the long standing yet still not fully answered questions of what drives the earliest specification mechanisms of the heart lineages. The introduction demonstrates a good understanding of the relevant lineage trajectories that have been previously established, and the significance of the work is well described. The study takes advantage of several recently published data sets and attempts t use these in combination to uncover any new mechanisms underlying early mesoderm/cardiac specification mechanisms. A …
Reviewer #2 (Public review):
Summary of goals:
The aims of the study were to identify new lineage trajectories for the cardiac lineages of the heart, and to use computational and cell and animal studies to identify and validate new gene regulatory mechanisms involved in these trajectories.
Strengths:
Overall: the study addresses the long standing yet still not fully answered questions of what drives the earliest specification mechanisms of the heart lineages. The introduction demonstrates a good understanding of the relevant lineage trajectories that have been previously established, and the significance of the work is well described. The study takes advantage of several recently published data sets and attempts t use these in combination to uncover any new mechanisms underlying early mesoderm/cardiac specification mechanisms. A strength of the study is the use of an in vitro model system (mESCs) to assess the functional relevance of the key players identified in the computational analysis, including innovative technology such as CRISPR-guided enhancer modulations. Lastly, the study generates mesoderm-specific Hand1 LOF embryos and assesses the differentiation trajectories in these animals, which represents a strong complementary approach to the in vitro and computational analysis earlier in the paper. The manuscript is clearly written and the methods section is detailed and comprehensive.
Comments and Weaknesses:
I unfortunately still have the same concerns I had for the original submission. There are many strong claims about lineage trajectories and population relationships that are based purely on the analysis of a number of datasets, some published and a few new datasets.
The methods used involve significant input bias, and some of the less user-biased approaches, such as the new RNA velocity analysis on the JCF/SHF trajectories, are included only in the response to reviewers but not in the manuscript (R1R2), as far as I can tell. This analysis does not seem to suggest that CMs are generated from both trajectories, but it is difficult to know as they provide so little information on what exactly they did.
The conclusions are particularly concerning not only because they are largely based on computational analysis, but also because they contradict well-described concepts (which are supported by in vivo lineage tracing).
I want to give them credit for having done some additional experiments. That said, the new data added for the validation of some of their concepts (mESC Fig 5F and embryos Fig S8C) do not strengthen their conclusions in my opinion. The mESC data were not quantified, and the embryo data looks like quantifications were done in different planes of a single embryo, but it's hard to tell as little information is provided. Even with accurate quantification, I believe the IF analysis for VIM in Hand1 cKO embryos is not sufficient to back up their claims on the role of Hand1 in driving the JCF lineage. -
Reviewer #3 (Public review):
In this manuscript, the Xie et al. delineate two cardiac lineage trajectories using pseudo-time and epigenetic analyses, tracing development from E6.5 to E8.5, culminating in cardiomyocytes (CMs). The authors propose that mutual regulation between the transcription factors Hand1 and Foxf1 plays a role in specifying a first cardiac lineage.
Following the first round of revision, the authors have renamed their EEM-JCF/FHF (MJH) and PM-SHF (PSH) trajectories JCF and SHF. However, their use of this terminology is confusing. The so-called JCF trajectory appears to represent a mixture of JCF and FHF, as Hand1-expressing early extraembryonic mesoderm contributes to FHF-derived cardiomyocytes (e.g., HCN4+, Tbx5+). The authors then argue that JCF arises from Hand1+ cells and is therefore distinct from FHF, yet …
Reviewer #3 (Public review):
In this manuscript, the Xie et al. delineate two cardiac lineage trajectories using pseudo-time and epigenetic analyses, tracing development from E6.5 to E8.5, culminating in cardiomyocytes (CMs). The authors propose that mutual regulation between the transcription factors Hand1 and Foxf1 plays a role in specifying a first cardiac lineage.
Following the first round of revision, the authors have renamed their EEM-JCF/FHF (MJH) and PM-SHF (PSH) trajectories JCF and SHF. However, their use of this terminology is confusing. The so-called JCF trajectory appears to represent a mixture of JCF and FHF, as Hand1-expressing early extraembryonic mesoderm contributes to FHF-derived cardiomyocytes (e.g., HCN4+, Tbx5+). The authors then argue that JCF arises from Hand1+ cells and is therefore distinct from FHF, yet elsewhere suggest that both JCF and SHF contribute to FHF. This introduces conceptual inconsistencies.
Furthermore, the expression of Hand1, Foxf1, and Bmp4 in the lateral plate mesoderm complicates the assertion that JCF is distinct from FHF (Development 2015; 142: 3307-3320; Nat Rev Mol Cell Biol, https://www.nature.com/articles/nrm2618; Circ Res 2021, https://doi.org/10.1161/CIRCRESAHA.121.318943). Mab21l2 expression also overlaps with the cardiac crescent. The designation of Tbx20 as a "key JCF-specific gene" is problematic, why should it not equally be considered an FHF-specific marker (https://pmc.ncbi.nlm.nih.gov/articles/PMC10629681)? Perhaps the JCF trajectory represent a subset of FHF. A designation such as "JCF/FHF" may therefore be more appropriate.
In Figure 1A, the decision to define a single CM state as the endpoint of both trajectories is also problematic. FHF and SHF are known to give rise to distinct CM subtypes, yet in the authors' reconstruction both lineages converge on one CM population. This was the point raised in Question 1 of my initial review. If both trajectories converge on the same CM state, are they truly independent lineages? This interpretation remains unclear and potentially misleading.
-
Author response:
The following is the authors’ response to the original reviews
Reviewer #1 (Public Review):
Summary:
In this study, the authors identified and described the transcriptional trajectories leading to CMs during early mouse development, and characterized the epigenetic landscapes that underlie early mesodermal lineage specification.
The authors identified two transcriptomic trajectories from a mesodermal population to cardiomyocytes, the MJH and PSH trajectories. These trajectories are relevant to the current model for the First Heart Field (FHF) and the Second Heart Field (SHF) differentiation. Then, the authors characterized both gene expression and enhancer activity of the MJH and PSH trajectories, using a multiomics analysis. They highlighted the role of Gata4, Hand1, Foxf1, and Tead4 in the specification of the MJH …
Author response:
The following is the authors’ response to the original reviews
Reviewer #1 (Public Review):
Summary:
In this study, the authors identified and described the transcriptional trajectories leading to CMs during early mouse development, and characterized the epigenetic landscapes that underlie early mesodermal lineage specification.
The authors identified two transcriptomic trajectories from a mesodermal population to cardiomyocytes, the MJH and PSH trajectories. These trajectories are relevant to the current model for the First Heart Field (FHF) and the Second Heart Field (SHF) differentiation. Then, the authors characterized both gene expression and enhancer activity of the MJH and PSH trajectories, using a multiomics analysis. They highlighted the role of Gata4, Hand1, Foxf1, and Tead4 in the specification of the MJH trajectory. Finally, they performed a focused analysis of the role of Hand1 and Foxf1 in the MJH trajectory, showing their mutual regulation and their requirement for cardiac lineage specification.
Strengths:
The authors performed an extensive transcriptional and epigenetic analysis of early cardiac lineage specification and differentiation which will be of interest to investigators in the field of cardiac development and congenital heart disease. The authors considered the impact of the loss of Hand1 and Foxf1 in-vitro and Hand1 in-vivo.
Weaknesses:
The authors used previously published scRNA-seq data to generate two described transcriptomic trajectories.
We agree that a two-route cardiac development model has been described, which is consistent with our analyses. However, the developmental origins and key events by early lineage specification is unclear. Our study provided new insights from the following aspects:
a) Computational analyses inferred the earliest cardiac fate segregation by E6.75-7.0.
b) Provided the new-generated E7.0 multi-omics data which revealed the transcriptomic and chromatin accessibility landscape.
c) Utilized multi-omics and ChIP-seq data to construct a core regulatory network underlying the JCF lineage specification.
d) Applied in vitro and in vivo analyses, which elucidated the synergistic and different roles of key transcription factors, HAND1 and FOXF1.
Q1R1: Details of the re-analysis step should be added, including a careful characterization of the different clusters and maker genes, more details on the WOT analysis, and details on the time stamp distribution along the different pseudotimes. These details would be important to allow readers to gain confidence that the two major trajectories identified are realistic interpretations of the input data.
R1R1: Thank you for the valuable suggestion. In the last version, we characterized the two major trajectories by identifying their common or specific gene sets, and by profiling the expression dynamics along pseudotime (Figure 1F). But we realized a careful description was not provided. In the revised manuscript, we have made the following improvements:
a) Provided marker gene analyses based on cell types as well as developmental lineages to support the E7.0 progenitor clusters (Figure S1F).
b) For Figure 1F: revised the text and introduced characteristic genes for the two trajectories.
c) For WOT analysis: provided more details in the first paragraph of the ‘Results’ section.
R2R1: The authors have also renamed the cardiac trajectories/lineages, departing from the convention applied in hundreds of papers, making the interpretation of their results challenging.
R2R1: Agreed. We have changed the MJH as JCF lineage and PSH as SHF lineage.
Q3R1: The concept of "reverse reasoning" applied to the Waddington-OT package for directional mass transfer is not adequately explained. While the authors correctly acknowledged Waddington-OT's ability to model cell transitions from ancestors to descendants (using optimal transport theory), the justification for using a "reverse reasoning" approach is missing. Clarifying the rationale behind this strategy would be beneficial.
R3R1: Thank you for pointing out the unclear explanation. As mentioned in R1R1, we have clarified the rationale in the revised manuscript.
We would like to provide some additional details: WOT is designed for time-series scRNA-seq data where the time/stage each single cell is given. At any adjacent time points ti and ti+1, WOT estimates the transition probability of all cells at ti to all cells at ti+1. One can select a cell set of interest at any time point ti to infer their ancestors at ti-1 or their descendants at ti+1 by sums of the transition probabilities. As introduced in the original paper, WOT allows for both ‘forward’ and ‘reverse’ inference (DOI: 10.1016/j.cell.2019.01.006).
Q3R1: As the authors used the EEM cell cluster as a starting point to build the MJH trajectory, it's unclear whether this trajectory truly represents the cardiac differentiation trajectory of the FHF progenitors:
- This strategy infers that the FHF progenitors are mixed in the same cluster as the extra-embryonic mesoderm, but no specific characterization of potential different cell populations included in this cluster was performed to confirm this.
To build the MJH trajectory, we performed a two-step analysis:
(1) Firstly, we used E8.5 CM cells as a starting point to perform WOT computational reverse lineage tracing and identify CM progenitors at each time point.
(2) Secondly, we selected EEM cells from the E7.5 CM progenitor pool, as a starting point to perform WOT analysis. Cells along this trajectory consist of the JCF lineage (Figure 1B).
The reason why we chose to use this subset of E7.5 EEM cells was due to its purity. It is distinct from the SHF lineage as suggested by their separation in the UMAP. It is also different from FHF cells as no FHF/CM markers were detected by E7.5.
It is admitted that it is infeasible to achieve 100% purity in this single cell omics analysis, but we believe the current strategy of defining the JCF lineage is reasonable. The distinct gene expression dynamics (Figure 1F) and spatial mapping results (Figure 1C), between JCF and SHF lineages, also supported our conclusion.
- The authors identified the EEM cluster as a Juxta-cardiac field, without showing the expression of the principal marker Mab21l2 per cluster and/or on UMAPs.
Thank you for your suggestion. We have added Mab21l2 expression plots in the ICA layout (new Figure S1D), showing its transient expression dynamics, consistent with Tyser et al (DOI: 10.1126/science.abb2986).
- As the FHF progenitors arise earlier than the Juxta-cardiac field cells, it must be possible to identify an early FHF progenitor population (Nkx2-5+; Mab21l2-) using the time stamp. It would be more accurate to use this FHF cluster as a starting point than the EEM cluster to infer the FHF cardiac differentiation trajectory.
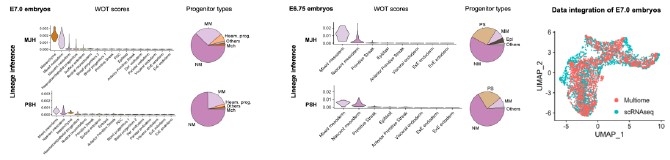
We appreciate your insights. We used the early FHF progenitor population (E7.75 Nkx2-5+; Mab21l2- CM cells) as the starting point and identified its progenitor cells by E7.0 (Figure S2A). Results suggest both JCF and SHF lineages contribute to the early FHF progenitor population, consistent with live imaging-based single cell tracing by Dominguez et al (DOI: 10.1016/j.cell.2023.01.001).
These concerns call into question the overall veracity of the trajectory analysis, and in fact, the discrepancies with prior published heart field trajectories are noted but the authors fail to validate their new interpretation. Because their trajectories are followed for the remainder of the paper, many of the interpretations and claims in the paper may be misleading. For example, these trajectories are used subsequently for annotation of the multiomic data, but any errors in the initial trajectories could result in errors in multiomic annotation, etc, etc.
Thank you for your valuable comments. In the revised manuscript, we have added details about the trajectory analysis including the procedure of WOT lineage inference, marker gene expression and early FHF lineage tracing. We also renamed the two trajectories to avoid confusion with prior published heart field trajectories. Generally, our trajectories are consistent with the published evidence about two major lineages contributing to the linear heart tube:
a) Clonal analysis: two trajectories exist which demonstrate differential contribution to the E8.5 cardiac tube (Meilhac et al, DOI: 10.1016/s1534-5807(04)00133-9).
b) Live imaging: JCF cells contribute to the forming heart (Tyser et al, DOI: 10.1126/science.abb2986; Dominguez et al, DOI: 10.1016/j.cell.2023.01.001).
c) Genetic labelling based lineage tracing: early Hand1+ mesodermal cells differentiate and contribute to the cardiac crescent (Zhang et al, DOI: 10.1161/CIRCRESAHA.121.318943).
Molecular events by the initial segregation of the two lineages were not characterized before, which are the main focus of our paper. Our analyses suggest that the JCF lineage segregates earlier from the nascent/mixed mesoderm status, also consistent with the clonal analysis (Meilhac et al, DOI: 10.1016/s1534-5807(04)00133-9).
Q4R1: As mentioned in the discussion, the authors identified the MJH and PSH trajectories as nonoverlapping. But, the authors did not discuss major previously published data showing that both FHF and SHF arise from a common transcriptomic progenitor state in the primitive streak (DOI: 10.1126/science.aao4174; DOI: 10.1007/s11886-022-01681-w). The authors should consider and discuss the specifics of why they obtained two completely separate trajectories from the beginning, how these observations conflict with prior published work, and what efforts they have made at validation.
R4R1: Thank you for the important question. For trajectory analysis, we assigned cells to the trajectory with higher fate probability, resulting in ‘non-overlapping’ cell sets. However, the statement of ‘two non-overlapping trajectories’ is inaccurate. We performed analysis of fate divergence between two trajectories (which was not shown in the first version), which suggests, before E7.0, mesodermal cells have similar probabilities to choose either trajectory (Figure S1E). We agree with you and previously published data that the JCF and SHF arise from a common progenitor pool. Correction has been made in the revised manuscript.
Q5R1: Figures 1D and E are confusing, as it's unclear why the authors selected only cells at E7.0. Also, panels 1D 'Trajectory' and 'Pseudotime' suggest that the CM trajectory moves from the PSH cells to the MJH. This result is confusing, and the authors should explain this observation.
R5R1: Thank you for pointing out the confusion. As mentioned in R4R1, trajectory analysis indicates JCFSHF fate segregation by E7.0 and we used Figures 1D and E to characterize the cellular status. By E7.0, JCF progenitors are at EEM or MM status, while SHF progenitors are still at the earlier differentiation stage (NM). This result is consistent with previous clonal analysis (Meilhac et al, DOI: 10.1016/s1534-5807(04)00133-9) which demonstrates an apparent earlier segregation of the first lineage. Our interpretation of the pseudotime analysis is that it represents different levels of differentiation, instead of developmental direction.
Q6R1: Regarding the PSH trajectory, it's unclear how the authors can obtain a full cardiac differentiation trajectory from the SHF progenitors as the SHF-derived cardiomyocytes are just starting to invade the heart tube at E8.5 (DOI: 10.7554/eLife.30668).
R6R1.1: We agree with your opinion. Our trajectory analysis covers E8.5 SHF-derived CM cells and progenitors. Cells that differentiate as CM cells after E8.5 were missed.
The above notes some of the discrepancies between the author's trajectory analysis and the historical cardiac development literature. Overall, the discrepancies between the author's trajectory analysis and the historical cardiac development literature are glossed over and not adequately validated.
R6R1.2: Historical cardiac development related literature provided evidence, using multiple techniques, which support the existence of two cardiac lineages with common progenitors at the beginning and overlapping contribution of the four-chamber heart. Our trajectory analysis is in agreement with this model and provides more detailed molecular insights about lineage segregation by E7.0. Thank you for pointing out our mistakes describing the observations. We have corrected the text and provided additional data (Figure S1D-F and S2), aiming to resolved the confusions.
Q7R1: The authors mention analyzing "activated/inhibited genes" from Peng et al. 2019 but didn't specify when Peng's data was collected. Is it temporally relevant to the current study? How can "later stage" pathway enrichment be interpreted in the context of early-stage gene expression?
R7R1: The gene sets of "activated/inhibited genes" were collected from several published perturbation datasets (Gene Expression Omnibus accession numbers GSE48092, GSE41260, GSE17879, GSE69669, GSE15268 and GSE31544) using mouse ES cells or embryos. For a specific pathway, the gene set is fixed but the gene expression levels, which change over time, reflect the pathway enrichment. This explains the differential pathway enrichment between early and late stages.
Q8R1: Motif enrichment: cluster-specific DAEs were analyzed for motifs, but the authors list specific TFs rather than TF families, which is all that motif enrichment can provide. The authors should either list TF families or state clearly that the specific TFs they list were not validated beyond motifs.
R8R1: Thank you for your comment. For the DAE motif analysis, we firstly inferred the motif and TF families, then tested which specific TFs are expressed in the corresponding cell cluster. We have added this information in the legend of Figure 2D.
Q9R1: The core regulatory network is purely predictive. The authors again should refrain from language implying that the TFs in the CRN have any validated role.
R9R1: Thank you for your kind suggestion. We have revised the manuscript to avoid any misleading implications, as follows:
“Through single-cell multi-omics analysis, a predicted core regulatory network (CRN) in JCF is identified, consisting of transcription factors (TFs) GATA4, TEAD4, HAND1 and FOXF1.”
Q10R1: Regarding the in vivo analysis of Hand1 CKO embryos, Figures 6 and 7:
How can the authors explain the presence of a heart tube in the E9.5 Hand1 CKO embryos (Figure 6B) if, following the authors' model, the FHF/Juxta-cardiac field trajectory is disrupted by Hand1 CKO? A more detailed analysis of the cardiac phenotype of Hand1 CKO embryos would help to assess this question.
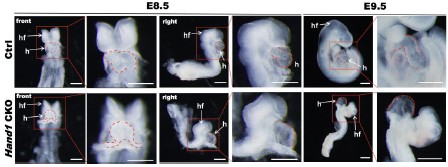
R10R1: Thank you for your valuable suggestion. In the revised manuscript, we have added detailed analysis of the cardiac phenotype of Hand1 CKO embryo (Figure S8C). Data suggest that by E8.5 when heart looping initiate in control group (14/17), the hearts of Hand1 CKO embryos (3/3) still demonstrate a linear tube morphology. By E9.5 when atrium and ventricle become distinct in WT embryos, heart looping of Hand1 CKO embryos is abnormal. The cardiac defects of our MESP1CRE driven Hand1 conditional KO are consistent with those of Hand1-null mutant mice (Doi: 10.1038/ng0398-266; D oi: 10.1038/ng0398-271).
Author response image 1.
The bright field images of E8.5-E9.5 Ctrl and Hand1 CKO mouse embryos. The arrows indicating the embryonic heart (h) and head folds (hf). Scale bars (E8.5): 200 μm; scale bars (E9.5): 500 μm.
Q11R1: The cell proportion differences observed between Ctrl and Hand1 CKO in Figure 6D need to be replicated and an appropriate statistical analysis must be performed to definitely conclude the impact of Hand1 CKO on cell proportions.
R11R1: We appreciate your valuable suggestion. As Figure 6D is based on scRNA-seq experiment, where replicates were merged as one single sequencing library, statistical analysis is infeasible. To address potential concerns about cell proportions, we added IF staining experiments of EEM marker gene, Vim, in serial embryo sections (Figure S8D). Statistical analysis indicates a significant decrease of VIM+ EEM cell proportion of Hand1 CKO embryos.
Q12R1: The in-vitro cell differentiations are unlikely to recapitulate the complexity of the heart fields invivo, but they are analyzed and interpreted as if they do.
R12R1: We agree with your opinion. In the revised manuscript, we tuned down the interpretation of the invitro cell differentiation data.
Previous version:
I. “The analysis indicated that HAND1 and FOXF1 could dually regulate MJH specification through directly activating the MJH specific genes and inhibiting the PSH specific genes.”
II. “Together, our data indicated that mutual regulation between HAND1 and FOXF1 could play a key role in MJH cardiac progenitor specification.”
III. “Thus, our data further supported the specific and synergistic roles of HAND1 and FOXF1 in MJH cardiac progenitor specification.”
Revised version:
I. “The analysis indicated that HAND1 and FOXF1 were able to directly activate the JCF specific genes.”
II. “Together, our in vitro experimental data indicated that mutual regulation between HAND1 and FOXF1 could play a key role in activation of JCF specific genes.”
III. “These results suggest that HAND1 and FOXF1 may cooperatively regulate early cardiac lineage specification by promoting JCF-associated gene expression and suppressing alternative mesodermal programs.”
Q13R1: The schematic summary of Figure 7F is confusing and should be adjusted based on the following considerations:
(a) the 'Wild-type' side presents 3 main trajectories (SHF, Early HT and JCF), but uses a 2-color code and the authors described only two trajectories everywhere else in the article (aka MJH and PSH). It's unclear how the SHF trajectory (blue line) can contribute to the Early HT, when the Early HT is supposed to be FHF-associated only (DOI: 10.7554/eLife.30668). As mentioned previously in Major comment 3., this model suggests a distinction between FHF and JCF trajectories, which is not investigated in the article.
R13R1(a): Thank you for your great insights. The paper you mentioned used _Nkx2.5_cre/+; Rosa26tdtomato+/- and _Nkx2.5_eGFP embryos to reconstruct the cardiac morphologies between E7.5 and E8.2. Their 3D models clearly demonstrate the transition from yolk sac to FHF and then SHF (Figure 2A’ and A’’). The location of yolk sac is defined as JCF in later literature (DOI: 10.1126/science.abb2986). However, as Nkx2.5 mainly marks cells after the entry of the heart tube, it is unable to reflect the lineage contribution by JCF or SHF. As in R3R1, more and more evidence support the contribution of both lineages to the Early HT, which is discussed in a recent review paper (DOI: 0.1016/j.devcel.2023.01.010).
(b) the color code suggests that the MJH (FHF-related) trajectory will give rise to the right ventricle and outflow tract (green line), which is contrary to current knowledge.
R13R1(b): Thank you for pointing out the confusion. The coloring of outflow tract is not an indication of JCF lineage contribution. We have changed the color of JCF/SHF trajectory in the revised model.
Minor comments:
Q14R1: How genes were selected to generate Figure 1F? Is this a list of top differentially expressed genes over each pseudotime and/or between pseudotimes?
R14R1: For each trajectory, we ranked genes by the correlation between expression levels and pseudotime.
Top 1000 genes for each group were selected.
Q15R1: Regarding Figure 1G, it's unclear how inhibited signaling can have an increased expression of underlying genes over pseudotimes. Can the authors give more details about this analysis and results?
R15R1: The increased expression of ‘inhibited genes’ could be explained as an indication of decreasing signaling levels or compensation effect by other signaling pathways. We appreciate your kind suggestion. Details about this analysis have been added in the Method section.
Q16R1: How do the authors explain the visible Hand1 expression in Hand1 CKO in Figure S7C 'EEM markers'? Is this an expected expression in terms of RNA which is not converted into proteins?
R16R1: Our opinion is that the visible Hand1 expression caused by the imperfect knock-out efficiency by Mesp1-Cre driven system.
Q17R1: The authors do not address the potential presence of doublets (merged cells) within their newly generated dataset. While they mention using "SCTransform" for normalization and artifact removal, it's unclear if doublet removal was explicitly performed.
R17R1: We appreciate your kind reminder. Doublet removal was performed using R package ‘DoubletFinder’ (DOI: 10.1016/j.cels.2019.03.003). We have added this information in the revised manuscript.
Reviewer #2 (Public review):
Summary of goals:
The aims of the study were to identify new lineage trajectories for the cardiac lineages of the heart, and to use computational and cell and animal studies to identify and validate new gene regulatory mechanisms involved in these trajectories.
Strengths:
The study addresses the long-standing yet still not fully answered questions of what drives the earliest specification mechanisms of the heart lineages. The introduction demonstrates a good understanding of the relevant lineage trajectories that have been previously established, and the significance of the work is well described. The study takes advantage of several recently published data sets and attempts to use these in combination to uncover any new mechanisms underlying early mesoderm/cardiac specification mechanisms. A strength of the study is the use of an in vitro model system (mESCs) to assess the functional relevance of the key players identified in the computational analysis, including innovative technology such as CRISPR-guided enhancer modulations. Lastly, the study generates mesoderm-specific Hand1 LOF embryos and assesses the differentiation trajectories in these animals, which represents a strong complementary approach to the in vitro and computational analysis earlier in the paper. The manuscript is clearly written and the methods section is detailed and comprehensive.
Comments and Weaknesses:
Overall: The computational analysis presented here integrates a large number of published data sets with one new data point (E7.0 single cell ATAC and RNA sequencing). This represents an elegant approach to identifying new information using available data. However, the data presentation at times becomes rather confusing, and relatively strong statements and conclusions are made based on trajectory analysis or other inferred mechanisms while jumping from one data set to another. The cell and in vivo work on Hand1 and Foxf1 is an important part of the study. Some additional experiments in both of these model systems could strongly support the novel aspects that were identified by the computational studies leading into the work.
We appreciate your positive comments and insightful suggestions. In the revised manuscript, we have incorporated additional analyses and experimental validations to address the concerns raised. Specifically, we added RNA velocity analysis to independently support the identification of the MJH and PSH trajectories, performed immunofluorescence staining of mesodermal and cardiac markers in Hand1 and Foxf1 knockout models, and included Vim staining-based quantification in Hand1 CKO embryos to assess developmental outcomes in vivo. Furthermore, we revised potentially overinterpreted conclusions, clarified methodological details of WOT analysis. These revisions have strengthened both the rigor and clarity of the manuscript.
Q1R2: Definition of MJH and PSH trajectory:
The study uses previously published data sets to identify two main new differentiation trajectories: the MJH and the PSH trajectory (Figure 1). A large majority of subsequent conclusions are based on in-depth analysis of these two trajectories. For this reason, the method used to identify these trajectories (WTO, which seems a highly biased analysis with many manually chosen set points) should be supported by other commonly used methods such as for example RNA velocity analysis. This would inspire some additional confidence that the MJH and PSH trajectories were chosen as unbiased and rigorous as possible and that any follow-up analysis is biologically relevant.
R1R2: We appreciate your valuable comments. It is totally agreed that other commonly used methods help strengthen our conclusion about the two main trajectories. To this end, we performed RNA velocity analysis for the cardiac specification. Results support the contribution to CM along the MJH and PSH routes.
Author response image 2.
UMAP layout is colored by cell types. Developmental directions, shown as arrows, are inferred by RNA-velocity analysis.
Actually, several recent studies indicated a convergence cardiac developing model where progenitors reach a myocardial state along two trajectories (DOI: 10.1016/j.devcel.2023.01.010). However, when and how specification between the two routes were unclear. Our data and analysis revealed a clear fate separation by E7.0 from transcriptomic and epigenetic perspectives, where unbiased RNA velocity analysis was performed (Figure 2C).
We would like to clarify how we performed WOT (DOI: 10.1016/j.cell.2019.01.006) analysis: the only manually chosen cell set was the starting set, which was all cardiomyocyte cells by E8.5, of computational reverse lineage tracing. The ancestor cells were predicted in an unbiased manner among all mesodermal cells.
Q2R2.1: Identification of MJH and PSH trajectory progenitors:
The study defines various mesoderm populations from the published data set (Figure 1A-E), including nascent mesoderm, mixed mesoderm, and extraembryonic mesoderm. It further assigns these mesoderm populations to the newly identified MJH/PSH trajectories. Based on the trajectory definition in Figure 1A it appears that both trajectories include all 3 mesoderm populations, albeit at different proportions and it seems thus challenging to assign these as unique progenitor populations for a distinct trajectory, as is done in the epigenetic study by comparing clusters 8 (MJH) and 2 (PSH)(Figure 2).
R2R2.1: According to our model, the most significant difference between the two trajectories is their enrichment of EEM and PM cell types (Figure 1B), which represent the middle stages of cardiac development. Both trajectories begin as Mesp1+ Nascent mesoderm cells (Figure 1F), which is supported by Mesp1 lineage tracing (DOI: 10.1161/CIRCRESAHA.121.318943), and ends as cardiomyocytes. Our epigenetic analysis focused on the E7.0 stage when the two trajectories could be clearly separated and when JCF and SHF lineages were at mixed mesoderm and nascent mesoderm states, respectively. However, SHF lineage was predicted to bypass mixed mesoderm state later on.
Q2R2.2: Along similar lines, the epigenetic analysis of clusters 2 and 8 did not reveal any distinct differences in H3K4m1, H3K27ac, or H3K4me3 at any of the time points analyzed (Figure 2F). While conceptually very interesting, the data presented do not seem to identify any distinct temporal patterns or differences in clones 2 and 8 (Figure 2H), and thus don't support the conclusion as stated: "the combined transcriptome and chromatin accessibility analysis further supported the early lineage segregation of MJH and the epigenetic priming at gastrulation stage for early cardiac genes".
R2R2.2: In the epigenetic analysis, we delineated the temporal dynamics of E7.0 cluster-specific DAEs by selecting earlier (E6.5) and later (E7.5) time points. DAEs of C8 and C2 represent regulatory elements for the JCF and SHF lineages, respectively. We also included C1 DAEs as a reference to demonstrate the relative activity of C8 and C2. The overall temporal pattern suggests activation of C8 & C2, as their H3K4me1 and H3K27ac levels surpass C1 over time. Between C8 and C2, the following distinctions could be observed:
a) H3K4me1 levels of C8 are higher by E6.5 and E7.0, with low H3K27ac levels, indicating early priming of C8 DAEs.
b) By E7.5, H3K4me1 levels of C8 are caught up by C2 in E7.5 anterior mesoderm (E7.5_AM, Figure 2F column 3), where cardiac mesoderm is located.
c) H3K4me1 and H3K27ac levels of C8 are similar as C1 in the posterior mesoderm (E7.5_P, Figure 2F column 4) and much higher than C2.
d) From the perspective of chromatin accessibility, hundreds of characteristic DAEs were identified for C2 and C8 (Figure 2D), exemplified by the primed and active enhancers which were predicted to interact with cluster-specific genes (Figure 2H).
Together with the transcriptomic analyses (Figure 2C), these data are consistent with our conclusion about early lineage segregation and epigenetic priming.
Q3R2: Function of Hand1 and Foxf1 during early cardiac differentiation:
The study incorporated some functional studies by generating Hand1 and Foxf1 KO mESCs and differentiated them into mesoderm cells for RNA sequencing. These lines would present relevant tools to assess the role of Hand1 and Foxf1 in mesoderm formation, and a number of experiments would further support the conclusions, which are made for the most part on transcriptional analysis. For example, the study would benefit from quantification of mesoderm cells and subsequent cardiomyocytes during differentiation (via IF, or more quantitatively, via flow cytometry analysis). These data would help interpret any of the findings in the bulk RNAseq data, and help to assess the function of Hand1 and Foxf1 in generating the cardiac lineages. Conclusions such as "the analysis indicated that HAND1 and FOXF1 could dually regulate MJH specification through directly activating the MJH specific genes and inhibiting PSH specific genes" seem rather strong given the data currently provided.
R3R2: Thank you for your kind suggestions. We added IF staining of mesodermal (Zic3), JCF (Hand1) and cardiac markers (Tnnt2), followed by cell quantification. Results indicate that Hand1 and Foxf1 knockout leads to reduced commitment to the JCF lineage, evidenced by the loss of Hand1 expression, accumulation of undifferentiated Zic3+ mesoderm, and impaired cardiomyocyte formation (Tnnt2+), consistent with the up-regulation of JCF lineage specific genes and the downregulation of SHF lineage specific genes.
We also revised the conclusion as “These results suggest that HAND1 and FOXF1 may cooperatively regulate early cardiac lineage specification by promoting JCF-associated gene expression and suppressing alternative mesodermal programs.”.
(4) Analysis of Hand1 cKO embryos:
Adding a mouse model to support the computational analysis is a strong way to conclude the study. Given the availability of these early embryos, some of the findings could be strengthened by performing a similar analysis to Figure 7B&C and by including some of the specific EEM markers found to be differentially regulated to complement the structural analysis of the embryos.
R4R2: hank you for your positive comments and help. In the revised manuscript, we performed IF staining of EEM marker Vim in a similar fashion as Figure 7B&C (Figure S8D). In comparison with control embryos, the Hand1 CKO embryos demonstrated significant less number of Vim+ cells, further strengthening the conclusion that Hand1 CKO blocked the developmental progression toward JCF direction.
Q5R2: Current findings in the context of previous findings:
The introduction carefully introduces the concept of lineage specification and different progenitor pools. Given the enormous amount of knowledge already available on Hand1 and Foxf1, and their role in specific lineages of the early heart, some of this information should be added, ideally to the discussion where it can be put into context of what the present findings add to the existing understanding of these transcription factors and their role in early cardiac specification.
R5R2: We appreciate your positive comments and kind reminder. We have added discussion about how our study could be put into the body of findings on Hand1 and Foxf1. Although these two genes have been validated to be functionally important for heart development, it is unclear when and how they affect this process. Using in-vivo and in-vitro models and single cell multi-omics analyses, we provided evidence to fill the gaps from multiple aspects, including cell state temporal dynamics, regulatory network, and epigenetic regulation underlying the very early cardiac lineage specification.
Reviewer #3 (Public review):
Q1R3: In Figure 1A, could the authors justify using E8.5 CMs as the endpoint for the second lineage and better clarify the chamber identities of the E8.5 CMs analysed? Why are the atrial genes in Figure 1C of the PSH trajectory not present in Table S1.1, which lists pseudotime-dependent genes for the MJH/PSH trajectories from Figure 1F?
R1R3: Thank you for your comments. We used E8.5 CMs as the endpoint of the second (SHF) lineage because this stage represents a critical point where SHF-derived cardiomyocytes have begun distinct differentiation, allowing us to capture terminal lineage states reliably. The chamber identities of E8.5 CMs were determined based on known marker genes (DOI: 10.1186/s13059-025-03633-3). The atrial genes shown in Figure 1C reflect cluster-specific markers that may not meet the strict pseudotime-dependency criteria used to generate Table S1.1, which lists genes dynamically changing along the MJH/PSH trajectories.
Q2R3: Could the authors increase the resolution of their trajectory and genomic analyses to distinguish between the FHF (Tbx5+ HCN4+) and the JCF (Mab21l2+/ Hand1+) within the MJH lineage? Also, clarify if the early extraembryonic mesoderm contributes to the FHF.
R2R3: Thank you for your great suggestions. To distinguish between the FHF and JCF trajectories, we used early FHF progenitor population (E7.75 Nkx2-5+; Mab21l2- CM cells) as the starting point and performed WOT lineage inference (Figure S2A). Results suggest that both JCF and SHF progenitors contribute to the FHF, consistent with live imaging-based single cell tracing by Dominguez et al (DOI: 10.1016/j.cell.2023.01.001) and lineage tracing results by Zhang et al (DOI: 10.1161/CIRCRESAHA.121.318943). We also analyzed the expression levels of FHF marker genes (Tbx5, Hcn4) and observed their activation along both trajectories (Figure S2B).
Q3R3: The authors strongly assume that the juxta-cardiac field (JCF), defined by Mab21l2 expression at E7.5 in the extraembryonic mesoderm, contributes to CMs. Could the authors explain the evidence for this? Could the authors identify Mab21l2 expression in the left ventricle (LV) myocardium and septum transversum at E8.5 (see Saito et al., 2013, Biol Open, 2(8): 779-788)? If such a JCF contribution to CMs exists, the extent to which it influences heart development should be clarified or discussed.
R3R3: Thank you for the important question. For the JCF contribution to the heart tube, several lines of evidence have been published in recent years using micro-dissection of mouse embryonic heart (DOI: 10.1126/science.abb2986), live imaging (DOI: 10.1016/j.cell.2023.01.001) and lineage tracing approaches (DOI: 10.1161/CIRCRESAHA.121.318943). According to Tyser et al (DOI: 10.1126/science.abb2986), Mab21l2 expression is detected in septum transversum at E8.5 and the Mab21l2+ lineage contribute to LV, basically consistent with the literature you mentioned (Saito et al., 2013, Biol Open, 2(8): 779-788). Our lineage inference analyses further support the model and suggest earlier specification by JCF. However, the focus of our work is the transcriptional and epigenetic regulation of underlying the JCF developmental trajectory.
Q4R3: Could the authors distinguish the Hand1+ pericardium from JCF progenitors in their single-cell data and explain why they excluded other cell types, such as the endocardium/endothelium and pericardium, or even the endoderm, as endpoints of their trajectory analysis? At the NM and MM mesoderm stages, how did the authors distinguish the earliest cardiac cells from the surrounding developing mesoderm?
R4R3: We appreciate your insightful question. In our other study (DOI: 10.1186/s13059-025-03633-3), we tried to further divide the CM cells as subclusters and it seems that their difference is mainly driven by the segmentation of the heart tube (e.g. LV, RV, OFT etc.). By the E8.5 stage, we are unable to identify the Hand1+ pericardium cluster.
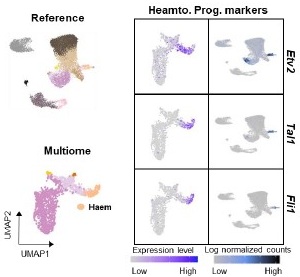
Also, it seems infeasible to distinguish endocardium from other endothelium cells only using singlecell data. High resolution spatial transcriptome data is required. Alternatively, we analyzed the E7.0 mesodermal lineages and determined C5/6 as hematoendothelial progenitors. Marker gene analysis indicate that their lineage segregation has started by this stage (Figure S4C and Author response image 3).
Author response image 3.
UMAP layout, using scRNA-seq (Reference data) and snRNA-seq (Multiome data), is colored by cell types (left). Expression of hematoendothelial progenitor marker genes is shown (right).
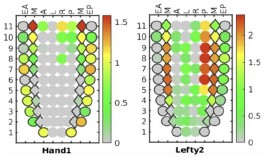
We did observe the difference between the earliest cardiac cells from the surrounding developing mesoderm. As in Figure 1D, cells belonging to the JCF lineage (Hand1 high/Lefty2 low) were clustered at the EEM/MM end, in contrast to the NM cells.
Q5R3: Could the authors contrast their trajectory analysis with those of Lescroart et al. (2018), Zhang et al., Tyser et al., and Krup et al.?
R5R3: Thank you for the valuable suggestion. We compared our model with the suggested ones and summarized as follows:
(1) Lescroart et al: The JCF and SHF progenitor cells match their DCT2 (Bmp4+) and DCT3 (Foxc2+) clusters, respectively.
(2) Zhang et al: The JCF lineage matches their EEM-DC (developing CM)-CM trajectory. The SHF lineage is consistent with their NM-LPM (lateral plate mesoderm)-DC (developing CM)-CM trajectory. Notably, their EEM-DC-CM also expressed FHF marker (Tbx5) at later stages.
(3) Tyser et al: we performed data integration analysis and found the correspondence between JCF progenitors (EEM cells from the cardiac trajectory) and their Me5, as well as SHF progenitors (PM cells from the cardiac trajectory) with Me7. In their model, both Me5 and Me7 contribute to Me4 (representing the FHF), consistent with our results (see Tyser et al., 2021 and Pijuan-Sala et al., 2019).
(4) Krup et al also performed URD lineage inference, providing a model with CM (12) and Cardiac mesoderm (29) as cardiac end points. Their model did not seem to suggest distinct trajectories between JCF and SHF lineages, as both JCF (Hand1) and SHF (Isl1) markers co-expressed in CM.
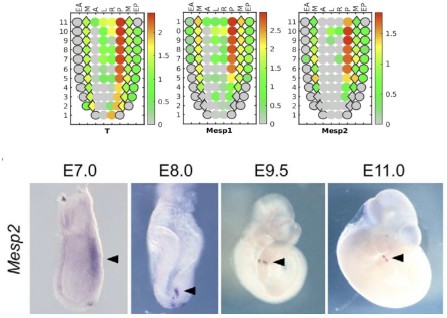
Q6R3: Previous studies suggest that Mesp2 expression starts at E8 in the presomitic mesoderm (Saga et al., 1997). Could the authors provide in situ hybridization or HCR staining to confirm the early E7 Mesp2 expression suggested by the pseudo-time analysis of the second lineage.
R6R3: We validated the expression of E7 Mesp2 using Geo-seq spatial transcriptome data (Author response image 4, upper). Results suggest the high spatial enrichment of Mesp2 expression in primitive streak (T+) and/or nascent mesoderm (Mesp1+) cells, which correspond to the progenitors of the second lineage.
In situ hybridization data (PMID: 17360776) also supports the early expression of Mesp2 by E7 (Author response image 4, lower).
Author response image 4.
(Upper) E7 Geo-seq data for selected genes: T, Mesp1, and Mesp2. (Lower) Mesp2 expression during early development; image acquired from Morimoto et al. (PMID: 17360776).
Q7R3: Could the authors also confirm the complementary Hand1 and Lefty2 expression patterns at E7 using HCR or in situ hybridization? Hand1 expression in the first lineage is plausible, considering lineage tracing results from Zhang et al.
R7R3: Thank you for your great suggestion. We observed spatially complementary expression patterns of Hand1 and Lefty2 in the Geo-seq spatial transcriptomic data. In the mesoderm layer, Hand1 is highly expressed in the proximal end. While Lefty2+ cells exhibit preference toward the distal direction.
Author response image 5.
E7 Geo-seq data for selected genes: Hand1 and Lefty2.
Q8R3: Could the authors explain why Hand1 and Lefty2+ cells are more likely to be multipotent progenitors, as mentioned in the text?
R8R3: Thank you for your question. Here, we observed E7.0 Mesp1+ and Lefty2+ nascent mesodermal cells assigned to both the JCF and SHF lineages (Figure 1D), indicating their multipotency. On the other hand, we also found low expressions of JCF markers, Hand1 and Msx2, by the early stage of the SHF trajectory (Figure 1F). Thus, we concluded that both Hand1+ and Lefty2+ E7.0 mesodermal cells are likely to be multipotent.
Q9R3: Could the authors comment on the low Mesp1 expression in the mesodermal cells (MM) of the MJH trajectory at E7 (Figure 1D)? Is Mesp1 transiently expressed early in MJH progenitors and then turned off by E7? Have all FHF/JCF/SHF cells expressed Mesp1?
R9R3: Thank you for the insightful questions. Zhang et al. (PMID: 34162224) performed scRNA-seq analysis of Mesp1 lineage-traced cells, which indicate the contribution of Mesp1+ cells to FHF, JCF, and SHF. This is also supported by Dominguez et al. utilizing live imaging approaches (PMID: 36736300). Our temporal dynamics analysis suggests that along the JCF trajectory, Mesp1 is turned off as JCF characteristic genes were up regulated (Figure 1F and S1D).
Q10R3: Could the authors clarify if their analysis at E7 comprises a mixture of embryonic stages or a precisely defined embryonic stage for both the trajectory and epigenetic analyses? How do the authors know that cells of the second lineage are readily present in the E7 mesoderm they analysed (clusters 0, 1, and 2 for the multiomic analysis)?
R10R3: Thank you for your questions. Although embryos were collected at E7.0, the developmental stages could be variable. As exemplified by Karl Theiler’s book, “The House Mouse: Atlas of Embryonic Development”, mesoderm was visible for some E7.0 egg cylinders but not in others. To test whether cells of the second lineage are present in the E7.0 mesoderm, we analyzed the WOT lineage tracing results and the cell type composition by E7.0 (Author response image 6, left panel). Most cells belong to the nascent mesoderm (NM) or mixed mesoderm (MM), while almost no cells were assigned to the primitive streak (PS). To avoid the possibility that the E7.0 embryos represented later stages, we also analyzed the E6.75 cells of the second lineage (Author response image 6, middle panel). Results suggest that NM cells were still the dominant contributors to the second lineage, although ~22.6% cells were assigned to the PS. The abovementioned analyses were performed using the scRNA-seq data. The embryos of the E7.0 single-cell multi-omics represent similar developmental stages as the scRNAseq data, as suggested by the well-aligned UMAPs (Figure S1D, right panel). Thus, we conclude that for the multi-omics data, the cells of the second lineage are also readily present in the mesoderm.
Author response image 6.
(Left and middle) Lineage inference and cell type composition at E7.0 and E6.75. (Right) UMAPs of E7.0 multi-omics and scRNA-seq data.
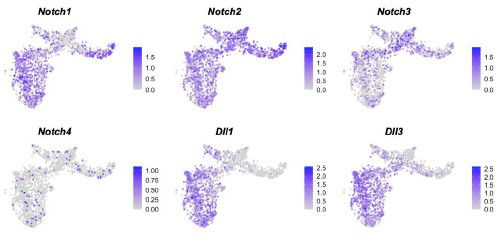
Q11R3: Could the authors further comment on the active Notch signaling observed in the first and second lineages, considering that Notch's role in the early steps of endocardial lineage commitment, but not of CMs, during gastrulation has been previously described by Lescroart et al. (2018)?
R11R3: We appreciate your kind suggestion. As reported by Lescroart et al. (2018), using Notch1CreERT2/Rosa-tdTomato mice and tamoxifen administration at E6.5, early expression of Notch1 mostly marked endocardial cells (ECs, 76.9-83.9%), with minor contribution to the cardiomyocytes (6.0-16.6%) and to the epicardial cells (EPs, 6.0-6.5%). The lineage specificity of Notch1 is consistent with our E7.0 multi-omics data, where its expression was mainly observed in the NM and hematoendothelial progenitors (Author response image 7). Interestingly, expression of other NOTCH receptor genes (Notch2 and Notch3) and ligand genes (Dll1 and Dll3) in the CM lineages. Notch3 demonstrate higher expression in the first lineage, while Dll1 and Dll3 were highly expressed in the second lineage. The study by Lescroart et al. (2018) emphasized the role of Notch1 as an EC lineage marker, while our analyses aimed at the activity of the NOTCH pathway.
Author response image 7.
Expression of representative NOTCH genes at E7.0 (multi-omics data).
Q12R3: In cluster 8, Figure 2D, it seems that levels of accessibility in cluster 8 are relatively high for genes associated with endothelium/endocardium development in addition to MJH genes. Could the authors comment and/or provide further analysis?
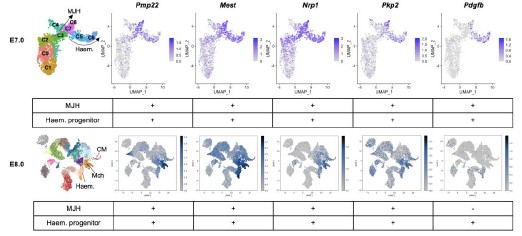
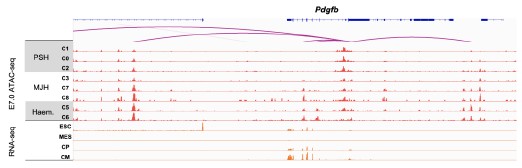
R12R3: Thanks for you for raising this interesting point. To confirm the association of these genes with endothelium (EC) and/or MJH, we analyzed their expression levels by E7.0 (progenitor stage) and E8.0 (differentiated stage) (Author response image 8). Among target genes of MJH-specific DAEs (cluster 3/7/8 in Figure 2D), Pmp22, Mest, Npr1, Pkp2, and Pdgfb were expressed in the hematoendothelial progenitors. The Nrp1 gene and PDGF pathway play critical roles in endothelial development by modulating cell migration (PMID: 15920019 and 28167492), which is also important for MJH cells. In addition, we observed common ATAC-seq peaks in both hematoendothelial and MJH clusters (Author response image 9), indicating shared regulatory elements. Interestingly, Pdgfb is not expressed by CM in vivo, it is actively expressed in the CM of the in vitro system (Author response image 9). These results indicate regulatory and functional closeness between hematoendothelial and MJH cell groups, at early stages of lineage establishment.
Author response image 8.
Regulatory connection between MJH and endothelial cells (ECs).
Author response image 9.
Representative genome browser snapshots of scATAC-seq (aggregated gene expression and chromatin accessibility for each cluster) and RNA-seq at the Pdgfb locus.
Q13R3: Can the authors clarify why they state that cluster 8 DAEs are primed before the full activation of their target genes, considering that Bmp4 and Hand1 peak activities seem to coincide with their gene expression in Figure 2G?
R13R3: Thanks for your great question. The overall analyses indicate low to medium levels of H3K4me1 and H3K27ac by E6.5-7.0 at cluster 8 DAEs, which were fully activated by E7.5 (Figure 2F). Further inspections suggest different epigenetic status of individual DAEs (Figure 3H), which could be active (K4me1+/K27ac+), primed (K4me1+/K27ac-), or inactive (K4me1-/K27ac-). Thus, we concluded that many DAEs could be primed before full activation. The coincidence of enhancer peak activities and gene expression was observed by aggregating single cell clusters at a single stage E7.0, which does not rule out the possibility that these enhancers are epigenetically primed at earlier stages.
Q14R3: Did the authors extend the multiomic analysis to Nanog+ epiblast cells at E7 and investigate if cardiac/mesodermal priming exists before mesodermal induction (defined by T/Mesp1 onset of expression)?
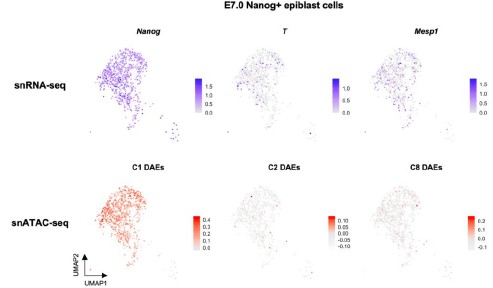
R14R3: We appreciate your kind suggestion. We observed low levels of T/Mesp1 expression in the E7.0 Nanog+ epiblast cells (Author response image 10). Interestingly, the T+/Mesp1+ cells were not clustered toward any specific differentiation directions in the UMAP. We also analyzed DAE activities in each single cell by averaging over the C1/C2/C8 DAE sets. The C2 and C8 DAEs were clearly less active than the C1 DAEs. But C2/C8-DAE active cells were observed among the E7.0 Nanog+ epiblast cells. These data indicate the early priming exists in epiblast cells before the commitment to cardiac/mesodermal differentiation.
Author response image 10.
Gene expression and DAE activity levels of E7.0 Nanog+ epiblast cells shown in UMAP layout.
Q15R3: In the absence of duplicates, it is impossible to statistically compare the proportions of mesodermal cell populations in Hand1 wild-type and knockout (KO) embryos or to assess for abnormal accumulation of PS, NM, and MM cells. Could the authors analyse the proportions of cells by careful imaging of Hand1 wild-type and KO embryos instead?
R15R3: Thank you for your important question. To assess the proportions of mesodermal cell populations in E7.25 wild-type and Hand1-CKO embryos, we analyzed the serial coronal sections of the extraembryonic portions and performed staining of the Vim gene, which marks the extra-embryonic mesodermal (EEM) cells (Figure S8D). We then counted the numbers of mesodermal/Vim+ EEM cells and calculated the relative proportion of Vim+ EEM cells in each section. The proportion of Vim+ EEM cells was statistically lower in the Hand1-CKO embryo, consistent with our model that Hand1 deletion led to blocked MJH specification.
Q16R3: Could the authors provide high-resolution images for Figure 7 B-C-D as they are currently hard to interpret?
R16R3: Thank you for your suggestion. We have replaced Figure 7B-C-D with high-resolution images.
Recommendations for the authors:
Reviewing Editor Comments:
Discussions among reviewers emphasize the importance of better addressing and validating the trajectory analysis by using more common and alternative bioinformatics and spatial approaches. Further discussion on whether there is a common transcriptional progenitor between the two trajectories is also required to enhance the significance of the study. For functional analysis, further validations are needed as the current data only partially support the claims. Please see public reviews for details.
Reviewer #2 (Recommendations For The Authors):
Beyond the suggestions made in the public review, below are some minor aspects for consideration:
The manuscript is well written overall but may benefit from a thorough read-through and editing of some minor grammatical errors.
We have carefully read through the manuscript and corrected minor grammatical errors to improve clarity and readability.
Figure 2C: RNA velocity information gets largely lost due to the color choice of EEM and MM (black) on which the direction of arrows can't be appreciated.
We have updated the color scheme in Figure 2C.
Figure 6D: sample information is partially cut off in the graph.
Sample information is completely shown now.
The last paragraph of the discussion has some formatting issues with the references.
We have corrected the formatting issues with the references.
The methods and results section does not comment on if, or how many embryos were pooled for the sequencing analysis performed for this study.
We have added the numbers of embryos for sequencing analyses in the methods section.
Reviewer #3 (Recommendations For The Authors):
Minor:
In the discussion, authors could reconsider the sentence: "The process of cardiac lineage segregation is a complex one that may involve TF regulatory networks and signaling pathways," as it is not informative.
We have re-written the sentence as: “Thus, additional regulation must exist and instructs the process of JCF-SHF lineage segregation.”
-
-
eLife assessment
This study combines extensive published and new datasets to provide a useful single-cell multi-omics analysis of early cardiac lineage segregation, highlighting the mutual regulation of key regulators for cardiac specification. While the data presentation is robust, the computational methods for delineating cardiac lineage trajectories and the functional analyses are incomplete and require further clarification and additional experiments. If validated, these findings will be of significant interest to researchers in the fields of cardiac development and congenital heart disease.
-
Reviewer #1 (Public Review):
Summary:
In this study, the authors identified and described the transcriptional trajectories leading to CMs during early mouse development, and characterized the epigenetic landscapes that underlie early mesodermal lineage specification.
The authors identified two transcriptomic trajectories from a mesodermal population to cardiomyocytes, the MJH and PSH trajectories. These trajectories are relevant to the current model for the First Heart Field (FHF) and the Second Heart Field (SHF) differentiation. Then, the authors characterized both gene expression and enhancer activity of the MJH and PSH trajectories, using a multiomics analysis. They highlighted the role of Gata4, Hand1, Foxf1, and Tead4 in the specification of the MJH trajectory. Finally, they performed a focused analysis of the role of Hand1 and …
Reviewer #1 (Public Review):
Summary:
In this study, the authors identified and described the transcriptional trajectories leading to CMs during early mouse development, and characterized the epigenetic landscapes that underlie early mesodermal lineage specification.
The authors identified two transcriptomic trajectories from a mesodermal population to cardiomyocytes, the MJH and PSH trajectories. These trajectories are relevant to the current model for the First Heart Field (FHF) and the Second Heart Field (SHF) differentiation. Then, the authors characterized both gene expression and enhancer activity of the MJH and PSH trajectories, using a multiomics analysis. They highlighted the role of Gata4, Hand1, Foxf1, and Tead4 in the specification of the MJH trajectory. Finally, they performed a focused analysis of the role of Hand1 and Foxf1 in the MJH trajectory, showing their mutual regulation and their requirement for cardiac lineage specification.
Strengths:
The authors performed an extensive transcriptional and epigenetic analysis of early cardiac lineage specification and differentiation which will be of interest to investigators in the field of cardiac development and congenital heart disease. The authors considered the impact of the loss of Hand1 and Foxf1 in-vitro and Hand1 in-vivo.
Weaknesses:
The authors used previously published scRNA-seq data to generate two described transcriptomic trajectories.
(1) Details of the re-analysis step should be added, including a careful characterization of the different clusters and maker genes, more details on the WOT analysis, and details on the time stamp distribution along the different pseudotimes. These details would be important to allow readers to gain confidence that the two major trajectories identified are realistic interpretations of the input data.
The authors have also renamed the cardiac trajectories/lineages, departing from the convention applied in hundreds of papers, making the interpretation of their results challenging.
(2) The concept of "reverse reasoning" applied to the Waddington-OT package for directional mass transfer is not adequately explained. While the authors correctly acknowledged Waddington-OT's ability to model cell transitions from ancestors to descendants (using optimal transport theory), the justification for using a "reverse reasoning" approach is missing. Clarifying the rationale behind this strategy would be beneficial.
(3) As the authors used the EEM cell cluster as a starting point to build the MJH trajectory, it's unclear whether this trajectory truly represents the cardiac differentiation trajectory of the FHF progenitors:
- This strategy infers that the FHF progenitors are mixed in the same cluster as the extra-embryonic mesoderm, but no specific characterization of potential different cell populations included in this cluster was performed to confirm this.- The authors identified the EEM cluster as a Juxta-cardiac field, without showing the expression of the principal marker Mab21l2 per cluster and/or on UMAPs.
- As the FHF progenitors arise earlier than the Juxta-cardiac field cells, it must be possible to identify an early FHF progenitor population (Nkx2-5+; Mab21l2-) using the time stamp. It would be more accurate to use this FHF cluster as a starting point than the EEM cluster to infer the FHF cardiac differentiation trajectory.
These concerns call into question the overall veracity of the trajectory analysis, and in fact, the discrepancies with prior published heart field trajectories are noted but the authors fail to validate their new interpretation. Because their trajectories are followed for the remainder of the paper, many of the interpretations and claims in the paper may be misleading. For example, these trajectories are used subsequently for annotation of the multiomic data, but any errors in the initial trajectories could result in errors in multiomic annotation, etc, etc.
(4) As mentioned in the discussion, the authors identified the MJH and PSH trajectories as non-overlapping. But, the authors did not discuss major previously published data showing that both FHF and SHF arise from a common transcriptomic progenitor state in the primitive streak (DOI: 10.1126/science.aao4174; DOI: 10.1007/s11886-022-01681-w). The authors should consider and discuss the specifics of why they obtained two completely separate trajectories from the beginning, how these observations conflict with prior published work, and what efforts they have made at validation.
(5) Figures 1D and E are confusing, as it's unclear why the authors selected only cells at E7.0. Also, panels 1D 'Trajectory' and 'Pseudotime' suggest that the CM trajectory moves from the PSH cells to the MJH. This result is confusing, and the authors should explain this observation.
(6) Regarding the PSH trajectory, it's unclear how the authors can obtain a full cardiac differentiation trajectory from the SHF progenitors as the SHF-derived cardiomyocytes are just starting to invade the heart tube at E8.5 (DOI: 10.7554/eLife.30668).
The above notes some of the discrepancies between the author's trajectory analysis and the historical cardiac development literature. Overall, the discrepancies between the author's trajectory analysis and the historical cardiac development literature are glossed over and not adequately validated.
(7) The authors mention analyzing "activated/inhibited genes" from Peng et al. 2019 but didn't specify when Peng's data was collected. Is it temporally relevant to the current study? How can "later stage" pathway enrichment be interpreted in the context of early-stage gene expression?
(8) Motif enrichment: cluster-specific DAEs were analyzed for motifs, but the authors list specific TFs rather than TF families, which is all that motif enrichment can provide. The authors should either list TF families or state clearly that the specific TFs they list were not validated beyond motifs.
(9) The core regulatory network is purely predictive. The authors again should refrain from language implying that the TFs in the CRN have any validated role.
Regarding the in vivo analysis of Hand1 CKO embryos, Figures 6 and 7:
(10) How can the authors explain the presence of a heart tube in the E9.5 Hand1 CKO embryos (Figure 6B) if, following the authors' model, the FHF/Juxta-cardiac field trajectory is disrupted by Hand1 CKO? A more detailed analysis of the cardiac phenotype of Hand1 CKO embryos would help to assess this question.
(11) The cell proportion differences observed between Ctrl and Hand1 CKO in Figure 6D need to be replicated and an appropriate statistical analysis must be performed to definitely conclude the impact of Hand1 CKO on cell proportions.
(12) The in-vitro cell differentiations are unlikely to recapitulate the complexity of the heart fields in-vivo, but they are analyzed and interpreted as if they do.
(13) The schematic summary of Figure 7F is confusing and should be adjusted based on the following considerations:
(a) the 'Wild-type' side presents 3 main trajectories (SHF, Early HT and JCF), but uses a 2-color code and the authors described only two trajectories everywhere else in the article (aka MJH and PSH). It's unclear how the SHF trajectory (blue line) can contribute to the Early HT, when the Early HT is supposed to be FHF-associated only (DOI: 10.7554/eLife.30668). As mentioned previously in Major comment 3., this model suggests a distinction between FHF and JCF trajectories, which is not investigated in the article.
(b) the color code suggests that the MJH (FHF-related) trajectory will give rise to the right ventricle and outflow tract (green line), which is contrary to current knowledge.Minor comments:
(1) How genes were selected to generate Figure 1F? Is this a list of top differentially expressed genes over each pseudotime and/or between pseudotimes?
(2) Regarding Figure 1G, it's unclear how inhibited signaling can have an increased expression of underlying genes over pseudotimes. Can the authors give more details about this analysis and results?
(3) How do the authors explain the visible Hand1 expression in Hand1 CKO in Figure S7C 'EEM markers'? Is this an expected expression in terms of RNA which is not converted into proteins?
(4) The authors do not address the potential presence of doublets (merged cells) within their newly generated dataset. While they mention using "SCTransform" for normalization and artifact removal, it's unclear if doublet removal was explicitly performed.
-
Reviewer #2 (Public Review):
Summary of goals:
The aims of the study were to identify new lineage trajectories for the cardiac lineages of the heart, and to use computational and cell and animal studies to identify and validate new gene regulatory mechanisms involved in these trajectories.
Strengths:
The study addresses the long-standing yet still not fully answered questions of what drives the earliest specification mechanisms of the heart lineages. The introduction demonstrates a good understanding of the relevant lineage trajectories that have been previously established, and the significance of the work is well described. The study takes advantage of several recently published data sets and attempts t use these in combination to uncover any new mechanisms underlying early mesoderm/cardiac specification mechanisms. A strength of the …
Reviewer #2 (Public Review):
Summary of goals:
The aims of the study were to identify new lineage trajectories for the cardiac lineages of the heart, and to use computational and cell and animal studies to identify and validate new gene regulatory mechanisms involved in these trajectories.
Strengths:
The study addresses the long-standing yet still not fully answered questions of what drives the earliest specification mechanisms of the heart lineages. The introduction demonstrates a good understanding of the relevant lineage trajectories that have been previously established, and the significance of the work is well described. The study takes advantage of several recently published data sets and attempts t use these in combination to uncover any new mechanisms underlying early mesoderm/cardiac specification mechanisms. A strength of the study is the use of an in vitro model system (mESCs) to assess the functional relevance of the key players identified in the computational analysis, including innovative technology such as CRISPR-guided enhancer modulations. Lastly, the study generates mesoderm-specific Hand1 LOF embryos and assesses the differentiation trajectories in these animals, which represents a strong complementary approach to the in vitro and computational analysis earlier in the paper. The manuscript is clearly written and the methods section is detailed and comprehensive.
Comments and Weaknesses:
Overall: The computational analysis presented here integrates a large number of published data sets with one new data point (E7.0 single cell ATAC and RNA sequencing). This represents an elegant approach to identifying new information using available data. However, the data presentation at times becomes rather confusing, and relatively strong statements and conclusions are made based on trajectory analysis or other inferred mechanisms while jumping from one data set to another. The cell and in vivo work on Hand1 and Foxf1 is an important part of the study. Some additional experiments in both of these model systems could strongly support the novel aspects that were identified by the computational studies leading into the work.
(1) Definition of MJH and PSH trajectory:
The study uses previously published data sets to identify two main new differentiation trajectories: the MJH and the PSH trajectory (Figure 1). A large majority of subsequent conclusions are based on in-depth analysis of these two trajectories. For this reason, the method used to identify these trajectories (WTO, which seems a highly biased analysis with many manually chosen set points) should be supported by other commonly used methods such as for example RNA velocity analysis. This would inspire some additional confidence that the MJH and PSH trajectories were chosen as unbiased and rigorous as possible and that any follow-up analysis is biologically relevant.(2) Identification of MJH and PSH trajectory progenitors:
The study defines various mesoderm populations from the published data set (Figure 1A-E), including nascent mesoderm, mixed mesoderm, and extraembryonic mesoderm. It further assigns these mesoderm populations to the newly identified MJH/PSH trajectories. Based on the trajectory definition in Figure 1A it appears that both trajectories include all 3 mesoderm populations, albeit at different proportions and it seems thus challenging to assign these as unique progenitor populations for a distinct trajectory, as is done in the epigenetic study by comparing clusters 8 (MJH) and s (PSH)(Figure 2). Along similar lines, the epigenetic analysis of clusters 2 and 8 did not reveal any distinct differences in H3K4m1, H3K27ac, or H3K4me3 at any of the time points analyzed (Figure 2F). While conceptually very interesting, the data presented do not seem to identify any distinct temporal patterns or differences in clones 2 and 8 (Figure 2H), and thus don't support the conclusion as stated: "the combined transcriptome and chromatin accessibility analysis further supported the early lineage segregation of MJH and the epigenetic priming at gastrulation stage for early cardiac genes".(3) Function of Hand1 and Foxf1 during early cardiac differentiation:
The study incorporated some functional studies by generating Hand1 and Foxf1 KO mESCs and differentiated them into mesoderm cells for RNA sequencing. These lines would present relevant tools to assess the role of Hand1 and Foxf1 in mesoderm formation, and a number of experiments would further support the conclusions, which are made for the most part on transcriptional analysis. For example, the study would benefit from quantification of mesoderm cells and subsequent cardiomyocytes during differentiation (via IF, or more quantitatively, via flow cytometry analysis). These data would help interpret any of the findings in the bulk RNAseq data, and help to assess the function of Hand1 and Foxf1 in generating the cardiac lineages. Conclusions such as "the analysis indicated that HAND1 and FOXF1 could dually regulate MJH specification through directly activating the MJH specific genes and inhibiting PSH specific genes" seem rather strong given the data currently provided.(4) Analysis of Hand1 cKO embryos:
Adding a mouse model to support the computational analysis is a strong way to conclude the study. Given the availability of these early embryos, some of the findings could be strengthened by performing a similar analysis to Figure 7B&C and by including some of the specific EEM markers found to be differentially regulated to complement the structural analysis of the embryos.(5) Current findings in the context of previous findings:
The introduction carefully introduces the concept of lineage specification and different progenitor pools. Given the enormous amount of knowledge already available on Hand1 and Foxf1, and their role in specific lineages of the early heart, some of this information should be added, ideally to the discussion where it can be put into context of what the present findings add to the existing understanding of these transcription factors and their role in early cardiac specification. -
Reviewer #3 (Public Review):
(1) In Figure 1A, could the authors justify using E8.5 CMs as the endpoint for the second lineage and better clarify the chamber identities of the E8.5 CMs analysed? Why are the atrial genes in Figure 1C of the PSH trajectory not present in Table S1.1, which lists pseudotime-dependent genes for the MJH/PSH trajectories from Figure 1F?
(2) Could the authors increase the resolution of their trajectory and genomic analyses to distinguish between the FHF (Tbx5+ HCN4+) and the JCF (Mab21l2+/ Hand1+) within the MJH lineage? Also, clarify if the early extraembryonic mesoderm contributes to the FHF.
(3) The authors strongly assume that the juxta-cardiac field (JCF), defined by Mab21l2 expression at E7.5 in the extraembryonic mesoderm, contributes to CMs. Could the authors explain the evidence for this? Could the …
Reviewer #3 (Public Review):
(1) In Figure 1A, could the authors justify using E8.5 CMs as the endpoint for the second lineage and better clarify the chamber identities of the E8.5 CMs analysed? Why are the atrial genes in Figure 1C of the PSH trajectory not present in Table S1.1, which lists pseudotime-dependent genes for the MJH/PSH trajectories from Figure 1F?
(2) Could the authors increase the resolution of their trajectory and genomic analyses to distinguish between the FHF (Tbx5+ HCN4+) and the JCF (Mab21l2+/ Hand1+) within the MJH lineage? Also, clarify if the early extraembryonic mesoderm contributes to the FHF.
(3) The authors strongly assume that the juxta-cardiac field (JCF), defined by Mab21l2 expression at E7.5 in the extraembryonic mesoderm, contributes to CMs. Could the authors explain the evidence for this? Could the authors identify Mab21l2 expression in the left ventricle (LV) myocardium and septum transversum at E8.5 (see Saito et al., 2013, Biol Open, 2(8): 779-788)? If such a JCF contribution to CMs exists, the extent to which it influences heart development should be clarified or discussed.
(4) Could the authors distinguish the Hand1+ pericardium from JCF progenitors in their single-cell data and explain why they excluded other cell types, such as the endocardium/endothelium and pericardium, or even the endoderm, as endpoints of their trajectory analysis? At the NM and MM mesoderm stages, how did the authors distinguish the earliest cardiac cells from the surrounding developing mesoderm?
(5) Could the authors contrast their trajectory analysis with those of Lescroart et al. (2018), Zhang et al., Tyser et al., and Krup et al.?
(6) Previous studies suggest that Mesp2 expression starts at E8 in the presomitic mesoderm (Saga et al., 1997). Could the authors provide in situ hybridization or HCR staining to confirm the early E7 Mesp2 expression suggested by the pseudo-time analysis of the second lineage.
(7) Could the authors also confirm the complementary Hand1 and Lefty2 expression patterns at E7 using HCR or in situ hybridization? Hand1 expression in the first lineage is plausible, considering lineage tracing results from Zhang et al.
(8) Could the authors explain why Hand1 and Lefty2+ cells are more likely to be multipotent progenitors, as mentioned in the text?
(9) Could the authors comment on the low Mesp1 expression in the mesodermal cells (MM) of the MJH trajectory at E7 (Figure 1D)? Is Mesp1 transiently expressed early in MJH progenitors and then turned off by E7? Have all FHF/JCF/SHF cells expressed Mesp1?
(10) Could the authors clarify if their analysis at E7 comprises a mixture of embryonic stages or a precisely defined embryonic stage for both the trajectory and epigenetic analyses? How do the authors know that cells of the second lineage are readily present in the E7 mesoderm they analysed (clusters 0, 1, and 2 for the multiomic analysis)?
(11) Could the authors further comment on the active Notch signaling observed in the first and second lineages, considering that Notch's role in the early steps of endocardial lineage commitment, but not of CMs, during gastrulation has been previously described by Lescroart et al. (2018)?
(12) In cluster 8, Figure 2D, it seems that levels of accessibility in cluster 8 are relatively high for genes associated with endothelium/endocardium development in addition to MJH genes. Could the authors comment and/or provide further analysis?
(13) Can the authors clarify why they state that cluster 8 DAEs are primed before the full activation of their target genes, considering that Bmp4 and Hand1 peak activities seem to coincide with their gene expression in Figure 2G?
(14) Did the authors extend the multiomic analysis to Nanog+ epiblast cells at E7 and investigate if cardiac/mesodermal priming exists before mesodermal induction (defined by T/Mesp1 onset of expression)?
(15) In the absence of duplicates, it is impossible to statistically compare the proportions of mesodermal cell populations in Hand1 wild-type and knockout (KO) embryos or to assess for abnormal accumulation of PS, NM, and MM cells. Could the authors analyse the proportions of cells by careful imaging of Hand1 wild-type and KO embryos instead?
(16) Could the authors provide high-resolution images for Figure 7 B-C-D as they are currently hard to interpret?
-
