Accurate prediction of CDR-H3 loop structures of antibodies with deep learning
Curation statements for this article:-
Curated by eLife

eLife assessment
This paper presents H3-OPT, a deep learning method that effectively combines existing techniques for the prediction of antibody structure. This work, supported by convincing experiments for validation, is important because the method can aid in the design of antibodies, which are key tools in many research and industrial applications.
This article has been Reviewed by the following groups
Discuss this preprint
Start a discussion What are Sciety discussions?Listed in
- Evaluated articles (eLife)
Abstract
Accurate prediction of the structurally diverse complementarity determining region heavy chain 3 (CDR-H3) loop structure remains a primary and long-standing challenge for antibody modeling. Here, we present the H3-OPT toolkit for predicting the 3D structures of monoclonal antibodies and nanobodies. H3-OPT combines the strengths of AlphaFold2 with a pre-trained protein language model and provides a 2.24 Å average RMSD Cα between predicted and experimentally determined CDR-H3 loops, thus outperforming other current computational methods in our non-redundant high-quality dataset. The model was validated by experimentally solving three structures of anti-VEGF nanobodies predicted by H3-OPT. We examined the potential applications of H3-OPT through analyzing antibody surface properties and antibody–antigen interactions. This structural prediction tool can be used to optimize antibody–antigen binding and engineer therapeutic antibodies with biophysical properties for specialized drug administration route.
Article activity feed
-

-
-

Author response:
The following is the authors’ response to the previous reviews.
Reviewer #2 (Public Review):
Weaknesses:
The comparison of affinity predictions derived from AlphaFold2 and H3-opt models, based on molecular dynamics simulations, should have been discussed in depth. In some cases, there are huge differences between the estimations from H3-opt models and those from experimental structures. It seems that the authors obtained average differences of the real delta, instead of average differences of the absolute value of the delta. This can be misleading, because high negative differences might be compensated by high positive differences when computing the mean value. Moreover, it would have been good for the authors to disclose the trajectories from the MD simulations.
Thanks for your careful checks. We fully understand …
Author response:
The following is the authors’ response to the previous reviews.
Reviewer #2 (Public Review):
Weaknesses:
The comparison of affinity predictions derived from AlphaFold2 and H3-opt models, based on molecular dynamics simulations, should have been discussed in depth. In some cases, there are huge differences between the estimations from H3-opt models and those from experimental structures. It seems that the authors obtained average differences of the real delta, instead of average differences of the absolute value of the delta. This can be misleading, because high negative differences might be compensated by high positive differences when computing the mean value. Moreover, it would have been good for the authors to disclose the trajectories from the MD simulations.
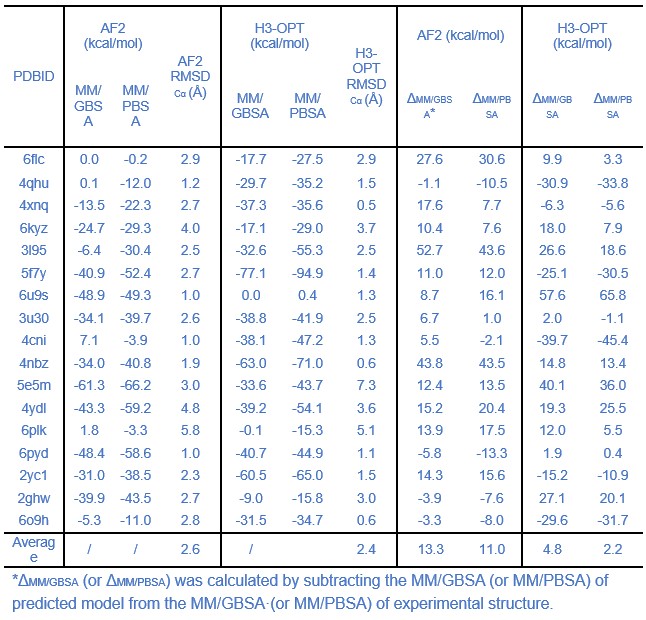
Thanks for your careful checks. We fully understand your concerns about the large differences when calculating affinity. To understand the source of these huge differences, we carefully analyzed the trajectories of the input structures during MD simulations. We found that the antigen-antibody complex shifted as it transited from NVT to NPT during pre-equilibrium, even when restraints are used to determine the protein structure. To address this issue, we consulted the solution provided on Amber's mailing list (http://archive.ambermd.org/202102/0298.html) and modified the top file ATOMS_MOLECULE item of the simulation system to merge the antigen-antibody complexes into one molecule. As a result, the number of SOLVENT_POINTERS was also adjusted. Finally, we performed all MD simulations and calculated affinities of all complexes.
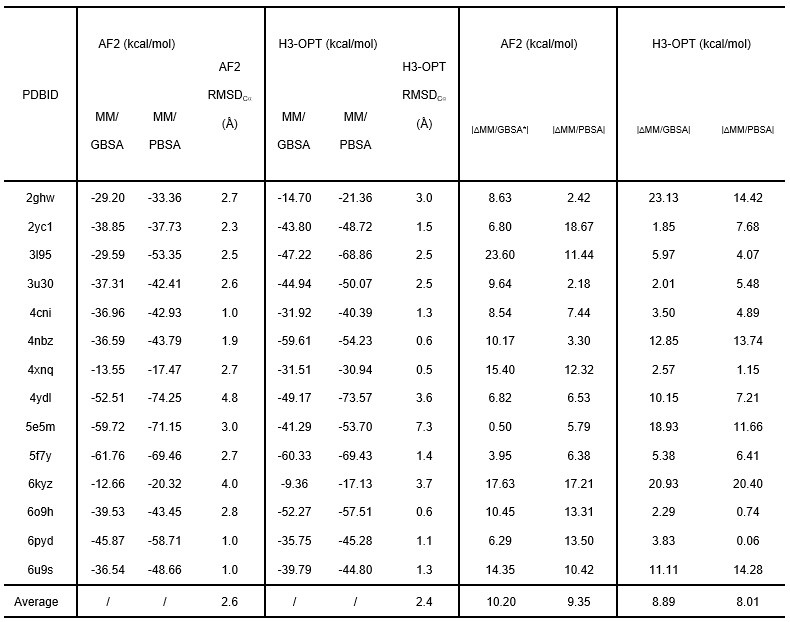
We have corrected the “Afterwards, a 25000-step NVT simulation with a time step of 1 fs was performed to gradually heat the system from 0 K to 100 K. A 250000-step NPT simulation with a time step of 2 fs was carried out to further heat the system from 100 K to 298 K.” into “Afterwards, a 400-ps NVT simulation with a time step of 2 fs was performed to gradually heat the system from 0 K to 298 K (0–100 K: 100 ps; 100-298 K: 200 ps; hold 298 K: 100 ps), and a 100-ps NPT simulation with a time step of 2 fs was performed to equilibrate the density of the system. During heating and density equilibration, we constrained the antigen-antibody structure with a restraint value of 10 kcal×mol-1×Å-2.” and added the following sentence in the Method section of our revised manuscript: “The first 50 ns restrains the non-hydrogen atoms of the antigen-antibody complex, and the last 50 ns restrains the non-hydrogen atoms of the antigen, with a constraint value of 10 kcal×mol-1×Å-2”
In addition, we have corrected the calculation of mean deltas using absolute values and have demonstrated that the average affinities of structures predicted by H3-OPT were closer to those of experimentally determined structures than values obtained through AF2. These results have been updated in the revised manuscript. However, significant differences still exist between the estimations of H3-OPT models and those derived from experimental structures in few cases. We found that antibodies moved away from antigens both in AF2 and H3-OPT predicted complexes during simulations, resulting in RMSDbackbone (RMSD of antibody backbone) exceeding 20 Å. These deviations led to significant structural changes in the complexes and consequently resulted in notable differences in affinity calculations. Thus, we removed three samples (PDBID: 4qhu, 6flc, 6plk) from benchmark because these predicted structures moved away from the antigen structure during MD simulations, resulting in huge energy differences from the native structures.
Author response table 1.
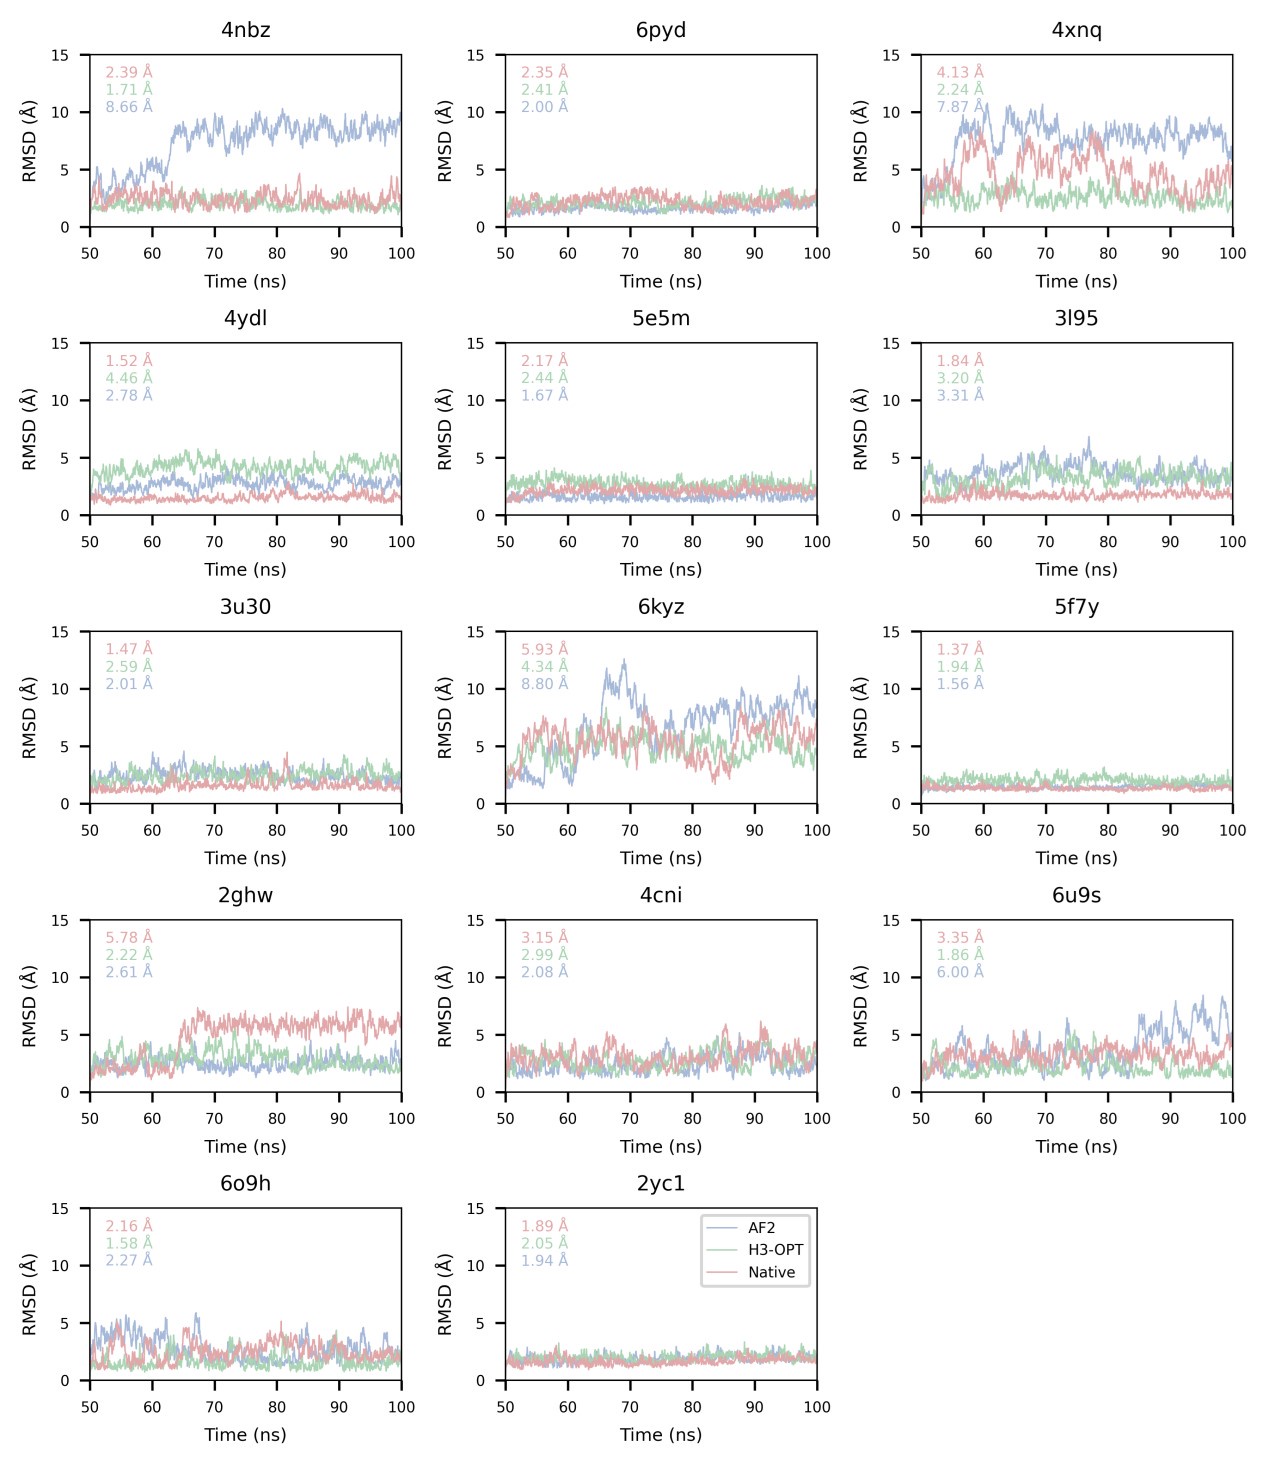
We also appreciate your reminder, and we have calculated all RMSDbackbone during production runs (SI Fig. 5).
Author response image 1.
Reviewer #3 (Public Review):
Weaknesses:
The proposed method lacks of a confidence score or a warning to help guiding the users in moderate to challenging cases.
We were sorry for our mistakes. We have updated our GitHub code and added following sentences to clarify how we train this confidence score module in Method Section: “Confidence score prediction module
We apply an MSE loss for confidence prediction, label error was calculated as the Cα deviation of each residue after alignment. The inputs of this module are the same as those used for H3-OPT, and it generates a confidence score ranging from 0 to 100. The dropout rates of H3-OPT were set to 0.25. The learning rate and weight decay of Adam optimizer are set to 1 × 10⁻⁵ and 1 × 10⁻⁴, respectively.”
Reviewer #2 (Recommendations For The Authors):
I would strongly suggest that the authors deepen their discussion on the affinity prediction based on Molecular Dynamics. In particular, why do the authors think that some structures exhibit huge differences between the predictions from the experimental structure and the predicted by H3-opt? Also, please compute the mean deltas using the absolute value and not the real value; the letter can be extremely misleading and hidden very high differences in different directions that are compensating when averaging.
I would also advice to include graphical results of the MD trajectories, at least as Supp. Material.
We gratefully thank you for your feedback and fully understand your concerns. We found the source of these huge differences and solved this problem by changing method of MD simulations. Then, we calculated all affinities and corrected the mean deltas calculation using the absolute value. The RMSDbackbone values were also measured to enable accurate affinity predictions during production runs (SI Fig. 5). There are still big differences between the estimations of H3-OPT models and those from experimental structures in some cases. We found that antibodies moved away from antigens both in AF2 and H3-OPT predicted complexes during simulations, resulting in RMSDbackbone exceeding 20 Å. These deviations led to significant structural changes in the complexes and consequently resulted in notable differences in affinity calculations. Thus, we removed three samples (PDBID: 4qhu, 6flc, 6plk) from benchmark.
Thanks again for your professional advice.
Reviewer #3 (Recommendations For The Authors):
(1) I am pleased with the most of the answers provided by the authors to the first review. In my humble opinion, the new manuscript has greatly improved. However, I think some answers to the reviewers are worth to be included in the main text or supporting information for the benefit of general readers. In particular, the requested statistics (i.e. p-values for Cα-RMSD values across the modeling approaches, p-values and error bars in Fig 5a and 5b, etc.) should be introduced in the manuscript.
We sincerely appreciate your advice. We have added the statistics values to Fig. 4 and Fig. 5 to our manuscript.
Author response image 2.
Author response image 3.
(2) Similarly, authors state in the answers that "we have trained a separate module to predict the confidence score of the optimized CDR-H3 loops". That sounds a great improvement to H3-OPT! However, I couldn't find any reference of that new module in the reviewed version of the manuscript, nor in the available GitHub code. That is the reason for me to hold the weakness "The proposed method lacks of a confidence score".
We were really sorry for our careless mistakes. Thank you for your reminding. We have updated our GitHub code and added following sentences to clarify how we train this confidence score module in Method Section:
“Confidence score prediction module
We apply an MSE loss for confidence prediction, label error was calculated as the Cα deviation of each residue after alignment. The inputs of this module are the same as those used for H3-OPT, and it generates a confidence score ranging from 0 to 100. The dropout rates of H3-OPT were set to 0.25. The learning rate and weight decay of Adam optimizer are set to 1 × 10⁻⁵ and 1 × 10⁻⁴, respectively.”
(3) I acknowledge all the efforts made for solving new mutant/designed nanobody structures. Judging from the solved structures, mutants Y95F and Q118N seems critical to either crystallographic or dimerization contacts stabilizing the CDR-H3 loop, hence preventing the formation of crystals. Clearly, solving a molecular structure is a challenge, hence including the following comment in the manuscript is relevant for readers to correctly asset the magnitude of the validation: "The sequence identities of the VH domain and H3 loop are 0.816 and 0.647, respectively, comparing with the best template. The CDR-H3 lengths of these nanobodies are both 17. According to our classification strategy, these nanobodies belong to Sub1. The confidence scores of these AlphaFold2 predicted loops were all higher than 0.8, and these loops were accepted as the outputs of H3-OPT by CBM."
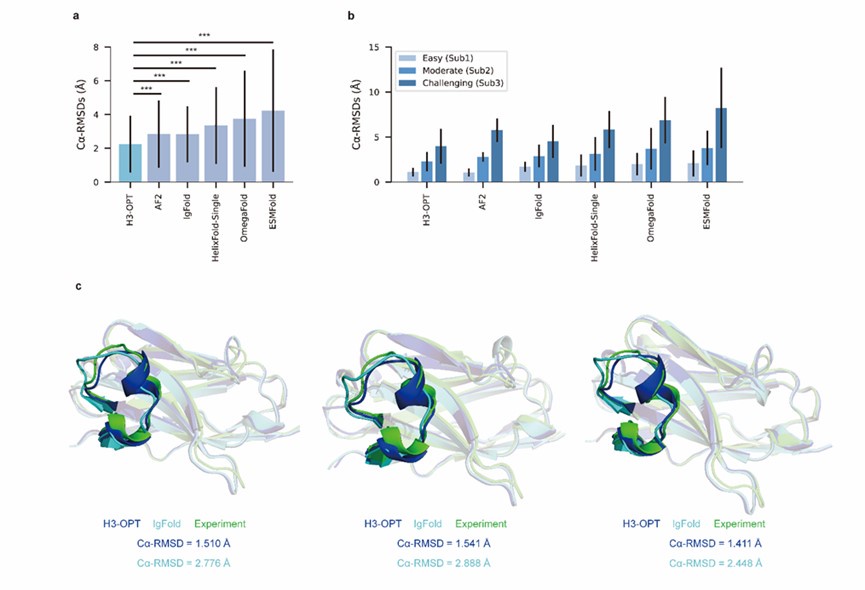
We appreciate your kind recommendations and have revised “Although Mut1 (E45A) and Mut2 (Q14N) shared the same CDR-H3 sequences as WT, only minor variations were observed in the CDR-H3. H3-OPT generated accurate predictions with Cα-RMSDs of 1.510 Å, 1.541 Å and 1.411 Å for the WT, Mut1, and Mut2, respectively.” into “Although Mut1 (E45A) and Mut2 (Q14N) shared the same CDR-H3 sequences as WT (LengthCDR-H3 = 17), only minor variations were observed in the CDR-H3. H3-OPT generated accurate predictions with Cα-RMSDs of 1.510 Å, 1.541 Å and 1.411 Å for the WT, Mut1, and Mut2, respectively (The confidence scores of these AlphaFold2 predicted loops were all higher than 0.8, and these loops were accepted as the outputs of H3-OPT by CBM). ”. In addition, we have added following sentence in the legend of Figure 4 to ensure that readers can appropriately evaluate the significance and reliability of our validations: “The sequence identities of the VH domain and H3 loop are 0.816 and 0.647, respectively, comparing with the best template.”.
(4) As pointed out in the first review, I think the work https://doi.org/10.1021/acs.jctc.1c00341 is worth acknowledging in section "2.2 Molecular dynamics (MD) simulations could not provide accurate CDR-H3 loop conformations" of supplementary material, as it constitutes a clear reference (and probably one of the few) to the MD simulations that authors pretend to perform. Similarly, the work https://doi.org/10.3390/molecules28103991 introduces a former benchmark on AI algorithms for predicting antibody and nanobody structures that readers may find interest to contrast with the present work. Indeed, this later reference is used by authors to answer a reviewer comment.
Thanks a lot for your valuable comments. We have added these references in the proper positions in our manuscript.
-
eLife assessment
This paper presents H3-OPT, a deep learning method that effectively combines existing techniques for the prediction of antibody structure. This work, supported by convincing experiments for validation, is important because the method can aid in the design of antibodies, which are key tools in many research and industrial applications.
-
Reviewer #2 (Public Review):
This work provides a new tool (H3-Opt) for the prediction of antibody and nanobody structures, based on the combination of AlphaFold2 and a pre-trained protein language model, with a focus on predicting the challenging CDR-H3 loops with enhanced accuracy than previously developed approaches. This task is of high value for the development of new therapeutic antibodies. The paper provides an external validation consisting of 131 sequences, with further analysis of the results by segregating the test sets in three subsets of varying difficulty and comparison with other available methods. Furthermore, the approach was validated by comparing three experimentally solved 3D structures of anti-VEGF nanobodies with the H3-Opt predictions
Strengths:
The experimental design to train and validate the new approach has …
Reviewer #2 (Public Review):
This work provides a new tool (H3-Opt) for the prediction of antibody and nanobody structures, based on the combination of AlphaFold2 and a pre-trained protein language model, with a focus on predicting the challenging CDR-H3 loops with enhanced accuracy than previously developed approaches. This task is of high value for the development of new therapeutic antibodies. The paper provides an external validation consisting of 131 sequences, with further analysis of the results by segregating the test sets in three subsets of varying difficulty and comparison with other available methods. Furthermore, the approach was validated by comparing three experimentally solved 3D structures of anti-VEGF nanobodies with the H3-Opt predictions
Strengths:
The experimental design to train and validate the new approach has been clearly described, including the dataset compilation and its representative sampling into training, validation and test sets, and structure preparation. The results of the in silico validation are quite convincing and support the authors' conclusions.
The datasets used to train and validate the tool and the code are made available by the authors, which ensures transparency and reproducibility, and allows future benchmarking exercises with incoming new tools.
Compared to AlphaFold2, the authors' optimization seems to produce better results for the most challenging subsets of the test set.
Weaknesses:
None
-
Reviewer #3 (Public Review):
Summary:
The manuscript introduces a new computational framework for choosing 'the best method' according to the case for getting the best possible structural prediction for the CDR-H3 loop. The authors show their strategy improves on average the accuracy of the predictions on datasets of increasing difficulty in comparison to several state-of-the-art methods. They also show the benefits of improving the structural predictions of the CDR-H3 in the evaluation of different properties that may be relevant for drug discovery and therapeutic design.
Strengths:
The authors introduce a novel framework, which can be easily adapted and improved. Authors use a well-defined dataset to test their new method. A modest average accuracy gain is obtained in comparison to other state-of-the art methods for the same task, …
Reviewer #3 (Public Review):
Summary:
The manuscript introduces a new computational framework for choosing 'the best method' according to the case for getting the best possible structural prediction for the CDR-H3 loop. The authors show their strategy improves on average the accuracy of the predictions on datasets of increasing difficulty in comparison to several state-of-the-art methods. They also show the benefits of improving the structural predictions of the CDR-H3 in the evaluation of different properties that may be relevant for drug discovery and therapeutic design.
Strengths:
The authors introduce a novel framework, which can be easily adapted and improved. Authors use a well-defined dataset to test their new method. A modest average accuracy gain is obtained in comparison to other state-of-the art methods for the same task, while avoiding testing different prediction approaches. Although the accuracy gain is mainly ascribed to easy cases, the accuracy and precision for moderate to challenging cases is comparable to the best PLM methods (see Fig. 4b and Extended Data Fig. 2), reflecting the present methodological limit in the field. The proposed method includes a confidence score for guiding users about the accuracy of the predictions.
-
-
Author Response
The following is the authors’ response to the original reviews.
eLife assessment
This work presents H3-OPT, a deep learning method that effectively combines existing techniques for the prediction of antibody structure. This work is important because the method can aid the design of antibodies, which are key tools in many research and industrial applications. The experiments for validation are solid.
Comments to Author:
Several points remain partially unclear, such as:
1). Which examples constitute proper validation;
Thank you for your kind reminder. We have modified the text of the experiments for validation to identify which examples constitute proper validation. We have corrected the “Finally, H3-OPT also shows lower Cα-RMSDs compared to AF2 or tFold-Ab for the majority of targets in an expanded benchmark …
Author Response
The following is the authors’ response to the original reviews.
eLife assessment
This work presents H3-OPT, a deep learning method that effectively combines existing techniques for the prediction of antibody structure. This work is important because the method can aid the design of antibodies, which are key tools in many research and industrial applications. The experiments for validation are solid.
Comments to Author:
Several points remain partially unclear, such as:
1). Which examples constitute proper validation;
Thank you for your kind reminder. We have modified the text of the experiments for validation to identify which examples constitute proper validation. We have corrected the “Finally, H3-OPT also shows lower Cα-RMSDs compared to AF2 or tFold-Ab for the majority of targets in an expanded benchmark dataset, including all antibody structures from CAMEO 2022” into “Finally, H3-OPT also shows lower Cα-RMSDs compared to AF2 or tFold-Ab for the majority (six of seven) of targets in an expanded benchmark dataset, including all antibody structures from CAMEO 2022” and added the following sentence in the experimental validation section of our revised manuscript to clarify which examples constitute proper validation: “AlphaFold2 outperformed IgFold on these targets”.
- What the relevance of the molecular dynamics calculations as performed is;
Thank you for your comment, and I apologize for any confusion. The goal of our molecular dynamics calculations is to compare the differences in binding affinities, an important issue of antibody engineering, between AlphaFold2-predicted complexes and H3-OPT-predicted complexes. Molecular dynamics simulations enable the investigation of the dynamic behaviors and interactions of these complexes over time. Unlike other tools for predicting binding free energy, MM/PBSA or MM/GBSA calculations provide dynamic properties of complexes by sampling conformational space, which helps in obtaining more accurate estimates of binding free energy. In summary, our molecular dynamics calculations demonstrated that the binding free energies of H3-OPT-predicted complexes are closer to those of native complexes. We have included the following sentence in our manuscript to provide an explanation of the molecular dynamics calculations: “Since affinity prediction plays a crucial role in antibody therapeutics engineering, we performed MD simulations to compare the differences in binding affinities between AF2-predicted complexes and H3-OPT-predicted complexes.”.
- The statistics for some of the comparisons;
Thank you for the comment. We have incorporated statistics for some of the comparisons in the revised version of our manuscript and added the following sentence in the Methods section: “We conducted two-sided t-test analyses to assess the statistical significance of differences between the various groups. Statistical significance was considered when the p-values were less than 0.05. These statistical analyses were carried out using Python 3.10 with the Scipy library (version 1.10.1).”.
- The lack of comparison with other existing methods.
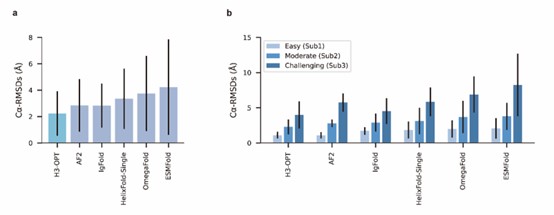
We appreciate your valuable comments and suggestions. Conducting comparisons with a broader set of existing methods can further facilitate discussions on the strengths and weaknesses of each method, as well as the accuracy of our method. In our study, we conducted a comparison of H3-OPT with many existing methods, including AlphaFold2, HelixFold-Single, ESMFold, and IgFold. We demonstrated that several protein structure prediction methods, such as ESMFold and HelixFold-Single, do not match the accuracy of AlphaFold2 in CDR-H3 prediction. Additionally, we performed a detailed comparison between H3-OPT, AlphaFold2, and IgFold (the latest antibody structure prediction method) for each target.
We sincerely thank the comment and have introduced a comparison with OmegaFold. The results have been incorporated into the relevant sections (Fig 4a-b) of the revised manuscript.
Author response image 1.
Public Reviews
Comments to Author:
Reviewer #1 (Public Review):
Summary:
The authors developed a deep learning method called H3-OPT, which combines the strength of AF2 and PLM to reach better prediction accuracy of antibody CDR-H3 loops than AF2 and IgFold. These improvements will have an impact on antibody structure prediction and design.
Strengths:
The training data are carefully selected and clustered, the network design is simple and effective.
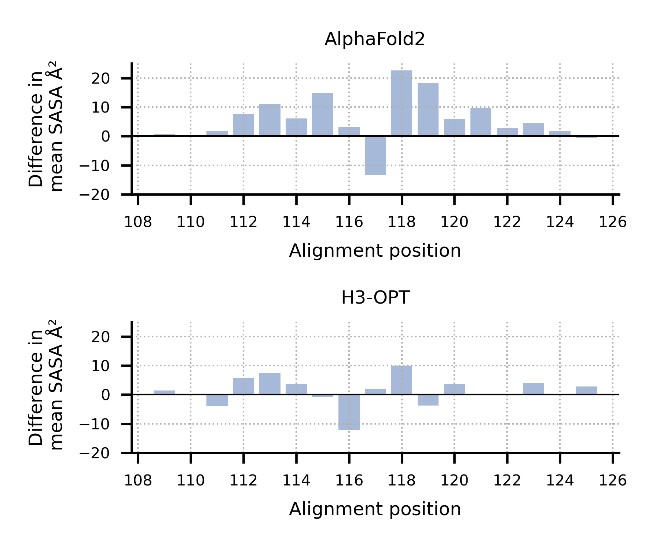
The improvements include smaller average Ca RMSD, backbone RMSD, side chain RMSD, more accurate surface residues and/or SASA, and more accurate H3 loop-antigen contacts.
The performance is validated from multiple angles.
Weaknesses:
- There are very limited prediction-then-validation cases, basically just one case.
Thanks for pointing out this issue. The number of prediction-then-validation cases is helpful to show the generalization ability of our model. However, obtaining experimental structures is both costly and labor-intensive. Furthermore, experimental validation cases only capture a limited portion of the sequence space in comparison to the broader diversity of antibody sequences.
To address this challenge, we have collected different datasets to serve as benchmarks for evaluating the performance of H3-OPT, including our non-redundant test set and the CAMEO dataset. The introduction of these datasets allows for effective assessments of H3-OPT’s performance without biases and tackles the obstacle of limited prediction-then-validation cases.
Reviewer #2 (Public Review):
This work provides a new tool (H3-Opt) for the prediction of antibody and nanobody structures, based on the combination of AlphaFold2 and a pre-trained protein language model, with a focus on predicting the challenging CDR-H3 loops with enhanced accuracy than previously developed approaches. This task is of high value for the development of new therapeutic antibodies. The paper provides an external validation consisting of 131 sequences, with further analysis of the results by segregating the test sets into three subsets of varying difficulty and comparison with other available methods. Furthermore, the approach was validated by comparing three experimentally solved 3D structures of anti-VEGF nanobodies with the H3-Opt predictions
Strengths:
The experimental design to train and validate the new approach has been clearly described, including the dataset compilation and its representative sampling into training, validation and test sets, and structure preparation. The results of the in-silico validation are quite convincing and support the authors' conclusions.
The datasets used to train and validate the tool and the code are made available by the authors, which ensures transparency and reproducibility, and allows future benchmarking exercises with incoming new tools.
Compared to AlphaFold2, the authors' optimization seems to produce better results for the most challenging subsets of the test set.
Weaknesses:
- The scope of the binding affinity prediction using molecular dynamics is not that clearly justified in the paper.
We sincerely appreciate your valuable comment. We have added the following sentence in our manuscript to justify the scope of the molecular dynamics calculations: “Since affinity prediction plays a crucial role in antibody therapeutics engineering, we performed MD simulations to compare the differences in binding affinities between AF2-predicted complexes and H3-OPT-predicted complexes.”.
- Some parts of the manuscript should be clarified, particularly the ones that relate to the experimental validation of the predictions made by the reported method. It is not absolutely clear whether the experimental validation is truly a prospective validation. Since the methodological aspects of the experimental determination are not provided here, it seems that this may not be the case. This is a key aspect of the manuscript that should be described more clearly.
Thank you for the reminder about experimental validation of our predictions. The sequence identities of the wild-type nanobody VH domain and H3 loop, when compared with the best template, are 0.816 and 0.647, respectively. As a result, these mutants exhibited low sequence similarity to our dataset, indicating the absence of prediction bias for these targets. Thus, H3-OPT outperformed IgFold on these mutants, demonstrating our model's strong generalization ability. In summary, the experimental validation actually serves as a prospective validation.
Thanks for your comments, we have added the following sentence to provide the methodological aspects of the experimental determination: “The protein expression, purification and crystallization experiments were described previously. The proteins used in the crystallization experiments were unlabeled. Upon thawing the frozen protein on ice, we performed a centrifugation step to eliminate any potential crystal nucleus and precipitants. Subsequently, we mixed the protein at a 1:1 ratio with commercial crystal condition kits using the sitting-drop vapor diffusion method facilitated by the Protein Crystallization Screening System (TTP LabTech, mosquito). After several days of optimization, single crystals were successfully cultivated at 21°C and promptly flash-frozen in liquid nitrogen. The diffraction data from various crystals were collected at the Shanghai Synchrotron Research Facility and subsequently processed using the aquarium pipeline.”
- Some Figures would benefit from a clearer presentation.
We sincerely thanks for your careful reading. According to your comments, we have made extensive modifications to make our presentation more convincing and clearer (Fig 2c-f).
Author response image 2.
Reviewer #3 (Public Review):
Summary:
The manuscript introduces a new computational framework for choosing 'the best method' according to the case for getting the best possible structural prediction for the CDR-H3 loop. The authors show their strategy improves on average the accuracy of the predictions on datasets of increasing difficulty in comparison to several state-of-the-art methods. They also show the benefits of improving the structural predictions of the CDR-H3 in the evaluation of different properties that may be relevant for drug discovery and therapeutic design.
Strengths:
The authors introduce a novel framework, which can be easily adapted and improved. The authors use a well-defined dataset to test their new method. A modest average accuracy gain is obtained in comparison to other state-of-the art methods for the same task while avoiding testing different prediction approaches.
Weaknesses:
- The accuracy gain is mainly ascribed to easy cases, while the accuracy and precision for moderate to challenging cases are comparable to other PLM methods (see Fig. 4b and Extended Data Fig. 2). That raises the question: how likely is it to be in a moderate or challenging scenario? For example, it is not clear whether the comparison to the solved X-ray structures of anti-VEGF nanobodies represents an easy or challenging case for H3-OPT. The mutant nanobodies seem not to provide any further validation as the single mutations are very far away from the CDR-H3 loop and they do not disrupt the structure in any way. Indeed, RMSD values follow the same trend in H3-OPT and IgFold predictions (Fig. 4c). A more challenging test and interesting application could be solving the structure of a designed or mutated CDR-H3 loop.
Thank you for your rigorous consideration. When the experimental structure is unavailable, it is difficult to directly determinate whether the target is easy-to-predict or challenging. We have conducted our non-redundant test set in which the number of easy-to-predict targets is comparable to the other two groups. Due to the limited availability of experimental antibody structures, especially nanobody structures, accurately predicting CDR-H3 remains a challenge. In our manuscript, we discuss the strengths and weakness of AlphaFold2 and other PLM-based methods, and we introduce H3-OPT as a comprehensive solution for antibody CDR3 modeling.
We also appreciate your comment on experimental structures. We fully agree with your opinion and made attempts to solve the experimental structures of seven mutants, including two mutants (Y95F and Q118N) which are close to CDR-H3 loop. Unfortunately, we tried seven different reagent kits with a total of 672 crystallization conditions, but were unable to obtain crystals for these mutants. Despite the mutants we successfully solved may not have significantly disrupted the structures of CDR-H3 loops, they have still provided valuable insights into the differences between MSA-based methods and MSA-free methods (such as IgFold) for antibody structure modeling.
We have further conducted a benchmarking study using two examples, PDBID 5U15 and 5U0R, both consisting of 18 residues in CDR-H3, to evaluate H3-OPT's performance in predicting mutated H3 loops. In the first case (target 5U15), AlphaFold2 failed to provide an accurate prediction of the extended orientation of the H3 loop, resulting in a less accurate prediction (Cα-RMSD = 10.25 Å) compared to H3-OPT (Cα-RMSD = 5.56 Å). In the second case (target 5U0R, a mutant of 5U15 in CDR3 loop), AlphaFold2 and H3-OPT achieved Cα-RMSDs of 6.10 Å and 4.25 Å, respectively. Additionally, the Cα-RMSDs of OmegaFold predictions were 8.05 Å and 9.84 Å, respectively. These findings suggest that both AlphaFold2 and OmegaFold effectively captured the mutation effects on conformations but achieved lower accuracy in predicting long CDR3 loops when compared to H3-OPT.
- The proposed method lacks a confidence score or a warning to help guide the users in moderate to challenging cases.
We appreciate your suggestions and we have trained a separate module to predict confidence scores. We used the MSE loss for confidence prediction, where the label error was calculated as the Cα deviation of each residue after alignment. The inputs of this module are the same as those used for H3-OPT, and it generates a confidence score ranging from 0 to 100.
- The fact that AF2 outperforms H3-OPT in some particular cases (e.g. Fig. 2c and Extended Data Fig. 3) raises the question: is there still room for improvements? It is not clear how sensible is H3-OPT to the defined parameters. In the same line, bench-marking against other available prediction algorithms, such as OmegaFold, could shed light on the actual accuracy limit. We totally understand your concern. Many papers have suggested that PLM-based models are computationally efficient but may have unsatisfactory accuracy when high-resolution templates and MSA are available (Fast, accurate antibody structure prediction from deep learning on massive set of natural antibodies, Ruffolo, J. A. et al, 2023). However, the accuracy of AF2 decreased substantially when the MSA information is limited. Therefore, we directly retained high-confidence structures of AF2 and introduced a PSPM to improve the accuracy of the targets with long CDR-H3 loops and few sequence homologs. The improvement in mean Cα-RMSD demonstrated the room for accurately predicting CDR-H3 loops.
We also appreciate your kind comment on defined parameters. In fact, once a benchmark dataset is established, determining an optimal cutoff value through parameter searching can indeed further improve the performance of H3-OPT in CDR3 structure prediction. However, it is important to note that this optimal cutoff value heavily depends on the testing dataset being used. Therefore, we provide a recommended cutoff value and offer a program interface for users who wish to manually define the cutoff value based on their specific requirements. Here, we showed the average Cα-RMSDs of our test set under different confidence cutoffs and the results have been added in the text accordingly.
Author response table 1.

We also appreciate your reminder, and we have conducted a benchmark against OmegaFold. The results have been included in the manuscript (Fig 4a-b).
Author response image 3.

Reviewer #1 (Recommendations For The Authors):
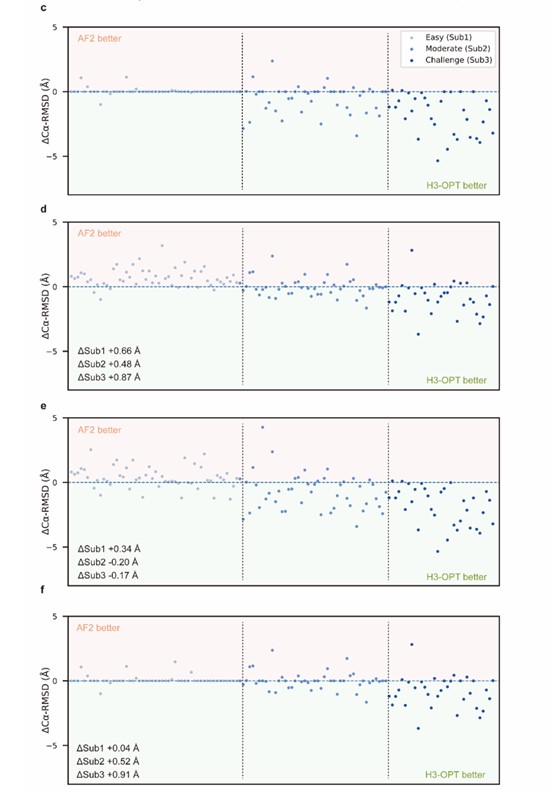
- In Fig 3a, please also compare IgFold and H3-OPT (merge Fig. S2 into Fig 3a)
In Fig 3b, please separate Sub2 and Sub3, and add IgFold's performance.
Thank you very much for your professional advice. We have made revisions to the figures based on your suggestions.
Author response image 4.
- For the three experimentally solved structures of anti-VEGF nanobodies, what are the sequence identities of the VH domain and H3 loop, compared to the best available template? What is the length of the H3 loop? Which category (Sub1/2/3) do the targets belong to? What is the performance of AF2 or AF2-Multimer on the three targets?
We feel sorry for these confusions. The sequence identities of the VH domain and H3 loop are 0.816 and 0.647, respectively, comparing with the best template. The CDR-H3 lengths of these nanobodies are both 17. According to our classification strategy, these nanobodies belong to Sub1. The confidence scores of these AlphaFold2 predicted loops were all higher than 0.8, and these loops were accepted as the outputs of H3-OPT by CBM.
- Is AF2-Multimer better than AF2, when using the sequences of antibody VH and antigen as input?
Thanks for your suggestions. Many papers have benchmarked AlphaFold2-Multimer for protein complex modeling and demonstrated the accuracy of AlphaFold2-Multimer on predicting the protein complex is far from satisfactory (Benchmarking AlphaFold for protein complex modeling reveals accuracy determinants, Rui Yin, et al., 2022). Additionally, there is no significantly difference between AlphaFold2 and AlphaFold2-Multimer on antibody modeling (Structural Modeling of Nanobodies: A Benchmark of State-of-the-Art Artificial Intelligence Programs, Mario S. Valdés-Tresanco, et al., 2023)
From the data perspective, we employed a non-redundant dataset for training and validation. Since these structures are valuable, considering the antigen sequence would reduce the size of our dataset, potentially leading to underfitting.
- For H3 loop grafting, I noticed that only identical target and template H3 sequences can trigger grafting (lines 348-349). How many such cases are in the test set?
We appreciate your comment from this perspective. There are thirty targets in our database with identical CDR-H3 templates.
Reviewer #2 (Recommendations For The Authors):
- It is not clear to me whether the three structures apparently used as experimental confirmation of the predictions have been determined previously in this study or not. This is a key aspect, as a retrospective validation does not have the same conceptual value as a prospective, a posteriori validation. Please note that different parts of the text suggest different things in this regard "The model was validated by experimentally solving three structures of anti-VEGF nanobodies predicted by H3-OPT" is not exactly the same as "we then sought to validate H3-OPT using three experimentally determined structures of anti-VEGF nanobodies, including a wild-type (WT) and two mutant (Mut1 and Mut2) structures, that were recently deposited in protein data bank". The authors are kindly advised to make this point clear. By the way, "protein data bank" should be in upper case letters.
We gratefully thank you for your feedback and fully understand your concerns. To validate the performance of H3-OPT, we initially solved the structures of both the wild-type and mutants of anti-VEGF nanobodies and submitted these structures to Protein Data Bank. We have corrected “that were recently deposited in protein data bank” into “that were recently deposited in Protein Data Bank” in our revised manuscript.
- It would be good to clarify the goal and importance of the binding affinity prediction, as it seems a bit disconnected from the rest of the paper. Also, it would be good to include the production MD runs as Sup, Mat.
Thanks for your valuable comment. We have added the following sentence in our manuscript to clarify the goal and importance of the molecular dynamics calculations: “Since affinity prediction plays a crucial role in antibody therapeutics engineering, we performed MD simulations to compare the differences in binding affinities between AF2-predicted complexes and H3-OPT-predicted complexes.”. The details of production runs have been described in Method section.
- Has any statistical test been performed to compare the mean Cα-RMSD values across the modeling approaches included in the benchmark exercise?
Thanks for this kind recommendation. We conducted a statistical test to assess the performance of different modeling approaches and demonstrated significant improvements with H3-OPT compared to other methods (p<0.001). Additionally, we have trained H3-OPT with five random seeds and compared mean Cα-RMSD values with all five models of AF2. Here, we showed the average Cα-RMSDs of H3-OPT and AlphaFold2.
Author response table 1.

- In Fig. 2c-f, I think it would be adequate to make the ordering criterion of the data points explicit in the caption or the graph itself.
We appreciate your comment and suggestion. We have revised the graph in the manuscript accordingly.
Author response image 5.
- Please revise Figure S2 caption and/or its content. It is not clear, in parts b and c, which is the performance of H3-OPT. Why weren´t some other antibody-specific tools such as IgFold included in this comparison?
Thanks for your comments. The performance of H3-OPT is not included in Figure S2. Prior to training H3-OPT, we conducted several preliminary studies, and the detailed results are available in the supplementary sections. We showed that AlphaFold2 outperformed other methods (including AI-based methods and TBM methods) and produced sub-angstrom predictions in framework regions. The comparison of IgFold with other methods was discussed in a previous work (Fast, accurate antibody structure prediction from deep learning on massive set of natural antibodies, Ruffolo, J. A. et al, 2023). In that study, we found that IgFold largely yielded results comparable to AlphaFold2 but with lower prediction cost. Additionally, we have also conducted a detailed comparison of CDR-H3 loops with IgFold in our main text.
- It is stated that "The relative binding affinities of the antigen-antibody complexes were evaluated using the Python script...". Which Python script?
Thank you for your comments, and I apologize for the confusion. This python script is a module of AMBER software, we have corrected “The relative binding affinities of the antigen-antibody complexes were evaluated using the python script” into “The relative binding affinities of the antigen-antibody complexes were evaluated using the MMPBSA module of AMBER software”.
Reviewer #3 (Recommendations For The Authors):
Does H3-OPT improve the AF2 score on the CDR-H3? It would be interesting to see whether grafted and PSPM loops improve the pLDDT score by using for example AF2Rank [https://doi.org/10.1103/PhysRevLett.129.238101]. That could also be a way to include a confidence score into H3-OPT.
We are so grateful for your kind question. H3-OPT could not provide a confidence score for output in current version, so we did not know whether H3-OPT improve the AF2 score or not.
We appreciate your kind recommendations and have calculated the pLDDT scores of all models predicted by H3-OPT and AF2 using AF2Rank. We showed that the average of pLDDT scores of different predicted models did not match the results of Cα-RMSD values.
Author response table 3.

Therefore, we have trained a separate module to predict the confidence score of the optimized CDR-H3 loops. We hope that this module can provide users with reliable guidance on whether to use predicted CDR-H3 loops.
The test case of Nb PDB id. 8CWU is an interesting example where AF2 outperforms H3-OPT and PLMs. The top AF2 model according to ColabFold (using default options and no template [https://doi.org/10.1038/s41592-022-01488-1]) shows a remarkably good model of the CDR-H3, explaining the low Ca-RMSD in the Extended Data Fig. 3. However, the pLDDT score of the 4 tip residues (out of 12), forming the hairpin of the CDR-H3 loop, pushes down the average value bellow the CBM cut-off of 80. I wonder if there is a lesson to learn from that test case. How sensible is H3-OPT to the CBM cut-off definition? Have the authors tried weighting the residue pLDDT score by some structural criteria before averaging? I guess AF2 may have less confidence in hydrophobic tip residues in exposed loops as the solvent context may not provide enough support for the pLDDT score.
Thanks for your valuable feedback. We showed the average Cα-RMSDs of our test set under different confidence cutoffs and the results have been added in the text accordingly.
Author response table 4.
We greatly appreciate your comment on this perspective. Inspired on your kind suggestions, we will explore the relationship between cutoff values and structural information in related work. Your feedback is highly valuable as it will contribute to the development of our approach.
A comparison against the new folding prediction method OmegaFold [https://doi.org/10.1101/2022.07.21.500999] is missed. OmegaFold seems to outperform AF2, ESM, and IgFold among others in predicting the CDR-H3 loop conformation (See [https://doi.org/10.3390/molecules28103991] and [https://doi.org/10.1101/2022.07.21.500999]). Indeed, prediction of anti-VEGF Nb structure (PDB WT_QF_0329, chain B in supplementary data) by OmegaFold as implemented in ColabFold [https://colab.research.google.com/github/sokrypton/ColabFold/blob/main/beta/omegafold.ipynb] and setting 10 cycles, renders Ca-RMSD 1.472 Å for CDR-H3 (residues 98-115).
We appreciate your valuable suggestion. We have added the comparison against OmegaFold in our manuscript. The results have been included in the manuscript (Fig 4a-b).
Author response image 6.
In our test set, OmegaFold outperformed ESMFold in predicting the CDR-H3 loop conformation. However, it failed to match the accuracy of AF2, IgFold, and H3-OPT. We discussed the difference between MSA-based methods (such as AlphaFold2) and MSA-free methods (such as IgFold) in predicting CDR-H3 loops. Similarly, OmegaFold provided comparative results with HelixFold-Single and other MSA-free methods but still failed to match the accuracy of AlphaFold2 and H3-OPT on Sub1.
The time-consuming step in H3-OPT is the AF2 prediction. However, most of the time is spent in modeling the mAb and Nb scaffolds, which are already very well predicted by PLMs (See Fig. 4 in [https://doi.org/10.3390/molecules28103991]). Hence, why not use e.g. OmegaFold as the first step, whose score also correlates to the RMSD values [https://doi.org/10.3390/molecules28103991]? If that fails, then use AF2 or grafting. Alternatively, use a PLM model to generate a template, remove/mask the CDR loops (at least CDR-H3), and pass it as a template to AF2 to optimize the structure with or without MSA (e.g. using AF2Rank).
Thanks for your professional feedbacks. It is really true that the speed of MSA searching limited the application of high-throughput structure prediction. Previous studies have demonstrated that the deep learning methods performed well on framework residues. We once tried to directly predict the conformations of CDR-H3 loops using PLM-based methods, but this initial version of H3-OPT lacking the CBM could not replicate the accuracy of AF2 in Sub1. Similarly, we showed that IgFold and OmegaFold also provide lower accuracy in Sub1 (average Cα-RMSD is 1.71 Å and 1.83 Å, respectively, whereas AF2 predicted an average of 1.07 Å). Therefore, The predictions of AlphaFold2 not only produce scaffolds but also provide the highest quality of CDR-H3 loops when high-resolution templates and MSA are available.
Thank you once again for your kind recommendation. In the current version of H3-OPT, we have highlighted the strengths of H3-OPT in combining the AF2 and PLM models in various scenarios. AF2 can provide accurate predictions for short loops with fewer than 10 amino acids, and PLM-based models show little or no improvement in such cases. In the next version of H3-OPT, as the first step, we plan to replace the AF2 models with other methods if any accurate MSA-free method becomes available in the future.
Line 115: The statement "IgFold provided higher accuracy in Sub3" is not supported by Fig. 2a.
We are sorry for our carelessness. We have corrected “IgFold provided higher accuracy in Sub3” into “IgFold provided higher accuracy in Sub3 (Fig. 3a)”.
Lines 195-203: What is the statistical significance of results in Fig 5a and 5b?
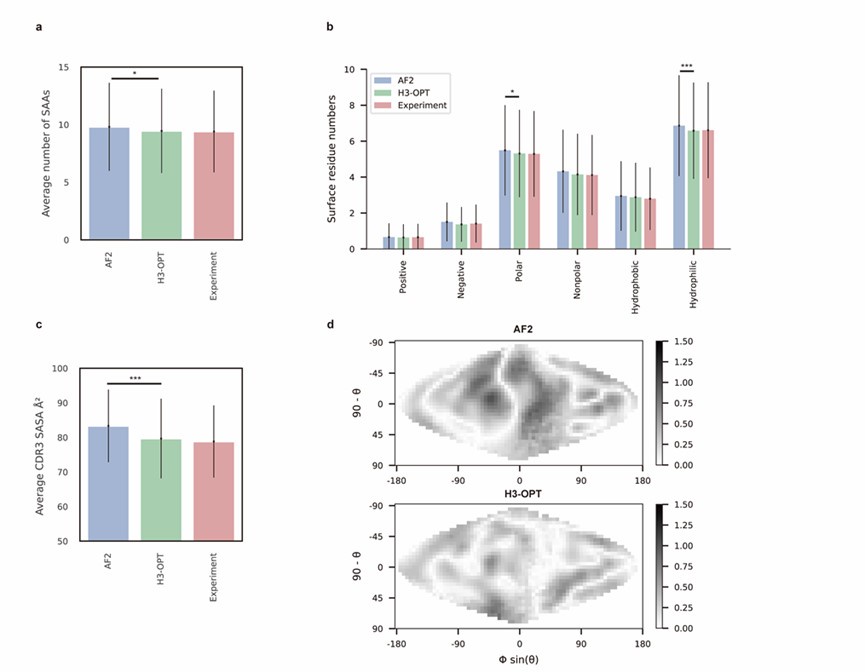
Thank you for your kind comments. The surface residues of AF2 models are significantly higher than those of H3-OPT models (p < 0.005). In Fig. 5b, H3-OPT models predicted lower values than AF2 models in terms of various surface properties, including polarity (p <0.05) and hydrophilicity (p < 0.001).
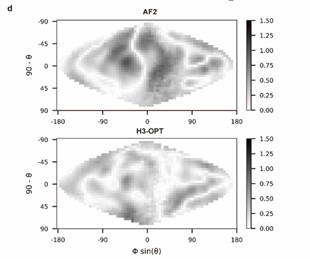
Lines 212-213: It is not easy to compare and quantify the differences between electrostatic maps in Fig. 5d. Showing a Dmap (e.g. mapmodel - mapexperiment) would be a better option. Additionally, there is no methodological description of how the maps were generated nor the scale of the represented potential.
Thank you for pointing this out. We have modified the figure (Fig. 5d) according to your kind recommendation and added following sentences to clarify the methodological description on the surface electrostatic potential:
“Analysis of surface electrostatic potential
We generated two-dimensional projections of CDR-H3 loop’s surface electrostatic potential using SURFMAP v2.0.0 (based on GitHub from February 2023: commit: e0d51a10debc96775468912ccd8de01e239d1900) with default parameters. The 2D surface maps were calculated by subtracting the surface projection of H3-OPT or AF2 predicted H3 loops to their native structures.”
Author response image 7.
Lines 237-240 and Table 2: What is the meaning of comparing the average free energy of the whole set? Why free energies should be comparable among test cases? I think the correct way is to compare the mean pair-to-pair difference to the experimental structure. Similarly, reporting a precision in the order of 0.01 kcal/mol seems too precise for the used methodology, what is the statistical significance of the results? Were sampling issues accounted for by performing replicates or longer MDs?
Thanks for your rigorous advice and pointing out these issues. We have modified the comparisons of free energies of different predicted methods and corrected the precision of these results. The average binding free energies of H3-OPT complexes is lower than AF2 predicted complexes, but there is no significant difference between these energies (p >0.05).
Author response table 4.
Comparison of binding affinities obtained from MD simulations using AF2 and H3-OPT.
Thanks for your comments on this perspective. Longer MD simulations often achieve better convergence for the average behavior of the system, while replicates provide insights into the variability and robustness of the results. In our manuscript, each MD simulation had a length of 100 nanoseconds, with the initial 90 nanoseconds dedicated to achieving system equilibrium, which was verified by monitoring RMSD (Root Mean Square Deviation). The remaining 10 nanoseconds of each simulation were used for the calculation of free energy. This approach allowed us to balance the need for extensive sampling with the verification of system stability.
Regarding MD simulations for CDR-H3 refinement, its successful application highly depends on the starting conformation, the force field, and the sampling strategy [https://doi.org/10.1021/acs.jctc.1c00341]. In particular, the applied plan MD seems a very limited strategy (there is not much information about the simulated times in the supplementary material). Similarly, local structure optimizations with QM methods are not expected to improve a starting conformation that is far from the experimental conformation.
Thank you very much for your valuable feedback. We fully agree with your insights regarding the limitations of MD simulations. Before training H3-OPT, we showed the challenge of accurately predicting CDR-H3 structures. We then tried to optimize the CDR-H3 loops by computational tools, such as MD simulations and QM methods (detailed information of MD simulations is provided in the main text). Unfortunately, these methods were not expected to improve the accuracy of AF2 predicted CDR-H3 loops. These results showed that MD simulations and QM methods not only are time-consuming, but also failed to optimize the CDR-H3 loops. Therefore, we developed H3-OPT to tackle these issues and improve the accuracy of CDR3-H3 for the development of antibody therapeutics.
Text improvements
Relevant statistical and methodological parameters are presented in a dispersed manner throughout the text. For example, the number of structures in test, training, and validation datasets is first presented in the caption of Fig. 4. Similarly, the sequence identity % to define redundancy is defined in the caption of Fig. 1a instead of lines 87-88, where authors define "we constructed a non-redundant dataset with 1286 high-resolution (<2.5 Å)". Is the sequence redundancy for the CDR-H3 or the whole mAb/Nb?
Thank you for pointing out these issues. We have added the number of structures in each subgroup in the caption of Fig. 1a: “Clustering of the filtered, high-resolution structures yielded three datasets for training (n = 1021), validation (n = 134), and testing (n = 131).” and corrected “As data quality has large effects on prediction accuracy, we constructed a non-redundant dataset with 1286 high-resolution (<2.5 Å) antibody structures from SAbDab” into “As data quality has large effects on prediction accuracy, we constructed a non-redundant dataset (sequence identity < 0.8) with 1286 high-resolution (<2.5 Å) antibody structures from SAbDab” in the revised manuscript. The sequence redundancy applies to the whole mAb/Nb.
The description of ablation studies is not easy to follow. For example, what does removing TGM mean in practical terms (e.g. only AF2 is used, or PSPM is applied if AF2 score < 80)? Similarly, what does removing CBM mean in practical terms (e.g. all AF2 models are optimized by PSPM, and no grafting is done)? Thanks for your comments and suggestions. We have corrected “d, Differences in H3-OPT accuracy without the template module. e, Differences in H3-OPT accuracy without the CBM. f, Differences in H3-OPT accuracy without the TGM.” into “d, Differences in H3-OPT accuracy without the template module. This ablation study means only PSPM is used. e, Differences in H3-OPT accuracy without the CBM. This ablation study means input loop is optimized by TGM and PSPM. f, Differences in H3-OPT accuracy without the TGM. This ablation study means input loop is optimized by CBM and PSPM.”.
Authors should report the values in the text using the same statistical descriptor that is used in the figures to help the analysis by the reader. For example, in lines 223-224 a precision score of 0.75 for H3-OPT is reported in the text (I assume this is the average value), while the median of ~0.85 is shown in Fig. 6a.
Thank you for your careful checks. We have corrected “After identifying the contact residues of antigens by H3-OPT, we found that H3-OPT could substantially outperform AF2 (Fig. 6a), with a precision of 0.75 and accuracy of 0.94 compared to 0.66 precision and 0.92 accuracy of AF2.” into “After identifying the contact residues of antigens by H3-OPT, we found that H3-OPT could substantially outperform AF2 (Fig. 6a), with a median precision of 0.83 and accuracy of 0.97 compared to 0.64 precision and 0.95 accuracy of AF2.” in proper place of manuscript.
Minor corrections
Lines 91-94: What do length values mean? e.g. is 0-2 Å the RMSD from the experimental structure?
We appreciate your comment and apologize for any confusion. The RMSD value is actually from experimental structure. The RMSD value evaluates the deviation of predicted CDR-H3 loop from native structure and also represents the degree of prediction difficulty in AlphaFold2 predictions. We have added following sentence in the proper place of the revised manuscript: “(RMSD, a measure of the difference between the predicted structure and an experimental or reference structure)”.
Line 120: is the "AF2 confidence score" for the full-length or CDR-H3?
We gratefully appreciate for your valuable comment and have corrected “Interestingly, we observed that AF2 confidence score shared a strong negative correlation with Cα-RMSDs (Pearson correlation coefficient =-0.67 (Fig. 2b)” into “Interestingly, we observed that AF2 confidence score of CDR-H3 shared a strong negative correlation with Cα-RMSDs (Pearson correlation coefficient =-0.67 (Fig. 2b)” in the revised manuscript.
Line 166: Do authors mean "Taken" instead of "Token"?
We are really sorry for our careless mistakes. Thank you for your reminder.
Line 258: Reference to Fig. 1 seems wrong, do authors mean Fig. 4?
We sincerely thank the reviewer for careful reading. As suggested by the reviewer, we have corrected the “Fig. 1” into “Fig. 4”.
Author response image 7.
Point out which plot corresponds to AF2 and which one to H3-OPT
Thanks for pointing out this issue. We have added the legends of this figure in the proper positions in our manuscript.
-
eLife assessment
This paper presents H3-OPT, a deep learning method that effectively combines existing techniques for the prediction of antibody structure. This work is important because the method can aid in the design of antibodies, which are key tools in many research and industrial applications. The experiments for validation are convincing, but some further statistical evaluation would be helpful for the readers.
-
Reviewer #1 (Public Review):
Summary:
The authors developed a deep learning method called H3-OPT, which combines the strength of AF2 and PLM to reach better prediction accuracy of antibody CDR-H3 loops than AF2 and IgFold. These improvements will have an impact on antibody structure prediction and design.
Strengths:
The training data are carefully selected and clustered, the network design is simple and effective.
The improvements include smaller average Ca RMSD, backbone RMSD, side chain RMSD, more accurate surface residues and/or SASA, and more accurate H3 loop-antigen contacts.
The performance is validated from multiple angles.
The revised manuscript has cleared my previous concerns.
-
Reviewer #2 (Public Review):
This work provides a new tool (H3-Opt) for the prediction of antibody and nanobody structures, based on the combination of AlphaFold2 and a pre-trained protein language model, with a focus on predicting the challenging CDR-H3 loops with enhanced accuracy than previously developed approaches. This task is of high value for the development of new therapeutic antibodies. The paper provides an external validation consisting of 131 sequences, with further analysis of the results by segregating the test sets in three subsets of varying difficulty and comparison with other available methods. Furthermore, the approach was validated by comparing three experimentally solved 3D structures of anti-VEGF nanobodies with the H3-Opt predictions
Strengths:
The experimental design to train and validate the new approach has …
Reviewer #2 (Public Review):
This work provides a new tool (H3-Opt) for the prediction of antibody and nanobody structures, based on the combination of AlphaFold2 and a pre-trained protein language model, with a focus on predicting the challenging CDR-H3 loops with enhanced accuracy than previously developed approaches. This task is of high value for the development of new therapeutic antibodies. The paper provides an external validation consisting of 131 sequences, with further analysis of the results by segregating the test sets in three subsets of varying difficulty and comparison with other available methods. Furthermore, the approach was validated by comparing three experimentally solved 3D structures of anti-VEGF nanobodies with the H3-Opt predictions
Strengths:
The experimental design to train and validate the new approach has been clearly described, including the dataset compilation and its representative sampling into training, validation and test sets, and structure preparation. The results of the in silico validation are quite convincing and support the authors' conclusions.
The datasets used to train and validate the tool and the code are made available by the authors, which ensures transparency and reproducibiity, and allows future benchmarking exercises with incoming new tools.
Compared to AlphaFold2, the authors' optimization seems to produce better results for the most challenging subsets of the test set.
Weaknesses:
The comparison of affinity predictions derived from AlphaFold2 and H3-opt models, based on molecular dynamics simulations, should have been discussed in depth. In some cases, there are huge differences between the estimations from H3-opt models and those from experimental structures. It seems that the authors obtained average differences of the real delta, instead of average differences of the absolute value of the delta. This can be misleading, because high negative differences might be compensated by high positive differences when computing the mean value. Moreover, it would have been good for the authors to disclose the trajectories from the MD simulations.
-
Reviewer #3 (Public Review):
Summary:
The manuscript introduces a new computational framework for choosing 'the best method' according to the case for getting the best possible structural prediction for the CDR-H3 loop. The authors show their strategy improves on average the accuracy of the predictions on datasets of increasingly difficulty in comparison to several state-of-the-art methods. They also show the benefits of improving the structural predictions of the CDR-H3 in the evaluation of different properties that may be relevant for drug discovery and therapeutics design.Strengths:
Authors introduce a novel framework, which can be easily adapted and improved. Authors use a well defined dataset to test their new method. A modest average accuracy gain is obtained in comparison to other state-of-the art methods for the same task, …Reviewer #3 (Public Review):
Summary:
The manuscript introduces a new computational framework for choosing 'the best method' according to the case for getting the best possible structural prediction for the CDR-H3 loop. The authors show their strategy improves on average the accuracy of the predictions on datasets of increasingly difficulty in comparison to several state-of-the-art methods. They also show the benefits of improving the structural predictions of the CDR-H3 in the evaluation of different properties that may be relevant for drug discovery and therapeutics design.Strengths:
Authors introduce a novel framework, which can be easily adapted and improved. Authors use a well defined dataset to test their new method. A modest average accuracy gain is obtained in comparison to other state-of-the art methods for the same task, while avoiding for testing different prediction approaches. Although the accuracy gain is mainly ascribed to easy cases, the accuracy and precision for moderate to challenging cases is comparable to the best PLM methods (see Fig. 4b and Extended Data Fig. 2), reflecting the present methodological limit in the field.Weaknesses:
The proposed method lacks of a confidence score or a warning to help guiding the users in moderate to challenging cases. -
-
eLife assessment
This work presents H3-OPT, a deep learning method that effectively combines existing techniques for the prediction of antibody structure. This work is important because the method can aid the design of antibodies, which are key tools in many research and industrial applications. The experiments for validation are solid, although several points remain partially unclear, such as (1) which examples constitute proper validation, (2) what the relevance of the molecular dynamics calculations as performed is, (3) the statistics for some of the comparisons, and (4) the lack of comparison with other existing methods.
-
Reviewer #1 (Public Review):
Summary:
The authors developed a deep learning method called H3-OPT, which combines the strength of AF2 and PLM to reach better prediction accuracy of antibody CDR-H3 loops than AF2 and IgFold. These improvements will have an impact on antibody structure prediction and design.Strengths:
The training data are carefully selected and clustered, the network design is simple and effective.The improvements include smaller average Ca RMSD, backbone RMSD, side chain RMSD, more accurate surface residues and/or SASA, and more accurate H3 loop-antigen contacts.
The performance is validated from multiple angles.
Weaknesses:
There are very limited prediction-then-validation cases, basically just one case. -
Reviewer #2 (Public Review):
This work provides a new tool (H3-Opt) for the prediction of antibody and nanobody structures, based on the combination of AlphaFold2 and a pre-trained protein language model, with a focus on predicting the challenging CDR-H3 loops with enhanced accuracy than previously developed approaches. This task is of high value for the development of new therapeutic antibodies. The paper provides an external validation consisting of 131 sequences, with further analysis of the results by segregating the test sets into three subsets of varying difficulty and comparison with other available methods. Furthermore, the approach was validated by comparing three experimentally solved 3D structures of anti-VEGF nanobodies with the H3-Opt predictions
Strengths:
The experimental design to train and validate the new approach has …Reviewer #2 (Public Review):
This work provides a new tool (H3-Opt) for the prediction of antibody and nanobody structures, based on the combination of AlphaFold2 and a pre-trained protein language model, with a focus on predicting the challenging CDR-H3 loops with enhanced accuracy than previously developed approaches. This task is of high value for the development of new therapeutic antibodies. The paper provides an external validation consisting of 131 sequences, with further analysis of the results by segregating the test sets into three subsets of varying difficulty and comparison with other available methods. Furthermore, the approach was validated by comparing three experimentally solved 3D structures of anti-VEGF nanobodies with the H3-Opt predictions
Strengths:
The experimental design to train and validate the new approach has been clearly described, including the dataset compilation and its representative sampling into training, validation and test sets, and structure preparation. The results of the in silico validation are quite convincing and support the authors' conclusions.The datasets used to train and validate the tool and the code are made available by the authors, which ensures transparency and reproducibility, and allows future benchmarking exercises with incoming new tools.
Compared to AlphaFold2, the authors' optimization seems to produce better results for the most challenging subsets of the test set.
Weaknesses:
The scope of the binding affinity prediction using molecular dynamics is not that clearly justified in the paper.Some parts of the manuscript should be clarified, particularly the ones that relate to the experimental validation of the predictions made by the reported method. It is not absolutely clear whether the experimental validation is truly a prospective validation. Since the methodological aspects of the experimental determination are not provided here, it seems that this may not be the case. This is a key aspect of the manuscript that should be described more clearly.
Some Figures would benefit from a more clear presentation.
-
Reviewer #3 (Public Review):
Summary:
The manuscript introduces a new computational framework for choosing 'the best method' according to the case for getting the best possible structural prediction for the CDR-H3 loop. The authors show their strategy improves on average the accuracy of the predictions on datasets of increasing difficulty in comparison to several state-of-the-art methods. They also show the benefits of improving the structural predictions of the CDR-H3 in the evaluation of different properties that may be relevant for drug discovery and therapeutic design.Strengths:
The authors introduce a novel framework, which can be easily adapted and improved. The authors use a well-defined dataset to test their new method. A modest average accuracy gain is obtained in comparison to other state-of-the art methods for the same task …Reviewer #3 (Public Review):
Summary:
The manuscript introduces a new computational framework for choosing 'the best method' according to the case for getting the best possible structural prediction for the CDR-H3 loop. The authors show their strategy improves on average the accuracy of the predictions on datasets of increasing difficulty in comparison to several state-of-the-art methods. They also show the benefits of improving the structural predictions of the CDR-H3 in the evaluation of different properties that may be relevant for drug discovery and therapeutic design.Strengths:
The authors introduce a novel framework, which can be easily adapted and improved. The authors use a well-defined dataset to test their new method. A modest average accuracy gain is obtained in comparison to other state-of-the art methods for the same task while avoiding testing different prediction approaches.Weaknesses:
The accuracy gain is mainly ascribed to easy cases, while the accuracy and precision for moderate to challenging cases are comparable to other PLM methods (see Fig. 4b and Extended Data Fig. 2). That raises the question: how likely is it to be in a moderate or challenging scenario? For example, it is not clear whether the comparison to the solved X-ray structures of anti-VEGF nanobodies represents an easy or challenging case for H3-OPT. The mutant nanobodies seem not to provide any further validation as the single mutations are very far away from the CDR-H3 loop and they do not disrupt the structure in any way. Indeed, RMSD values follow the same trend in H3-OPT and IgFold predictions (Fig. 4c). A more challenging test and interesting application could be solving the structure of a designed or mutated CDR-H3 loop.The proposed method lacks a confidence score or a warning to help guide the users in moderate to challenging cases.
The fact that AF2 outperforms H3-OPT in some particular cases (e.g. Fig. 2c and Extended Data Fig. 3) raises the question: is there still room for improvements? It is not clear how sensible is H3-OPT to the defined parameters. In the same line, bench-marking against other available prediction algorithms, such as OmegaFold, could shed light on the actual accuracy limit.
-
