Affected cell types for hundreds of Mendelian diseases revealed by analysis of human and mouse single-cell data
Curation statements for this article:-
Curated by eLife

eLife assessment
The study presents analyses linking cell-types to monogenic disorders using over-expression of known disease-associated genes in single-cell data to identify 110 disease-affected cell types for 714 Mendelian diseases. Overall this important study combines multiple data analyses to quantify the connection between cell types and human disorders. While some of the analyses are compelling, updates to the method are needed to ensure that statistical inference is appropriately stringent and rigorous.
This article has been Reviewed by the following groups
Discuss this preprint
Start a discussion What are Sciety discussions?Listed in
- Evaluated articles (eLife)
Abstract
Mendelian diseases tend to manifest clinically in certain tissues, yet their affected cell types typically remain elusive. Single-cell expression studies showed that overexpression of disease-associated genes may point to the affected cell types. Here, we developed a method that infers disease-affected cell types from the preferential expression of disease-associated genes in cell types (PrEDiCT). We applied PrEDiCT to single-cell expression data of six human tissues, to infer the cell types affected in Mendelian diseases. Overall, we inferred the likely affected cell types for 328 diseases. We corroborated our findings by literature text-mining, expert validation, and recapitulation in mouse corresponding tissues. Based on these findings, we explored characteristics of disease-affected cell types, showed that diseases manifesting in multiple tissues tend to affect similar cell types, and highlighted cases where gene functions could be used to refine inference. Together, these findings expand the molecular understanding of disease mechanisms and cellular vulnerability.
Article activity feed
-

-

Author Respones
Reviewer #1 (Public Review):
The manuscript by Hekselman et al presents analyses linking cell-types to monogenic disorders using over-expression of monogenic disease genes as the signal. The manuscript analyses data from 6 tissues (bone marrow, lung, muscle, spleen, tongue and trachea) together with ~1,000 rare diseases from OMIM (with ~2,000 associated genes) to identify cell-type of interest for specific disease of choice. The signal used by the approach is the relative expression of OMIM-genes in a particular cell type relative to the expression of the gene in the tissue of interest identifying celltype-disease pairs that are then investigated through literature review and recapitulated using mouse expression. A potentially interesting finding is that disease genes manifesting in multiple tissues seem to hit same …
Author Respones
Reviewer #1 (Public Review):
The manuscript by Hekselman et al presents analyses linking cell-types to monogenic disorders using over-expression of monogenic disease genes as the signal. The manuscript analyses data from 6 tissues (bone marrow, lung, muscle, spleen, tongue and trachea) together with ~1,000 rare diseases from OMIM (with ~2,000 associated genes) to identify cell-type of interest for specific disease of choice. The signal used by the approach is the relative expression of OMIM-genes in a particular cell type relative to the expression of the gene in the tissue of interest identifying celltype-disease pairs that are then investigated through literature review and recapitulated using mouse expression. A potentially interesting finding is that disease genes manifesting in multiple tissues seem to hit same cell-types. Overall this important study combines multiple data analyses to quantify the connection between cell types and human disorders. However whereas some of the analyses are compelling, the statistical analyses are incomplete as they don't provide full treatment of type I error.
Statistical analyses were changed to include permutation testing and a different threshold (Results, page 6, 1st paragraph; Methods, page 21-22, ‘PrEDiCT score calculation and significance assessment’; Figure 1–figure supplement 2). Assessments of type I error were based on literature text-mining and expert curation, and showed that false-positive rates were low in both (0.01 and 0.07, respectively; Figure 1F and Figure 1–figure supplement 4A).
Reviewer #2 (Public Review):
This study identifies 110 disease-affected cell types for 714 Mendelian diseases, based on preferential expression of known disease-associated genes in single-cell data. It is likely that many or most of the results are real, and the results are biologically interesting and provide a valuable resource. However, updates to the method are needed to ensure that inference of statistical significance is appropriately stringent and rigorous.
Strengths: a systematic evaluation of disease-affected cell types across Mendelian diseases is a valuable addition to the literature, complementing systematic evaluations of common disease and targeted analyses of individual Mendelian diseases. The validation via excess overlap with diseasecell type pairs from literature co-appearance provides compelling evidence that many or most of the results are real. In addition, many of the results are biologically interesting. In particular, it is interesting that diseases with multiple affected tissues tend to affect similar cell types in the respective tissues.
Limitations: the main limitation of the study is that, although many or most of the results are likely to be real, the criteria for statistical significance is probably not stringent enough, and is not welljustified. For diseases with only 1 disease-associated gene, the threshold is a z-score>2 for preferential expression in the cell type, but this threshold is likely to be often exceeded by chance. (For diseases with many disease-associated genes, the threshold is a median (across genes) zscore>2 for preferential expression in the cell type, which is less likely to occur by chance but still an arbitrary threshold.) Thus, there is a good chance that a sizable proportion of the reported disease-affected cell types might be false positives. The best solution would be to assess statistical significance via empirical comparison with results for non-disease-associated control genes, and assess the statistical significance of the resulting P-values using FDR.
We thank the reviewer for the valuable insights and suggestions. We revised the method to assess statistical significance by using empirical comparison followed by FDR correction, as suggested by the reviewer (Results, page 6, 1st paragraph; Methods, page 21-22, ‘PrEDiCT score calculation and significance assessment’; Figure 1–figure supplement 2).
The re-analysis using mouse single-cell data adds an interesting additional dimension to the study, with the small caveat that mouse single-cell data does not provide statistically independent information across genes (for the same reason that adding data from independent human individuals would not provide statistically independent information across genes, given that human and mouse expression are partially correlated).
We acknowledge this caveat in the text (Discussion, page 17, 2nd paragraph, lines 8-11).
Reviewer #3 (Public Review):
The authors describe the method, PrEDiCT, which helps identify disease affected cell types based on gene sets. As I understand it, the method is based on finding which "disease genes" (from an annotation) are relatively highly expressed. The idea is nice, however, I have concerns about how "significance" is assessed and the relative controls.
Overall, I find the idea interesting, but the execution raises some concerns.
- From a causal perspective, there is an association of high expression of these genes within these cell types, but without also assessing individuals with those specific diseases, I do not it is fair to say "disease affected" cell types. It is possible that these genes might behave completely fine but are highly expressed in those cell types while being affected another in other cell types.
We agree with the reviewer. We changed the terminology to "likely disease-affected cell types” and added this caveat to the Discussion, page 16, 2nd paragraph.
- It is unclear to me what the "null" comparison is in the method and if there is one. For example, by chance, would I expect this gene to be highly expressed because other genes are also highly expressed in this cell type? Some way to assess "significance" or "enrichment" beyond simply using ranks and thresholds would be helpful in deciding whether these associations are robust.
We revised the procedure for assessing statistical significance to include permutation tests. Specifically, given a disease D with n disease-associated genes, the null hypothesis was that the PrEDiCT score of these genes is not significantly different from the PrEDiCT score of a random set of n genes. To test this, we randomly selected n genes expressed in any cell type, and computed the PrEDiCT score for this random gene set in each cell type of the disease-affected tissue (referred to as ‘random score’). We repeated this procedure 1,000 times, resulting in 1,000 random scores per disease and cell type. The p-value of the PrEDiCT score of disease D in cell type c was set to the fraction of random scores in c that were at least as high as the original PrEDiCT score of D in c. The acquired p-values were adjusted for multiple hypothesis testing per disease using the Benjamini-Hochberg procedure. To increase stringency, we treated only statistically significant disease–cell-type pairs with PrEDiCT score≥1 as 'likely affected'. The procedure is detailed in Results, page 6, 1st paragraph; Methods, page 21-22, ‘PrEDiCT score calculation and significance assessment’; Figure 1–figure supplement 2. Additionally, we estimated type I error by using literature text-mining or expert curation (Results, page 7, 2nd paragraph; Methods, page 22, ‘Textmining of PubMed records’, and page 23, ‘Expert curation and assessment of disease-affected cell types’; Figure 1F and Figure 1–figure supplement 4A).
- Additionally, it is unclear to me, but I suspect that there are unequal cell numbers in the scores computed as well as between relevant tissues. This is related to point (2) above, but as a result, the estimates of the scores will inherently have different variances, thus making comparisons between them difficult/unreliable unless accounted for. If I understand correctly, the score is first the average expression within a tissue, then, the Z-score? If so, my comment applies.
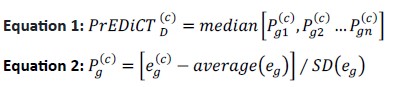
To clarify, the PrEDiCT score of a disease D in cell type c was set to the median preferential expression P of its disease genes (Equation 1 below). The preferential expression of each gene in c was computed as a Z-score, by comparing the average expression of the gene in c to its average expression in all cell types of the tissue, divided by the standard deviation (SD, Equation 2 below). Tissues indeed had unequal numbers of cell types, however, the distribution of PrEDiCT scores were similar between tissues (now in Supplementary File 13). We revised this part of Methods and added Equations 1 and 2 (Methods, page 21-22, ‘PrEDiCT score calculation and significance assessment’) and Supplementary File 13.
- There is a large set of work done in gene enrichment sets which appears to not be mentioned (e.g. GSEA and other works by the Price group). It would be helpful for the authors to summarize these methods and how their method differs.
We added work done in gene enrichment sets (including two relevant and recent studies from the Price group) and summarized these methods in the Introduction (page 2-3).
- Additionally, it should be noted that a caveat of this analysis is that the comparisons are all done only relative to the cell types sampled and the diseases which have Mendelian genes associated with them. I would expect these results to change, possibly drastically, if the sampled cell types and diseases were to be changed.
We agree with the reviewer and now discuss the generalizability of our results, relating to the extent of the sampled cell types (Discussion, page 18, 1st paragraph).
- Finally, I would appreciate a more detailed explanation in the methods of how the score is computed. Some equations and the data they are calculated from would be helpful here.
We now provide a detailed explanation of how the score and its statistical significance were computed and added Equations 1 and 2 (Methods, page 21-22, ‘PrEDiCT score calculation and significance assessment’).
In summary, the general idea is an interesting one, but I do think the issues above should be addressed to make the results convincing.
We thank the reviewer for the important feedback which helped us strengthen our analyses.
-
eLife assessment
The study presents analyses linking cell-types to monogenic disorders using over-expression of known disease-associated genes in single-cell data to identify 110 disease-affected cell types for 714 Mendelian diseases. Overall this important study combines multiple data analyses to quantify the connection between cell types and human disorders. While some of the analyses are compelling, updates to the method are needed to ensure that statistical inference is appropriately stringent and rigorous.
-
Reviewer #1 (Public Review):
The manuscript by Hekselman et al presents analyses linking cell-types to monogenic disorders using over-expression of monogenic disease genes as the signal. The manuscript analyses data from 6 tissues (bone marrow, lung, muscle, spleen, tongue and trachea) together with ~1,000 rare diseases from OMIM (with ~2,000 associated genes) to identify cell-type of interest for specific disease of choice. The signal used by the approach is the relative expression of OMIM-genes in a particular cell type relative to the expression of the gene in the tissue of interest identifying cell-type-disease pairs that are then investigated through literature review and recapitulated using mouse expression. A potentially interesting finding is that disease genes manifesting in multiple tissues seem to hit same cell-types. Overall …
Reviewer #1 (Public Review):
The manuscript by Hekselman et al presents analyses linking cell-types to monogenic disorders using over-expression of monogenic disease genes as the signal. The manuscript analyses data from 6 tissues (bone marrow, lung, muscle, spleen, tongue and trachea) together with ~1,000 rare diseases from OMIM (with ~2,000 associated genes) to identify cell-type of interest for specific disease of choice. The signal used by the approach is the relative expression of OMIM-genes in a particular cell type relative to the expression of the gene in the tissue of interest identifying cell-type-disease pairs that are then investigated through literature review and recapitulated using mouse expression. A potentially interesting finding is that disease genes manifesting in multiple tissues seem to hit same cell-types. Overall this important study combines multiple data analyses to quantify the connection between cell types and human disorders. However whereas some of the analyses are compelling, the statistical analyses are incomplete as they don't provide full treatment of type I error.
-
Reviewer #2 (Public Review):
This study identifies 110 disease-affected cell types for 714 Mendelian diseases, based on preferential expression of known disease-associated genes in single-cell data. It is likely that many or most of the results are real, and the results are biologically interesting and provide a valuable resource. However, updates to the method are needed to ensure that inference of statistical significance is appropriately stringent and rigorous.
Strengths: a systematic evaluation of disease-affected cell types across Mendelian diseases is a valuable addition to the literature, complementing systematic evaluations of common disease and targeted analyses of individual Mendelian diseases. The validation via excess overlap with disease-cell type pairs from literature co-appearance provides compelling evidence that many or …
Reviewer #2 (Public Review):
This study identifies 110 disease-affected cell types for 714 Mendelian diseases, based on preferential expression of known disease-associated genes in single-cell data. It is likely that many or most of the results are real, and the results are biologically interesting and provide a valuable resource. However, updates to the method are needed to ensure that inference of statistical significance is appropriately stringent and rigorous.
Strengths: a systematic evaluation of disease-affected cell types across Mendelian diseases is a valuable addition to the literature, complementing systematic evaluations of common disease and targeted analyses of individual Mendelian diseases. The validation via excess overlap with disease-cell type pairs from literature co-appearance provides compelling evidence that many or most of the results are real. In addition, many of the results are biologically interesting. In particular, it is interesting that diseases with multiple affected tissues tend to affect similar cell types in the respective tissues.
Limitations: the main limitation of the study is that, although many or most of the results are likely to be real, the criteria for statistical significance is probably not stringent enough, and is not well-justified. For diseases with only 1 disease-associated gene, the threshold is a z-score>2 for preferential expression in the cell type, but this threshold is likely to be often exceeded by chance. (For diseases with many disease-associated genes, the threshold is a median (across genes) z-score>2 for preferential expression in the cell type, which is less likely to occur by chance but still an arbitrary threshold.) Thus, there is a good chance that a sizable proportion of the reported disease-affected cell types might be false positives. The best solution would be to assess statistical significance via empirical comparison with results for non-disease-associated control genes, and assess the statistical significance of the resulting P-values using FDR.
The re-analysis using mouse single-cell data adds an interesting additional dimension to the study, with the small caveat that mouse single-cell data does not provide statistically independent information across genes (for the same reason that adding data from independent human individuals would not provide statistically independent information across genes, given that human and mouse expression are partially correlated).
-
Reviewer #3 (Public Review):
The authors describe the method, PrEDiCT, which helps identify disease affected cell types based on gene sets. As I understand it, the method is based on finding which "disease genes" (from an annotation) are relatively highly expressed. The idea is nice, however, I have concerns about how "significance" is assessed and the relative controls.
Overall, I find the idea interesting, but the execution raises some concerns.
1. From a causal perspective, there is an association of high expression of these genes within these cell types, but without also assessing individuals with those specific diseases, I do not it is fair to say "disease affected" cell types. It is possible that these genes might behave completely fine but are highly expressed in those cell types while being affected another in other cell types.
2…
Reviewer #3 (Public Review):
The authors describe the method, PrEDiCT, which helps identify disease affected cell types based on gene sets. As I understand it, the method is based on finding which "disease genes" (from an annotation) are relatively highly expressed. The idea is nice, however, I have concerns about how "significance" is assessed and the relative controls.
Overall, I find the idea interesting, but the execution raises some concerns.
1. From a causal perspective, there is an association of high expression of these genes within these cell types, but without also assessing individuals with those specific diseases, I do not it is fair to say "disease affected" cell types. It is possible that these genes might behave completely fine but are highly expressed in those cell types while being affected another in other cell types.
2. It is unclear to me what the "null" comparison is in the method and if there is one. For example, by chance, would I expect this gene to be highly expressed because other genes are also highly expressed in this cell type? Some way to assess "significance" or "enrichment" beyond simply using ranks and thresholds would be helpful in deciding whether these associations are robust.
3. Additionally, it is unclear to me, but I suspect that there are unequal cell numbers in the scores computed as well as between relevant tissues. This is related to point (2) above, but as a result, the estimates of the scores will inherently have different variances, thus making comparisons between them difficult/unreliable unless accounted for. If I understand correctly, the score is first the average expression within a tissue, _then_, the Z-score? If so, my comment applies.
4. There is a large set of work done in gene enrichment sets which appears to not be mentioned (e.g. GSEA and other works by the Price group). It would be helpful for the authors to summarize these methods and how their method differs.
5. Additionally, it should be noted that a caveat of this analysis is that the comparisons are all done only relative to the cell types sampled and the diseases which have Mendelian genes associated with them. I would expect these results to change, possibly drastically, if the sampled cell types and diseases were to be changed.
6. Finally, I would appreciate a more detailed explanation in the methods of how the score is computed. Some equations and the data they are calculated from would be helpful here.
In summary, the general idea is an interesting one, but I do think the issues above should be addressed to make the results convincing.
-
