Modulation of brain signal variability in visual cortex reflects aging, GABA, and behavior
Curation statements for this article:-
Curated by eLife

eLife assessment
This important study combines across multiple complementary neuroscientific methods to understand the neural response to visual stimulus complexity in the human brain across lifespan. Lalwani et al., provide solid evidence, drawing from appropriate and validated methodology. A weakness is that key information about methodological details and controls is still outstanding, as is a discussion on how generalizable the findings are. With these elements strengthened, the study would be of broad interest to neuroscientists and biologists interested in aging and sensory processing.
This article has been Reviewed by the following groups
Discuss this preprint
Start a discussion What are Sciety discussions?Listed in
- Evaluated articles (eLife)
Abstract
Moment-to-moment neural variability has been shown to scale positively with the complexity of stimulus input. However, the mechanisms underlying the ability to align variability to input complexity are unknown. Using a combination of behavioral methods, computational modeling, fMRI, MR spectroscopy, and pharmacological intervention, we investigated the role of aging and GABA in neural variability during visual processing. We replicated previous findings that participants expressed higher variability when viewing more complex visual stimuli. Additionally, we found that such variability modulation was associated with higher baseline visual GABA levels and was reduced in older adults. When pharmacologically increasing GABA activity, we found that participants with lower baseline GABA levels showed a drug-related increase in variability modulation while participants with higher baseline GABA showed no change or even a reduction, consistent with an inverted-U account. Finally, higher baseline GABA and variability modulation were jointly associated with better visual-discrimination performance. These results suggest that GABA plays an important role in how humans utilize neural variability to adapt to the complexity of the visual world.
Article activity feed
-

-

Author response:
Reviewer #1 (Public Review):
How does the brain respond to the input of different complexity, and does this ability to respond change with age?
The study by Lalwani et al. tried to address this question by pulling together a number of neuroscientific methodologies (fMRI, MRS, drug challenge, perceptual psychophysics). A major strength of the paper is that it is backed up by robust sample sizes and careful choices in data analysis, translating into a more rigorous understanding of the sensory input as well as the neural metric. The authors apply a novel analysis method developed in human resting-state MRI data on task-based data in the visual cortex, specifically investigating the variability of neural response to stimuli of different levels of visual complexity. A subset of participants took part in a …
Author response:
Reviewer #1 (Public Review):
How does the brain respond to the input of different complexity, and does this ability to respond change with age?
The study by Lalwani et al. tried to address this question by pulling together a number of neuroscientific methodologies (fMRI, MRS, drug challenge, perceptual psychophysics). A major strength of the paper is that it is backed up by robust sample sizes and careful choices in data analysis, translating into a more rigorous understanding of the sensory input as well as the neural metric. The authors apply a novel analysis method developed in human resting-state MRI data on task-based data in the visual cortex, specifically investigating the variability of neural response to stimuli of different levels of visual complexity. A subset of participants took part in a placebo-controlled drug challenge and functional neuroimaging. This experiment showed that increases in GABA have differential effects on participants with different baseline levels of GABA in the visual cortex, possibly modulating the perceptual performance in those with lower baseline GABA. A caveat is that no single cohort has taken part in all study elements, ie visual discrimination with drug challenge and neuroimaging. Hence the causal relationship is limited to the neural variability measure and does not extend to visual performance. Nevertheless, the consistent use of visual stimuli across approaches permits an exceptionally high level of comparability across (computational, behavioural, and fMRI are drawing from the same set of images) modalities. The conclusions that can be made on such a coherent data set are strong.
The community will benefit from the technical advances, esp. the calculation of BOLD variability, in the study when described appropriately, encouraging further linkage between complementary measures of brain activity, neurochemistry, and signal processing.
Thank you for your review. We agree that a future study with a single cohort would be an excellent follow-up.
Reviewer #2 (Public Review):
Lalwani et al. measured BOLD variability during the viewing of houses and faces in groups of young and old healthy adults and measured ventrovisual cortex GABA+ at rest using MR spectroscopy. The influence of the GABA-A agonist lorazepam on BOLD variability during task performance was also assessed, and baseline GABA+ levels were considered as a mediating variable. The relationship of local GABA to changes in variability in BOLD signal, and how both properties change with age, are important and interesting questions. The authors feature the following results: 1) younger adults exhibit greater task-dependent changes in BOLD variability and higher resting visual cortical GABA+ content than older adults, 2) greater BOLD variability scales with GABA+ levels across the combined age groups, 3) administration of a GABA-A agonist increased condition differences in BOLD variability in individuals with lower baseline GABA+ levels but decreased condition differences in BOLD variability in individuals with higher baseline GABA+ levels, and 4) resting GABA+ levels correlated with a measure of visual sensory ability derived from a set of discrimination tasks that incorporated a variety of stimulus categories.
Strengths of the study design include the pharmacological manipulation for gauging a possible causal relationship between GABA activity and task-related adjustments in BOLD variability. The consideration of baseline GABA+ levels for interpreting this relationship is particularly valuable. The assessment of feature-richness across multiple visual stimulus categories provided support for the use of a single visual sensory factor score to examine individual differences in behavioral performance relative to age, GABA, and BOLD measurements.
Weaknesses of the study include the absence of an interpretation of the physiological mechanisms that contribute to variability in BOLD signal, particularly for the chosen contrast that compared viewing houses with viewing faces.
Whether any of the observed effects can be explained by patterns in mean BOLD signal, independent of variability would be useful to know.
One of the first pre-processing steps of computing SDBOLD involves subtracting the block-mean from the fMRI signal for each task-condition. Therefore, patterns observed in BOLD signal variability are not driven by the mean-BOLD differences. Moreover, as noted above, to further confirm this, we performed additional mean-BOLD based analysis (See Supplementary Materials Pg 3). Results suggest that ∆⃗ MEANBOLD is actually larger in older adults vs. younger adults (∆⃗ SDBOLD exhibited the opposite pattern), but more importantly ∆⃗ MEANBOLD is not correlated with GABA or with visual performance. This is also consistent with prior research (Garrett et.al. 2011, 2013, 2015, 2020) that found MEANBOLD to be relatively insensitive to behavioral performance.
The positive correlation between resting GABA+ levels and the task-condition effect on BOLD variability reaches significance at the total group level, when the young and old groups are combined, but not separately within each group. This correlation may be explained by age-related differences since younger adults had higher values than older adults for both types of measurements. This is not to suggest that the relationship is not meaningful or interesting, but that it may be conceptualized differently than presented.
Thank you for this important point. The relationship between GABA and ∆⃗ SDBOLD shown in Figure 3 is also significant within each age-group separately (Line 386-388). The model used both age-group and GABA as predictors of ∆⃗ SDBOLD and found that both had a significant effect, while the Age-group x GABA interaction was not significant. The effect of age on ∆⃗ SDBOLD therefore does not completely explain the observed relationship between GABA and ∆⃗ SDBOLD because this latter effect is significant in both age-groups individually and in the whole sample even when variance explained by age is accounted for. The revision clarifies this important point (Ln 488-492). Thanks for raising it.
Two separate dosages of lorazepam were used across individuals, but the details of why and how this was done are not provided, and the possible effects of the dose are not considered.
Good point. We utilized two dosages to maximize our chances of finding a dosage that had a robust effect. The specific dosage was randomly assigned across participants and the dosage did not differ across age-groups or baseline GABA levels. We also controlled for the drug-dosage when examining the role of drug-related shift in ∆⃗ SDBOLD. We have clarified these points in the revision and highlighted the analysis that found no effect of dosage on drug-related shift in ∆⃗ SDBOLD (Line 407-418).
The observation of greater BOLD variability during the viewing of houses than faces may be specific to these two behavioral conditions, and lingering questions about whether these effects generalize to other types of visual stimuli, or other non-visual behaviors, in old and young adults, limit the generalizability of the immediate findings.
We agree that examining the factors that influence BOLD variability is an important topic for future research. In particular, although it is increasingly well known that variability modulation itself can occur in a host of different tasks and research contexts across the lifespan (see Garrett et al., 2013 Waschke et al., 2021), to address the question of whether variability modulation occurs directly in response to stimulus complexity in general, it will be important for future work to examine a range of stimulus categories beyond faces and houses. Doing so is indeed an active area of research in Dr. Garrett’s group, where visual stimuli from many different categories are examined (e.g., for a recent approach, see Waschke et.al.,2023 (biorxiv)). Regardless, only face and house stimuli were available in the current dataset. We therefore exploited the finding that BOLD variability tends to be larger for house stimuli than for face stimuli (in line with the HMAX model output) to demonstrate that the degree to which a given individual modulates BOLD variability in response to stimulus category is related to their age, to GABA levels, and to behavioral performance.
The observed age-related differences in patterns of BOLD activity and ventrovisual cortex GABA+ levels along with the investigation of GABA-agonist effects in the context of baseline GABA+ levels are particularly valuable to the field, and merit follow-up. Assessing background neurochemical levels is generally important for understanding individualized drug effects. Therefore, the data are particularly useful in the fields of aging, neuroimaging, and vision research.
Thank you, we agree!
Reviewer #3 (Public Review):
The role of neural variability in various cognitive functions is one of the focal contentions in systems and computational neuroscience. In this study, the authors used a largescale cohort dataset to investigate the relationship between neural variability measured by fMRI and several factors, including stimulus complexity, GABA levels, aging, and visual performance. Such investigations are valuable because neural variability, as an important topic, is by far mostly studied within animal neurophysiology. There is little evidence in humans. Also, the conclusions are built on a large-scale cohort dataset that includes multi-model data. Such a dataset per se is a big advantage. Pharmacological manipulations and MRS acquisitions are rare in this line of research. Overall, I think this study is well-designed, and the manuscript reads well. I listed my comments below and hope my suggestions can further improve the paper.
Strength:
1). The study design is astonishingly rich. The authors used task-based fMRI, MRS technique, population contrast (aging vs. control), and psychophysical testing. I appreciate the motivation and efforts for collecting such a rich dataset.
- The MRS part is good. I am not an expert in MRS so cannot comment on MRS data acquisition and analyses. But I think linking neural variability to GABA in humans is in general a good idea. There has been a long interest in the cause of neural variability, and inhibition of local neural circuits has been hypothesized as one of the key factors. 3. The pharmacological manipulation is particularly interesting as it provides at least evidence for the causal effects of GABA and deltaSDBOLD. I think this is quite novel.
Weakness:
- I am concerned about the definition of neural variability. In electrophysiological studies, neural variability can be defined as Poisson-like spike count variability. In the fMRI world, however, there is no consensus on what neural variability is. There are at least three definitions. One is the variability (e.g., std) of the voxel response time series as used here and in the resting fMRI world. The second is to regress out the stimulusevoked activation and only calculate the std of residuals (e.g., background variability). The third is to calculate variability of trial-by-trial variability of beta estimates of general linear modeling. It currently remains unclear the relations between these three types of variability with other factors. It also remains unclear the links between neuronal variability and voxel variability. I don't think the computational principles discovered in neuronal variability also apply to voxel responses. I hope the authors can acknowledge their differences and discuss their differences.
These are very important points, thank you for raising them. Although we agree that the majority of the single cell electrophysiology world indeed seems to prefer Poisson-like spiking variability as an easy and tractable estimate, it is certainly not the only variability approach in that field (e.g., entropy; see our most recent work in humans where spiking entropy outperforms simple spike counts to predict memory performance; Waschke et al., 2023, bioRxiv). In LFP, EEG/MEG and fMRI, there is indeed no singular consensus on what variability “is”, and in our opinion, that is a good thing. We have reported at length in past work about entire families of measures of signal variability, from simple variance, to power, to entropy, and beyond (see Table 1 in Waschke et al, 2021, Neuron). In principle, these measures are quite complementary, obviating the need to establish any single-measure consensus per se. Rather than viewing the three measures of neural variability that the reviewer mentioned as competing definitions, we prefer to view them as different sources of variance. For example, from each of the three sources of variance the reviewer suggests, any number of variability measures could be computed.
The current study focuses on using the standard deviation of concatenated blocked time series separately for face and house viewing conditions (this is the same estimation approach used in our very earliest studies on signal variability; Garrett et al., 2010, JNeurosci). In those early studies, and nearly every one thereafter (see Waschke et al., 2021, Neuron), there is no ostensible link between SDBOLD (as we normaly compute it) and average BOLD from either multivariate or GLM models; as such, we do not find any clear difference in SDBOLD results whether or not average “evoked” responses are removed or not in past work. This is perhaps also why removing ERPs from EEG time series rarely influences estimates of variability in our work (e.g., Kloosterman et al., 2020, eLife).
The third definition the reviewer notes refers to variability of beta estimates over trials. Our most recent work has done exactly this (e.g., Skowron et al., 2023, bioRxiv), calculating the SD even over single time point-wise beta estimates so that we may better control the extraction of time points prior to variability estimation. Although direct comparisons have not yet been published by us, variability over single TR beta estimates and variability over the time series without beta estimation are very highly correlated in our work (in the .80 range; e.g., Kloosterman et al., in prep).
Re: the reviewer’s point that “It also remains unclear the links between neuronal variability and voxel variability. I don’t think the computational principles discovered in neuronal variability also apply to voxel responses. I hope the authors can acknowledge their differences and discuss their differences.” If we understand correctly, the reviewer maybe asking about within-person links between single-cell neuronal variability (to allow Poisson-like spiking variability) and voxel variability in fMRI? No such study has been conducted to date to our knowledge (such data almost don’t exist). Or rather, perhaps the reviewer is noting a more general point regarding the “computational principles” of variability in these different domains? If that is true, then a few points are worth noting. First, there is absolutely no expectation of Poisson distributions in continuous brain imaging-based time series (LFP, E/MEG, fMRI). To our knowledge, such distributions (which have equivalent means and variances, allowing e.g., Fano factors to be estimated) are mathematically possible in spiking because of the binary nature of spikes; when mean rates rise, so too do variances given that activity pushes away from the floor (of no activity). In continuous time signals, there is no effective “zero”, so a mathematical floor does not exist outright. This is likely why means and variances are not well coupled in continuous time signals (see Garrett et al., 2013, NBR; Waschke et al., 2021, Neuron); anything can happen. Regardless, convergence is beginning to be revealed between the effects noted from spiking and continuous time estimates of variability. For example, we show that spiking variability can show a similar, behaviourally relevant coupling to the complexity of visual input (Waschke et al., 2023, bioRxiv) as seen in the current study and in past work (e.g., Garrett et al., 2020, NeuroImage). Whether such convergence reflects common computational principles of variability remains to be seen in future work, despite known associations between single cell recordings and BOLD overall (e.g., Logothetis and colleagues, 2001, 2002, 2004, 2008).
Given the intricacies of these arguments, we don’t currently include this discussion in the revised text. However, we would be happy to include aspects of this content in the main paper if the reviewer sees fit.
- If I understand it correctly, the positive relationship between stimulus complexity and voxel variability has been found in the author's previous work. Thus, the claims in the abstract in lines 14-15, and section 1 in results are exaggerated. The results simply replicate the findings in the previous work. This should be clearly stated.
Good point. Since this finding was a replication and an extension, we reported these results mostly in the supplementary materials. The stimulus set used for the current study is different than Garrett et.al. 2020 and therefore a replication is important. Moreover, we have extended these findings across young and older adults (previous work was based on older adults alone). We have modified the text to clarify what is a replication and what part are extension/novel about the current study now (Line 14, 345 and 467). Thanks for the suggestion.
- It is difficult for me to comprehend the U-shaped account of baseline GABA and shift in deltaSDBOLD. If deltaSDBOLD per se is good, as evidenced by the positive relationship between brainscore and visual sensitivity as shown in Fig. 5b and the discussion in lines 432-440, why the brain should decrease deltaSDBOLD ?? or did I miss something? I understand that "average is good, outliers are bad". But a more detailed theory is needed to account for such effects.
When GABA levels are increased beyond optimal levels, neuronal firing rates are reduced, effectively dampening neural activity and limiting dynamic range; in the present study, this resulted in reduced ∆⃗ SDBOLD. Thus, the observed drug-related decrease in ∆⃗ SDBOLD was most present in participants with already high levels of GABA. We have now added an explanation for the expected inverted-U (Line 523-546). The following figure tries to explain this with a hypothetical curve diagram and how different parts of Fig 4 might be linked to different points in such a curve.
Author response image 1.
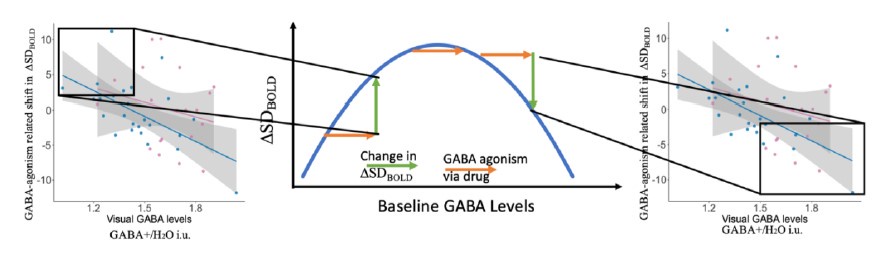
Line 523-546 – “We found in humans that the drug-related shift in ∆⃗ SDBOLD could be either positive or negative, while being negatively related to baseline GABA. Thus, boosting GABA activity with drug during visual processing in participants with lower baseline GABA levels and low levels of ∆⃗ SDBOLD resulted in an increase in ∆⃗ SDBOLD (i.e., a positive change in ∆⃗ SDBOLD on drug compared to off drug). However, in participants with higher baseline GABA levels and higher ∆⃗ SDBOLD, when GABA was increased presumably beyond optimal levels, participants experienced no-change or even a decrease in∆⃗ SDBOLD on drug. These findings thus provide the first evidence in humans for an inverted-U account of how GABA may link to variability modulation.
Boosting low GABA levels in older adults helps increase ∆⃗ SDBOLD, but why does increasing GABA levels lead to reduced ∆⃗ SDBOLD in others? One explanation is that higher than optimal levels of inhibition in a neuronal system can lead to dampening of the entire network. The reduced neuronal firing decreases the number of states the network can visit and decreases the dynamic range of the network. Indeed, some anesthetics work by increasing GABA activity (for example propofol a general anesthetic modulates activity at GABAA receptors) and GABA is known for its sedative properties. Previous research showed that propofol leads to a steeper power spectral slope (a measure of the “construction” of signal variance) in monkey ECoG recordings (Gao et al., 2017). Networks function optimally only when dynamics are stabilized by sufficient inhibition. Thus, there is an inverted-U relationship between ∆⃗ SDBOLD and GABA that is similar to that observed with other neurotransmitters.”
- Related to the 3rd question, can you show the relationship between the shift of deltaSDBOLD (i.e., the delta of deltaSDBOLD) and visual performance?
We did not have data on visual performance from the same participants that completed the drug-based part of the study (Subset1 vs 3; see Figure 1); therefore, we unfortunately cannot directly investigate the relationship between the drug-related shift of ∆⃗ SDBOLD and visual performance. We have now highlighted that this as a limitation of the current study (Line 589-592), where we state: One limitation of the current study is that participants who received the drug-manipulation did not complete the visual discrimination task, thus we could not directly assess how the drug-related change in ∆⃗ SDBOLD impacted visual performance.
- Are the dataset openly available?? I didn't find the data availability statement.
An excel-sheet with all the processed data to reproduce figures and results has been included in source data submitted along with the manuscript along with a data dictionary key for various columns. The raw MRI, MRS and fMRI data used in the current manuscript was collected as a part of a larger (MIND) study and will eventually be made publicly available on completion of the study (around 2027). Before that time, the raw data can be obtained for research purposes upon reasonable request. Processing code will be made available on GitHub.
-
eLife assessment
This important study combines across multiple complementary neuroscientific methods to understand the neural response to visual stimulus complexity in the human brain across lifespan. Lalwani et al., provide solid evidence, drawing from appropriate and validated methodology. A weakness is that key information about methodological details and controls is still outstanding, as is a discussion on how generalizable the findings are. With these elements strengthened, the study would be of broad interest to neuroscientists and biologists interested in aging and sensory processing.
-
Reviewer #1 (Public Review):
How does the brain respond to the input of different complexity, and does this ability to respond change with age?
The study by Lalwani et al. tried to address this question by pulling together a number of neuroscientific methodologies (fMRI, MRS, drug challenge, perceptual psychophysics). A major strength of the paper is that it is backed up by robust sample sizes and careful choices in data analysis, translating into a more rigorous understanding of the sensory input as well as the neural metric. The authors apply a novel analysis method developed in human resting-state MRI data on task-based data in the visual cortex, specifically investigating the variability of neural response to stimuli of different levels of visual complexity. A subset of participants took part in a placebo-controlled drug challenge …
Reviewer #1 (Public Review):
How does the brain respond to the input of different complexity, and does this ability to respond change with age?
The study by Lalwani et al. tried to address this question by pulling together a number of neuroscientific methodologies (fMRI, MRS, drug challenge, perceptual psychophysics). A major strength of the paper is that it is backed up by robust sample sizes and careful choices in data analysis, translating into a more rigorous understanding of the sensory input as well as the neural metric. The authors apply a novel analysis method developed in human resting-state MRI data on task-based data in the visual cortex, specifically investigating the variability of neural response to stimuli of different levels of visual complexity. A subset of participants took part in a placebo-controlled drug challenge and functional neuroimaging. This experiment showed that increases in GABA have differential effects on participants with different baseline levels of GABA in the visual cortex, possibly modulating the perceptual performance in those with lower baseline GABA. A caveat is that no single cohort has taken part in all study elements, ie visual discrimination with drug challenge and neuroimaging. Hence the causal relationship is limited to the neural variability measure and does not extend to visual performance. Nevertheless, the consistent use of visual stimuli across approaches permits an exceptionally high level of comparability across (computational, behavioural, and fMRI are drawing from the same set of images) modalities. The conclusions that can be made on such a coherent data set are strong.
The community will benefit from the technical advances, esp. the calculation of BOLD variability, in the study when described appropriately, encouraging further linkage between complementary measures of brain activity, neurochemistry, and signal processing.
-
Reviewer #2 (Public Review):
Lalwani et al. measured BOLD variability during the viewing of houses and faces in groups of young and old healthy adults and measured ventrovisual cortex GABA+ at rest using MR spectroscopy. The influence of the GABA-A agonist lorazepam on BOLD variability during task performance was also assessed, and baseline GABA+ levels were considered as a mediating variable. The relationship of local GABA to changes in variability in BOLD signal, and how both properties change with age, are important and interesting questions. The authors feature the following results: 1) younger adults exhibit greater task-dependent changes in BOLD variability and higher resting visual cortical GABA+ content than older adults, 2) greater BOLD variability scales with GABA+ levels across the combined age groups, 3) administration of a …
Reviewer #2 (Public Review):
Lalwani et al. measured BOLD variability during the viewing of houses and faces in groups of young and old healthy adults and measured ventrovisual cortex GABA+ at rest using MR spectroscopy. The influence of the GABA-A agonist lorazepam on BOLD variability during task performance was also assessed, and baseline GABA+ levels were considered as a mediating variable. The relationship of local GABA to changes in variability in BOLD signal, and how both properties change with age, are important and interesting questions. The authors feature the following results: 1) younger adults exhibit greater task-dependent changes in BOLD variability and higher resting visual cortical GABA+ content than older adults, 2) greater BOLD variability scales with GABA+ levels across the combined age groups, 3) administration of a GABA-A agonist increased condition differences in BOLD variability in individuals with lower baseline GABA+ levels but decreased condition differences in BOLD variability in individuals with higher baseline GABA+ levels, and 4) resting GABA+ levels correlated with a measure of visual sensory ability derived from a set of discrimination tasks that incorporated a variety of stimulus categories.
Strengths of the study design include the pharmacological manipulation for gauging a possible causal relationship between GABA activity and task-related adjustments in BOLD variability. The consideration of baseline GABA+ levels for interpreting this relationship is particularly valuable. The assessment of feature-richness across multiple visual stimulus categories provided support for the use of a single visual sensory factor score to examine individual differences in behavioral performance relative to age, GABA, and BOLD measurements. Weaknesses of the study include the absence of an interpretation of the physiological mechanisms that contribute to variability in BOLD signal, particularly for the chosen contrast that compared viewing houses with viewing faces. Whether any of the observed effects can be explained by patterns in mean BOLD signal, independent of variability would be useful to know. The positive correlation between resting GABA+ levels and the task-condition effect on BOLD variability reaches significance at the total group level, when the young and old groups are combined, but not separately within each group. This correlation may be explained by age-related differences since younger adults had higher values than older adults for both types of measurements. This is not to suggest that the relationship is not meaningful or interesting, but that it may be conceptualized differently than presented. Two separate dosages of lorazepam were used across individuals, but the details of why and how this was done are not provided, and the possible effects of the dose are not considered. The observation of greater BOLD variability during the viewing of houses than faces may be specific to these two behavioral conditions, and lingering questions about whether these effects generalize to other types of visual stimuli, or other non-visual behaviors, in old and young adults, limit the generalizability of the immediate findings.
The observed age-related differences in patterns of BOLD activity and ventrovisual cortex GABA+ levels along with the investigation of GABA-agonist effects in the context of baseline GABA+ levels are particularly valuable to the field, and merit follow-up. Assessing background neurochemical levels is generally important for understanding individualized drug effects. Therefore, the data are particularly useful in the fields of aging, neuroimaging, and vision research.
-
Reviewer #3 (Public Review):
The role of neural variability in various cognitive functions is one of the focal contentions in systems and computational neuroscience. In this study, the authors used a large-scale cohort dataset to investigate the relationship between neural variability measured by fMRI and several factors, including stimulus complexity, GABA levels, aging, and visual performance. Such investigations are valuable because neural variability, as an important topic, is by far mostly studied within animal neurophysiology. There is little evidence in humans. Also, the conclusions are built on a large-scale cohort dataset that includes multi-model data. Such a dataset per se is a big advantage. Pharmacological manipulations and MRS acquisitions are rare in this line of research. Overall, I think this study is well-designed, and …
Reviewer #3 (Public Review):
The role of neural variability in various cognitive functions is one of the focal contentions in systems and computational neuroscience. In this study, the authors used a large-scale cohort dataset to investigate the relationship between neural variability measured by fMRI and several factors, including stimulus complexity, GABA levels, aging, and visual performance. Such investigations are valuable because neural variability, as an important topic, is by far mostly studied within animal neurophysiology. There is little evidence in humans. Also, the conclusions are built on a large-scale cohort dataset that includes multi-model data. Such a dataset per se is a big advantage. Pharmacological manipulations and MRS acquisitions are rare in this line of research. Overall, I think this study is well-designed, and the manuscript reads well. I listed my comments below and hope my suggestions can further improve the paper.
Strength:
(1) The study design is astonishingly rich. The authors used task-based fMRI, MRS technique, population contrast (aging vs. control), and psychophysical testing. I appreciate the motivation and efforts for collecting such a rich dataset.
(2) The MRS part is good. I am not an expert in MRS so cannot comment on MRS data acquisition and analyses. But I think linking neural variability to GABA in humans is in general a good idea. There has been a long interest in the cause of neural variability, and inhibition of local neural circuits has been hypothesized as one of the key factors.
(3) The pharmacological manipulation is particularly interesting as it provides at least evidence for the causal effects of GABA and deltaSDBOLD. I think this is quite novel.Weakness:
(1) I am concerned about the definition of neural variability. In electrophysiological studies, neural variability can be defined as Poisson-like spike count variability. In the fMRI world, however, there is no consensus on what neural variability is. There are at least three definitions. One is the variability (e.g., std) of the voxel response time series as used here and in the resting fMRI world. The second is to regress out the stimulus-evoked activation and only calculate the std of residuals (e.g., background variability). The third is to calculate variability of trial-by-trial variability of beta estimates of general linear modeling. It currently remains unclear the relations between these three types of variability with other factors. It also remains unclear the links between neuronal variability and voxel variability. I don't think the computational principles discovered in neuronal variability also apply to voxel responses. I hope the authors can acknowledge their differences and discuss their differences.
(2) If I understand it correctly, the positive relationship between stimulus complexity and voxel variability has been found in the author's previous work. Thus, the claims in the abstract in lines 14-15, and section 1 in results are exaggerated. The results simply replicate the findings in the previous work. This should be clearly stated.
(3) It is difficult for me to comprehend the U-shaped account of baseline GABA and shift in deltaSDBOLD. If deltaSDBOLD per se is good, as evidenced by the positive relationship between brainscore and visual sensitivity as shown in Fig. 5b and the discussion in lines 432-440, why the brain should decrease deltaSDBOLD ?? or did I miss something? I understand that "average is good, outliers are bad". But a more detailed theory is needed to account for such effects.
(4) Related to the 3rd question, can you should the relationship between the shift of deltaSDBOLD (i.e., the delta of deltaSDBOLD) and visual performance?
(5) Are the dataset openly available ?? I didn't find the data availability statement. -
