The aperiodic exponent of subthalamic field potentials reflects excitation/inhibition balance in Parkinsonism
Curation statements for this article:-
Curated by eLife

eLife assessment
In this important manuscript the authors use a powerful cross-specifies approach and cutting-edge experimental methods to examine possible shifts in the excitatory and inhibitory balance in both an animal model of Parkinsonism and in human patients with Parkinson's disease. Their solid findings support such a shift, wherein untreated Parkinson's disease is characterized by excessive activity in the subthalamic nucleus. While a strong paper, there are concerns with some of the methodological choices and their implications.
This article has been Reviewed by the following groups
Discuss this preprint
Start a discussion What are Sciety discussions?Listed in
- Evaluated articles (eLife)
Abstract
Periodic features of neural time-series data, such as local field potentials (LFPs), are often quantified using power spectra. While the aperiodic exponent of spectra is typically disregarded, it is nevertheless modulated in a physiologically relevant manner and was recently hypothesised to reflect excitation/inhibition (E/I) balance in neuronal populations. Here, we used a cross-species in vivo electrophysiological approach to test the E/I hypothesis in the context of experimental and idiopathic Parkinsonism. We demonstrate in dopamine-depleted rats that aperiodic exponents and power at 30–100 Hz in subthalamic nucleus (STN) LFPs reflect defined changes in basal ganglia network activity; higher aperiodic exponents tally with lower levels of STN neuron firing and a balance tipped towards inhibition. Using STN-LFPs recorded from awake Parkinson’s patients, we show that higher exponents accompany dopaminergic medication and deep brain stimulation (DBS) of STN, consistent with untreated Parkinson’s manifesting as reduced inhibition and hyperactivity of STN. These results suggest that the aperiodic exponent of STN-LFPs in Parkinsonism reflects E/I balance and might be a candidate biomarker for adaptive DBS.
Article activity feed
-

-

Author Response
Reviewer #1 (Public Review):
This paper tests the hypothesis that 1/f exponent of LFP power spectrum reflects E-I balance in a rodent model and Parkinson's patients. The authors suggest that their findings fit with this hypothesis, but there are concerns about confirmation bias (elaborated on below) and potential methodological issues, despite the strength of incorporating data from both animal model and neurological patients.
First, the frequency band used to fit the 1/f exponent varies between experiments and analyses, inviting concerns about potentially cherry-picking the data to fit with the prior hypothesis. The frequency band used for fitting the exponent was 30-100 Hz in Experiment 1 (rodent model), 40-90 Hz in Experiment 2 (PD, levodopa), and 10-50 Hz in Experiment 3 (PD, DBS). Ad-hoc reasons were given to …
Author Response
Reviewer #1 (Public Review):
This paper tests the hypothesis that 1/f exponent of LFP power spectrum reflects E-I balance in a rodent model and Parkinson's patients. The authors suggest that their findings fit with this hypothesis, but there are concerns about confirmation bias (elaborated on below) and potential methodological issues, despite the strength of incorporating data from both animal model and neurological patients.
First, the frequency band used to fit the 1/f exponent varies between experiments and analyses, inviting concerns about potentially cherry-picking the data to fit with the prior hypothesis. The frequency band used for fitting the exponent was 30-100 Hz in Experiment 1 (rodent model), 40-90 Hz in Experiment 2 (PD, levodopa), and 10-50 Hz in Experiment 3 (PD, DBS). Ad-hoc reasons were given to justify these choices, such as " to avoid a spectral plateau starting > 50 Hz" in Experiment 3. However, at least in Experiment 3 (Fig. 3), if the frequency range was shifted to 1-10 Hz, the authors would have uncovered the opposite effect, where the exponent is smaller for DBS-on condition.
We agree that parameter choice is crucial, in particular, choice of the fitting range. In addition to the 40-90 Hz range (Figure 2C), we have performed aperiodic fitting for five other frequency ranges to test to what extent the reported results are sensitive to the selected frequency range (Figure S2A). This analysis showed that the results are robust when a broad frequency range from 30 to 95 Hz was chosen, which is consistent with what has been suggested by Gao et al., 2017 to make inferences on the E/I ratio.
Accordingly, we have now repeated the analyses for the animal data with the same fitting range used for the ON-OFF medication comparison in humans. Along with Figure S2A where different frequency ranges were tested for data used in Figure 2, this shows that the results in Figure 1 and 2 hold up with higher aperiodic exponents when STN spiking is low and vice versa. Therefore, a broad fitting range from 30 to 90 Hz (excluding harmonics of mains interference) generates consistent results for both human and animal data.
We opted against a fitting range from 1-10 Hz because of two restraints highlighted in Gerster et al., 2022. First, a fitting range starting at 1 Hz could have a larger y-intercept due to the presence of low-frequency oscillations. This could lead to a larger aperiodic exponent and could be misinterpreted as stronger neural inhibition. Therefore, the lower fitting bound should be chosen to best avoid known oscillations in the delta/theta range (Gerster et al., 2022). Second, frequencies should be chosen to avoid oscillations crossing fitting range limits. In Figure 3A, oscillations in the theta/alpha band both ON and OFF stimulation would complicate parameterisation and would likely result in spurious fits.
We also tested the effect of changing the peak threshold, peak width limits and the aperiodic fitting mode on FOOOF parameterisation. Increasing and decreasing the peak threshold from its default value (at 2 standard deviations) did not change results (Figure S2B). Similarly, adapting the peak width limits did not affect the exponent difference between medication states (Figure S2C). Finally, choosing the ‘knee’ mode instead of ‘fixed’ resulted in fundamentally different aperiodic fits that did not differ anymore with medication (Figure S2D). This is most likely a consequence of the near linear PSD in log-log space from 40 to 90 Hz (Figure 2B). If there is no bend in the PSD, the FOOOF algorithm will be forced to assign a ‘random’ knee and the aperiodic fit will then mostly reflect the slope of the spectrum above the knee point.
Second, there are important, fine-grained features in the spectra that are ignored in the analyses, which confounds the interpretation.
One salient example of this is Fig. 2, where based on the plots in B, one would expect that the power of beta-band oscillations to be higher in the Med-On condition, as the oscillatory peaks rise higher above the 1/f floor and reach the same amplitude level as the Med-OFF condition (in other words, similar total power is subtracted by a smaller 1/f power in the Med-ON condition). But this impression is opposite to the model-fitting results in C, where beta power is lower in the Med-ON condition.
We agree that PSDs over a broad frequency range (e.g. 5-90 Hz) typically do not have a single 1/f property. Instead, there can be multiple oscillatory peaks and ‘knees/bends’ in the aperiodic component. For these cases, fitting should be performed using the knee mode. To extract periodic beta power, we parameterise the PSD between 5 and 90 Hz and select the largest oscillatory component between 8 and 35 Hz (this range was extended to include the large oscillatory peaks in hemispheres 27 and 28 at ~ 10 Hz, see Figure R1). We now use the knee mode, to model the aperiodic component between 5 and 90 Hz when periodic beta power is calculated (see our previous comments). Figure R1 provides an overview of all PSDs ON and OFF medication, the aperiodic fits (5-90 Hz (knee) and 40-90 Hz (fixed)) and the detected beta peaks. In spite of this modification in our pipeline, periodic beta power is still larger OFF medication (Figure 2C), in keeping with previous studies (Kim et al., 2022; Kühn et al., 2006; Neumann et al., 2017; Ray et al., 2008). We acknowledge the reviewer’s point that the average spectra in Figure 2B are misleading in that respect and for clarity provide here all 30 spectra in both conditions. Note that the calculation of aperiodic exponents between 40 and 90 Hz is not affected by this change in our pipeline. Figures 2B, D+E were revised accordingly.
We have repeated the analysis of our animal data using the ‘knee mode’ with a fitting range from 30 to 100 Hz. However, using the knee mode did not improve the goodness of fit or fitting error and, in fact, made them slightly worse (Figure S5). Based on this, we think the fixed mode would provide a more holistic model for the PSDs used in this analysis. We have now added this comparison in Figure S5 to justify the choice of the fixed mode.
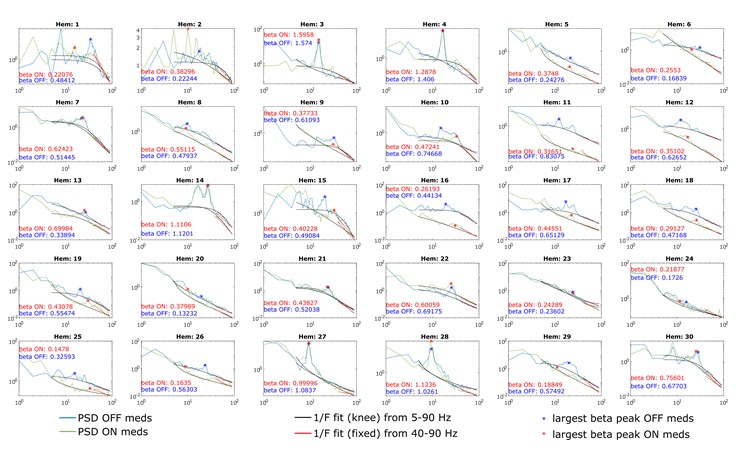
Figure R1. PSDs from all 30 hemispheres ON and OFF medication. Aperiodic fits are shown between 5-90 Hz (knee mode), which was used to calculate the power of beta peaks, and between 40-90 Hz (fixed mode), which was used to estimate the aperiodic exponent of the spectrum.
Another example is Fig. 1C, where the spectra for high and low STN spiking epochs are identical between 10 and 20 Hz, and the difference in higher frequency range could be well-explained by an overall increase of broadband gamma power (e.g. as observed in Manning et al., J Neurosci 2012, Ray & Maunsell PLoS Biol 2011). This increase of broadband gamma power is trivially expected, as broadband gamma power is tightly coupled with population spiking rate, which was used to define the two conditions.
We agree with the reviewer that in Figure 1C, high and low STN spiking states could well be separated by average gamma power (Figure 1E), too. However, the difference of aperiodic exponents is more prominent between both conditions (Figure 1D+E, based on p-values). What is more, in human LFP data recorded from clinical macroelectrodes, medication states can be reasonably well distinguished using the aperiodic exponent between 40-90 Hz (Figure 2C), but average gamma power does not separate both states (Figure S3A). This suggests that the aperiodic exponent reflects more than just power differences in the high gamma regions. In addition, power changes do not inevitably change the aperiodic exponent and vice versa as elaborated in (Donoghue et al., 2020).
Manning et al., 2009 show that the power spectrum is shifted to higher power values at all observed frequencies (2-150 Hz) as firing rates increase. As the reviewer points out, power spectra of our data are almost identical between 10-20 Hz (despite the marked spiking differences) and only drift apart from > 20 Hz (Figure 1C). This is a relevant difference between our study and Manning et al., 2009 and suggests that power differences in the gamma range are not solely explained by differences in spiking. This is confirmed when cortical activity at different spikes/sec is modelled (Miller et al., 2009). The entire spectrum is shifted to higher power values if spiking rates increase.
Ray & Maunsell, 2011 reported low (30-80 Hz) and high (> 80 Hz) gamma activity in the macaque visual cortex, with a positive correlation between spiking activity and high gamma activity. However, activities in the low gamma range (30-80 Hz), which largely overlaps with the frequency range in our study, does not necessarily correlate with firing rates.
In conclusion, the link between gamma power and spiking activity is not as strong as alluded. Even if the change in spiking activities can lead to changes of both gamma power and the aperiodic exponent, the aperiodic exponent would still constitute a measure to separate E/I levels and medication states.
The above consideration also speaks to a major weakness of the general approach of considering the 1/f spectrum a monolithic spectrum that can be captured by a single exponent. As the authors' Fig. 1C shows, there are distinct frequency regions within the 1/f spectrum that have different slopes. Indeed, this tripartite shape of the 1/f spectrum, including a "knee" feature around 40-70 Hz which is well visible here, was described in multiple previous papers (Miller et al., PLoS Comput Biol 2009; He et al., Neuron 2010), and have been successfully modeled with a neural network model using biologically plausible mechanisms (Chaudhuri et al., Cereb Cortex, 2017). The neglect of these fine-grained features confounds the authors' model fitting, because an overall increase in the broadband gamma power - which can be explained straightforwardly by the change in population firing rates - can result in the exponent, fit over a larger spectral frequency region, to decrease. However, this is not due to the exponent actually changing, but the overall increase of power in a specific sub-frequency-region of the broadband 1/f activity.
We have now used the knee mode for aperiodic fits between 5 and 90 Hz when periodic beta power is calculated. We agree that this broad frequency range is unlikely to have a single 1/f component.
We have also repeated the analysis of our animal data using the knee mode for aperiodic fits between 30 and 100 Hz (Figure S5). However, the goodness of fits had barely changed. In fact, the R2 and error become slightly worse. In addition, the knee parameter complicates interpretation of the aperiodic exponent and has to be considered along with the knee frequency. What is more, we do not see this bend around 40-70 Hz in all subjects. We show PSDs of representative LFP channels in Figure R2 and need to assert that the knee around 40-70 Hz is not a robust finding in our data set. Therefore, we chose the fixed mode for parameterisation within this frequency band.
Please see our answer to the previous comment regarding the link between broad gamma power and changes in population firing rates.
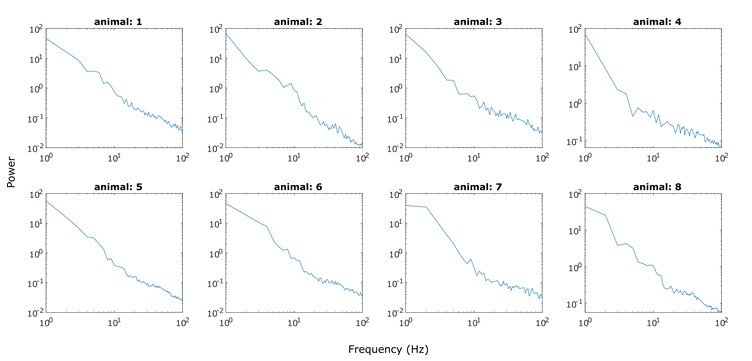
Figure R2. PSDs of representative PSD channels for each animal (data used in Figure 1C). The knee around 40-70 Hz is not a robust finding in all PSDs.
-
eLife assessment
In this important manuscript the authors use a powerful cross-specifies approach and cutting-edge experimental methods to examine possible shifts in the excitatory and inhibitory balance in both an animal model of Parkinsonism and in human patients with Parkinson's disease. Their solid findings support such a shift, wherein untreated Parkinson's disease is characterized by excessive activity in the subthalamic nucleus. While a strong paper, there are concerns with some of the methodological choices and their implications.
-
Reviewer #1 (Public Review):
This paper tests the hypothesis that 1/f exponent of LFP power spectrum reflects E-I balance in a rodent model and Parkinson's patients. The authors suggest that their findings fit with this hypothesis, but there are concerns about confirmation bias (elaborated on below) and potential methodological issues, despite the strength of incorporating data from both animal model and neurological patients.
First, the frequency band used to fit the 1/f exponent varies between experiments and analyses, inviting concerns about potentially cherry-picking the data to fit with the prior hypothesis. The frequency band used for fitting the exponent was 30-100 Hz in Experiment 1 (rodent model), 40-90 Hz in Experiment 2 (PD, levodopa), and 10-50 Hz in Experiment 3 (PD, DBS). Ad-hoc reasons were given to justify these choices, …
Reviewer #1 (Public Review):
This paper tests the hypothesis that 1/f exponent of LFP power spectrum reflects E-I balance in a rodent model and Parkinson's patients. The authors suggest that their findings fit with this hypothesis, but there are concerns about confirmation bias (elaborated on below) and potential methodological issues, despite the strength of incorporating data from both animal model and neurological patients.
First, the frequency band used to fit the 1/f exponent varies between experiments and analyses, inviting concerns about potentially cherry-picking the data to fit with the prior hypothesis. The frequency band used for fitting the exponent was 30-100 Hz in Experiment 1 (rodent model), 40-90 Hz in Experiment 2 (PD, levodopa), and 10-50 Hz in Experiment 3 (PD, DBS). Ad-hoc reasons were given to justify these choices, such as " to avoid a spectral plateau starting > 50 Hz" in Experiment 3. However, at least in Experiment 3 (Fig. 3), if the frequency range was shifted to 1-10 Hz, the authors would have uncovered the opposite effect, where the exponent is smaller for DBS-on condition.
Second, there are important, fine-grained features in the spectra that are ignored in the analyses, which confounds the interpretation.
One salient example of this is Fig. 2, where based on the plots in B, one would expect that the power of beta-band oscillations to be higher in the Med-On condition, as the oscillatory peaks rise higher above the 1/f floor and reach the same amplitude level as the Med-OFF condition (in other words, similar total power is subtracted by a smaller 1/f power in the Med-ON condition). But this impression is opposite to the model-fitting results in C, where beta power is lower in the Med-ON condition.
Another example is Fig. 1C, where the spectra for high and low STN spiking epochs are identical between 10 and 20 Hz, and the difference in higher frequency range could be well-explained by an overall increase of broadband gamma power (e.g. as observed in Manning et al., J Neurosci 2012, Ray & Maunsell PLoS Biol 2011). This increase of broadband gamma power is trivially expected, as broadband gamma power is tightly coupled with population spiking rate, which was used to define the two conditions.
The above consideration also speaks to a major weakness of the general approach of considering the 1/f spectrum a monolithic spectrum that can be captured by a single exponent. As the authors' Fig. 1C shows, there are distinct frequency regions within the 1/f spectrum that have different slopes. Indeed, this tripartite shape of the 1/f spectrum, including a "knee" feature around 40-70 Hz which is well visible here, was described in multiple previous papers (Miller et al., PLoS Comput Biol 2009; He et al., Neuron 2010), and have been successfully modeled with a neural network model using biologically plausible mechanisms (Chaudhuri et al., Cereb Cortex, 2017). The neglect of these fine-grained features confounds the authors' model fitting, because an overall increase in the broadband gamma power - which can be explained straightforwardly by the change in population firing rates - can result in the exponent, fit over a larger spectral frequency region, to decrease. However, this is not due to the exponent actually changing, but the overall increase of power in a specific sub-frequency-region of the broadband 1/f activity.
-
Reviewer #2 (Public Review):
In their manuscript, Wiest and colleagues focus on testing two primary hypotheses. The first is that the aperiodic exponent from the intracranial EEG / LFP reflects to population EI balance, and the second is that Parkinson's disease is specifically associated with reduced inhibition-concomitant excessive excitation-in the STN.
To accomplish this, they make use of data from 24 patients with Parkinson's disease who have undergone surgery to implant a deep brain stimulator as part of the treatment of their disease. These patients provide a rare opportunity to record high signal-to-noise EEG/LFP data directly from the human brain. These data are complemented by an additional dataset collected from eight 6-OHDA-lesioned rats, which provide a model of Parkinson's disease. The rat data includes both single-unit …
Reviewer #2 (Public Review):
In their manuscript, Wiest and colleagues focus on testing two primary hypotheses. The first is that the aperiodic exponent from the intracranial EEG / LFP reflects to population EI balance, and the second is that Parkinson's disease is specifically associated with reduced inhibition-concomitant excessive excitation-in the STN.
To accomplish this, they make use of data from 24 patients with Parkinson's disease who have undergone surgery to implant a deep brain stimulator as part of the treatment of their disease. These patients provide a rare opportunity to record high signal-to-noise EEG/LFP data directly from the human brain. These data are complemented by an additional dataset collected from eight 6-OHDA-lesioned rats, which provide a model of Parkinson's disease. The rat data includes both single-unit spiking activity, which allows Wiest and colleagues to examine periods of relatively high- or low-firing as a proxy for excitatory tone, as well as LFP data which allows them to bridge to the human data and more directly test their first hypothesis that the aperiodic exponent reflects EI balance.
Overall this is a very strong paper. The cross-species approach is especially convincing, and the methods are well-implemented and sound. The authors use appropriate analysis tools and statistical methods, and their inferences are clear, but measured. Their results are convincing, and the potential for aperiodic activity to serve as a potential physiologically interpretable index of Parkinsonian state.
-
Reviewer #3 (Public Review):
In their manuscript Christoph Wiest and colleagues tested the recently established excitation/inhibition (E/I) hypothesis in data from both patients suffering from Parkinson's disease (PD) and a PD rodent model. In particular, they study activity from the basal ganglia, primarily the subthalamic nucleus (STN). It is a thoughtful work which uses sound methods and is well-written and well-structured. The figures are strikingly good.
The authors demonstrate that the aperiodic exponents and power at 30-100 Hz in such data reflect changes in basal ganglia network activity.
Strengths:
- The clear aim and the rare and valuable rodent and patient data under study.
- The cross-species approach.
- Clear perspective towards adaptive deep brain stimulation application.
- Excellent integration in the existing body of …Reviewer #3 (Public Review):
In their manuscript Christoph Wiest and colleagues tested the recently established excitation/inhibition (E/I) hypothesis in data from both patients suffering from Parkinson's disease (PD) and a PD rodent model. In particular, they study activity from the basal ganglia, primarily the subthalamic nucleus (STN). It is a thoughtful work which uses sound methods and is well-written and well-structured. The figures are strikingly good.
The authors demonstrate that the aperiodic exponents and power at 30-100 Hz in such data reflect changes in basal ganglia network activity.
Strengths:
- The clear aim and the rare and valuable rodent and patient data under study.
- The cross-species approach.
- Clear perspective towards adaptive deep brain stimulation application.
- Excellent integration in the existing body of knowledge.Weaknesses:
- No clear link between findings and symptom severity.
- Relatively low number of animals/patients.
- Limited consistency of results across individual data set.
- In parts weak correlations.All in all, the present manuscript provides initial evidence that the E/I hypothesis is also valid for neurophysiological data from the STN in PD patients and corresponding rodent models.
This is an important finding which will strengthen the idea of the E/I hypothesis in general and also further substantiates our knowledge about neurophysiological activity of the STN. -
