Sex, strain, and lateral differences in brain cytoarchitecture across a large mouse population
Curation statements for this article:-
Curated by eLife

eLife assessment
The authors provide a new powerful tool as well as a large database that should be useful to the neuroscience community, but not only. The authors developed and applied a methodology to automatically estimate the volume, cell number, and density of mice brains from multiple regions, by detecting the native fluorescence of the cell nuclei. Using this platform, they analyzed an existing dataset containing multiple mouse brains, available in the Allen Mouse Connectivity project. The data provides a comprehensive neuroanatomical comparison of brain nuclei between males and females, between hemispheres, and between 2 strains of lab mice.
This article has been Reviewed by the following groups
Discuss this preprint
Start a discussion What are Sciety discussions?Listed in
- Evaluated articles (eLife)
Abstract
The mouse brain is by far the most intensively studied among mammalian brains, yet basic measures of its cytoarchitecture remain obscure. For example, quantifying cell numbers, and the interplay of sex, strain, and individual variability in cell density and volume is out of reach for many regions. The Allen Mouse Brain Connectivity project produces high-resolution full brain images of hundreds of brains. Although these were created for a different purpose, they reveal details of neuroanatomy and cytoarchitecture. Here, we used this population to systematically characterize cell density and volume for each anatomical unit in the mouse brain. We developed a DNN-based segmentation pipeline that uses the autofluorescence intensities of images to segment cell nuclei even within the densest regions, such as the dentate gyrus. We applied our pipeline to 507 brains of males and females from C57BL/6J and FVB.CD1 strains. Globally, we found that increased overall brain volume does not result in uniform expansion across all regions. Moreover, region-specific density changes are often negatively correlated with the volume of the region; therefore, cell count does not scale linearly with volume. Many regions, including layer 2/3 across several cortical areas, showed distinct lateral bias. We identified strain-specific or sex-specific differences. For example, males tended to have more cells in extended amygdala and hypothalamic regions (MEA, BST, BLA, BMA, and LPO, AHN) while females had more cells in the orbital cortex (ORB). Yet, inter-individual variability was always greater than the effect size of a single qualifier. We provide the results of this analysis as an accessible resource for the community.
Article activity feed
-

Author Response
Reviewer #1 (Public Review):
In this manuscript, Elkind et al. use a deep learning segmentation algorithm trained on detecting putative cell nuclei in mouse brains to count cells in the Allen Mouse Brain Connectivity Atlas. The Allen Mouse Brain Connectivity Atlas is a dataset compromising hundreds of mice brains. The authors use this increased statistical power for detecting differences in volume, cell count, and cell density between strains (C57BL/6J and FVB.CD1) as well as sex differences.
Both volume, cell count, and cell density are regularly used in neuroanatomy to normalize or benchmark results so having a large available dataset for others to compare their data would be a useful resource. The trained segmentation algorithm might also find utility in assays where investigators for one reason or another can't …
Author Response
Reviewer #1 (Public Review):
In this manuscript, Elkind et al. use a deep learning segmentation algorithm trained on detecting putative cell nuclei in mouse brains to count cells in the Allen Mouse Brain Connectivity Atlas. The Allen Mouse Brain Connectivity Atlas is a dataset compromising hundreds of mice brains. The authors use this increased statistical power for detecting differences in volume, cell count, and cell density between strains (C57BL/6J and FVB.CD1) as well as sex differences.
Both volume, cell count, and cell density are regularly used in neuroanatomy to normalize or benchmark results so having a large available dataset for others to compare their data would be a useful resource. The trained segmentation algorithm might also find utility in assays where investigators for one reason or another can't dedicate an entire labeled channel to count cell nuclei.
Nevertheless, because of technical reasons, I find the current work problematic.
We thank the Reviewer for acknowledging potential usefulness of our work, and the insightful, helpful comments. We believe this consideration has made our revised manuscript much stronger compared to the initial submission. We hope our revised version will also clear the Reviewer’s remaining doubts.
Major:
The authors make use of the "red" channel from the Allen Mouse Brain Connectivity Project (AMBCP). The AMBCP was acquired using two-photon tomography with the TissueCyte 1000 system (http://help.brain-map.org/download/attachments/2818171/Connectivity_Overview.pdf?version=2&modificationDate=1489022310670&api=v2). The sample is illuminated at 925 nm wavelength and the channel the authors describe as autofluorescence is collected through a 593/40 nm bandpass filter. The authors go on to describe their rationale for using this channel for quantifying cell nuclei:
"We noticed that the red (background) channel of STPT images, taken for the purpose of atlas alignment, typically features dark, round-like objects resembling cell nuclei. We had observed this phenomenon in our own imaging of mouse brains but found little more than anecdotal mentions of it in the literature8,9,10,11".
The authors here cite a Scientific Reports paper from 2021 with 11 citations, a Journal of Clinical Pathology paper from 2005 with 87 citations, and lastly a paper in Laboratory Investigation from 2016 with 41 citations. The authors completely fail to cite the work from Watt Webb's group (co-inventor of 2p microscopy) in PNAS from 2003 that entirely described the phenomena of native fluorescence by multiphoton- excitation (https://www.pnas.org/doi/10.1073/pnas.0832308100 ), citations so far: 1959 citations. This is either indicative of poor scholarship or an attempt to describe something as novel. Either way, the native fluorescence and second harmonic generation from multiphoton illumination are perfectly characterized by Webb and colleagues and they clearly show the differential effect on nucleosides, retinol, indoleamines, and collagen. This is also where the authors should have paid more attention to discrepancies in their own data when correlated to well-established cell nuclei markers (Murakami et al). The authors will note "black large spots" in the data at specific anatomical regions and structures, like the fornix and stria medullaris: https://connectivity.brain-map.org/projection/experiment/siv/263780729?imageId=263780960&imageType=TWO_PHOTON,SEGMENTATION&initImage=TWO_PHOTON&x=15702&y=18833&z=5
which is not reproduced in for example the Allen Reference Atlas H&E staining: http://atlas.brain-map.org/atlas?atlas=1&plate=100960284#atlas=1&plate=100960284&resolution=4.19&x=5507.4000244140625&y=5903.39990234375&zoom=-2
In connection here notice the poor signal in the 2p "autofluorescence" within the paraventricular nucleus: https://connectivity.brain-map.org/projection/experiment/siv/263780729?imageId=263780960&imageType=TWO_PHOTON,SEGMENTATION&initImage=TWO_PHOTON&x=15702&y=17833&z=6
and then compare it to the H&E staining: http://atlas.brain-map.org/atlas?atlas=1&plate=100960280#atlas=1&plate=100960276&resolution=1.50&x=5342.476283482143&y=5368.023856026786&zoom=0
These multiphoton-specific signals are especially pronounced in the pons and medulla which makes quantification especially dubious, which is even apparent simply from looking at Figure 1c in the manuscript.
We thank the Reviewer for the comments and sincerely apologize for missing the seminal work of Webb’s group. We included the former references for their specific mention or illustration of non-autofluorescent nuclei. We indeed entirely missed to address the underlying chemistry that Webb’s group beautifully characterized. We have added the following sentence in the Results section “Autofluorescence of STPT images displays cell nuclei” (red font for new sentence; Reference #15 corresponds to Zipfel et al.):
“We noticed that the red (background) channel of STPT images, taken for the purpose of atlas alignment, typically features dark, round-like objects resembling cell nuclei. This phenomenon was described in previous literature11,12,13,14. In particular, Zipfel et al. characterized the use of multiphoton-excited native florescence and second harmonic generation for the purpose of staining-free tissue imaging15.”
And mentioned the dependency of our method on the presence of intrinsically fluorescent molecules in the Discussion:
“The study has several limitations. First, the model is sensitive to the contrast between dark nuclei and autofluorescent surroundings, which can be limited by image quality and tissue composition. In particular, the staining-free approach depends on the presence of intrinsic molecular indicators such as NADH, retinol or collagen15, which may vary between cell or tissue components, even within the brain.”
We understand that more generally, the Reviewer’s major concern above was regarding the technical validity of our approach; that the segmentation based on small objects lacking autofluorescence, as evident in the STPT dataset, in fact corresponds to cells/nuclei.
In our initial Supplemental Figure 1 (in current version Figure 1—figure supplement 1) we provide technical validation of the method, by showing nuclear staining, and autofluorescence side-by-side, using epifluorescence microscopy. In our revision we now report appropriate statistical measures for this analysis (true positives, false positives, false negatives).
In addition, we performed the following two sets of validations –
(i) Technical validation of our staining-free quantification approach, by nuclear staining. We performed nuclear staining (Hoechst 33342) followed by STPT imaging of 9 female brains and trained a new deep neural network (DNN) to segment the resulting images (STPT was performed by TissueVision). Unfortunately, in STPT it is not technically possible to analyze nuclear staining and autofluorescence in the very same tissue. Therefore, we compared per-region density, cell count and volume of the nuclei-stained validation brains to our original DNN-based analysis of AMBCA brains. We show a correlation coefficient >0.99 for per-region cell count in AMBCA autofluorescence and our nuclear staining (and a similar correlation coefficient for volume). However, the number of cells in nuclear staining over the whole brain is 56% larger than in autofluorescence. Although we currently have no technically feasible way to prove this, one likely explanation for this discrepancy is the nature of the two signals the imaging detects; as positive (Hoechst fluorophore) or autofluorescence. Further, discrepancies between the two methods were notably higher in glial-rich tissues (e.g., CTX L1, midbrain, brainstem) – leading to the speculation that low-autofluorescent object-counts may be biased to detect neurons, rather than glia.
(ii) Independent validation of the biological findings – discussed further below. Regarding the specific concern of “black large spots” in the fornix and stria medullaris – we would like to emphasize that our DNN does not identify and segment dark regions like ventricles and tracks. We provide in the Author Response Image 1 three examples featuring “black large spots” of different shapes and size, with examples of the segmentation results as shown in Figures 1 and 2 of the manuscript. Note that colored circles, that appear as dots depending on magnification, are the objects that were detected and segmented by the DNN. In the Figure we demonstrate that (1) fiber tracts (incl. fornix, stria medullaris) are not segmented; (2) striatal patches (that are smaller still than the fiber tracts in question) are not segmented; and (3) putative blood vessels, appearing as elongated, black structures, are ignored by our DNN.
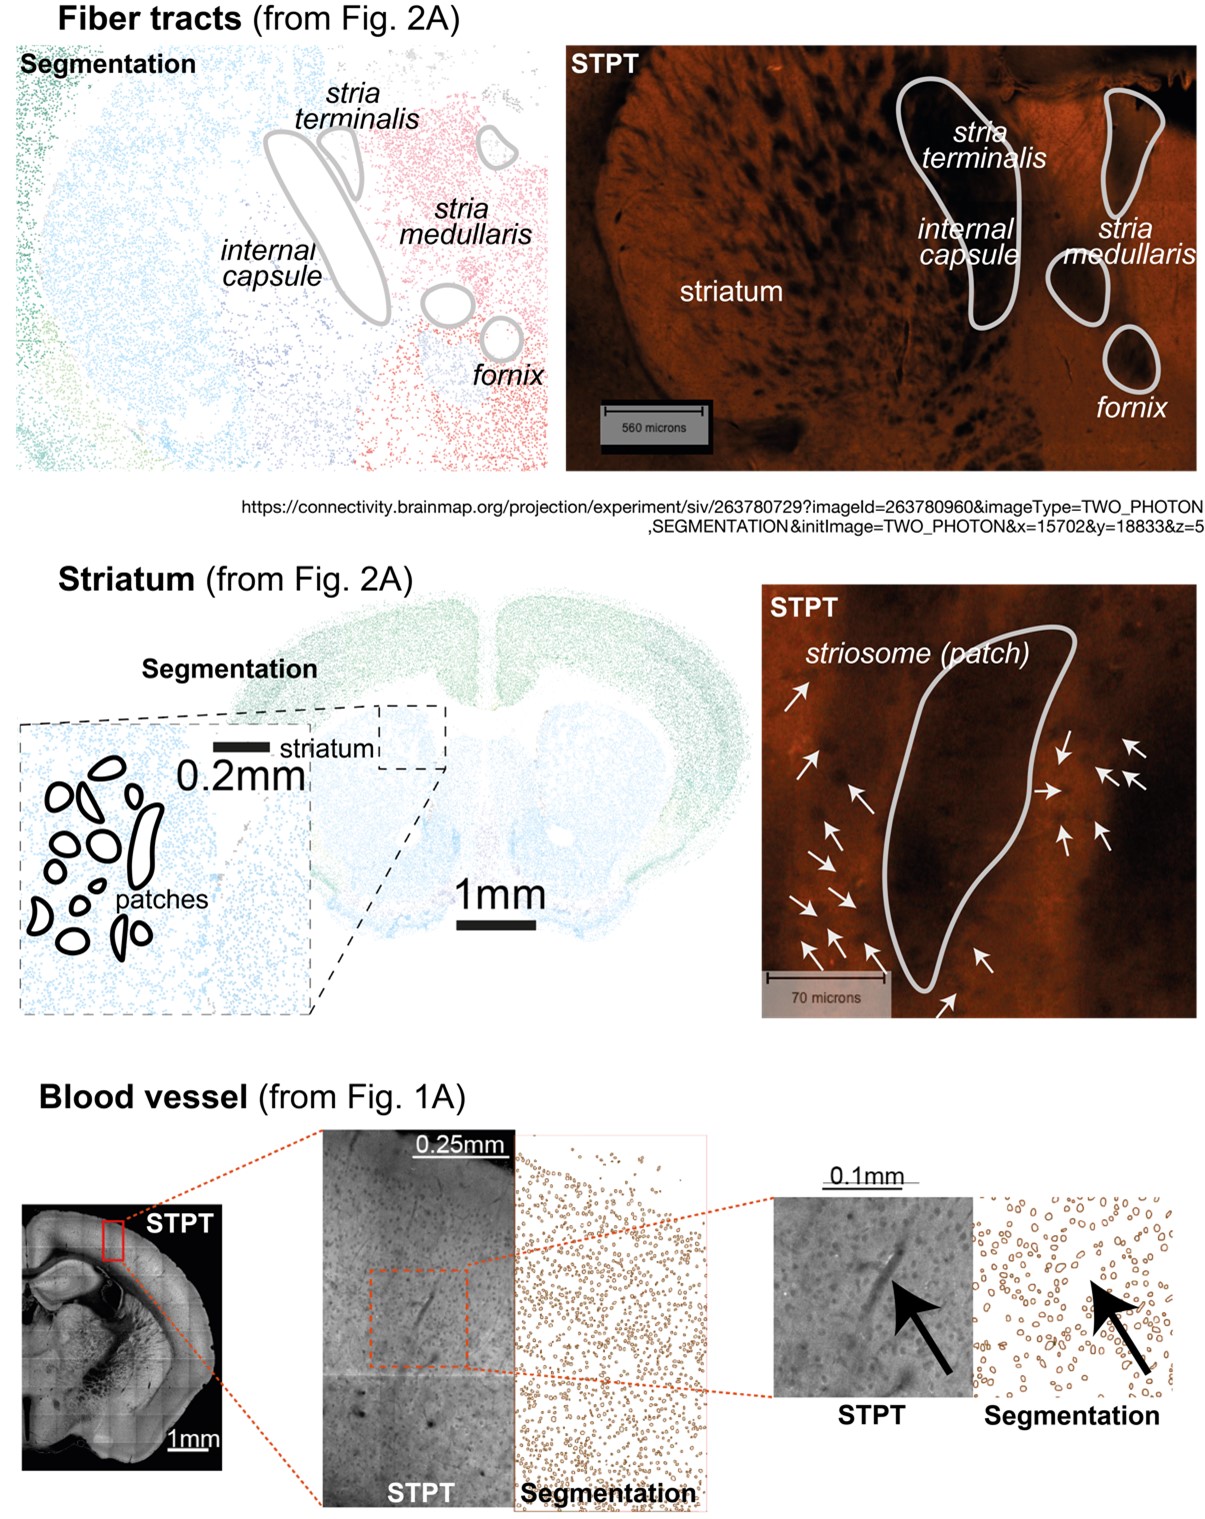
Author Response Image 1. How does the DNN deal with large black spots? Examples for fiber tracts, striatal patches, and blood vessels; adapted from Figures 1 and 2 in the manuscript. Note that dots/outlines represent segmented putative “nuclei” as detected by the model, colored by assigned region according to Allen Mouse Brain hierarchy. Example (1): fiber tracts (incl. fornix, stria medullaris) are not segmented. Example (2): Striasomes (patches in the striatum, that are smaller still than the fiber tracts in question) are not segmented, and the much smaller objects that are detected as putative nuclei are indicated by arrows. Example (3) putative blood vessels, appearing as elongated, black structures, are ignored by our DNN. Examples of the segmentation images were adapted from the manuscript’s Figure 1 to correspond to the STPT image featuring fiber tracts (and Striasomes/patches) was pointed out by the Reviewer.
Regarding the claim of problematic counting in brain stem regions, we agree, and had addressed this limitation in the manuscript’s Discussion (see below). We believe that our counting is valuable even if in some regions there is a significant systematic error: Most of the analyses in this study compare brain regions across individuals and thus systematic error is less impactful. In the revision, we nevertheless took care to validate and quantify the size of this effect. Briefly, we compared counting based on nuclear staining (Hoechst) from 9 STPT imaged brains, to our quantifications of non-autofluorescent objects. As expected, the ratio between these counts depends on the brain region, and accuracy is better in regions with high brightness, which are not on the border of the section (Figure 2—figure supplement 2). As for pons and medulla, the densities in our Hoechst quantifications are 43% and 60% higher than in our AMBCA analysis, respectively, yet rank order is kept in both.
We have revised the relevant sentences in the Discussion:
Original sentences: The study has several limitations. … In the hindbrain (pons, medulla), contrast was exceedingly weak, and we expect our quantifications in this region to strongly underestimate real cell densities, to an extent we cannot quantify.
Revised sentences: The study has several limitations. … In the hindbrain (pons, medulla), contrast was exceedingly weak, and we expect our quantifications in this region to be 66% of the value estimated by nuclear staining (Figure 2—figure supplement 2).
The authors here use the correlation on log-log coordinates between their data and that of Murakami et al to argue that the method has validity. However, the variance explained here is R^2 = 0.74 which is very poor given the log-log coordinates. A more valid metric would use linear coordinates and computing the ICC and interpret it according to established guidelines (e.g. https://www.ncbi.nlm.nih.gov/pmc/articles/PMC4913118/).
As mentioned by the Reviewer, Figure 2D compares Murakami et al. cell counts and ours, across all brain regions. The value “r=0.869” represents the correlation coefficient between the two vectors in log scale and not the R^2. We also now display the correlation coefficient for the linear scale, in which case p=0.98. As suggested by the Reviewer, we added ICC values between the two vectors in linear scale. Using 6 different forms (ICC – 1-1;1-k;C-1;C-k;A-1;A-k), the ICC values were 0.98-0.99, thus corresponding to an excellent agreement (ICC values are mentioned in legend of Figure 2).
Author Response Image 2 displays the revised Figure 2D (left), and the log value of the ratio between the AMBCA-based cell count and the Murakami-based value (right), as a function of region volume. The mean value across regions is zero, corresponding to similar cell counts in both methods. Indeed, there exist outlier regions, that may be attributed to either registration errors, different experimental protocols or may stem from the fact that the Murakami values are based on 3 brains, compared to hundreds of AMBCA brains.
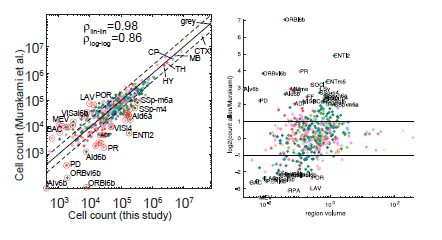
Author Response Image 2. Correlation with cell counts in Murakami et al. Left, revised Figure 2D; Right, ratio between AMBCA-based cell counts and Murakami et al. counts, as a function of region volume
In addition to the above concern, the authors argue that the large sample size of the AMBCP is what would enable them to find statistically significant small effect sizes that might have gone undetected in the literature. However, this argument falls flat once we examine some of the main findings the authors report. Although the authors do not directly report measures of dispersion we can estimate it from the figures and then arrive at the sample size needed to find the reported effect size. For example, the effect that describes ORBvl2/3 volume is larger in female mice compared to males would only require n=13 mice at the desired power of 0.8. Likewise, the sample size needed to detect the increased BST volume in male mice looks to be roughly n=16 mice at the desired power of 0.8. Both of these estimates are well within what is a reasonable sample size to expect in an ordinary study. This begs the question: why did the authors simply not verify some of their main findings in an independent sample obtained through traditional ways to quantify volume and cell density since it is well within reach? Such validation would strengthen the arguments of the paper.
We thank the reviewer for this comment and apologize. In the revised version we do report dispersion.
We would like to emphasize that due to our restricted time and resources, we decided to focus our experimental validation on the technical comparison of nuclear staining vs. autofluorescence-based segmentation, outlined above.
We then verified the biological findings from the initial cohort using C57BL/6J volume data from an additional 663 males vs.166 females on AMBCA. This independent cohort showed similar sexual dimorphism in the volume of MEA, BST and ORBvl2/3, as depicted in the following figure (panels A-D and also as new Figure 4—figure supplement 1).
We fully acknowledge the interesting issue raised on sample sizes required to detect our reported effect sizes. Therefore, we here also present the average p-value for sexual dimorphism in volumes of MEA, BST and ORBvl2/3, as a function of the sample size (panel E in Figure 4—figure supplement 1 of the revised manuscript). The Reviewer will note that the regions with largest effect size (MEA, BST) can be detected within more ordinary sample sizes, and indeed, MEA and BST dimorphism is evident in the literature. ORB dimorphism required much greater sample size; and our analysis (Figure 4) systematically detected many more dimorphic regions, in volume, density and count.
Reviewer #2 (Public Review):
This report describes a large-scale analysis of cell counts in mouse brains. The authors found that the Allen Mouse Connectivity project has a rich dataset for cell counting that is yet to be analyzed, and they developed methods to quantify cells in different nuclei. They go on to compare males vs females and two different strains. From this analysis, they found specific differences between male versus female brains, left versus right hemispheres, and C57BL/6 versus FVB.CD1 mice, especially with regard to cell counts and density.
Overall, the methodology is sound and the quality of the data seems high. In fact, this study uses >100 brains for the statistics, and this is one of the major strengths of this study. For researchers who are interested in interrogating the differences at the macroscopic level in brain structures, this study will be a great resource. For example, the manuscript contains an interesting finding that for most brain areas, females have larger volumes but fewer cell numbers.
We thank the Reviewer for these comments. We would like to mention that the revised version of the manuscript does not include a statement regarding BL6 female volume. We found a batch effect in the AMBCA experiments, mostly affecting the volume in their first batch (Figure 2—figure supplement 1B). That batch included mostly males, and had, for some reason, lower volume compared to all later experiments, which caused the volume differences. We emphasize that (1) the total number of cells did not show any batch effect (Figure 2—figure supplement 1C); (2) We normalized the volume and repeated the analysis. Aside the finding that females did not in fact have larger volumes, other main findings remained unchanged.
Reviewer #3 (Public Review):
Elkind et al. have devised a strategy to detect cells in whole brain samples of the large, publicly accessible Allen Mouse Brain Connectivity database. They put together an analysis pipeline to quantify cell numbers and -density as well as volumes for all annotated brain areas in these samples. This allowed them to make several important discoveries such as (1) strain-, sex- and hemisphere-specific differences in cell densities, (2) a large interindividual variability in cell numbers, and (3) an absence of linear scaling of cell count with volume, among others. The key strength of this work lies in its comprehensive analysis, the large sample size that the authors have drawn from (making their conclusions particularly robust), and the fact that they have made their analysis tools accessible. A weakness of the current manuscript is the dense layout and overplotting of several of the figures, and the lack of necessary information to understand them more easily. Another, conceptual weakness of using the autofluorescence channel for cell detection is that the identity (neuronal vs non-neuronal) of the underlying cells remains unresolved. Overall, however, I believe that this study has the potential to serve as a valuable reference point, and I would expect this work to have a lasting impact on quantitative studies of mouse brain cytoarchitecture.
We thank the Reviewer for these valuable comments. We have tried to minimize overplotting of figures and hopefully added all necessary information. For example, the revised manuscript presents more pared-down figures, with data labels omitted if they crowded the graphic. Instead, we provide the full data in Supplemental tables, and our online accessible GUI. We hope the reader will feel encouraged to both zoom the presented data, more deeply explore additional tables, and our online tool.
Regarding the question of cell types, we were unfortunately not able to provide a definitive answer, but our validation experiments provided some potential clues. For example, nuclear staining (Hoechst) uniformly detected 65% more cells than AMBCA autofluorescence quantification. And, in neuron-rich regions, the correspondence between nuclear staining and AMBCA autofluorescence was notably better than in glia-rich regions (e.g., CTX L1, midbrain, medulla). These discrepancies between the techniques may therefore point to an underlying difference in cell types composition – such that counting low-autofluorescent nuclei is biased to neurons.
In addition, however, the methods differ in their native physical properties; in that one detects presence of a fluorescent signal (e.g., the nuclear stain is detected beyond its focal plane), compared to the detection of the absence of a signal (which, in turn, is dependent on the presence of surrounding intrinsic fluorescent molecules). It is technically non-trivial to assess the extent to which these factors apply. We have added a clarification along these lines in the Discussion (below). We would further like to emphasize the nature of our study as a comparative, systematic analysis within this interesting cohort, rather than providing definitive cell counts – that we found to be greatly variable across the population.
“We further attempted to estimate the region-specific accuracy of our cell counting by comparing autofluorescence STPT with brain-wide imaging of nuclear-stained STPT. However, this comparison is technically nontrivial because of the native physical properties of direct staining vs. autofluorescence. For example, stained nuclei located off the focal plane may appear in the image, yet remain undetected by autofluorescence. In addition, tissue composition (e.g., cell types, extracellular matrix) may affect the imaged region. Indeed, in regions rich with non-neuronal cells the error of autofluorescent-based counting was larger compared to nuclear staining. Hence, one may speculate that autofluorescent-based detection is biased for neurons”
-

-
eLife assessment
The authors provide a new powerful tool as well as a large database that should be useful to the neuroscience community, but not only. The authors developed and applied a methodology to automatically estimate the volume, cell number, and density of mice brains from multiple regions, by detecting the native fluorescence of the cell nuclei. Using this platform, they analyzed an existing dataset containing multiple mouse brains, available in the Allen Mouse Connectivity project. The data provides a comprehensive neuroanatomical comparison of brain nuclei between males and females, between hemispheres, and between 2 strains of lab mice.
-
Reviewer #1 (Public Review):
In this manuscript, Elkind et al. use a deep learning segmentation algorithm trained on detecting putative cell nuclei in mouse brains to count cells in the Allen Mouse Brain Connectivity Atlas. The Allen Mouse Brain Connectivity Atlas is a dataset compromising hundreds of mice brains. The authors use this increased statistical power for detecting differences in volume, cell count, and cell density between strains (C57BL/6J and FVB.CD1) as well as sex differences.
Both volume, cell count, and cell density are regularly used in neuroanatomy to normalize or benchmark results so having a large available dataset for others to compare their data would be a useful resource. The trained segmentation algorithm might also find utility in assays where investigators for one reason or another can't dedicate an entire …
Reviewer #1 (Public Review):
In this manuscript, Elkind et al. use a deep learning segmentation algorithm trained on detecting putative cell nuclei in mouse brains to count cells in the Allen Mouse Brain Connectivity Atlas. The Allen Mouse Brain Connectivity Atlas is a dataset compromising hundreds of mice brains. The authors use this increased statistical power for detecting differences in volume, cell count, and cell density between strains (C57BL/6J and FVB.CD1) as well as sex differences.
Both volume, cell count, and cell density are regularly used in neuroanatomy to normalize or benchmark results so having a large available dataset for others to compare their data would be a useful resource. The trained segmentation algorithm might also find utility in assays where investigators for one reason or another can't dedicate an entire labeled channel to count cell nuclei.
Nevertheless, because of technical reasons, I find the current work problematic.
Major:
The authors make use of the "red" channel from the Allen Mouse Brain Connectivity Project (AMBCP). The AMBCP was acquired using two-photon tomography with the TissueCyte 1000 system (http://help.brain-map.org/download/attachments/2818171/Connectivity_Overview.pdf?version=2&modificationDate=1489022310670&api=v2). The sample is illuminated at 925 nm wavelength and the channel the authors describe as autofluorescence is collected through a 593/40 nm bandpass filter. The authors go on to describe their rationale for using this channel for quantifying cell nuclei:
"We noticed that the red (background) channel of STPT images, taken for the purpose of atlas alignment, typically features dark, round-like objects resembling cell nuclei. We had observed this phenomenon in our own imaging of mouse brains but found little more than anecdotal mentions of it in the literature8,9,10,11".
The authors here cite a Scientific Reports paper from 2021 with 11 citations, a Journal of Clinical Pathology paper from 2005 with 87 citations, and lastly a paper in Laboratory Investigation from 2016 with 41 citations. The authors completely fail to cite the work from Watt Webb's group (co-inventor of 2p microscopy) in PNAS from 2003 that entirely described the phenomena of native fluorescence by multiphoton-excitation (https://www.pnas.org/doi/10.1073/pnas.0832308100 ), citations so far: 1959 citations. This is either indicative of poor scholarship or an attempt to describe something as novel. Either way, the native fluorescence and second harmonic generation from multiphoton illumination are perfectly characterized by Webb and colleagues and they clearly show the differential effect on nucleosides, retinol, indoleamines, and collagen. This is also where the authors should have paid more attention to discrepancies in their own data when correlated to well-established cell nuclei markers (Murakami et al). The authors will note "black large spots" in the data at specific anatomical regions and structures, like the fornix and stria medullaris:
https://connectivity.brain-map.org/projection/experiment/siv/263780729?imageId=263780960&imageType=TWO_PHOTON,SEGMENTATION&initImage=TWO_PHOTON&x=15702&y=18833&z=5which is not reproduced in for example the Allen Reference Atlas H&E staining:
http://atlas.brain-map.org/atlas?atlas=1&plate=100960284#atlas=1&plate=100960284&resolution=4.19&x=5507.4000244140625&y=5903.39990234375&zoom=-2In connection here notice the poor signal in the 2p "autofluorescence" within the paraventricular nucleus:
https://connectivity.brain-map.org/projection/experiment/siv/263780729?imageId=263780960&imageType=TWO_PHOTON,SEGMENTATION&initImage=TWO_PHOTON&x=15702&y=17833&z=6and then compare it to the H&E staining:
http://atlas.brain-map.org/atlas?atlas=1&plate=100960280#atlas=1&plate=100960276&resolution=1.50&x=5342.476283482143&y=5368.023856026786&zoom=0These multiphoton-specific signals are especially pronounced in the pons and medulla which makes quantification especially dubious, which is even apparent simply from looking at Figure 1c in the manuscript. The authors here use the correlation on log-log coordinates between their data and that of Murakami et al to argue that the method has validity. However, the variance explained here is R^2 = 0.74 which is very poor given the log-log coordinates. A more valid metric would use linear coordinates and computing the ICC and interpret it according to established guidelines (e.g. https://www.ncbi.nlm.nih.gov/pmc/articles/PMC4913118/).
In addition to the above concern, the authors argue that the large sample size of the AMBCP is what would enable them to find statistically significant small effect sizes that might have gone undetected in the literature. However, this argument falls flat once we examine some of the main findings the authors report. Although the authors do not directly report measures of dispersion we can estimate it from the figures and then arrive at the sample size needed to find the reported effect size. For example, the effect that describes ORBvl2/3 volume is larger in female mice compared to males would only require n=13 mice at the desired power of 0.8. Likewise, the sample size needed to detect the increased BST volume in male mice looks to be roughly n=16 mice at the desired power of 0.8. Both of these estimates are well within what is a reasonable sample size to expect in an ordinary study. This begs the question: why did the authors simply not verify some of their main findings in an independent sample obtained through traditional ways to quantify volume and cell density since it is well within reach? Such validation would strengthen the arguments of the paper.
-
Reviewer #2 (Public Review):
This report describes a large-scale analysis of cell counts in mouse brains. The authors found that the Allen Mouse Connectivity project has a rich dataset for cell counting that is yet to be analyzed, and they developed methods to quantify cells in different nuclei. They go on to compare males vs females and two different strains. From this analysis, they found specific differences between male versus female brains, left versus right hemispheres, and C57BL/6 versus FVB.CD1 mice, especially with regard to cell counts and density.
Overall, the methodology is sound and the quality of the data seems high. In fact, this study uses >100 brains for the statistics, and this is one of the major strengths of this study. For researchers who are interested in interrogating the differences at the macroscopic level in …
Reviewer #2 (Public Review):
This report describes a large-scale analysis of cell counts in mouse brains. The authors found that the Allen Mouse Connectivity project has a rich dataset for cell counting that is yet to be analyzed, and they developed methods to quantify cells in different nuclei. They go on to compare males vs females and two different strains. From this analysis, they found specific differences between male versus female brains, left versus right hemispheres, and C57BL/6 versus FVB.CD1 mice, especially with regard to cell counts and density.
Overall, the methodology is sound and the quality of the data seems high. In fact, this study uses >100 brains for the statistics, and this is one of the major strengths of this study. For researchers who are interested in interrogating the differences at the macroscopic level in brain structures, this study will be a great resource. For example, the manuscript contains an interesting finding that for most brain areas, females have larger volumes but fewer cell numbers.
-
Reviewer #3 (Public Review):
Elkind et al. have devised a strategy to detect cells in whole brain samples of the large, publicly accessible Allen Mouse Brain Connectivity database. They put together an analysis pipeline to quantify cell numbers and -density as well as volumes for all annotated brain areas in these samples. This allowed them to make several important discoveries such as (1) strain-, sex- and hemisphere-specific differences in cell densities, (2) a large interindividual variability in cell numbers, and (3) an absence of linear scaling of cell count with volume, among others. The key strength of this work lies in its comprehensive analysis, the large sample size that the authors have drawn from (making their conclusions particularly robust), and the fact that they have made their analysis tools accessible. A weakness of …
Reviewer #3 (Public Review):
Elkind et al. have devised a strategy to detect cells in whole brain samples of the large, publicly accessible Allen Mouse Brain Connectivity database. They put together an analysis pipeline to quantify cell numbers and -density as well as volumes for all annotated brain areas in these samples. This allowed them to make several important discoveries such as (1) strain-, sex- and hemisphere-specific differences in cell densities, (2) a large interindividual variability in cell numbers, and (3) an absence of linear scaling of cell count with volume, among others. The key strength of this work lies in its comprehensive analysis, the large sample size that the authors have drawn from (making their conclusions particularly robust), and the fact that they have made their analysis tools accessible. A weakness of the current manuscript is the dense layout and overplotting of several of the figures, and the lack of necessary information to understand them more easily. Another, conceptual weakness of using the autofluorescence channel for cell detection is that the identity (neuronal vs non-neuronal) of the underlying cells remains unresolved. Overall, however, I believe that this study has the potential to serve as a valuable reference point, and I would expect this work to have a lasting impact on quantitative studies of mouse brain cytoarchitecture.
-
