Emergent dynamics of adult stem cell lineages from single nucleus and single cell RNA-Seq of Drosophila testes
Curation statements for this article:-
Curated by eLife

eLife assessment
This study provides further detailed analysis of recently published Fly Atlas data supplemented with newly generated single cell RNA-seq data. Through characterizing these datasets, the authors define different germ cell and somatic cell clusters throughout the testis. This work confirms and extends previous observations regarding the changing gene expression programs these cells exhibit during their differentiation. This manuscript provides an important and detailed foundation for future studies of these lineages.
This article has been Reviewed by the following groups
Discuss this preprint
Start a discussion What are Sciety discussions?Listed in
- Evaluated articles (eLife)
Abstract
Proper differentiation of sperm from germline stem cells, essential for production of the next generation, requires dramatic changes in gene expression that drive remodeling of almost all cellular components, from chromatin to organelles to cell shape itself. Here, we provide a single nucleus and single cell RNA-seq resource covering all of spermatogenesis in Drosophila starting from in-depth analysis of adult testis single nucleus RNA-seq (snRNA-seq) data from the Fly Cell Atlas (FCA) study. With over 44,000 nuclei and 6000 cells analyzed, the data provide identification of rare cell types, mapping of intermediate steps in differentiation, and the potential to identify new factors impacting fertility or controlling differentiation of germline and supporting somatic cells. We justify assignment of key germline and somatic cell types using combinations of known markers, in situ hybridization, and analysis of extant protein traps. Comparison of single cell and single nucleus datasets proved particularly revealing of dynamic developmental transitions in germline differentiation. To complement the web-based portals for data analysis hosted by the FCA, we provide datasets compatible with commonly used software such as Seurat and Monocle. The foundation provided here will enable communities studying spermatogenesis to interrogate the datasets to identify candidate genes to test for function in vivo.
Article activity feed
-

-

Author Response
Reviewer #1 (Public Review):
This study provides further detailed analysis of recently published Fly Atlas datasets supplemented with newly generated single cell RNA-seq data obtained from 6,000 testis cells. Using these data, the authors define 43 germline cell clusters and 22 somatic cell clusters. This work confirms and extends previous observations regarding changing gene expression programs through the course of germ cell and somatic cell differentiation.
This study makes several interesting observations that will be of interest to the field. For example, the authors find that spermatocytes exhibit sex chromosome specific changes in gene expression. In addition, comparisons between the single nucleus and single cell data reveal differences in active transcription versus global mRNA levels. For example, previous …
Author Response
Reviewer #1 (Public Review):
This study provides further detailed analysis of recently published Fly Atlas datasets supplemented with newly generated single cell RNA-seq data obtained from 6,000 testis cells. Using these data, the authors define 43 germline cell clusters and 22 somatic cell clusters. This work confirms and extends previous observations regarding changing gene expression programs through the course of germ cell and somatic cell differentiation.
This study makes several interesting observations that will be of interest to the field. For example, the authors find that spermatocytes exhibit sex chromosome specific changes in gene expression. In addition, comparisons between the single nucleus and single cell data reveal differences in active transcription versus global mRNA levels. For example, previous results showed that (1) several mRNAs remain high in spermatids long after they are actively transcribed in spermatocytes and (2) defined a set of post-meiotic transcripts. The analysis presented here shows that these patterns of mRNA expression are shared by hundreds of genes in the developing germline. Moreover, variable patterns between the sn- and sc-RNAseq datasets reveals considerable complexity in the post-transcriptional regulation of gene expression.
Overall, this paper represents a significant contribution to the field. These findings will be of broad interest to developmental biologists and will establish an important foundation for future studies. However, several points should be addressed.
In figure 1, I am struck by the widespread expression of vasa outside of the germ cell lineage. Do the authors have a technical or biological explanation for this observation? This point should be addressed in the paper with new experiments or further explanation in the text.
Thank you for pointing this out. We found that our single cell dataset shows a similar (low) level of vasa expression outside the germline, suggesting that this is not due to single nucleus versus single cell RNA-seq (cluster 1, red in the lefthand umap).
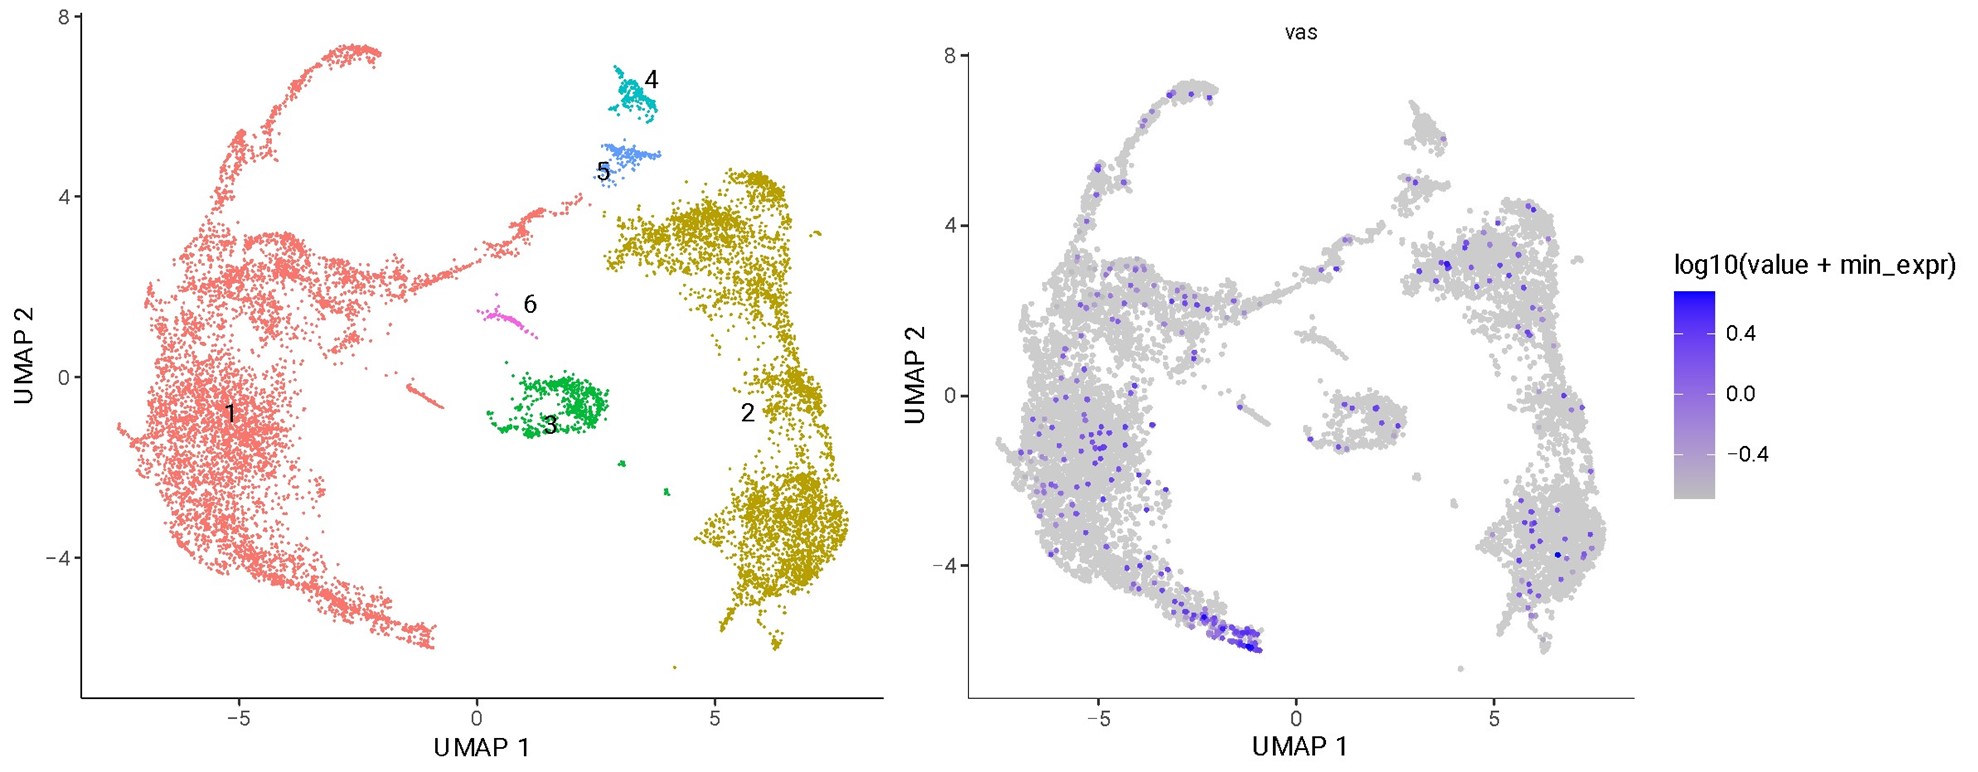
Analyzing the single nucleus RNA-seq in more detail revealed that, compared to the germline, both the fraction of cells in a cluster expressing vasa and the level at which they express it are very low. This analysis is included in a new Figure 1 – figure supplement 1. It is likely that much of this is due to a technical artifact, such as ambient RNA. Finally, we note in the resubmission that vasa is in fact expressed in embryonic somatic cells, and thus some of the vasa expression we observe may be real (Renault. Biol Open 2012; https://doi.org/10.1242/bio.20121909).
Plots in the original submission drew undue attention to the few somatic cells that exhibited vasa signal, due to the fact that expressing cell points were forced to the front of the plot. Given our new analysis reporting the low levels and fraction of cells exhibiting vasa expression (Figure 1 – figure supplement 1), we have modified the panels of Figure 1, changing point size to more faithfully reflect the small proportion of somatic cells with some vasa expression.
The proposed bifurcation of the cyst cells into head and tail populations is interesting and worth further exploration/validation. While the presented in situ hybridization for Nep4, geko, and shg hint at differences between these populations, double fluorescent in situs or the use of additional markers would help make this point clearer. Higher magnification images would also help in this regard.
We thank the reviewer for their suggestions on clarifying the differences between HCC and TCC populations. As suggested, we have repeated the FISH experiments of Nep4 and geko with higher resolution, and included the additional marker Coracle that demarcates the junction between HCC and TCC (Figure 6O,Q,S,T). These panels replaced previous Nep4 and geko FISH images (see previous Figure 6Q,U,U’). FISH for Nep4 validated the split, and the enrichment of geko strongly suggests that this arm represents one cell type (HCCs). We have not yet identified a gene reciprocally enriched to the other arm. Therefore, in the revised submission, we call the assignment of TCC identity, and to a lesser extent, HCC identity ‘tentative’, but point out that genes predicted to be enriched to one or the other arm represent fertile candidates for the field to test.
Reviewer #2 (Public Review):
In this manuscript the authors explain in greater detail a recent testis snRNAseq dataset that many of these authors published earlier this year as part of the Fly Cell Atlas (FCA) Li et al. Science 2022. As part of the current effort additional collaborators were recruited and about 6,000 whole cell scRNAseq cells were added to the previous 42,000 nuclei dataset. The authors now describe 65 snRNseq clusters, each representing potential cell types or cell states, including 43 germline clusters and 22 somatic clusters. The authors state that this analysis confirms and extends previously knowledge of the testis in several important areas.
“However, in areas where testis biology is well studied, such as the development of germ cells from GSC to the onset of spermatocyte differentiation, the resolution seems less than current knowledge by considerable margins. No clusters correspond to GSCs, or specific mitotic spermatogonia, and even the major stages of meiotic prophase are not resolved. Instead, the transitions between one state and the next are broad and almost continuous, which could be an intrinsic characteristic of the testis compared to other tissues, of snRNAseq compared to scRNAseq, or of the particular experimental and software analysis choices that were used in this study.”
Note that the referee raises the same issue later in their review also. To respond succinctly, we placed the relevant sentence from a later portion of this referee’s comment here
“Support for the view that the problems are mostly technical, rather than a reflection of testis biology, comes from studies of scRNAseq in the mouse, where it has been possible to resolve a stem cell cluster, and germ cell pathways that follow known germ cell differentiation trajectories with much more discrete steps than were reported here (for example, Cao et al. 2021 cited by the authors).”
Respectfully, we have a different interpretation of other work as cited by this referee. Our data, as well as that from others, supports the notion that transitions are generally broad and continuous and are indeed a feature of testis biology. As we report here, data from both single cell and single nucleus RNAseq exhibit transitions from one cluster to the next. Thus, this feature cannot be due to the choice of method (single cell versus single nucleus).
In fact, prior scRNA-seq results on systems containing a continuously renewing cell population, such as is the case in the testis, do indeed exhibit a contiguous trajectory rather than discrete, well-separated cell states in gene expression space (that is, in a UMAP presentation). For example, this is the case from single-cell or single-nucleus sequencing from spermatogenesis in mouse (Cao et al 2021), human (Sohni et al 2019), and zebrafish (Qian et al 2022).
Along differentiation trajectories in these tissues, successive clusters are defined by their aggregate, transcript repertoire. Indeed, differentially-expressed genes can be identified for clusters, with expression enriched in a given cluster. However, expression is rarely restricted to a cluster. For instance, Cao et al. subcluster spermatogonia into four subgroups, termed SPG1-4. They state clearly that these SPG1-4 “follow a continuous differentiation trajectory,” as can be inferred by marker expression across cells in this lineage. Similar to our findings, while the spermatogonia can fall into discrete clusters, gene expression patterns are contiguous. For example, the “undifferentiated” marker used in Cao et al, Crabp1, clearly shows expression in SPG1-3, annotated as spermatogonial stem cells, undifferentiated spermatogonia, and early differentiated spermatogonia, respectively. Likewise, markers for the “SPG3” state spermatogonia have detectable expression in SPG2 and SPG4, and likewise for markers of the “SPG4” state (with expression found also in SPG3).
Analogous study of human spermatogenesis arrives at a similar conclusion. In that work, although clusters are named as “spermatogonial stem cell (SSC)”, the authors are careful to specifically point out that, “…while we refer to the SSC-1 and SSC-2 cell clusters as ‘‘SSCs,’’ scRNA-seq is not a functional assay and thus we do not know the percentage of cells in these clusters with SSC activity. These subsets almost certainly contain other A-SPG cells [A type spermatogonia], including SPG progenitors that have committed to differentiate.” (Sohi et al 2019)Thus, the work in several disparate systems, all involving renewing lineages, finds that discrete clusters, such as a “stem cell cluster” are not identified. In the Drosophila testis, germline differentiation flows in a continuous-like manner similar to spermatogenesis in several other organisms studied by scRNA-seq, and our finding is not a function of the methodology, but rather a facet of the biology of the organ.
Operating in parallel with continuous differentiation, we did find evidence of, and extensively discussed in concert with Figure 4, huge and dramatic shifts in transcriptional state in spermatocytes compared to spermatogonia, in early spermatids compared to spermatocytes, and in late spermatid elongation. Lastly, as we describe further below, new data in this resubmission identify four distinct genes with stage-selective expression as predicted by our analysis (new Figure 2 - figure supplement 1), illustrating the utility of our study for the field to find new markers and new genes to test for function.
A goal of the study was to identify new rare cell types, and the hub, a small apical somatic cell region, was mentioned as a target region, since it regulates both stem cell populations, GSCs and CySCs, is capable of regeneration, and other fascinating properties. However the analysis of the hub cluster revealed more problems of specificity. 41 or 120 cells in the cluster were discordant with the remaining 79 which did express markers consistent with previous studies. Why these cells co-clustered was not explained and one can only presume that similar problems may be found in other clusters.
Our writing seems not to have been clear enough on this point and we thank the reviewer. We have revised the section. In addition, we have added new data (Figure 7 - figure supplement 2). We had already stated that only 79 of these 120 nuclei were near to each other in 2D UMAP space, while other members of original cluster 90 were dispersed. Thus the 79 hub nuclei in fact clustered together on the UMAP. Other nuclei that mapped at dispersed positions were initially ‘called’ as part of this cluster in the original Fly Cell Atlas (FCA) paper (Li et al., 2022), making it obvious that a correction to that assignment was necessary, which we carried out. To our eye, no other called cluster was represented by such dispersed groupings. For the hub, we definitively established the 79 nuclei to represent hub cells by marker gene analysis, including the identification of a new maker, tup, that was included in the 79 annotated hub nuclei but excluded from the 41 other nuclei (Figure 7). In this resubmission, to independently verify the relationship of the 79 nuclei to each other, we subjected the 120 nuclei from the original cluster 90 defined by the FCA study to hierarchical clustering using only genes that are highly expressed and variable in these nuclei (Figure 7 - figure supplement 2). This computationally distinct approach strongly supported our identification of the 79 definitive hub nuclei.
Indeed, many other indications of specificity issues were described, including contamination of fat body with spermatocytes, the expression of germline genes such as Vasa in many somatic cell clusters like muscle, hemocytes, and male gonad epithelium, and the promiscuous expression of many genes, including 25% of somatic-specific transcription factors, in mid to late spermatocytes. The expression of only one such genes, Hml, was documented in tissue, and the authors for reasons not explained did not attempt to decisively address whether this phenomenon is biologically meaningful.
We discussed the question of vasa expression in somatic clusters in some detail above, in response to referee #1, and included new analysis in the resubmission.
With respect to the observation of ‘somatic gene’ expression in spermatocytes, we are also intrigued. We do not believe this is due to “contamination,” but rather a spermatocyte expression program that includes expression of somatic genes. First, these somatic markers were not observed in other germline clusters, which would be expected if this was due to general transcript contamination. Second, we observed expression of somatic markers in spermatocytes independently in the single-cell and single-nucleus data, making it unlikely to be an artifact of preparation of isolated nuclei. Finally, in the resubmission, in addition to Hml, we validated ‘somatic’ marker expression in spermatocytes by FISH of a somatic, tail cyst cell marker, Vsx1. Vsx1 is predicted to be expressed at low levels in spermatocytes in our dataset and is clearly visible in germline cells by FISH (Figure 3 – figure supplement 2G,H). We also refer the referee to Figure 6K, where the mRNA for the somatic cyst cell marker eya was observed by FISH at low levels in spermatocytes.
A truly interesting question mentioned by the authors is why the testis consistently ranks near the top of all tissues in the complexity of its gene expression. In the Li et al. (2022) paper it was suggested that this is due an inherently greater biological complexity of spermiogenesis than other tissues. It seems difficult to independently and rationally determine "biological complexity," but if a conserved characteristic of testis was to promiscuously express a wide range of (random?) genes, something not out of the question, this would be highly relevant and important.
We agree that the massive transcriptional program found in spermatocytes is, indeed, truly interesting. There are many speculations as to why spermatocytes are so highly transcriptional, including the possibility of “transcriptional scanning” (e.g., Xia et al. 2020) regulating the evolution of new genes. Testing such models is beyond the scope of this paper. However, one must also keep in mind that spermatogenesis involves one of the most dramatic cellular transformations in biology, where cellular components spanning from nuclei to chromatin to Golgi, cell cycle, extensive membrane addition, changes in cell shape, and building of a complex swimming organelle all must occur and be temporally coordinated. Small wonder that many genes must be expressed to accomplish these tasks.
Unfortunately, the most likely problems are simply technical. Drosophila cells are small and difficult to separate as intact cells. The use of nuclei was meant to overcome this inherent problem, but the effectiveness of this new approach is not yet well-documented. Support for the view that the problems are mostly technical, rather than a reflection of testis biology, comes from studies of scRNAseq in the mouse, where it has been possible to resolve a stem cell cluster, and germ cell pathways that follow known germ cell differentiation trajectories with much more discrete steps than were reported here (for example, Cao et al. 2021 cited by the authors).
We respectfully disagree with the referee about this collection of statements. First, the use of snRNASeq has been extensively characterized and compared to scRNA-seq in brain tissue by McLaughlin et al., 2021 (cited in the original submission) and was shown to be effective (McLaughlin, et al. eLife 2021;10:e63856. DOI: https://doi.org/10.7554/eLife.63856). snRNA-seq has a distinct advantage when dealing with long, thin cells, such as neurons or cyst cells (as featured in this work), where cytoplasm can easily be sheared off during cell isolation. Second, in a previous portion of our response to this referee, we discussed how our interpretation of Cao et al., 2021 differs from that expressed by this referee. Lastly, as requested in ‘Essential revision’ 2, we adjusted clustering methods and selected four genes, two predicted to be markers for early stage germline cells, and two for mid-spermatocyte stage development. FISH analysis demonstrates that expression for each of these maps to the appropriate stages (new Figure 2 - figure supplement 1). This confirms that the datasets we present in this manuscript can be mined to identify unique, diagnostic markers for various stages.
The conclusions that were made by the authors seem to either be facts that are already well known, such as the problem that transcriptional changes in spermatocytes will be obscured by the large stored mRNA pool, or promises of future utility. For example, "mining the snRNA-seq data for changes in gene expression as one cluster advances to the next should identify new sub-stage-specific markers." If worthwhile new markers could be identified from these data, surely this could have been accomplished and presented in a supplemental Table. As it currently stands, the manuscript presents the dataset including a fair description of its current limitations, but very little else of novel biological interest is to be found.
“In sum, this project represents an extremely worthwhile undertaking that will eventually pay off. However, some currently unappreciated technical issues, in cell/nuclear isolation, and certainly in the bioinformatic programs and procedures used that mis-clustered many different cells, has created the current difficulties.
Most scRNAseq software is written to meet the needs of mammalian researchers working with cultured cells, cellular giants compared to Drosophila and of generally similar size. Such software may not be ideal for much smaller cells, but which also include the much wider variation in cell size, properties and biological mechanisms that exist in the world of tissues.”
We appreciate the referee’s acknowledgement that this ‘undertaking will eventually pay off’. It was not our intention to address ‘function’ for this study, but rather to make the system accessible to the broadest community possible. We are uncertain if there is any remaining reservation held by this referee. A brief summary of what we covered in the manuscript may help allay any residual concern. Obviously, study of the Drosophila testis and spermatogenesis benefits from the knowledge of a large number of established cell-type and stage-selective markers. Thus, we extensively used the community’s accepted markers to assign identity to clusters in both the sn- and sc-RNA-seq UMAPs. We believe that effort well establishes the validity and reliability of the dataset . Furthermore, we identified upwards of a dozen new markers out of the cluster analysis, and verified their expression by FISH or reporter line in various figures throughout (tup, amph, piwi, geko, Nep4, CG3902, Akr1B, loqs, Vsx1, Drep2, Pxt, CG43317, Vha16-5, l(2)41Ab). To our mind, these contributions, coupled with annotation of the datasets, suggest strongly that they will serve the community well. This is especially true as we provide users with objects that they can feed into commonly used software algorithms such as Seurat and Monocle to explore the datasets to their purposes. Rather than simply relying on default settings within some of the applications, we also adjusted parameters for various clusterings as called for; some of which were in response to astute comments from referees, and included in the resubmission. Of course, it is possible that rare issues may arise in the datasets as these are further studied, but that is the case with all scRNA-seq data, and is not specific to work on this model organism.
Reviewer #3 (Public Review):
In this study, the authors use recently published single nucleus RNA sequencing data and a newly generated single cell RNA sequencing dataset to determine the transcriptional profiles of the different cell types in the Drosophila ovary. Their analysis of the data and experimental validation of key findings provide new insight into testis biology and create a resource for the community. The manuscript is clearly written, the data provide strong support for the conclusions, and the analysis is rigorous. Indeed, this manuscript serves as a case study demonstrating best practices in the analysis of this type of genomics data and the many types of predictions that can be made from a deep dive into the data. Researchers who are studying the testis will find many starting points for new projects suggested by this work, and the insightful comparison of methods, such as between slingshot and Monocle3 and single cell vs single nucleus sequencing will be of interest beyond the study of the Drosophila testis.
We greatly appreciate the reviewer’s comments.
Reviewer #4 (Public Review):
This is an extraordinary study that will serve as key resource for all researchers in the field of Drosophila testis development. The lineages that derive from the germline stem cells and somatic stem cells are described in a detail that has not been previously achieved. The RNAseq approaches have permitted the description of cell states that have not been inferred from morphological analyses, although it is the combination of RNAseq and morphological studies that makes this study exceptional. The field will now have a good understanding of interactions between specific cell states in the somatic lineage with specific states in the germ cell lineage. This resource will permit future studies on precise mechanisms of communication between these lineages during the differentiation process, and will serve as a model for studies of co-differentiation in other stem cell systems. The combination of snRNAseq and scRNAseq has conclusively shown differences in transcriptional activation and RNA storage at specific stages of germ cell differentiation and is a unique study that will inform other studies of cell differentiation.
Could the authors please describe whether genes on the Y chromosome are expressed outside of the male germline. For example, what is represented by the spots of expression within the seminal vesicle observed in Figure 3D?
Prior work demonstrated that proteins encoded by Y-linked genes are not expressed outside of the germline (Zhang et al. Genetics 2020. https://doi.org/10.1534/genetics.120.303324). In our snRNAseq dataset, we find that genes on the Y chromosome are not highly expressed outside of the male germline (on the order of ~100-fold lower in other tissues). In fact, we observe Y chromosome transcripts at this level in many nuclei across tissues collected for the Fly Cell Atlas project, including the ovary. Since we have not followed up on the Fly Cell Atlas observations directly using FISH to examine Y chromosome transcript expression outside the germline, we cannot rule out the possibility that such low level expression is real. However, the detection across several tissues argues that this is likely technical artifact. With regard to ‘spots of expression within the seminal vesicle’ (Figure 3D), a spot is colored red if the average expression level of genes on the Y chromosome is greater in that cell than in an average cell on our plot. These red spots are likely due to ambient RNA being carried over.
I would appreciate some discussion of the "somatic factors" that are observed to be upregulated in spermatocytes (e.g. Mhc, Hml, grh, Syt1). Is there any indication of functional significance of any of these factors in spermatocytes?
This is an excellent question. Although we validated expression for several (Hml, Vsx1 and eya), we did not test for their function here and this issue remains to be studied. This is now directly stated in the main text.
In the discussion of cyst cell lineage differentiation following cluster 74 the authors state that neither the HCC or TCC lineages were enriched for eya (Figure 6V). It seems in this panel that cluster 57 shows some enrichment for eya - is this regarded as too low expression to be considered enriched?
We thank the reviewer for their insightful comment and we agree with their conclusions. We have modified the text to reflect the low, but present, expression of eya in the HCC and TCC lineages. The text now reads as follows at line (insert line # here): “Enrichment of eya was dramatically reduced in the clusters along either late cyst cell branch compared to those of earlier lineage nuclei (Figure 6J,U).”
-
eLife assessment
This study provides further detailed analysis of recently published Fly Atlas data supplemented with newly generated single cell RNA-seq data. Through characterizing these datasets, the authors define different germ cell and somatic cell clusters throughout the testis. This work confirms and extends previous observations regarding the changing gene expression programs these cells exhibit during their differentiation. This manuscript provides an important and detailed foundation for future studies of these lineages.
-
Reviewer #1 (Public Review):
This study provides further detailed analysis of recently published Fly Atlas datasets supplemented with newly generated single cell RNA-seq data obtained from 6,000 testis cells. Using these data, the authors define 43 germline cell clusters and 22 somatic cell clusters. This work confirms and extends previous observations regarding changing gene expression programs through the course of germ cell and somatic cell differentiation.
This study makes several interesting observations that will be of interest to the field. For example, the authors find that spermatocytes exhibit sex chromosome specific changes in gene expression. In addition, comparisons between the single nucleus and single cell data reveal differences in active transcription versus global mRNA levels. For example, previous results showed that …
Reviewer #1 (Public Review):
This study provides further detailed analysis of recently published Fly Atlas datasets supplemented with newly generated single cell RNA-seq data obtained from 6,000 testis cells. Using these data, the authors define 43 germline cell clusters and 22 somatic cell clusters. This work confirms and extends previous observations regarding changing gene expression programs through the course of germ cell and somatic cell differentiation.
This study makes several interesting observations that will be of interest to the field. For example, the authors find that spermatocytes exhibit sex chromosome specific changes in gene expression. In addition, comparisons between the single nucleus and single cell data reveal differences in active transcription versus global mRNA levels. For example, previous results showed that (1) several mRNAs remain high in spermatids long after they are actively transcribed in spermatocytes and (2) defined a set of post-meiotic transcripts. The analysis presented here shows that these patterns of mRNA expression are shared by hundreds of genes in the developing germline. Moreover, variable patterns between the sn- and sc-RNAseq datasets reveals considerable complexity in the post-transcriptional regulation of gene expression.
Overall, this paper represents a significant contribution to the field. These findings will be of broad interest to developmental biologists and will establish an important foundation for future studies. However, several points should be addressed.
In figure 1, I am struck by the widespread expression of vasa outside of the germ cell lineage. Do the authors have a technical or biological explanation for this observation? This point should be addressed in the paper with new experiments or further explanation in the text.
The proposed bifurcation of the cyst cells into head and tail populations is interesting and worth further exploration/validation. While the presented in situ hybridization for Nep4, geko, and shg hint at differences between these populations, double fluorescent in situs or the use of additional markers would help make this point clearer. Higher magnification images would also help in this regard.
-
Reviewer #2 (Public Review):
In this manuscript the authors explain in greater detail a recent testis snRNAseq dataset that many of these authors published earlier this year as part of the Fly Cell Atlas (FCA) Li et al. Science 2022. As part of the current effort additional collaborators were recruited and about 6,000 whole cell scRNAseq cells were added to the previous 42,000 nuclei dataset. The authors now describe 65 snRNseq clusters, each representing potential cell types or cell states, including 43 germline clusters and 22 somatic clusters. The authors state that this analysis confirms and extends previously knowledge of the testis in several important areas.
However, in areas where testis biology is well studied, such as the development of germ cells from GSC to the onset of spermatocyte differentiation, the resolution seems less …
Reviewer #2 (Public Review):
In this manuscript the authors explain in greater detail a recent testis snRNAseq dataset that many of these authors published earlier this year as part of the Fly Cell Atlas (FCA) Li et al. Science 2022. As part of the current effort additional collaborators were recruited and about 6,000 whole cell scRNAseq cells were added to the previous 42,000 nuclei dataset. The authors now describe 65 snRNseq clusters, each representing potential cell types or cell states, including 43 germline clusters and 22 somatic clusters. The authors state that this analysis confirms and extends previously knowledge of the testis in several important areas.
However, in areas where testis biology is well studied, such as the development of germ cells from GSC to the onset of spermatocyte differentiation, the resolution seems less than current knowledge by considerable margins. No clusters correspond to GSCs, or specific mitotic spermatogonia, and even the major stages of meiotic prophase are not resolved. Instead, the transitions between one state and the next are broad and almost continuous, which could be an intrinsic characteristic of the testis compared to other tissues, of snRNAseq compared to scRNAseq, or of the particular experimental and software analysis choices that were used in this study.
A goal of the study was to identify new rare cell types, and the hub, a small apical somatic cell region, was mentioned as a target region, since it regulates both stem cell populations, GSCs and CySCs, is capable of regeneration, and other fascinating properties. However the analysis of the hub cluster revealed more problems of specificity. 41 or 120 cells in the cluster were discordant with the remaining 79 which did express markers consistent with previous studies. Why these cells co-clustered was not explained and one can only presume that similar problems may be found in other clusters. Indeed, many other indications of specificity issues were described, including contamination of fat body with spermatocytes, the expression of germline genes such as Vasa in many somatic cell clusters like muscle, hemocytes, and male gonad epithelium, and the promiscuous expression of many genes, including 25% of somatic-specific transcription factors, in mid to late spermatocytes. The expression of only one such genes, Hml, was documented in tissue, and the authors for reasons not explained did not attempt to decisively address whether this phenomenon is biologically meaningful.
A truly interesting question mentioned by the authors is why the testis consistently ranks near the top of all tissues in the complexity of its gene expression. In the Li et al. (2022) paper it was suggested that this is due an inherently greater biological complexity of spermiogenesis than other tissues. It seems difficult to independently and rationally determine "biological complexity," but if a conserved characteristic of testis was to promiscuously express a wide range of (random?) genes, something not out of the question, this would be highly relevant and important.
Unfortunately, the most likely problems are simply technical. Drosophila cells are small and difficult to separate as intact cells. The use of nuclei was meant to overcome this inherent problem, but the effectiveness of this new approach is not yet well-documented. Support for the view that the problems are mostly technical, rather than a reflection of testis biology, comes from studies of scRNAseq in the mouse, where it has been possible to resolve a stem cell cluster, and germ cell pathways that follow known germ cell differentiation trajectories with much more discrete steps than were reported here (for example, Cao et al. 2021 cited by the authors).
The conclusions that were made by the authors seem to either be facts that are already well known, such as the problem that transcriptional changes in spermatocytes will be obscured by the large stored mRNA pool, or promises of future utility. For example, "mining the snRNA-seq data for changes in gene expression as one cluster advances to the next should identify new sub-stage-specific markers." If worthwhile new markers could be identified from these data, surely this could have been accomplished and presented in a supplemental Table. As it currently stands, the manuscript presents the dataset including a fair description of its current limitations, but very little else of novel biological interest is to be found.
In sum, this project represents an extremely worthwhile undertaking that will eventually pay off. However, some currently unappreciated technical issues, in cell/nuclear isolation, and certainly in the bioinformatic programs and procedures used that mis-clustered many different cells, has created the current difficulties. Most scRNAseq software is written to meet the needs of mammalian researchers working with cultured cells, cellular giants compared to Drosophila and of generally similar size. Such software may not be idea for much smaller cells, but which also include the much wider variation in cell size, properties and biological mechanisms that exist in the world of tissues.
-
Reviewer #3 (Public Review):
In this study, the authors use recently published single nucleus RNA sequencing data and a newly generated single cell RNA sequencing dataset to determine the transcriptional profiles of the different cell types in the Drosophila ovary. Their analysis of the data and experimental validation of key findings provide new insight into testis biology and create a resource for the community. The manuscript is clearly written, the data provide strong support for the conclusions, and the analysis is rigorous. Indeed, this manuscript serves as a case study demonstrating best practices in the analysis of this type of genomics data and the many types of predictions that can be made from a deep dive into the data. Researchers who are studying the testis will find many starting points for new projects suggested by this …
Reviewer #3 (Public Review):
In this study, the authors use recently published single nucleus RNA sequencing data and a newly generated single cell RNA sequencing dataset to determine the transcriptional profiles of the different cell types in the Drosophila ovary. Their analysis of the data and experimental validation of key findings provide new insight into testis biology and create a resource for the community. The manuscript is clearly written, the data provide strong support for the conclusions, and the analysis is rigorous. Indeed, this manuscript serves as a case study demonstrating best practices in the analysis of this type of genomics data and the many types of predictions that can be made from a deep dive into the data. Researchers who are studying the testis will find many starting points for new projects suggested by this work, and the insightful comparison of methods, such as between slingshot and Monocle3 and single cell vs single nucleus sequencing will be of interest beyond the study of the Drosophila testis.
-
Reviewer #4 (Public Review):
This is an extraordinary study that will serve as key resource for all researchers in the field of Drosophila testis development. The lineages that derive from the germline stem cells and somatic stem cells are described in a detail that has not been previously achieved. The RNAseq approaches have permitted the description of cell states that have not been inferred from morphological analyses, although it is the combination of RNAseq and morphological studies that makes this study exceptional. The field will now have a good understanding of interactions between specific cell states in the somatic lineage with specific states in the germ cell lineage. This resource will permit future studies on precise mechanisms of communication between these lineages during the differentiation process, and will serve as a …
Reviewer #4 (Public Review):
This is an extraordinary study that will serve as key resource for all researchers in the field of Drosophila testis development. The lineages that derive from the germline stem cells and somatic stem cells are described in a detail that has not been previously achieved. The RNAseq approaches have permitted the description of cell states that have not been inferred from morphological analyses, although it is the combination of RNAseq and morphological studies that makes this study exceptional. The field will now have a good understanding of interactions between specific cell states in the somatic lineage with specific states in the germ cell lineage. This resource will permit future studies on precise mechanisms of communication between these lineages during the differentiation process, and will serve as a model for studies of co-differentiation in other stem cell systems. The combination of snRNAseq and scRNAseq has conclusively shown differences in transcriptional activation and RNA storage at specific stages of germ cell differentiation and is a unique study that will inform other studies of cell differentiation.
Could the authors please describe whether genes on the Y chromosome are expressed outside of the male germline. For example, what is represented by the spots of expression within the seminal vesicle observed in Figure 3D?
I would appreciate some discussion of the "somatic factors" that are observed to be upregulated in spermatocytes (e.g. Mhc, Hml, grh, Syt1). Is there any indication of functional significance of any of these factors in spermatocytes?
In the discussion of cyst cell lineage differentiation following cluster 74 the authors state that neither the HCC or TCC lineages were enriched for eya (Figure 6V). It seems in this panel that cluster 57 shows some enrichment for eya - is this regarded as too low expression to be considered enriched?
-
