Phenome-wide Mendelian randomization study of plasma triglyceride levels and 2600 disease traits
Curation statements for this article:-
Curated by eLife

eLife assessment
This manuscript will be of interest to cardiovascular clinicians, medical geneticists, pharmaceutical companies, and the general cardiovascular disease research community. The study adds evidence for the causal role of triglyceride to several atherosclerotic cardiovascular diseases. Their use of Mendelian Randomization method is appropriate and provides convincing support to their findings, which may provide insights on the mechanism of TG biology and drug repurposing of TG-lowering agents.
This article has been Reviewed by the following groups
Discuss this preprint
Start a discussion What are Sciety discussions?Listed in
- Evaluated articles (eLife)
Abstract
Causality between plasma triglyceride (TG) levels and atherosclerotic cardiovascular disease (ASCVD) risk remains controversial despite more than four decades of study and two recent landmark trials, STRENGTH, and REDUCE-IT. Further unclear is the association between TG levels and non-atherosclerotic diseases across organ systems.
Methods:
Here, we conducted a phenome-wide, two-sample Mendelian randomization (MR) analysis using inverse-variance weighted (IVW) regression to systematically infer the causal effects of plasma TG levels on 2600 disease traits in the European ancestry population of UK Biobank. For replication, we externally tested 221 nominally significant associations (p<0.05) in an independent cohort from FinnGen. To account for potential horizontal pleiotropy and the influence of invalid instrumental variables, we performed sensitivity analyses using MR-Egger regression, weighted median estimator, and MR-PRESSO. Finally, we used multivariable MR (MVMR) controlling for correlated lipid fractions to distinguish the independent effect of plasma TG levels.
Results:
Our results identified seven disease traits reaching Bonferroni-corrected significance in both the discovery (p<1.92 × 10 -5 ) and replication analyses (p<2.26 × 10 -4 ), suggesting a causal relationship between plasma TG levels and ASCVDs, including coronary artery disease (OR 1.33, 95% CI 1.24–1.43, p=2.47 × 10 -13 ). We also identified 12 disease traits that were Bonferroni-significant in the discovery or replication analysis and at least nominally significant in the other analysis (p<0.05), identifying plasma TG levels as a novel potential risk factor for nine non-ASCVD diseases, including uterine leiomyoma (OR 1.19, 95% CI 1.10–1.29, p=1.17 × 10 -5 ).
Conclusions:
Taking a phenome-wide, two-sample MR approach, we identified causal associations between plasma TG levels and 19 disease traits across organ systems. Our findings suggest unrealized drug repurposing opportunities or adverse effects related to approved and emerging TG-lowering agents, as well as mechanistic insights for future studies.
Funding:
RD is supported by the National Institute of General Medical Sciences of the National Institutes of Health (NIH) (R35-GM124836) and the National Heart, Lung, and Blood Institute of the NIH (R01-HL139865 and R01-HL155915).
Article activity feed
-

-

Author Response
Reviewer #1 (Public Review):
Causality is important and desired but usually difficult to establish. In this work, Park et al. conducted a comprehensive phenome-wide, two-sample Mendelian randomization analysis to infer the casual effects of plasma triglyceride (TG) levels on 2,600 disease traits. They identified causal associations between plasma TG levels and 19 disease traits, related to both atherosclerotic cardiovascular diseases (ASCVD) and non-ASCVD diseases. They used biobank-scale data in both discovery analysis and replication analysis.
The conclusions of this work are mostly supported by the data and analysis, but some aspects need to be clarified and extended.
(1) The datasets used in this study may not be very consistent. For example, UKB participants are aged 40-69 years old at recruitment. In …
Author Response
Reviewer #1 (Public Review):
Causality is important and desired but usually difficult to establish. In this work, Park et al. conducted a comprehensive phenome-wide, two-sample Mendelian randomization analysis to infer the casual effects of plasma triglyceride (TG) levels on 2,600 disease traits. They identified causal associations between plasma TG levels and 19 disease traits, related to both atherosclerotic cardiovascular diseases (ASCVD) and non-ASCVD diseases. They used biobank-scale data in both discovery analysis and replication analysis.
The conclusions of this work are mostly supported by the data and analysis, but some aspects need to be clarified and extended.
(1) The datasets used in this study may not be very consistent. For example, UKB participants are aged 40-69 years old at recruitment. In addition, UKB is United Kingdom-based and FinnGen is Finland-based. So the definition of outcomes may not be identical. The authors should discuss the differences between the datasets and their potential effects.
The reviewer is correct about the differences between UKB and FinnGen and that the definition of clinical outcomes between the two datasets may not be identical due to differences in healthcare systems and population demographics. We now mention this in the discussion section as a potential limitation.
Manuscript changes:
Line 520-539: “Third, UKB and FinnGen have innate differences in participant demographics and medical coding systems, due in part to the former being based in the United Kingdom and the latter in Finland. As such, potential misclassification of participants in case-control assignment is a liability to this study. We exercised caution in mapping UKB traits to FinnGen traits, but we were unable to reliably map all “categorical” traits from UKB to corresponding traits in FinnGen, testing for replication only 221 of the 598 associations that were nominally significant in the primary analysis. We note however that, despite geographical differences, both datasets largely involve White European participants of older age, with the mean age in UKB and FinnGen being 56.5 and 59.8, respectively.”
(2) The discovery analysis and replication analysis are not completely independent because data from UKB have been used in both analyses. Although in discovery, the data were used for association with outcomes; while in replication, the data were used for association with exposure. The authors may want to explain if this may cause problems.
The reviewer is correct that UKB data were used in both the discovery and replication analyses with the caveat that the discovery analysis used UKB for outcomes while using GLGC for exposures, whereas the replication analysis used UKB for exposures while using FinnGen for outcomes. We believed this would be a creative use of three different datasets and a strength of the study; however, we agree that examining the implications of this study design is needed to acknowledge potential biases. We now expand on this in the discussion section as a potential limitation.
Manuscript changes:
Lines 539-545: “Fourth, discovery and replication analyses were not completely independent, since UKB data were used in both analyses. This could potentially exacerbate demographic and measurement biases inherent to UKB; however, we show that taking a traditional replication approach using GLGC instead of UKB for selecting exposure instruments in replication returns comparable Tier 1 results (Supplementary Files 5), while losing statistical power to highlight many of the Tier 2 and 3 results.”
(3) As stated in the manuscript, there are three assumptions for MR analysis. The validity of the results depends on the validity of the assumptions. The last two assumptions are usually difficult to validate. To the authors' credit, they conducted sensitivity analyses addressing horizontal pleiotropy, which is related to assumption 3. It would be helpful if the authors can discuss those assumptions explicitly.
We now explicitly state the assumptions of Mendelian randomization in the introduction section and discuss the validity of these assumptions in the discussion section.
Manuscript changes:
Lines 501-514: “The study has several limitations. First, MR is a powerful but potentially fallible method that relies on several key assumptions, namely that genetic instruments are (i) associated with the exposure (the relevance assumption); (ii) have no common cause with the outcome (the independence assumption); and (iii) have effects on the outcome solely through the exposure (the exclusion restriction assumption) (Hartwig et al., 2016). In MR, (i) is relatively straightforward to test, while (ii) and (iii) are difficult to establish unequivocally. As a prominent example, horizontal or type I pleiotropy has been shown to be common in genetic variation, which can bias MR estimates (Verbanck et al., 2018) (Jordan et al., 2019). This occurs when a genetic instrument is associated with multiple traits other than the outcome of interest. To detect and correct for this as best as possible, we used various MR tests as sensitivity analyses that each aim to adjust for or account for the presence of horizontal pleiotropy, including MR-PRESSO, as well as MR-Egger and weighted median methods. There is no universally accepted method that is perfectly robust to horizontal pleiotropy, but we take the best current approach by using multiple methods and examining the consistency of results.”
Reviewer #2 (Public Review):
This work conducted a Mendelian randomization analysis between TG and a large number of disease traits in biobanks. They leverage the publicly available summary statistics from the European samples from the UK Biobank and FinnGen. A solid but routine standard summary-statistics based MR study is conducted. Several significant causal associations from TG to phenotypes are called by setting p-value cutoff with some Bonferroni correction. Sensitivity statistical analyses are conducted which generate largely consistent results. The research problem is important and relevant for public health as well we drug development. Overall this is a solid execution of current methods over appropriate data source and yields a convincing result. The interpretation of the results in discussion is also well-balanced.
While the paper does have strengths in principle, a few technical weaknesses are observed.
They used UK Biobank as the discovery and FinnGen as the replication. But the two cohorts are rather used symmetrically. Especially for the Tier 3 (NB), it seems to be an attempt of reusing the replication cohort as the discovery. I wonder if that would create additional multiple testing burden as a greater number of hypotheses are considered.
We thank the reviewer for this thought-provoking comment. As the reviewer is aware, MR studies have generally not accounted for multiple testing in the past since they have usually focused on single exposures and/or single diseases. Ours is among one of the more unique MR studies taking a phenome-wide, high-throughput approach, so determining the optimal threshold for balancing true-positive vs. false-positive discovery is an important aspect of the study warranting discussion.
We agree that Tier 3 results carry the least stringent level of statistical evidence (i.e., nominally significant in discovery using UK Biobank and Bonferroni-significant in replication using FinnGen), and that these results should be interpreted with caution. As a phenome-wide study, a significant aim of this work was to generate hypotheses, and so, we decided to present our results using the three tiers of statistical evidence to highlight as many promising associations as possible for further investigation. Nevertheless, we now express extra caution in the results and discussion sections regarding Tier 2 and 3 results, and we also note as a limitation that these results especially require external replication.
Manuscript changes:
Lines 438-444: “Regarding non-ASCVDs, we present suggestive genetic evidence of potentially causal associations between plasma TG levels and uterine leiomyomas (uterine fibroids), diverticular disease of intestine, paroxysmal tachycardia, hemorrhage from respiratory passages (hemoptysis), and calculus of kidney and ureter (kidney stones). Due to the weaker statistical evidence supporting these associations, special caution is encouraged when interpreting these results to infer causality, and further replication and validation studies are essential for all Tier 2 and Tier 3 results.”
The replication p-value cutoff is a bit statistically lenient. In a typical discovery-replication setting the two stages are conducted sequentially and replication should go through the Bonferroni adjustment on the number of significant signals from discovery that is tested in the replication. For example, in this case, in tier 2, the cutoff should be 0.05/39. This may make the association of leiomyoma of the uterus slightly non-significant though. Similar cutoff should be applied to tier 3 as well.
We thank the Reviewer for highlighting this important point. We agree that in a standard two-stage discovery and replication study design, the Bonferroni adjustment should be based on the number of significant signals from discovery that is tested in the replication. We had initially considered this approach but chose the current tiered approach based on a number of factors:
First, we had initially considered performing a standard meta-analysis between UK Biobank and FinnGen datasets and using the Bonferroni adjustment of the total number of tests. However, it was not possible to reliably map the phenotypes between UK Biobank and FinnGen on a large-scale due to different classification schemes.
Second, we had noticed that if we only focus on the sequential two-stage design, then we would be ignoring strong causal relationships observed in FinnGen that passed Bonferroni adjustment but may only be nominally associated in UK Biobank. Although not as strong as Tier 1 findings, we believe that these findings warranted some consideration. This is particularly relevant since differences in the strength of the causal relationship could be attributed to the different populations studied, sample size, different health systems used to measure disease outcomes, differences in statistical power in the MR tests between the two stages (e.g., number of IVs), amongst others.
Third, we wanted to point out that the total adjustment for number of phenotypes tested using Bonferroni is a very conservative adjustment because the multiple EHR phenotypes have varying degrees of redundancy and correlation. We believe the appropriate Bonferroni-adjusted P-value cutoff is somewhere in between the Bonferroni adjustment of total number of phenotypes, and the nominal P-value (no adjustment for number of phenotypes).
Although somewhat unconventional, we came up with this tiered P-value approach to overcome the points mentioned above. We have now included text to further explain our approach and to mention that tier 2 and tier 3 results require further replication and validation.
Manuscript changes:
Lines 266-283: “This presentation is somewhat unconventional and partly arises from the study’s use of three different datasets for instrument selection. In a traditional two-stage discovery and replication design, Bonferroni adjustment is based on the number of significant signals from discovery that is tested in replication. Here, we used three tiers of statistical evidence to present results because a standard meta-analysis between UKB and FinnGen was not possible, given it was not possible to reliably map all phenotypes between the two datasets. Additionally, Bonferroni-significant results in the replication analysis would have been ignored in FinnGen in a sequential two-stage design if they were also only nominally associated in UKB. The three tiers are defined below:”
Lines 441-444: “Due to the weaker statistical evidence supporting these associations, special caution is encouraged when interpreting these results to infer causality, and further replication and validation studies are essential for all Tier 2 and Tier 3 results.”
Lines 498-500: “However, we reiterate that this Tier 3 association was only nominally significant in discovery, while Bonferroni-significant in replication, and future studies are needed to validate the statistical evidence.”
Lines 565-567: “However, caution is still warranted in inferring causality, as MR depends on specific assumptions and the validity of those assumptions must be carefully assessed. Thus, diverse study designs remain necessary to triangulate evidence on the causal effects of plasma TG levels.”
The causal effect of TG to leiomyoma of the uterus is weak, as indicated by both the sub-significant in the replication and the non-significant of MR-PRESSO. Similarly, I would recommend more caution on the weak statistical rigor when interpreting Tier 2 and Tier 3 results.
We agree with the Reviewer. We have now emphasized more caution in interpreting Tier 2 and Tier 3 results. We have also explicitly restated the weaker statistical evidence underlying these results and noted need for future validation. Please see our detailed response to the Comment above.
Manuscript changes:
Lines 498-500: “However, we reiterate that this Tier 3 association was only nominally significant in discovery, while Bonferroni-significant in replication, and future studies are needed to validate the statistical evidence.”
Another methodological choice that might need justification is the use of UKB TG GWAS loci (1,248 SNPs) are the instrument for FinnGen. This may create some subtle interference with the use of UKB as outcomes in the discovery analysis. It may be minor but some justification or at least some discussions of potential limitations should be mentioned. What about the alternative of using GLGC as instruments in replication?
We agree with the reviewer that the use of UKB TG GWAS loci (1,248 SNPs) as instruments for FinnGen outcomes needs additional justification. We now detail this decision in the text as copied below.
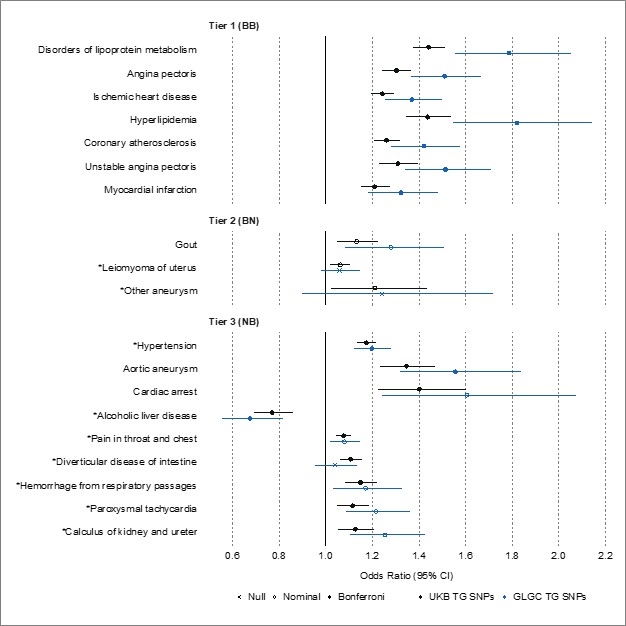
Additionally, we now present new data comparing MR results on FinnGen outcomes when selecting TG instruments from UKB GWAS versus GLGC GWAS. Statistical significance after Bonferroni correction was set to 0.05/221, where 221 was the number of disease traits nominally significant in UKB that were tested in FinnGen. We note that the results were fairly consistent. All Tier 1 results remained Bonferroni significant, whether using TG SNPs from UKB or GLGC. Though statistical significance decreased for the remaining diseases of interest, the direction of causality remained consistent, and three disease traits remained significant (hypertension, aortic aneurysm, and alcoholic liver disease). These results support that instrumenting TG using 1,248 SNPs from UKB might carry more power than the 141 SNPs from GLGC, allowing for the detection of associations in our initial replication analysis using UKB for exposures and FinnGen for outcomes. We now include this analysis in the text and include the figure below, as well as its underlying data, as supplementals (Supplementary File 5).
Manuscript changes:
Lines 229-236: “We selected UKB TG GWAS loci as the instruments for replication on FinnGen outcomes, rather than GLGC TG GWAS loci, to diversify the source of TG instruments and mitigate potential biases associated with one TG GWAS. Moreover, UKB GWAS included a larger study population than GLGC GWAS, providing a greater number of genetic instruments that can together explain more of the variance in plasma TG levels, and thus, greater statistical power and precision. Nevertheless, we also performed the replication analyses using TG instruments from GLGC and included these results as supplemental data (Supplementary File 5).”
For disease outcomes (line 188), UKB European sample size is ~400,000 rather than ~500,000. Can the author clarify the sample size they used?
We thank the reviewer for catching this detail. We have now clarified the sample size of UKB European participants in the Methods section, and we also included the exact sample size of each disease trait GWAS (cases and controls) in Supplementary Figure 1.
Manuscript changes:
Lines 194-201: “Pan-UKB had performed 16,131 GWASs on 7,221 phenotypes in ~420,531 UKB participants of European ancestry using genetic and phenotypic data (PanUKBTeam, 2020). A total of 7,221 total phenotypes had been categorized as “biomarker”, “continuous”, “categorical”, “ICD-10 code”, “phecode”, or “prescription” (PanUKBTeam, 2020). We filtered for outcomes to retain categorical, ICD-10, and phecode types; non-null heritability in European ancestry as estimated by Pan-UKB; and relevance to disease, excluding medications. This yielded 2,600 traits for primary analysis. The exact sample size of each GWAS for each of these traits is provided in Supplementary File 1.”
It would be reassuring to the reader if the TG measurements were measured in a treatment-naïve manner. GLGC accounted for treatment (at least LDL, check paper for TGs; if they didn’t, there must be reason). Maybe not UKB.
We now provide information about whether the lipid measurements were measured in a treatment-naïve manner in the Methods for GLGC and UKB. We also address this point in the discussion section as a potential limitation.
Manuscript changes:
Lines 179-180: “We note that the GLGC GWAS had excluded individuals known to be on lipid-lowering medications.”
Lines 187-188: “We note that the Pan-UKB GWAS study did not exclude participants based on their use of lipid-lowering medications.”
Lines 545-546: “Fifth, the GLGC GWAS used to select instruments for plasma TG levels in discovery had accounted for lipid-lowering treatment, while the UKB GWAS used in replication had not.”
"Phenome-wide MR is a high-throughput extension of MR that, under specific assumptions, estimates the causal effects of an exposure on multiple outcomes simultaneously." - I guess it is more informative to mention the specific assumptions, at least briefly, in the introduction so it is easier for the reader to interpret the results.
We agree with the reviewer that it would be informative to explicitly state the assumptions of Mendelian randomization. We now explicitly state these assumptions in the introduction.
Manuscript changes:
Lines 123-129: “Phenome-wide MR is a high-throughput extension of MR that estimates the causal effects of an exposure on multiple outcomes simultaneously. As in conventional MR, this method uses genetic variants as instrumental variables (IV) to proxy modifiable exposures (Davey Smith & Ebrahim, 2003), and importantly, it relies on three critical assumptions: (1) The genetic variant is directly associated with the exposure; (2) The genetic variant is unrelated to confounders between the exposure and outcome; and (3) The genetic variant has no effect on the outcome other than through the exposure (Davey Smith & Ebrahim, 2003).”
Reviewer #3 (Public Review):
Park and Bafna et al. applied a genetics-based epidemiological approach, the Mendelian randomization analysis (MR), to evaluate the potential causal roles of triglycerides across 2,600 disease traits (i.e., the phenome). In a typical two-sample MR framework, they utilized existing genome-wide association study (GWAS) summary statistics from two separate studies. They are Global Lipids Genetics Consortium (GLGC) and UK Biobank in the discovery analysis, and UK Biobank and FinnGen in the replication analysis. This replication design is a great strength of the study, enhancing the robustness and reproducibility of the results. For the candidate pairs of causal associations, the authors further perform multiple sensitivity analyses to evaluate the robustness of the results to possible violations of assumptions in MR. To disentangle the independent effects of triglycerides from other lipid fractions (i.e., LDL-cholesterol and HDL-cholesterol), the authors performed multivariable MR analysis. In the end, possible causal associations were revealed in three tiers, based on statistical significance in the two-stage analysis. The results support the causal effects of triglycerides in increasing the risk of atherosclerotic cardiovascular disease. They also reveal novel conditions, which are either new treatable conditions (e.g., leiomyoma, hypertension, calculus of kidney and ureter) for repurposing of triglycerides-lowering drug, or possible side effects (e.g., alcoholic liver disease) the triglyceride-lowering treatment should pay special attention to.
The analysis approaches in the paper are standard and solid. The discovery-replication study design is a great strength. Correction for multiple testing was implemented in a conservative way. The sensitivity analyses and MVMR strengthen the robustness of the results. The manuscript is very clearly written and pleasant to read. The limitations were well-presented. The conclusions and interpretations are mostly supported by the data, with one major concern as explained below. But overall, in addition to the specific findings, this study could be an exemplar study for the use of phenome-wide MR in identifying treatable conditions and side effects for most existing drugs.
- My major concern is about reverse causation. For example, having atherosclerotic cardiovascular disease increases circulating triglycerides. Reverse causation can induce false positives in MR analysis. With the existing data in this study, the authors can perform a reverse MR to evaluate the effect of the 19 disease traits on triglycerides. Ruling out the presence of reserve causation is important to make sure that the current findings are not false positives.
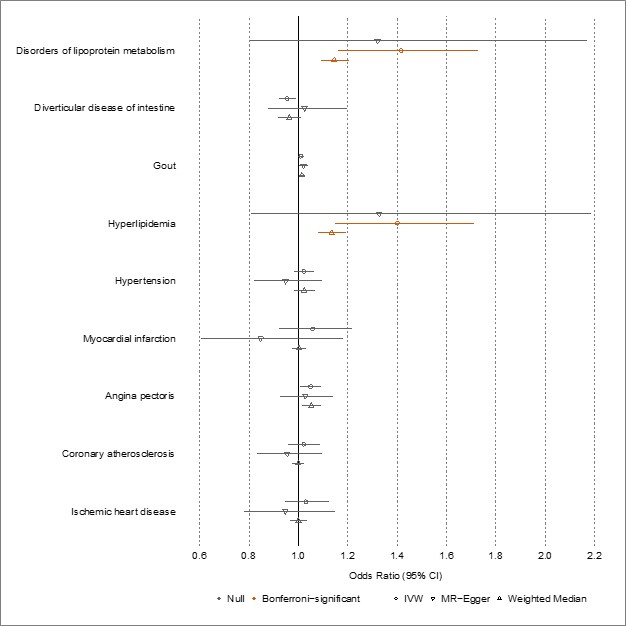
We agree with the reviewer that performing reverse MR would be important to rule out reverse causation. We now present new results using reverse MR, selecting instruments for disease from UKB and instruments for TG from GLGC (i.e., reversing the discovery analysis). We provide an interpretation of these new results in the discussion section and present the underlying data, including the number of genetic variants used, in Supplementary File 6. Please note we could only perform reverse MR on 9 of the 19 diseases of interest, due to insufficient genetic data in GLGC to extract the specific exposure instruments. As expected, we observed significant associations (orange) between “disorders of lipoprotein metabolism” and “hyperlipidemia” with plasma TG levels; however, all other estimates were non-significant, suggesting unidirectional associations for the remaining seven disease traits. We now include the figure below and its underlying data as supplements (Supplementary File 6).
Manuscript changes:
Lines 258-261 “Finally, we performed bidirectional or reverse MR on significant results to examine the potential presence of reverse causation. We selected instruments for each disease as described above from Pan-UKB and instruments for plasma TG levels from GLGC, essentially reversing the discovery stage design using a fixed-effect IVW method.”
Lines 368-373: “Finally, we performed reverse MR to estimate the effects of significant disease traits on plasma TG levels, selecting instruments from UKB and GLGC, respectively. Genetic data were sufficiently available to perform this analysis for 9 of the 19 diseases of interest. These results are presented in Supplementary File 6. Expectedly, “disorders of lipoprotein metabolism” and “hyperlipidemia” had positive effects on plasma TG levels; however, no other examined disease trait showed results suggesting reverse causation.”
-
eLife assessment
This manuscript will be of interest to cardiovascular clinicians, medical geneticists, pharmaceutical companies, and the general cardiovascular disease research community. The study adds evidence for the causal role of triglyceride to several atherosclerotic cardiovascular diseases. Their use of Mendelian Randomization method is appropriate and provides convincing support to their findings, which may provide insights on the mechanism of TG biology and drug repurposing of TG-lowering agents.
-
Reviewer #1 (Public Review):
Causality is important and desired but usually difficult to establish. In this work, Park et al. conducted a comprehensive phenome-wide, two-sample Mendelian randomization analysis to infer the casual effects of plasma triglyceride (TG) levels on 2,600 disease traits. They identified causal associations between plasma TG levels and 19 disease traits, related to both atherosclerotic cardiovascular diseases (ASCVD) and non-ASCVD diseases. They used biobank-scale data in both discovery analysis and replication analysis.
The conclusions of this work are mostly supported by the data and analysis, but some aspects need to be clarified and extended.
(1) The datasets used in this study may not be very consistent. For example, UKB participants are aged 40-69 years old at recruitment. In addition, UKB is United …
Reviewer #1 (Public Review):
Causality is important and desired but usually difficult to establish. In this work, Park et al. conducted a comprehensive phenome-wide, two-sample Mendelian randomization analysis to infer the casual effects of plasma triglyceride (TG) levels on 2,600 disease traits. They identified causal associations between plasma TG levels and 19 disease traits, related to both atherosclerotic cardiovascular diseases (ASCVD) and non-ASCVD diseases. They used biobank-scale data in both discovery analysis and replication analysis.
The conclusions of this work are mostly supported by the data and analysis, but some aspects need to be clarified and extended.
(1) The datasets used in this study may not be very consistent. For example, UKB participants are aged 40-69 years old at recruitment. In addition, UKB is United Kingdom-based and FinnGen is Finland-based. So the definition of outcomes may not be identical. The authors should discuss the differences between the datasets and their potential effects.
(2) The discovery analysis and replication analysis are not completely independent because data from UKB have been used in both analyses. Although in discovery, the data were used for association with outcomes; while in replication, the data were used for association with exposure. The authors may want to explain if this may cause problems.
(3) As stated in the manuscript, there are three assumptions for MR analysis. The validity of the results depends on the validity of the assumptions. The last two assumptions are usually difficult to validate. To the authors' credit, they conducted sensitivity analyses addressing horizontal pleiotropy, which is related to assumption 3. It would be helpful if the authors can discuss those assumptions explicitly. -
Reviewer #2 (Public Review):
This work conducted a Mendelian randomization analysis between TG and a large number of disease traits in biobanks. They leverage the publicly available summary statistics from the European samples from the UK Biobank and FinnGen. A solid but routine standard summary-statistics based MR study is conducted. Several significant causal associations from TG to phenotypes are called by setting p-value cutoff with some Bonferroni correction. Sensitivity statistical analyses are conducted which generate largely consistent results. The research problem is important and relevant for public health as well we drug development. Overall this is a solid execution of current methods over appropriate data source and yields a convincing result. The interpretation of the results in discussion is also well-balanced.
While the …
Reviewer #2 (Public Review):
This work conducted a Mendelian randomization analysis between TG and a large number of disease traits in biobanks. They leverage the publicly available summary statistics from the European samples from the UK Biobank and FinnGen. A solid but routine standard summary-statistics based MR study is conducted. Several significant causal associations from TG to phenotypes are called by setting p-value cutoff with some Bonferroni correction. Sensitivity statistical analyses are conducted which generate largely consistent results. The research problem is important and relevant for public health as well we drug development. Overall this is a solid execution of current methods over appropriate data source and yields a convincing result. The interpretation of the results in discussion is also well-balanced.
While the paper does have strengths in principle, a few technical weaknesses are observed.
They used UK Biobank as the discovery and FinnGen as the replication. But the two cohorts are rather used symmetrically. Especially for the Tier 3 (NB), it seems to be an attempt of reusing the replication cohort as the discovery. I wonder if that would create additional multiple testing burden as a greater number of hypotheses are considered.
The replication p-value cutoff is a bit statistically lenient. In a typical discovery-replication setting the two stages are conducted sequentially and replication should go through the Bonferroni adjustment on the number of significant signals from discovery that is tested in the replication. For example, in this case, in tier 2, the cutoff should be 0.05/39. This may make the association of leiomyoma of the uterus slightly non-significant though. Similar cutoff should be applied to tier 3 as well.
The causal effect of TG to leiomyoma of the uterus is weak, as indicated by both the sub-significant in the replication and the non-significant of MR-PRESSO. Similarly, I would recommend more caution on the weak statistical rigor when interpreting Tier 2 and Tier 3 results.
Another methodological choice that might need justification is the use of UKB TG GWAS loci (1,248 SNPs) are the instrument for FinnGen. This may create some subtle interference with the use of UKB as outcomes in the discovery analysis. It may be minor but some justification or at least some discussions of potential limitations should be mentioned. What about the alternative of using GLGC as instruments in replication?
For disease outcomes (line 188), UKB European sample size is ~400,000 rather than ~500,000. Can the author clarify the sample size they used?
It would be reassuring to the reader if the TG measurements were measured in a treatment-naïve manner.
"Phenome-wide MR is a high-throughput extension of MR that, under specific assumptions, estimates the causal effects of an exposure on multiple outcomes simultaneously." - I guess it is more informative to mention the specific assumptions, at least briefly, in the introduction so it is easier for the reader to interpret the results.
-
Reviewer #3 (Public Review):
Park and Bafna et al. applied a genetics-based epidemiological approach, the Mendelian randomization analysis (MR), to evaluate the potential causal roles of triglycerides across 2,600 disease traits (i.e., the phenome). In a typical two-sample MR framework, they utilized existing genome-wide association study (GWAS) summary statistics from two separate studies. They are Global Lipids Genetics Consortium (GLGC) and UK Biobank in the discovery analysis, and UK Biobank and FinnGen in the replication analysis. This replication design is a great strength of the study, enhancing the robustness and reproducibility of the results. For the candidate pairs of causal associations, the authors further perform multiple sensitivity analyses to evaluate the robustness of the results to possible violations of assumptions …
Reviewer #3 (Public Review):
Park and Bafna et al. applied a genetics-based epidemiological approach, the Mendelian randomization analysis (MR), to evaluate the potential causal roles of triglycerides across 2,600 disease traits (i.e., the phenome). In a typical two-sample MR framework, they utilized existing genome-wide association study (GWAS) summary statistics from two separate studies. They are Global Lipids Genetics Consortium (GLGC) and UK Biobank in the discovery analysis, and UK Biobank and FinnGen in the replication analysis. This replication design is a great strength of the study, enhancing the robustness and reproducibility of the results. For the candidate pairs of causal associations, the authors further perform multiple sensitivity analyses to evaluate the robustness of the results to possible violations of assumptions in MR. To disentangle the independent effects of triglycerides from other lipid fractions (i.e., LDL-cholesterol and HDL-cholesterol), the authors performed multivariable MR analysis. In the end, possible causal associations were revealed in three tiers, based on statistical significance in the two-stage analysis. The results support the causal effects of triglycerides in increasing the risk of atherosclerotic cardiovascular disease. They also reveal novel conditions, which are either new treatable conditions (e.g., leiomyoma, hypertension, calculus of kidney and ureter) for repurposing of triglycerides-lowering drug, or possible side effects (e.g., alcoholic liver disease) the triglyceride-lowering treatment should pay special attention to.
The analysis approaches in the paper are standard and solid. The discovery-replication study design is a great strength. Correction for multiple testing was implemented in a conservative way. The sensitivity analyses and MVMR strengthen the robustness of the results. The manuscript is very clearly written and pleasant to read. The limitations were well-presented. The conclusions and interpretations are mostly supported by the data, with one major concern as explained below. But overall, in addition to the specific findings, this study could be an exemplar study for the use of phenome-wide MR in identifying treatable conditions and side effects for most existing drugs.
1. My major concern is about reverse causation. For example, having atherosclerotic cardiovascular disease increases circulating triglycerides. Reverse causation can induce false positives in MR analysis. With the existing data in this study, the authors can perform a reverse MR to evaluate the effect of the 19 disease traits on triglycerides. Ruling out the presence of reserve causation is important to make sure that the current findings are not false positives.
-
